Article

Structural Flexibility of the Monomeric Red Fluorescent Protein DsRed

College of General Education, Kookmin University, Seoul 02707, Republic of Korea
Crystals 2024, 14(1), 62; https://doi.org/10.3390/cryst14010062
Submission received: 11 December 2023 / Revised: 20 December 2023 / Accepted: 23 December 2023 / Published: 2 January 2024
(This article belongs to the Special Issue Crystallography of Enzymes)

Abstract

:
The monomeric red fluorescent protein DsRed (mDsRed) is widely used as an optical probe for multicolor applications in flow cytometry or fluorescence microscopy. Understanding the structure and dynamics of mDsRed provides fundamental information for its practical applications. The mDsRed crystal structure has been reported, but the structural dynamics have not been fully elucidated. Herein, the crystal structure of mDsRed was determined at 2.9 Å resolution, and the molecular flexibility was analyzed. mDsRed contains a solvent-accessible hole between the β7-strand and β9-α10 loop, which is connected to the chromophore. A partial disorder was present in the electron density map of the tyrosine-ring group of the mDsRed chromophore, indicating a flexible conformation of the chromophore. The refined mDsRed chromophore displayed a cis-conformation with a nonplanar configuration between the tyrosine and imidazoline rings of the chromophore. Temperature factor analysis indicated that the β-barrel fold of mDsRed is rigid, while the loops at the top and bottom of the β-barrel are relatively flexible. The β-barrel surface of mDsRed was closer to the native conformation compared with the previously reported Zn-bound state of mDsRed. These structural findings extend our understanding of the molecular flexibility of mDsRed.

1. Introduction

Fluorescent proteins (FPs) are widely used optical markers in molecular and cellular biology [1,2]. FPs are useful for tracking the target functions in research applications such as in Förster or fluorescence resonance energy transfer (FRET) [3,4], optogenetics [5], chemogenetics [6,7], subcellular localization [8], in vivo imaging [9,10], and genome editing [11]. FP-based metal biosensors and pH indicators are being developed, leveraging the high sensitivity of FPs and their fluorescence emission responsiveness to external stimuli, such as metal ions and pH [12,13].
Green FP-like proteins contain a β-barrel fold [14], and the chromophore comprises three amino acids that are posttranslationally modified [1,15,16,17]. The main optical characteristics of FPs are determined by the amino acid sequence of the chromophores and the amino acids surrounding the chromophores [1,18]. The typical FP chromophore can exhibit either cis- or trans-conformation, which undergoes a conformational change with a shift in environmental pH or during photoactivation [13,19,20,21,22].
Living tissues naturally exhibit lower absorbance and autofluorescence at longer wavelengths. This inherent property makes red fluorescent probes more useful for deep-tissue and whole-body imaging [23,24]. DsRed is a red FP derived from the reef coral Dendronephthya sp. [25]. DsRed is widely applied as a fluorescent marker in molecular and cell biology experiments as a reporter for gene expression [26] for monitoring genetically stable infectious clones [27], cell populations [28], and dual-color imaging for gene switching [29]. The original DsRed has a tetrameric oligomeric state with excitation and emission wavelengths of 558 and 583 nm, respectively [25]. The maximum extinction coefficient (EC), quantum yield (QY), and brightness of DsRed are 52,000 M−1 cm−1, 0.68, and 49.3 mM−1 cm−1, respectively [30]. The original DsRed was limited for use as a fusion tag because of the tetrameric formation in the solution. Additionally, tetrameric FPs pose experimental disadvantages, including slow maturation and challenges in FRET applications [31,32,33]. The maturation half-time of the tetrameric DsRed chromophore is 11 h [30]. To address this issue, monomeric protein was engineered, and 45 amino acids of the DsRed variant (DsRed.T4) were substituted to generate mDsRed [34]. The excitation and emission spectra of mDsRed are 557 and 592 nm, respectively, and the EC, QY, brightness, and maturation half-time of mDsRed are 27,300 M−1 cm−1, 0.14, 4 mM−1 cm−1, and 1.3 h (at 37 °C), respectively [34]. mDsRed is optimal for multicolor applications, such as flow cytometry or fluorescence microscopy [35]. mDsRed is a stable protein that allows fluorescence to be observed for an extended period and demonstrates excellent compatibility with mammalian cells [36]. The maximum fluorescence expression of mDsRed is achieved within a short time frame, enabling detection within 12 h after transfection [37]. mDsRed has been validated as a fusion tag for various proteins with diverse functions or distinct subcellular locations [37]. Intracellular detection is feasible, making mDsRed a highly useful noninvasive FP for studying various biological reactions within living cells [37]. Understanding the structure and dynamics of FPs is crucial for comprehending protein function and protein engineering to develop optically enhanced FPs. While the crystal structure of mDsRed has been determined, the structural dynamics of mDsRed are not fully elucidated. Consequently, obtaining structural information concerning the molecular mobility of mDsRed could potentially offer insights into both protein engineering and understanding the protein function.
In this study, the crystal structure of mDsRed was determined at 2.9 Å resolution using a new crystal form. The mDsRed chromophores exhibited previously unreported high flexibility, and their intrinsic molecular flexibility was comparatively analyzed. These structural analyses will extend our knowledge of the molecular flexibility of mDsRed and other FPs.

2. Materials and Methods

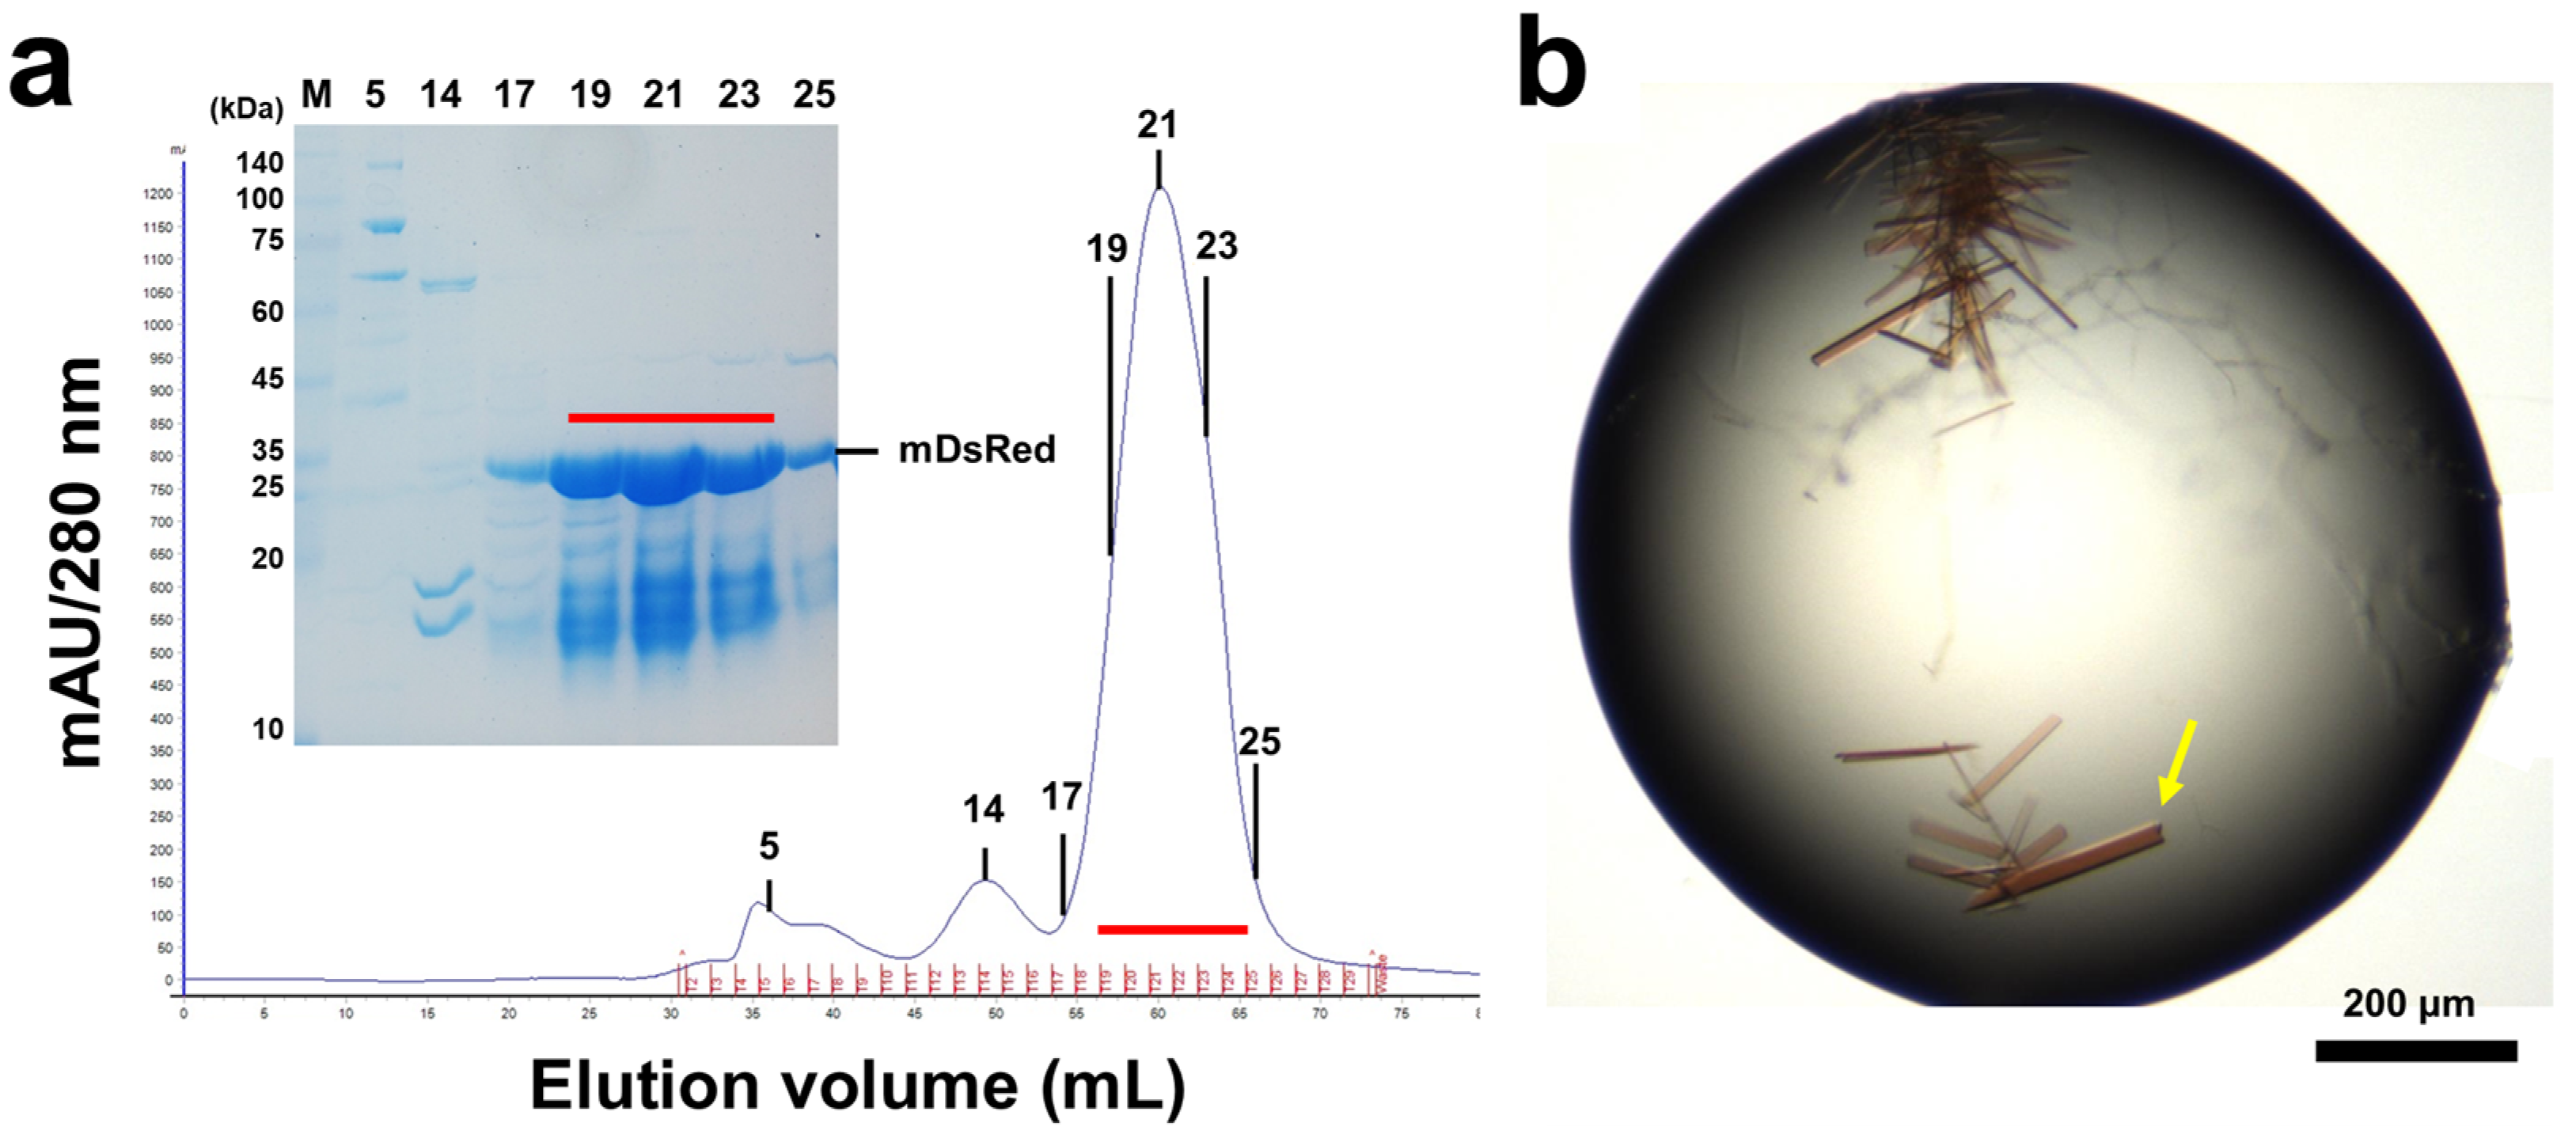
2.1. Sample Preparation

The pDsRed-Monomer vector containing an mDsRed gene was purchased from Takara (Catalog No. 632467, Shiga, Japan). The vector was transformed into Escherichia coli BL21(DE3), which was grown at 37 °C in LB broth containing 0.1 mg/mL ampicillin. Overexpression was induced by adding isopropyl β-D-thiogalactopyranoside to a final concentration of 0.5 mM at an OD600 of 0.5–0.6. Cells were incubated at 20 °C overnight at 180 rpm and then stored at 4 °C for 1 day. Cells were harvested by centrifugation at 4000 rpm, and the cell pellet was resuspended in 50 mM Tris–HCl, pH 8.0, and 200 mM NaCl. Cells were disrupted by sonication, and cell debris was removed by centrifugation at 13,000 rpm. The supernatant was heat-treated at 60 °C for 20 min, and the aggregated materials were removed via centrifugation at 13,000 rpm for 20 min. This heat treatment step was repeated three times. The supernatant was concentrated in a Centricon (Merck Millipore, Burlington, MA, USA) and loaded onto a HiPrep sephacryl S-100 column (GE Healthcare, Chicago, IL, USA) equilibrated with 10 mM Tris–HCl, pH 8.0 and 200 mM NaCl. Eluted protein was concentrated using Centricon (Merck Millipore) for crystallization.

2.2. Crystallization

Crystallization screens were performed via the sitting-drop vapor diffusion method at 18 °C. An mDsRed (20 mg/mL, 500 nL) solution was mixed with a reservoir solution (500 nL) from commercially available crystallization kits (Hampton Research, Aliso Viejo, CA, USA). mDsRed crystals suitable for X-ray diffraction were obtained under 0.1 M Bis-Tris, pH 5.5, 0.2 M magnesium chloride, and 25% (w/v) polyethylene glycol 3350. Rod-shaped mDsRed crystals were obtained within two months. The size of the mDsRed crystals used for diffraction data was approximately 10 × 25 × 200 μm3.

2.3. Diffraction Data Collection

X-ray diffraction data were collected at the 7C beamline at the Pohang Light Source II (PLS-II, Pohang, Republic of Korea) [38]. An mDsRed crystal was immersed in the cryoprotectant solution containing the reservoir solution supplemented with 20% (v/v) glycerol for 10 s. Data collection was performed under a liquid nitrogen stream at 100 K. Diffraction data were recorded on a Pilatus 6M detector (DECTRIS, Baden, Switzerland). Diffraction data were indexed, integrated, and scaled with the HKL2000 [39] program.

2.4. Structure Determination

The phasing problem was solved via the molecular replacement method with MOLREP (version 11.2.08) [40]. The crystal structure of DsRed (PDB code: 2VAD) [34] was used as the search model. The model structure building was performed using COOT (version 0.9.6) [41]. The final model structure was refined with REFMAC5 (version 5.8.0267) [42]. The validation of the structure model was performed with the MolProbity [43] programs. The structure was visualized with PyMOL (version 2.4.1.) (http://pymol.org, (accessed on 11 December 2023)). The interface between two mDsRed molecules in the asymmetric unit was analyzed using the PDBePISA server [44]. The structure factor and coordinate were deposited in the protein data bank (http://rcsb.org) under accession code 8WGP.

3. Results

3.1. Structure Determination

The mDsRed gene used in this study was human codon-optimized for high expression in mammalian cells. Nevertheless, this protein was overexpressed in E. coli. The mDsRed gene did not contain an expression tag for purification, such as a hexahistidine or glutathione S-transferase tag.
FPs exhibit a stable β-barrel structure, making them highly thermostable with a high melting temperature [45]. Capitalizing on this physical property, heat treatment is often employed during FP purification to denature and remove E. coli-derived proteins that are relatively less heat-stable [46,47]. Therefore, we employed heat treatment to enhance the purity of recombinant mDsRed by eliminating undesired E. coli-derived proteins. After three heat treatments, the supernatant was concentrated and loaded onto a size-exclusion column. The primary peak, which contained mDsRed, was eluted as a monomer (Figure 1a). Larger-sized proteins than mDsRed were effectively removed in the main peak fractions (fraction Nos. 19–23) through the gel filtration column. Meanwhile, proteins smaller than mDsRed were eluted together with mDsRed (Figure 1a). The purity of mDsRed in the fractions used for crystallization was approximately 70–80% (Figure 1a).
mDsRed microcrystals were obtained under the following three crystallization conditions: (i) 0.1 M Bis-Tris, pH 5.5, 0.2 M magnesium chloride, and 25% (w/v) polyethylene glycol 3350; (ii) 0.2 M ammonium sulfate and 20% (w/v) polyethylene glycol 3350; and (iii) 8% (v/v) tacsimateTM, pH 4.0, and 20% (w/v) polyethylene glycol 3350. mDsRed crystals suitable for X-ray diffraction were obtained under condition (i) (Figure 1b). However, the size of microcrystals grown under conditions (ii) and (iii) did not improve the collection of diffraction data (see discussion). Thus, crystals grown under crystallization condition (i) were used to determine the crystal structure of mDsRed.
The mDsRed crystal belonged to the monoclinic space group P21 with cell dimensions of a = 39.56 Å, b = 107.00 Å, and c = 50.02 Å and β = 104.86° (Table 1). Two mDsRed molecules occupied an asymmetric unit. This crystal form is different from the previously determined crystal structure of mDsRed (PDB code: 2VAD), which has an orthorhombic space group P212121, with cell a = 38.89 Å, b = 62.15 Å, and c = 81.88 Å, and one molecule in the asymmetric unit [34]. These different crystal forms of mDsRed show different molecular flexibility due to crystal packing (see below).

3.2. Crystal Structure of mDsRed

The mDsRed structure was determined at 2.9 Å resolution with an Rwork and Rfree of 19.66 and 24.21, respectively (Table 1). mDsRed exhibits a typical β-barrel fold containing the chromophore, which comprises the Gln66-Tyr67-Gly68 tripeptide through posttranslational modification (Figure 2a). The electron density map of mDsRed was well-defined for most amino acids, excluding those in the chromophore (See below). In the asymmetric unit, the two mDsRed molecules interacted with approximately 7% of the buried surface (~690 Å2) (Table S1). The interface of two mDsRed molecules was stabilized by eight hydrogen bonds (Lys166-Asp200 (molecule A-B], Lys166-Ile201, Asp169-Glu206, Gly170-His204, Asp200-Lys166, Asp200-Lys198, His204-Gly170, and Gly223-Lys36) and four salt bridge (Lys166-Asp200, Asp200-Lys166, Asp200-Lys198, and Gly223-Lys36) interactions (Table S2). The interaction interface between the two mDsRed molecules differs from the assembly of tetrameric DsRed. This result indicates that the two DsRed molecules within the asymmetric unit interact via crystal packing and not through an oligomeric state, which is consistent with the gel filtration results (Figure 1a). Superimposition of the two mDsRed molecules in the asymmetric unit showed a similarity with a root-mean-square deviation (RMSD) of 0.299 Å, and superimposition of the mDsRed structures with the previously reported mDsRed (PDB code: 2VAD) showed a similarity with an RMSD of 0.373–0.357 Å. Thus, the overall conformation of mDsRed is similar, although the chromophore and the conformation of side chains on the β-barrel surface are distinct (see below).
Surface structure analysis showed that no solvent-accessible space was found in mDsRed-A (Supplementary Figure S1), whereas in mDsRed-B, a hole with an approximate 3.80-Å diameter was found between Gly142 on the β7-strand and Asp200 on the loop between the β9- and β10-strands (Figure 2b). This hole is located downward on the chromophore tyrosine, approximately 8.16 Å away from the hydroxyl group of the tyrosine ring. In the previously determined mDsRed-2VAD, a hole with an approximate 2.68-Å diameter is also observed between the β7-strand and the β9-β10 loop (Figure 2b). However, the hole location in mDsRed-2VAD is between Lys198 and Gly144, unlike that in mDsRed-B. The hole in mDsRed-2VAD lies parallel to the chromophore tyrosine and is approximately 6.08 Å away from the hydroxyl group of the tyrosine ring in the chromophore. These structural results reveal that a small difference in conformation between the β7-strand and the β9-β10 loop of mDsRed can create a hole large enough for solvent access to the chromophore. The hole can be formed between Gly144-Lys198 and Gly142-Asp200. Since the hole is proximate to the hydroxyl group of the chromophore tyrosine ring, which is involved in the protonation and deprotonation of the chromophore, this region is tentatively considered to be directly influenced by the external environment, which could affect spectral properties.

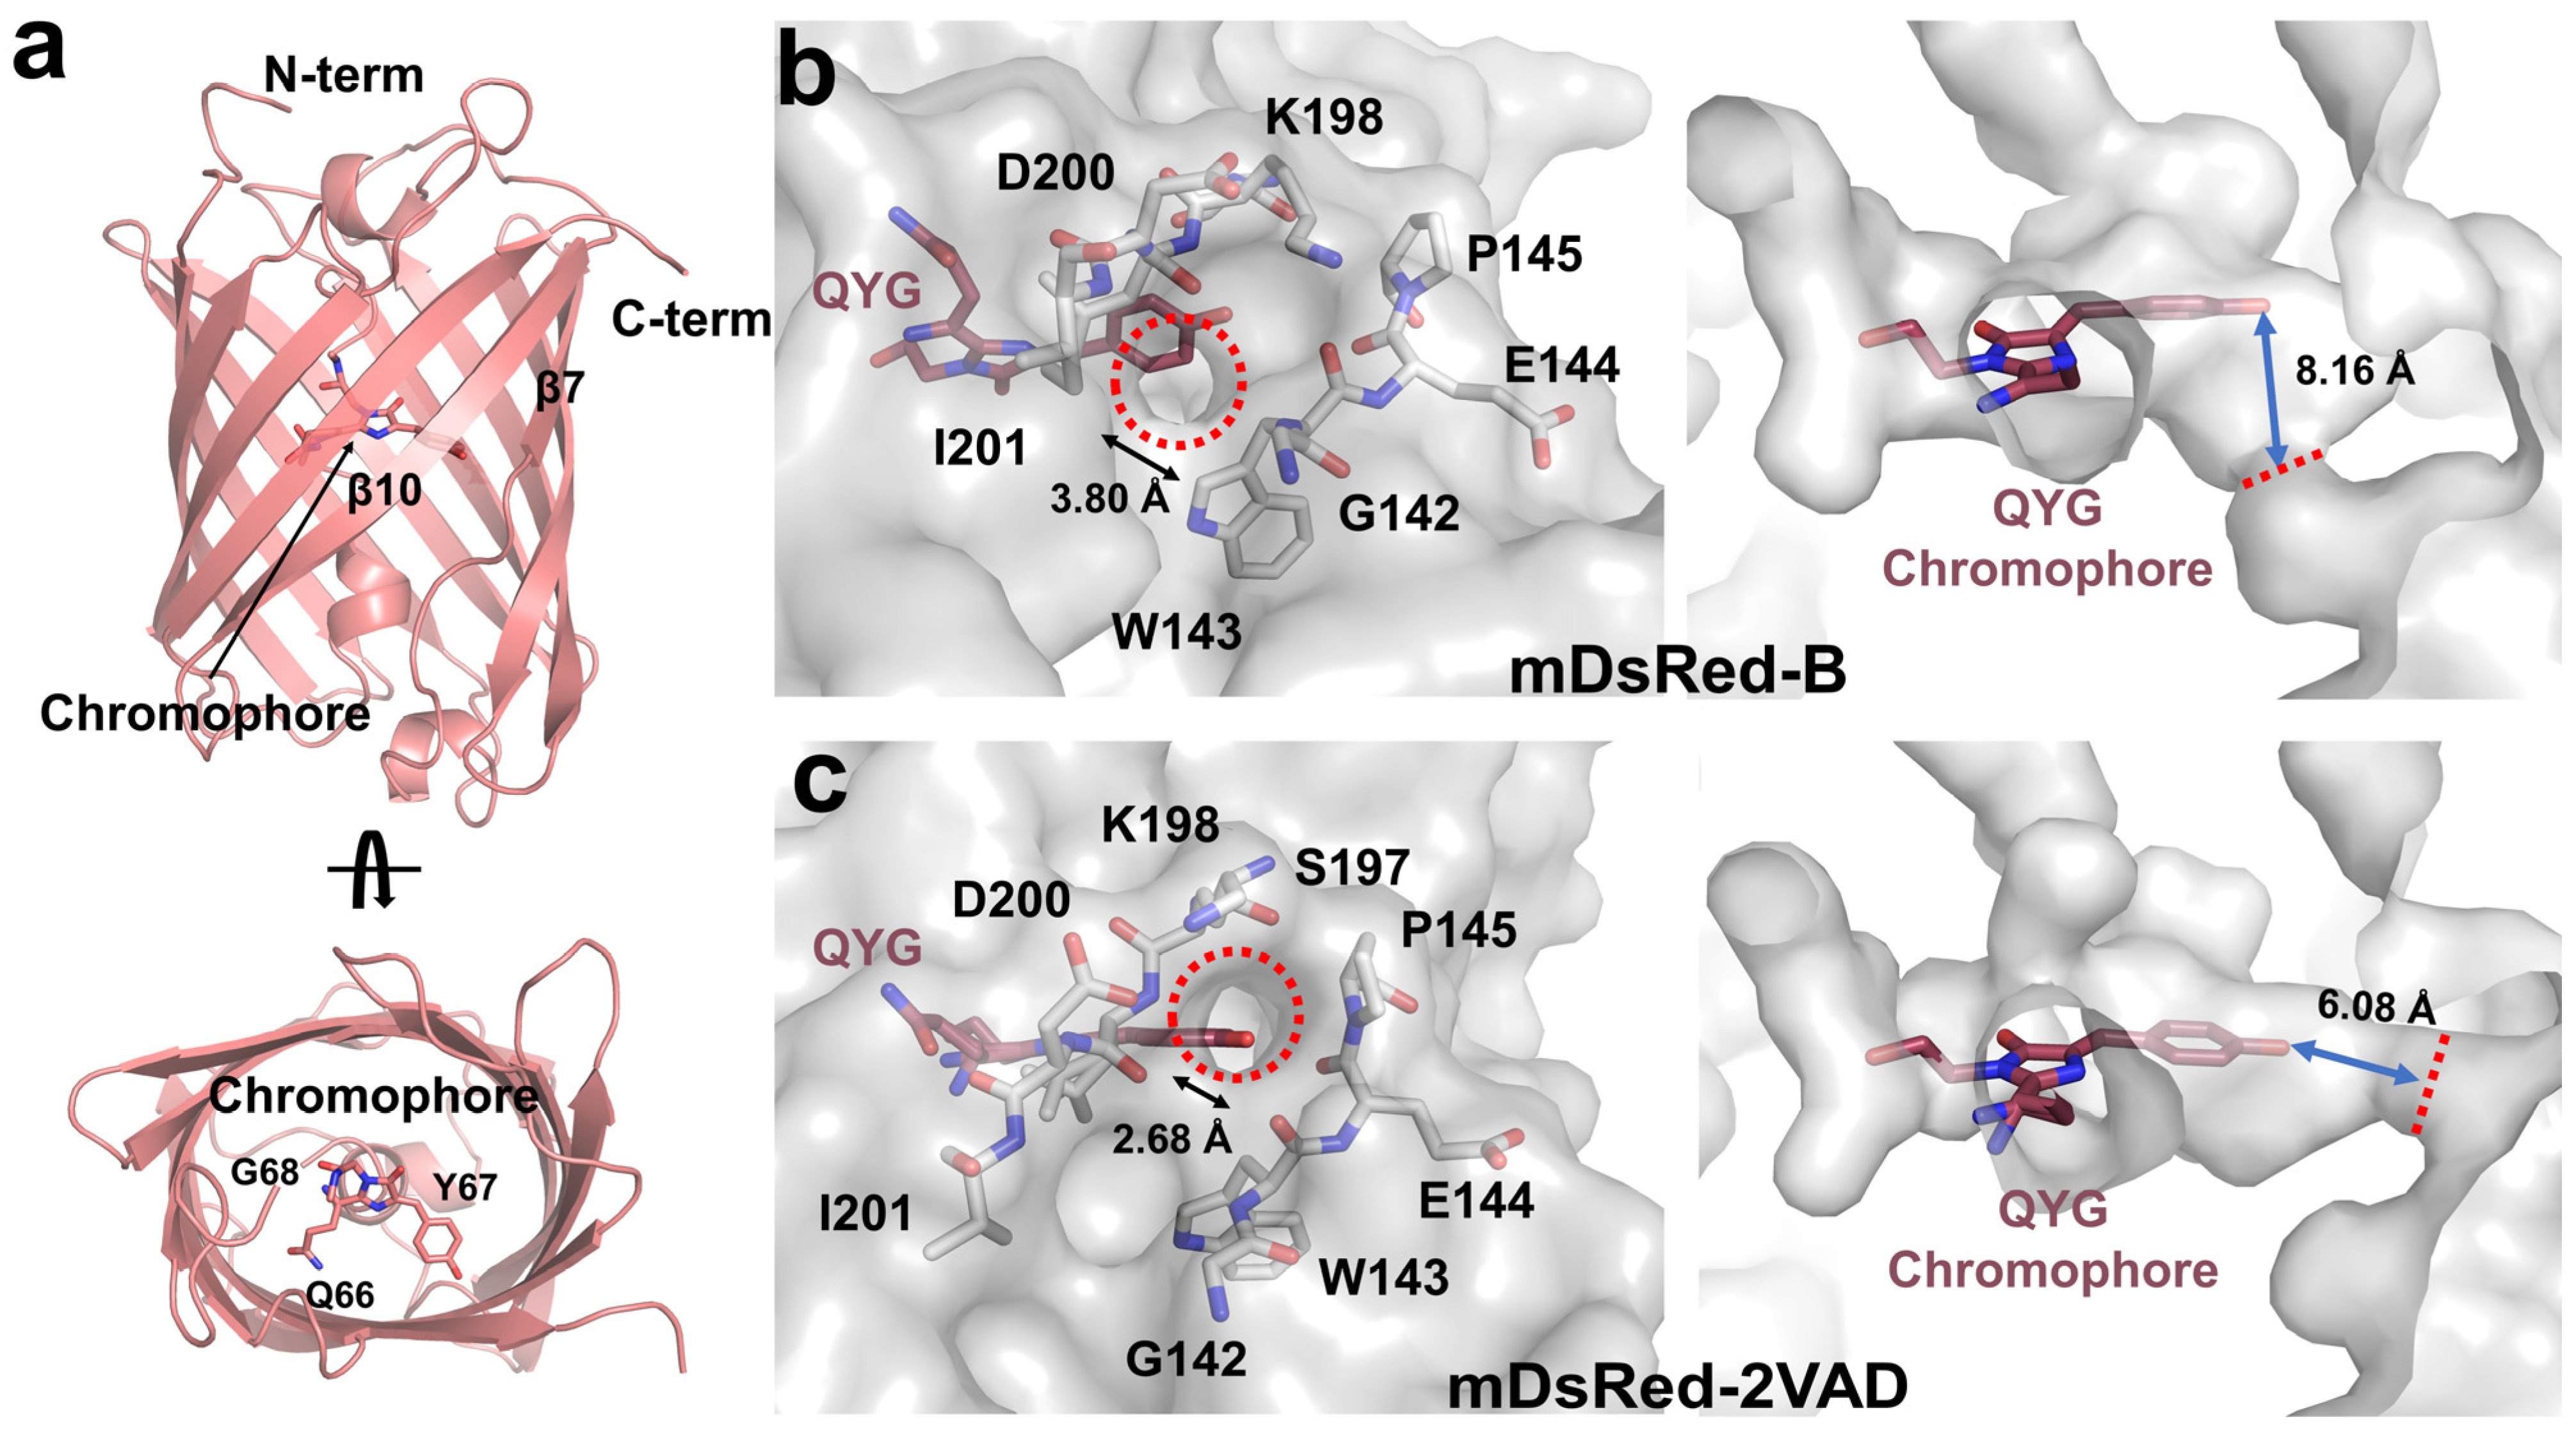
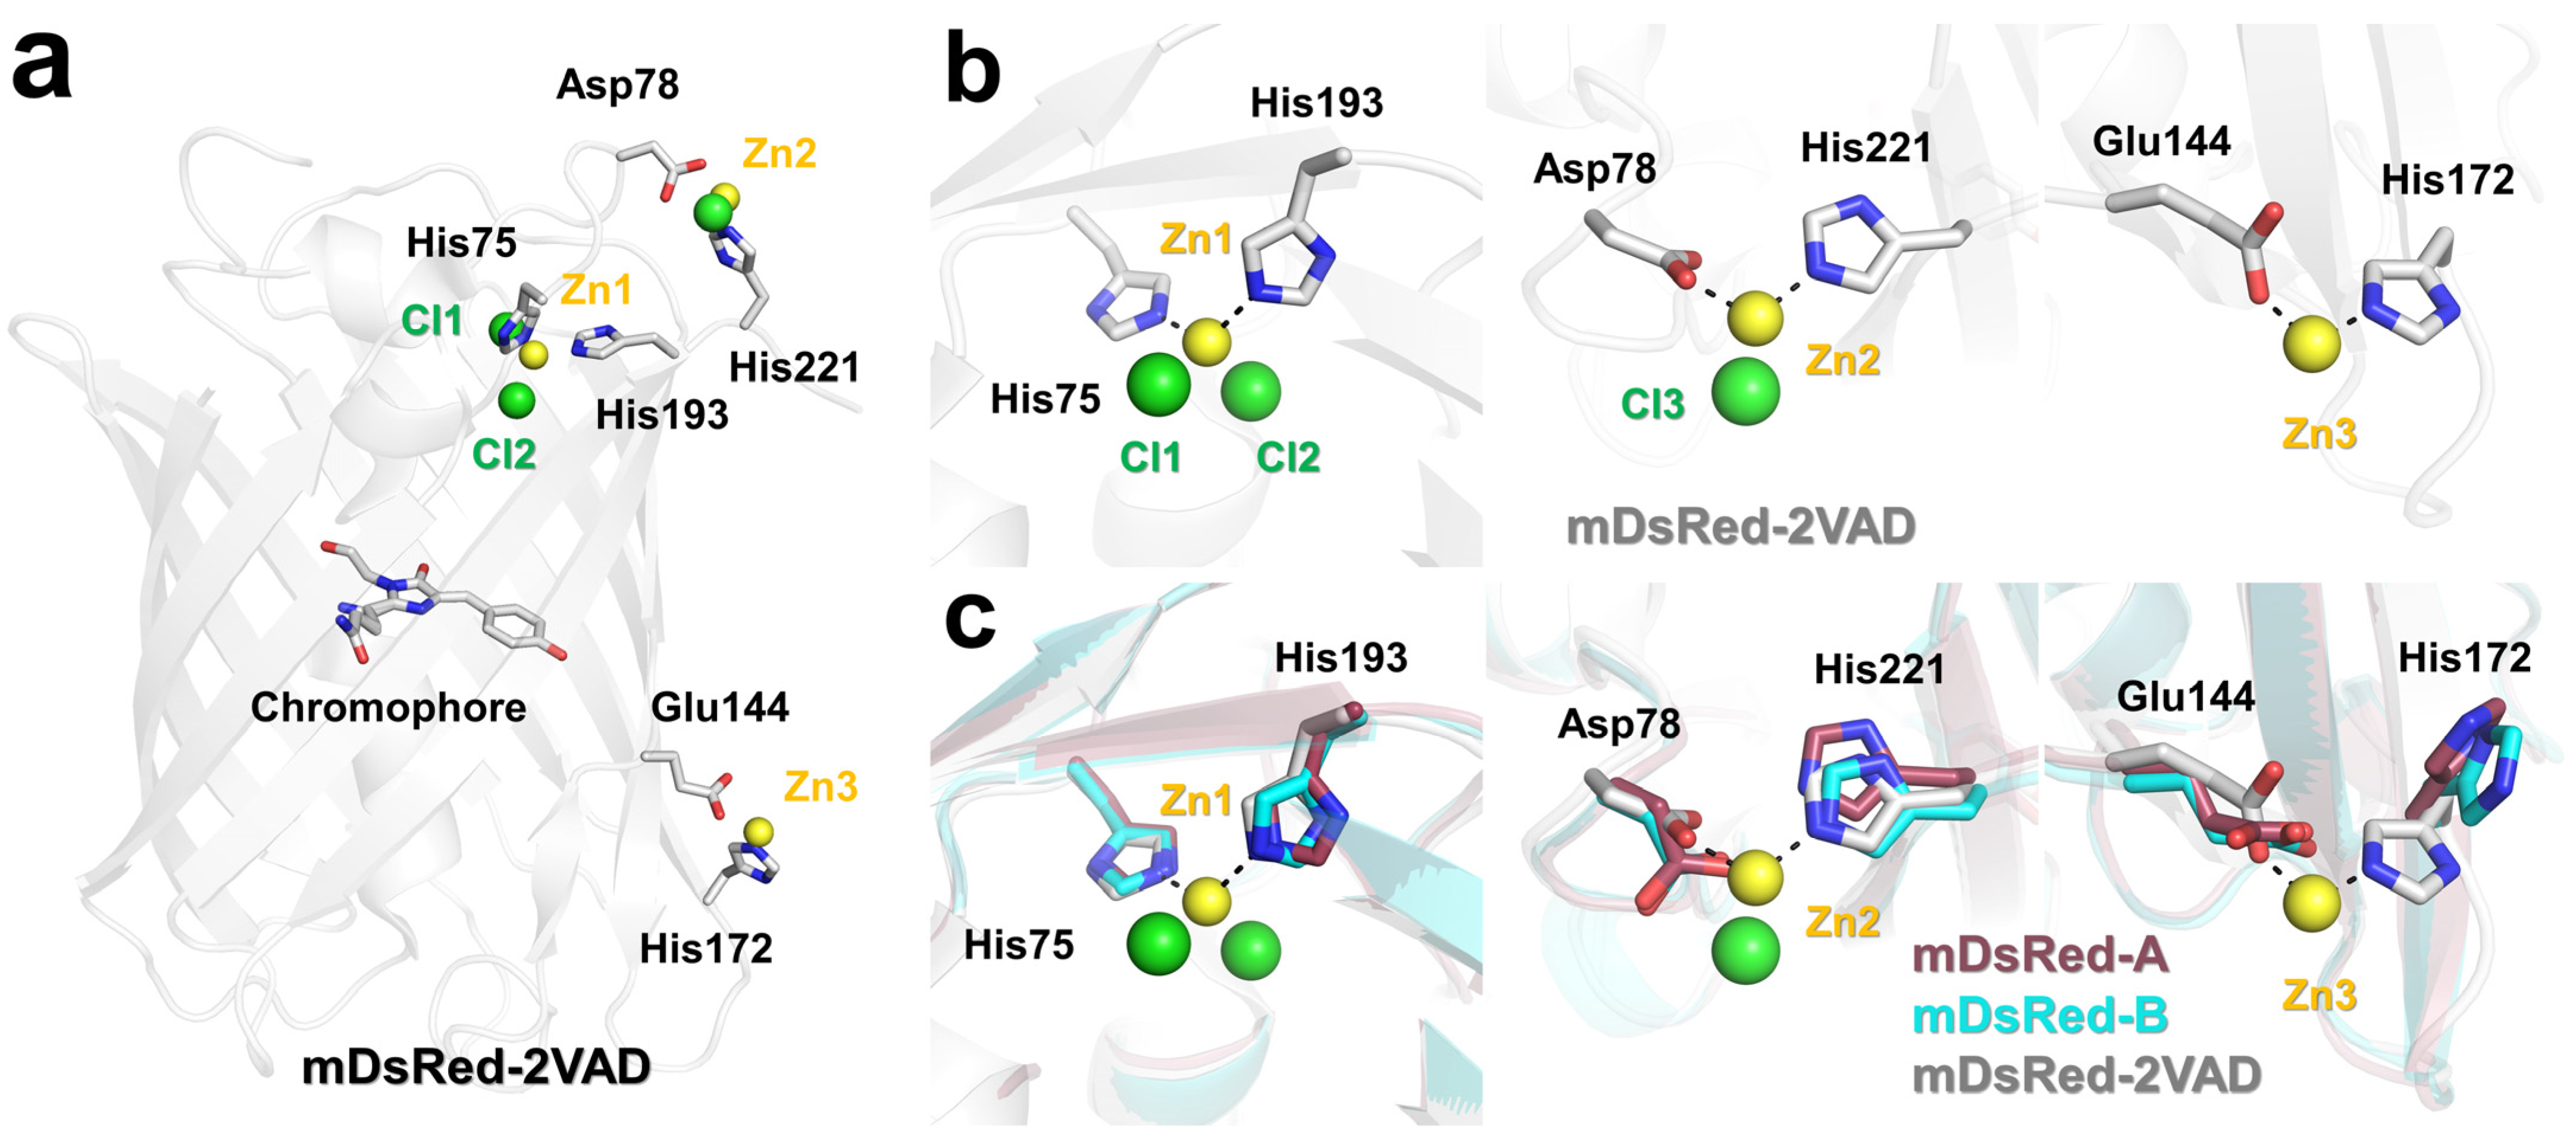
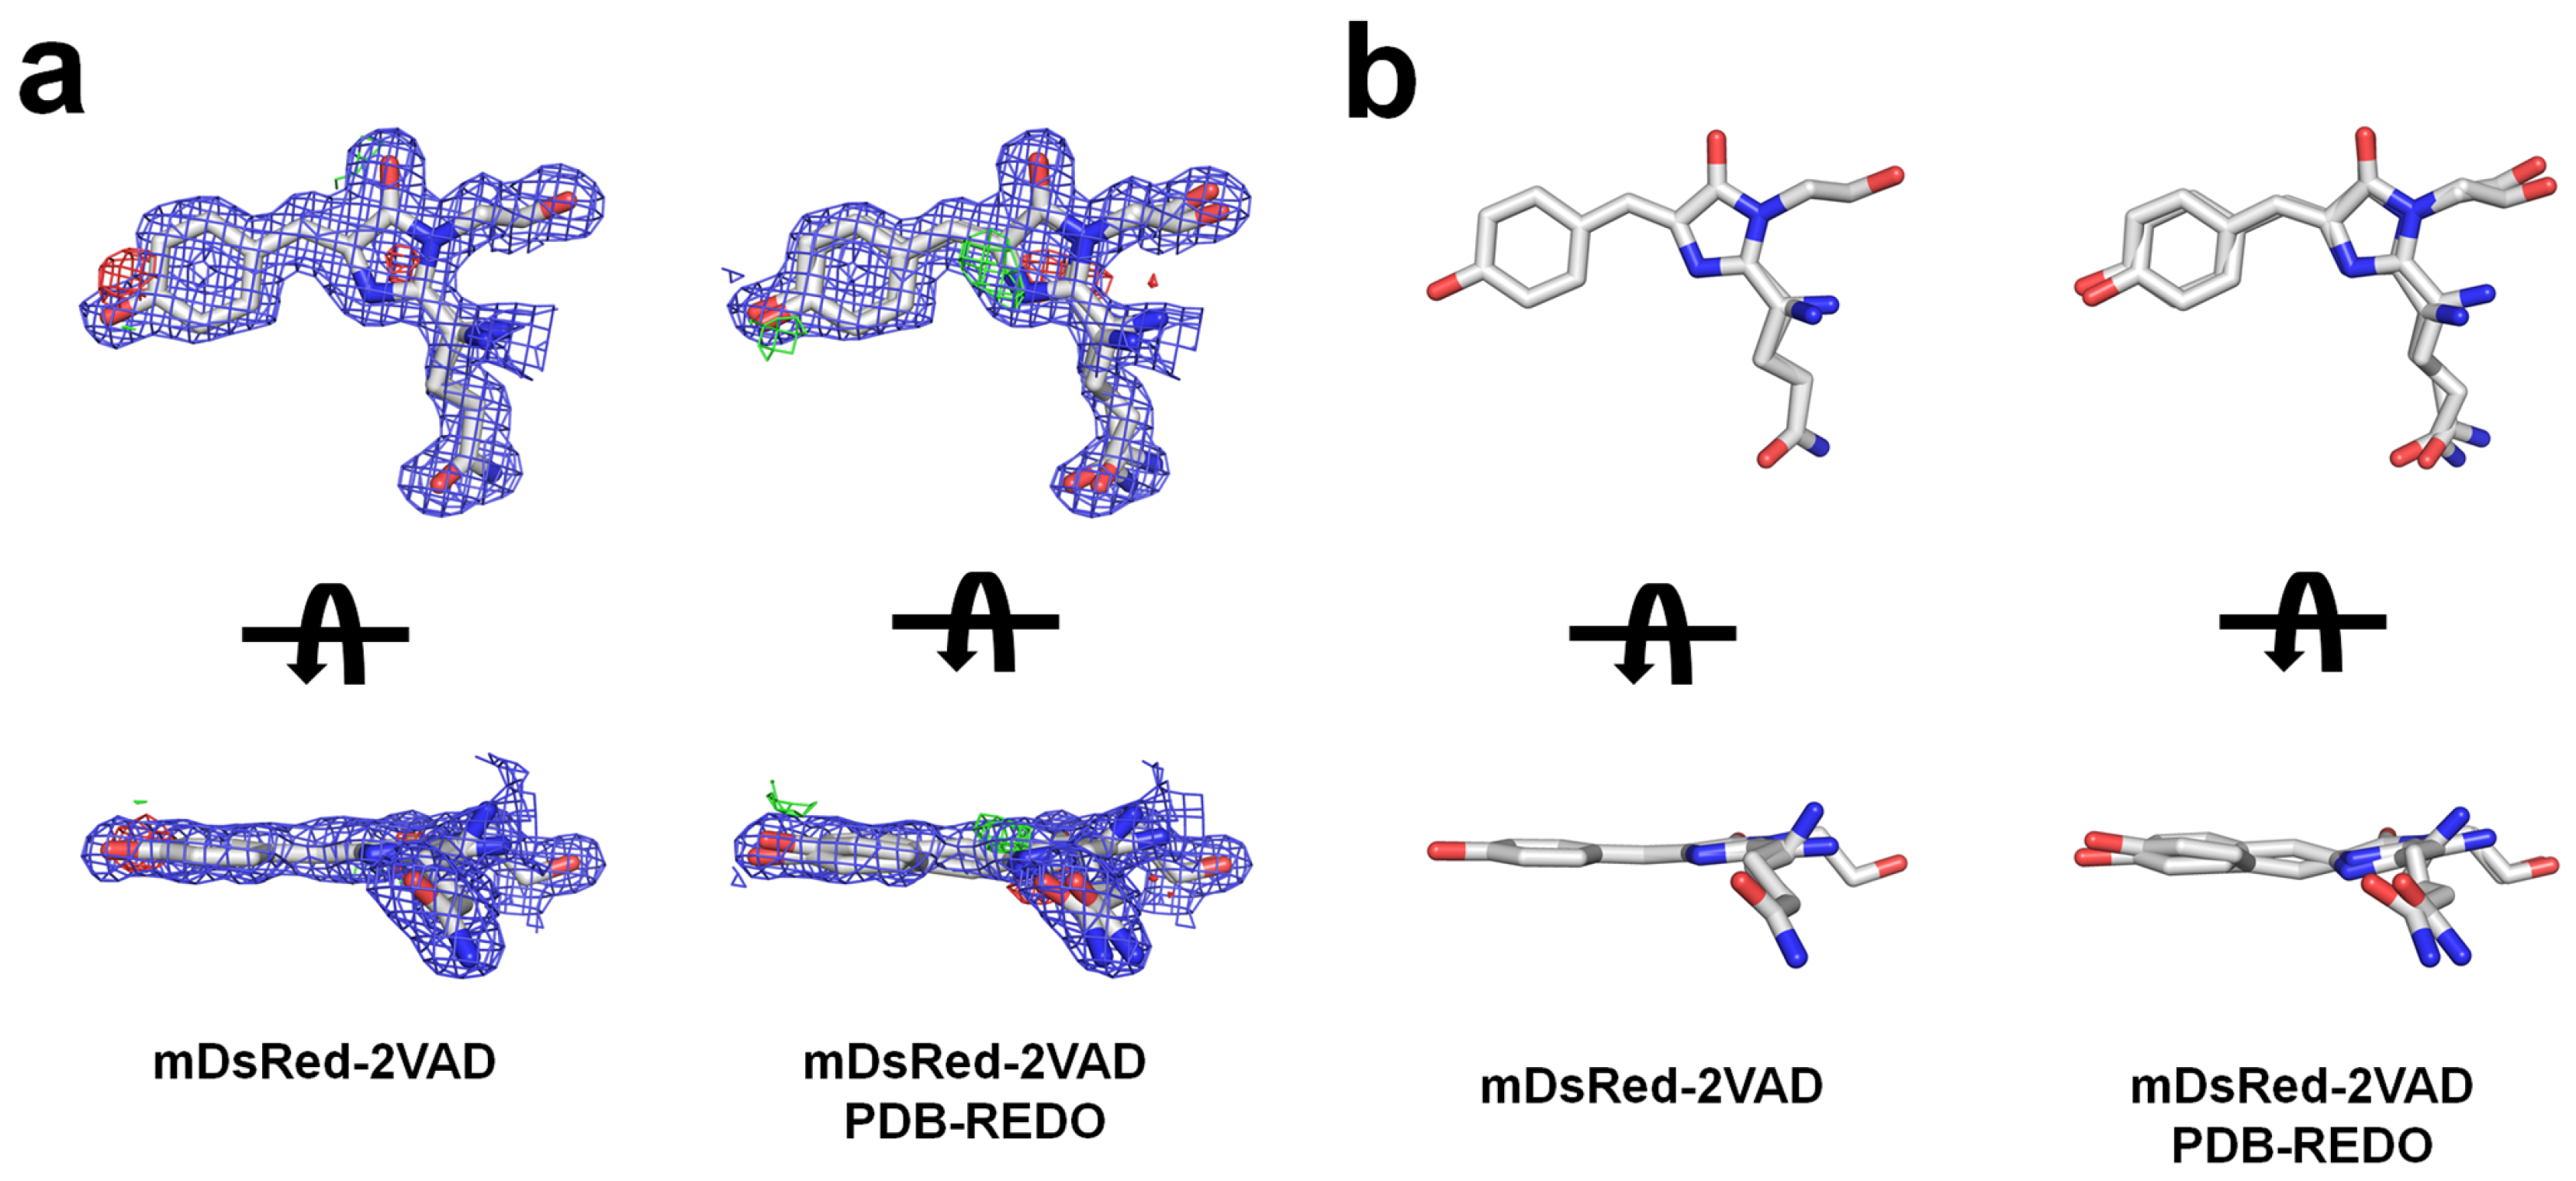
3.3. The Chromophore and Associated Environment

The electron density map of mDsRed, including the amino acids in the vicinity of the chromophore, was clearly observed, although the electron density of the chromophore in both mDsRed-A and mDsRed-B molecules in the asymmetric unit was relatively poor (Figure 3a). Specifically, the electron density map of the imidazoline ring group in the chromophore was relatively well-observed, but the tyrosine ring group in the chromophore was poor. Thus, the flexible position of the tyrosine ring group in the chromophore is likely attributed to the loose inner space around the tyrosine ring, allowing for limited rotation around the CA2-CB2 bond. A partially negative Fo-Fc electron density map was observed at Phe177 located near the tyrosine ring of the mDsRed chromophore (Figure 3a), which may be caused by the conformational flexibility of the mDsRed chromophore. During model building, the position of the tyrosine ring was determined based on the electron density map with a contour level of 0.7 σ. The B-factor values of the refined chromophore molecules in mDsRed-A and mDsRed-B were 29.1 and 18.0 Å2, respectively, which are relatively higher than the B-factor values of the other amino acids (Met12-Gly223: 12.4 and 13.1 Å2 for mDsRed-A and -B, respectively), excluding the flexible N-terminal of mDsRed-A (Thr4-Phe11: 30.4 Å2) and mDsRed-B (27.7 Å2) and the amino acids in the vicinity of the chromophore (Phe14, Ala44, Phe65, Trp93, Arg95, Gln109, Ser146, His163, Phe177, Leu199, Gln213, and Glu215: 8.5 and 8.4 Å2 for mDsRed-A and -B, respectively). Overall, the mDsRed chromophore is flexible within the inner space of the β-barrel.
The two mDsRed chromophores showed a cis-configuration between the tyrosine- and imidazoline ring groups. The side view of the mDsRed chromophore revealed a nonplanar configuration (Figure 3b). The hydroxyl group in the tyrosine ring of mDsRed-A and mDsRed-B molecules was moved up by approximately 2.0 and 0.7 Å in the N-terminal direction based on the imidazoline ring, respectively, and was rotated clockwise by approximately 30° and 30°, respectively (Figure 3b). Thus, mDsRed chromophores can exhibit different conformations under identical crystallization conditions. The superimposition of the imidazoline ring of mDsRed chromophores in an asymmetric unit and mDsRed-2VAD highlighted the conformational differences in the tyrosine ring region of the chromophore, as well as the side chain of the Gln66 residue in the chromophore (Figure 3c).
The different conformations of the two mDsRed chromophores in the asymmetric unit affect the structure of the surrounding amino acids. Consequently, the surrounding environment of the two mDsRed chromophores in the asymmetric unit was analyzed. In mDsRed-A, the hydroxyl group of the tyrosine ring in the chromophore is located at a distance of 2.49 and 3.89 Å from Ser146 and His163, respectively. The O and N atoms of the chromophore imidazoline ring are separated from the N atom of Arg95 and the O atom of Glu215, at distances of 3.14 and 3.18 Å, respectively. The OE atom of chromophore interacts with the NE2 atom of Gln213 at 3.27 Å. In mDsRed-B, the hydroxyl group of the tyrosine ring in the chromophore is located at a distance of 2.29 and 3.91 Å away from Ser146 and His163, respectively. The O and N atoms of the chromophore imidazoline ring are located at distances of 2.99 and 3.26 Å, respectively, from the N atom of Arg95 and the O atom of Glu215. The OE1 atom of the chromophore interacts with the NE2 atom of Gln213 at 3.01 Å. However, in mDsRed-2VAD, the hydroxyl group of the tyrosine ring in the chromophore is located at a distance of 2.57 and 2.83 Å from Ser146 and His163, respectively (Supplementary Figure S2). The O and N atoms of the chromophore imidazoline ring are located at a 2.92 and 2.71 Å distance from the N atom of Arg95 and the O atom of Glu215, respectively. The OE atom of the chromophore interacts with the NE2 atom of Gln213 at a distance of 3.33 Å. The electron density map in the crystal structure represents the average of the multiple conformations of the mDsRed chromophore. Consequently, the distances between the aforementioned chromophore and the surrounding amino acids reflect the average values of several conformations around the obtained chromophore. Therefore, it is more appropriate to interpret the difference in distance between the chromophore and surrounding amino acids in mDsRed-A and -B as indicative of the interaction tendency with surrounding amino acids, resulting from changes in chromophore conformations rather than a purely numerical comparison.

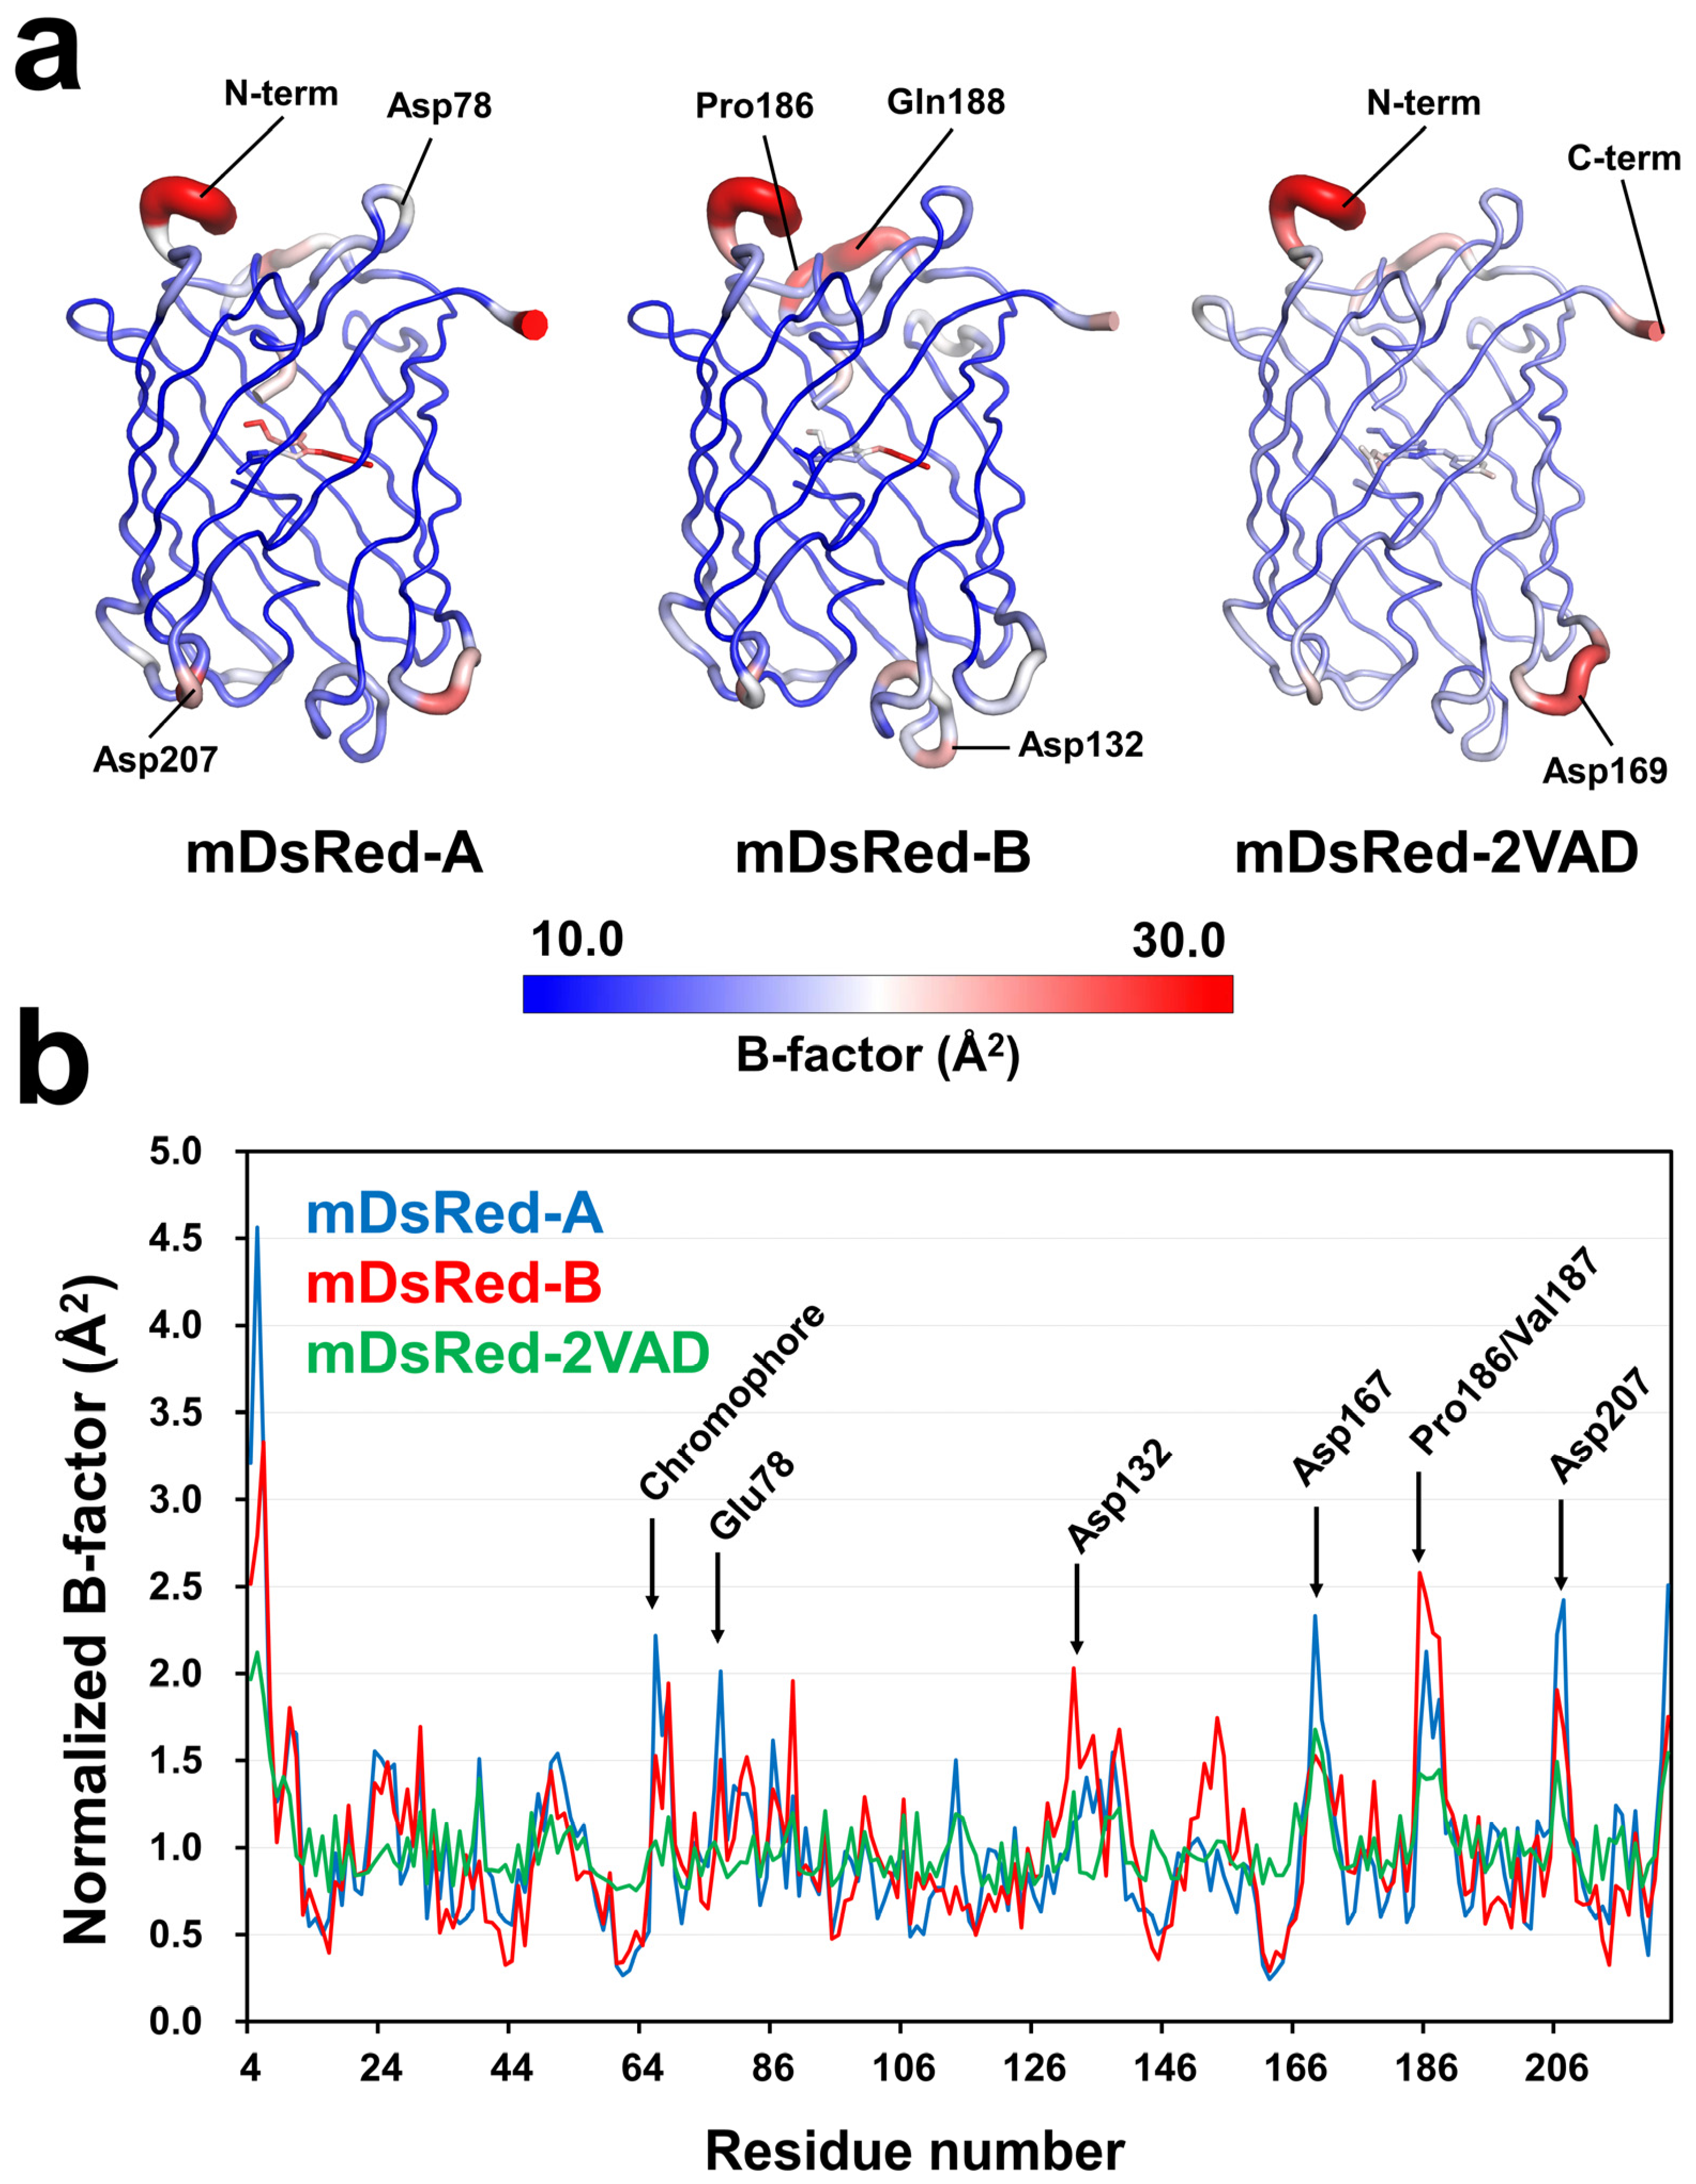
3.4. Flexibility of the Main Chain of mDsRed

The structural differences between the two chromophores of mDsRed in the asymmetric unit influence structural changes in the amino acids involved in the environment of the chromophores. These amino acids may play a role in the flexibility of the β-barrel. However, the protein flexibility in crystal structures may be limited due to protein packing effects. During the protein packing process, the contact area of the protein surface depends on the space group of the crystal, potentially providing information about the flexibility of different proteins. Therefore, to understand the molecular flexibility of mDsRed, we analyzed the temperature factor of the mDsRed structure determined in this experiment and the previously determined mDsRed (PDB code: 2VAD) with a different crystal form (P212121).
In the B-factor putty representation, the β-barrel fold of mDsRed was relatively rigid, while the N-terminal and C-terminal regions exhibited high flexibility (Figure 4). Loops located above and below the β-barrel fold of each mDsRed also exhibited unique high flexibility. Relatively high flexibility was present in mDsRed-A in the loop containing Asp78 and Asp207 and in mDsRed-B in the loop containing Pro186/Gln188 and Asp132; additionally, the loop containing Asp169 in mDsRed-2VAD exhibited relatively high flexibility (Figure 4). The reason that each of these mDsRed molecules exhibited different flexibilities is attributed to the influence of crystal packing in the crystal. Overall, mDsRed demonstrates high flexibility in the N/C-terminal and loop regions that are not involved in folding, while the β-barrel fold shows an overall rigid conformation. Meanwhile, in the surface structure, no notable flexibility was present around the β7-strand and β9-β10 loop where holes were observed. Accordingly, the regions where holes were observed in mDsRed-B and mDsRed-2VAD have a relatively rigid conformation.

3.5. Flexibility of the Side Chain of the Surface of mDsRed

An electron density map corresponding to a metal ion was not observed in the mDsRed crystal structure determined here. Consequently, among the amino acids exposed on the surface of this structure, those exposed to solvents, excluding those involved in crystal packing, have a preferred conformation in the crystallization buffer. Conversely, Zn and Cl ions were bound to the mDsRed-2VAD. FPs can undergo fluorescence quenching by divalent metal ions, making them potential candidates for metal biosensors [47,48,49,50]. In reported crystal structures of iq-mEmerald [51] and Dronpa [52], quenchable metal ion binding to the β-barrel surface induced structural changes in the side chains of amino acids.
In mDsRed-2VAD, two Zn ions and one Cl ion were located on the surface of mDsRed, while one Zn ion and two Cl ions were located on the inside of the β-barrel (Figure 5a). Notably, three Zn ions directly interacted with mDsRed. Zn1 is coordinated with the OE2 atom of Glu144 (1.99 Å) and the NE2 atom of His172 (1.93 Å) (Figure 5b). Zn2 is coordinated with the OD2 atom of Asp78 (1.99 Å) and the NE2 atom of His221 (2.05 Å) (Figure 5b). Zn3 is coordinated with the NE2 atom of His75 (2.11 Å) and the NE2 atom of His193 (2.14 Å) (Figure 5b). Thus, the conformation of Zn-interacting residues in mDsRed-2VAD is likely not a natural conformation.
The superimposition of the Zn-binding sites of mDsRed-2VAD with mDsRed-A and mDsRed-B determined here shows different amino acid conformations (Figure 5c). For the Zn1 site, the conformation of Zn-interacting His75 and His193 was almost similar between mDsRed-A/B and mDsRed-2VAD. However, the distance between His75 and His193 in mDsRed-2VAD (3.62 Å) was closer than mDsRed-A (3.93 Å) and mDsRed-B (4.13 Å) due to Zn binding-induced side chain shifting. For the Zn2 site, Asp78 and His221 residues are closely located in mDsRed-A (2.91 Å) and mDsRed-B (3.04 Å), but the larger distance to residues in mDsRed-2VAD (3.38 Å) was due to the insertion of a Zn ion in between the Asp78 and His221 residues. For the Zn3 site, a large rotation of the side chain of His172 in mDsRed-2VAD was observed because of Zn binding. Accordingly, the distance between Glu144 and His172 in mDsRed-2VAD (3.62 Å) is closer than mDsRed-A (3.93 Å) and mDsRed-B (4.13 Å). Therefore, the distances between residues involved in Zn binding are probably closer because of interactions with the Zn ion.
Overall, the position and conformation of His75, Asp78, Glu144, His172, His193, and His221 in mDsRed-2VAD are affected by Zn binding.

4. Discussion

The red FP mDsRed is widely used to trace the function of target molecules in molecular and cell biology. The determination of the structure and investigation of the dynamics of mDsRed are crucial for understanding its fundamental molecular properties. In this study, the crystal structure of mDsRed was determined using a new crystal form, and the molecular flexibility was investigated.
Mammalian codon-optimized mDsRed without any affinity purification tags was overexpressed in E. coli. These results suggest that the mammalian codon-optimized mDsRed gene can be successfully used in bacterial hosts for various applications. Recombinant mDsRed was purified using heat treatment and size-exclusion chromatography and then used in crystallization screening. The β-barrel structure in FPs exhibits inherent thermal stability, and heat treatment is, therefore, an effective method for FP purification and helps remove impurities without requiring other purification processes to enhance protein purity.
Microcrystals of mDsRed were obtained under three different crystallization conditions. The structure of the mDsRed crystal grown at pH 5.5 is reported here, although diffraction data could not be collected for crystals grown under the other two conditions because of the absence of suitable crystals for X-ray diffraction. This limitation may stem from suboptimal protein crystallization conditions or could be attributed to the protein not growing into large single crystals, which was potentially influenced by the protein purity of 70–80%. Among the crystallization conditions for which diffraction data were not collected, mDsRed crystals were grown at pH 4.0 in crystal condition (iii). This pH differs from the pH 5.5 reported here and the previously reported crystal condition of mDsRed-2VAD at pH 7.6 (cryoprotectant solution pH 8.0). Fluorescence emission of FPs can be pH-dependent, and structural changes near the chromophore can occur because of pH [13,19]. Consequently, crystallization condition (iii) could offer valuable insights into the pH-dependent structural changes of mDsRed. The new crystallization conditions (ii) and (iii) of mDsRed obtained in this experiment may prove useful in future studies to improve our understanding of the molecular function of mDsRed. Extended crystallization experiments with a higher purity of mDsRed may be necessary for comprehensive analysis.
The crystal structure of mDsRed revealed a typical β-barrel structure similar to other FPs. However, the chromophore exhibited a partially disordered electron density map, a phenomenon not previously observed. Furthermore, the two mDsRed chromophores in the asymmetric unit displayed distinct conformations and variations in the residues surrounding the chromophore environment. This clearly indicates that the chromophore of mDsRed is flexible within the internal space of the β-barrel structure.
Typical FP chromophores exhibit cis- or trans-conformations under specific conditions. Conformational changes in FP chromophores and neighboring residues can be prompted by external stimuli, such as changes in solution environment (e.g., pH) or photoactivation [13,19,20,21,22]. For example, the chromophore conformation of the large Stokes shift FP mKeima can be altered by pH, displaying cis- and trans-conformations at pH 3.8 and 8.0, respectively [19]. At pH 5.6, electron density maps reveal both cis- and trans-conformations of the chromophore [19]. For the photoactivation of FPs, time-resolved serial crystallography experiments have shown trans-to-cis isomerization of the chromophore when the FP is photoactivated [20,21,22]. Since mDsRed was not photoactivated in the current study, the disordered electron density map of the chromophore is considered to be an effect of structural flexibility due to crystallization conditions and the experimental environment.
The location within the β-barrel of the tripeptide, which forms the chromophore, during the protein expression and folding process means that it cannot be exposed elsewhere. This implies that all amino acids constituting the chromophore must be located inside the β-barrel. Therefore, the poor electron density indicates that chromophore conformation is highly flexible.
In GFP, the chromophore is highly conjugated and exhibits a planar conformation in the ground state [42]. Conversely, most RFP chromophore analogs are highly conjugated but mostly nonplanar, resulting in a loss of their emission property [43]. Analysis of RFP chromophore analogs has revealed that planarity is an essential requirement for fluorescence emission, and a nonplanar chromophore exists in a nonfluorescent state [43]. Therefore, we hypothesize that the absence of electron density in a planar configuration for the mDsRed chromophore could be due to the ground state being in a nonfluorescent state.
The electron density maps of the mDsRed-2VAD chromophore were analyzed to investigate potential conformational changes. In mDsRed-2VAD, a clear cis-conformation electron density map for the chromophore was observed. The overall chromophore of mDsRed-2VAD fits well into the electron density map, but the partial negative Fo-Fc electron density map was observed in the tyrosine ring in the chromophore (Figure 5). This tentatively indicates that the mDsRed-2VAD chromophore may be flexible within the β-barrel structure. The structure refinement depends on the refinement program and molecular modeling ability [53]. PDB-REDO is an automated procedure that refines, rebuilds, and validates model structures [54] using recent crystallographic standards with modern crystallographic structure refinement software. Interestingly, the refined mDsRed-2VAD structure by PDB-REDO shows two different conformations (Figure 6). The Rwork/Rfree values for the refined mDsRed-2VAD by PDB-REDO are 16.45 and 18.31, respectively, which are lower than the original structure of mDsRed-2VAD (17.77 and 19.81, respectively). Collectively, the previously determined mDsRed-2VAD also exhibited the flexibility of the chromophore.
Herein, while comparing the mDsRed surface structure, changes in the amino acid conformation of mDsRed-2VAD were found because of the binding of Zn ions. Previous biochemical experiments showed that Zn reduced the fluorescence emission of DsRed variants [55]. Accordingly, mDsRed-2VAD tentatively exhibits a metal ion bind where fluorescent emission may be partially quenched.
In summary, the deeper molecular flexibility of mDsRed was determined and analyzed in this study. These structural analyses expand our knowledge of the structural properties of mDsRed and provide insight into their future applications and FP development.

Supplementary Materials

The following supporting information can be downloaded at https://www.mdpi.com/article/10.3390/cryst14010062/s1, Figure S1: Comparison of the surface structures of mDsRed-A, mDsRed-B, and mDsRed-2VAD; Figure S2: Hydrogen bond network in the vicinity of the mDsRed chromophores; Table S1: Interface summary analyzed by PDBePISA; Table S2: Interaction between mDsRed-A and mDsRed-B.

Funding

This work was funded by the National Research Foundation of Korea (NRF) (NRF-2021R1I1A1A01050838).

Data Availability Statement

The structure factor and coordinates are deposited in the protein data bank (www.rcsb.org) with PDB code 8WGP.

Acknowledgments

I would like to thank the beamline staff at the 7A beamline at the Pohang Accelerator Laboratory for their assistance with data collection.

Conflicts of Interest

The author declares no conflicts of interest.

References

  1. Tsien, R.Y. The green fluorescent protein. Annu. Rev. Biochem. 1998, 67, 509–544. [Google Scholar] [CrossRef] [PubMed]
  2. Stepanenko, O.; Verkhusha, V.; Kuznetsova, I.; Uversky, V.; Turoverov, K. Fluorescent Proteins as Biomarkers and Biosensors: Throwing Color Lights on Molecular and Cellular Processes. Curr. Protein Pept. Sci. 2008, 9, 338–369. [Google Scholar] [CrossRef] [PubMed]
  3. Bajar, B.T.; Wang, E.S.; Zhang, S.; Lin, M.Z.; Chu, J. A Guide to Fluorescent Protein FRET Pairs. Sensors 2016, 16, 1488. [Google Scholar] [CrossRef] [PubMed]
  4. Liao, J.; Madahar, V.; Dang, R.; Jiang, L. Quantitative FRET (qFRET) Technology for the Determination of Protein–Protein Interaction Affinity in Solution. Molecules 2021, 26, 6339. [Google Scholar] [CrossRef] [PubMed]
  5. Akerboom, J.; Carreras Calderón, N.; Tian, L.; Wabnig, S.; Prigge, M.; Tolö, J.; Gordus, A.; Orger, M.B.; Severi, K.E.; Macklin, J.J.; et al. Genetically encoded calcium indicators for multi-color neural activity imaging and combination with optogenetics. Front. Mol. Neurosci. 2013, 6, 2. [Google Scholar] [CrossRef] [PubMed]
  6. Benaissa, H.; Ounoughi, K.; Aujard, I.; Fischer, E.; Goïame, R.; Nguyen, J.; Tebo, A.G.; Li, C.; Le Saux, T.; Bertolin, G.; et al. Engineering of a fluorescent chemogenetic reporter with tunable color for advanced live-cell imaging. Nat. Commun. 2021, 12, 6989. [Google Scholar] [CrossRef] [PubMed]
  7. Miura, Y.; Senoo, A.; Doura, T.; Kiyonaka, S. Chemogenetics of cell surface receptors: Beyond genetic and pharmacological approaches. RSC Chem. Biol. 2022, 3, 269–287. [Google Scholar] [CrossRef] [PubMed]
  8. Tanz, S.K.; Castleden, I.; Small, I.D.; Millar, A.H. Fluorescent protein tagging as a tool to define the subcellular distribution of proteins in plants. Front. Plant Sci. 2013, 4, 214. [Google Scholar] [CrossRef]
  9. Chudakov, D.M.; Lukyanov, S.; Lukyanov, K.A. Fluorescent proteins as a toolkit for in vivo imaging. Trends Biotechnol. 2005, 23, 605–613. [Google Scholar] [CrossRef]
  10. Borg, R.E.; Rochford, J. Molecular Photoacoustic Contrast Agents: Design Principles & Applications. Photochem. Photobiol. 2018, 94, 1175–1209. [Google Scholar] [CrossRef]
  11. Tan, R.; Krueger, R.K.; Gramelspacher, M.J.; Zhou, X.; Xiao, Y.; Ke, A.; Hou, Z.; Zhang, Y. Cas11 enables genome engineering in human cells with compact CRISPR-Cas3 systems. Mol. Cell 2022, 82, 852–867.e855. [Google Scholar] [CrossRef] [PubMed]
  12. Bizzarri, R.; Arcangeli, C.; Arosio, D.; Ricci, F.; Faraci, P.; Cardarelli, F.; Beltram, F. Development of a Novel GFP-based Ratiometric Excitation and Emission pH Indicator for Intracellular Studies. Biophys. J. 2006, 90, 3300–3314. [Google Scholar] [CrossRef] [PubMed]
  13. Bae, J.E.; Kim, I.J.; Nam, K.H. Disruption of the hydrogen bonding network determines the pH-induced non-fluorescent state of the fluorescent protein ZsYellow by protonation of Glu221. Biochem. Biophys. Res. Commun. 2017, 493, 562–567. [Google Scholar] [CrossRef] [PubMed]
  14. Ormö, M.; Cubitt, A.B.; Kallio, K.; Gross, L.A.; Tsien, R.Y.; Remington, S.J. Crystal Structure of the Aequorea victoria Green Fluorescent Protein. Science 1996, 273, 1392–1395. [Google Scholar] [CrossRef] [PubMed]
  15. Barondeau, D.P.; Kassmann, C.J.; Tainer, J.A.; Getzoff, E.D. Understanding GFP Chromophore Biosynthesis:  Controlling Backbone Cyclization and Modifying Post-translational Chemistry. Biochemistry 2005, 44, 1960–1970. [Google Scholar] [CrossRef] [PubMed]
  16. Pletneva, N.V.; Pletnev, V.Z.; Lukyanov, K.A.; Gurskaya, N.G.; Goryacheva, E.A.; Martynov, V.I.; Wlodawer, A.; Dauter, Z.; Pletnev, S. Structural Evidence for a Dehydrated Intermediate in Green Fluorescent Protein Chromophore Biosynthesis. J. Biol. Chem. 2010, 285, 15978–15984. [Google Scholar] [CrossRef] [PubMed]
  17. Pletnev, S.; Subach, F.V.; Dauter, Z.; Wlodawer, A.; Verkhusha, V.V. Understanding Blue-to-Red Conversion in Monomeric Fluorescent Timers and Hydrolytic Degradation of Their Chromophores. J. Am. Chem. Soc. 2010, 132, 2243–2253. [Google Scholar] [CrossRef] [PubMed]
  18. Zimmer, M. Green fluorescent protein (GFP): Applications, structure, and related photophysical behavior. Chem. Rev. 2002, 102, 759–781. [Google Scholar] [CrossRef]
  19. Violot, S.; Carpentier, P.; Blanchoin, L.; Bourgeois, D. Reverse pH-Dependence of Chromophore Protonation Explains the Large Stokes Shift of the Red Fluorescent Protein mKeima. J. Am. Chem. Soc. 2009, 131, 10356–10357. [Google Scholar] [CrossRef]
  20. Colletier, J.-P.; Sliwa, M.; Gallat, F.-X.; Sugahara, M.; Guillon, V.; Schirò, G.; Coquelle, N.; Woodhouse, J.; Roux, L.; Gotthard, G.; et al. Serial Femtosecond Crystallography and Ultrafast Absorption Spectroscopy of the Photoswitchable Fluorescent Protein IrisFP. J. Phys. Chem. Lett. 2016, 7, 882–887. [Google Scholar] [CrossRef]
  21. Coquelle, N.; Sliwa, M.; Woodhouse, J.; Schirò, G.; Adam, V.; Aquila, A.; Barends, T.R.M.; Boutet, S.; Byrdin, M.; Carbajo, S.; et al. Chromophore twisting in the excited state of a photoswitchable fluorescent protein captured by time-resolved serial femtosecond crystallography. Nat. Chem. 2017, 10, 31–37. [Google Scholar] [CrossRef] [PubMed]
  22. Woodhouse, J.; Nass Kovacs, G.; Coquelle, N.; Uriarte, L.M.; Adam, V.; Barends, T.R.M.; Byrdin, M.; de la Mora, E.; Bruce Doak, R.; Feliks, M.; et al. Photoswitching mechanism of a fluorescent protein revealed by time-resolved crystallography and transient absorption spectroscopy. Nat. Commun. 2020, 11, 741. [Google Scholar] [CrossRef] [PubMed]
  23. Wiedenmann, J.; Oswald, F.; Nienhaus, G.U. Fluorescent proteins for live cell imaging: Opportunities, limitations, and challenges. IUBMB Life 2009, 61, 1029–1042. [Google Scholar] [CrossRef] [PubMed]
  24. Betzig, E.; Patterson, G.H.; Sougrat, R.; Lindwasser, O.W.; Olenych, S.; Bonifacino, J.S.; Davidson, M.W.; Lippincott-Schwartz, J.; Hess, H.F. Imaging Intracellular Fluorescent Proteins at Nanometer Resolution. Science 2006, 313, 1642–1645. [Google Scholar] [CrossRef]
  25. Matz, M.V.; Fradkov, A.F.; Labas, Y.A.; Savitsky, A.P.; Zaraisky, A.G.; Markelov, M.L.; Lukyanov, S.A. Fluorescent proteins from nonbioluminescent Anthozoa species. Nat. Biotechnol. 1999, 17, 969–973. [Google Scholar] [CrossRef] [PubMed]
  26. Jach, G.; Binot, E.; Frings, S.; Luxa, K.; Schell, J. Use of red fluorescent protein from Discosoma sp. (dsRED) as a reporter for plant gene expression. Plant J. 2002, 28, 483–491. [Google Scholar] [CrossRef]
  27. Li, N.; Zhang, Y.; Yao, L.; Shi, Y.; Zhao, Q.; Huang, B.; Sun, Y. A Recombinant Porcine Reproductive and Respiratory Syndrome Virus Stably Expressing DsRed Protein Based on Bacterial Artificial Chromosome System. Front. Microbiol. 2022, 13, 907281. [Google Scholar] [CrossRef]
  28. Polyakova, N.; Kandarakov, O.; Belyavsky, A. Selection of Cell Populations with High or Low Surface Marker Expression Using Magnetic Sorting. Cells 2023, 12, 1286. [Google Scholar] [CrossRef]
  29. Tseng, H.-C.; Wu, M.-R.; Lee, C.-H.; Hsiao, J.-K. Differentiation Capacity of Bone Marrow-Derived Rat Mesenchymal Stem Cells from DsRed and Cre Transgenic Cre/loxP Models. Cells 2022, 11, 2769. [Google Scholar] [CrossRef]
  30. Bevis, B.J.; Glick, B.S. Rapidly maturing variants of the Discosoma red fluorescent protein (DsRed). Nat. Biotechnol. 2002, 20, 83–87. [Google Scholar] [CrossRef]
  31. Ranganathan, R.; Wall, M.A.; Socolich, M. The structural basis for red fluorescence in the tetrameric GFP homolog DsRed. Nat. Struct. Biol. 2000, 7, 1133–1138. [Google Scholar] [CrossRef] [PubMed]
  32. Blum, C.; Subramaniam, V. Single-molecule spectroscopy of fluorescent proteins. Anal. Bioanal. Chem. 2008, 393, 527–541. [Google Scholar] [CrossRef] [PubMed]
  33. Chudakov, D.M.; Matz, M.V.; Lukyanov, S.; Lukyanov, K.A. Fluorescent Proteins and Their Applications in Imaging Living Cells and Tissues. Physiol. Rev. 2010, 90, 1103–1163. [Google Scholar] [CrossRef] [PubMed]
  34. Strongin, D.E.; Bevis, B.; Khuong, N.; Downing, M.E.; Strack, R.L.; Sundaram, K.; Glick, B.S.; Keenan, R.J. Structural rearrangements near the chromophore influence the maturation speed and brightness of DsRed variants. Protein Eng. Des. Sel. 2007, 20, 525–534. [Google Scholar] [CrossRef]
  35. Hawley, T.S.; Telford, W.G.; Ramezani, A.; Hawley, R.G. Four-Color Flow Cytometric Detection of Retrovirally Expressed Red, Yellow, Green, and Cyan Fluorescent Proteins. BioTechniques 2001, 30, 1028–1034. [Google Scholar] [CrossRef]
  36. Strack, R.L.; Strongin, D.E.; Bhattacharyya, D.; Tao, W.; Berman, A.; Broxmeyer, H.E.; Keenan, R.J.; Glick, B.S. A noncytotoxic DsRed variant for whole-cell labeling. Nat. Methods 2008, 5, 955–957. [Google Scholar] [CrossRef]
  37. DsRed-Monomer Fluorescent Protein. Available online: https://www.takarabio.com/products/gene-function/fluorescent-proteins/fluorescent-protein-plasmids/red-fluorescent-proteins/dsred-monomer-fluorescent-protein (accessed on 5 December 2023).
  38. Park, S.Y.; Ha, S.C.; Kim, Y.G. The Protein Crystallography Beamlines at the Pohang Light Source II. Biodesign 2017, 5, 30–34. [Google Scholar]
  39. Otwinowski, Z.; Minor, W. Processing of X-ray diffraction data collected in oscillation mode. Methods Enzymol. 1997, 276, 307–326. [Google Scholar] [CrossRef]
  40. Vagin, A.; Teplyakov, A. Molecular replacement with MOLREP. Acta Crystallogr. D Biol. Crystallogr. 2010, 66, 22–25. [Google Scholar] [CrossRef]
  41. Casañal, A.; Lohkamp, B.; Emsley, P. Current developments in Coot for macromolecular model building of Electron Cryo-microscopy and Crystallographic Data. Protein Sci. 2020, 29, 1055–1064. [Google Scholar] [CrossRef]
  42. Murshudov, G.N.; Skubak, P.; Lebedev, A.A.; Pannu, N.S.; Steiner, R.A.; Nicholls, R.A.; Winn, M.D.; Long, F.; Vagin, A.A. REFMAC5 for the refinement of macromolecular crystal structures. Acta Crystallogr. D Biol. Crystallogr. 2011, 67, 355–367. [Google Scholar] [CrossRef] [PubMed]
  43. Williams, C.J.; Headd, J.J.; Moriarty, N.W.; Prisant, M.G.; Videau, L.L.; Deis, L.N.; Verma, V.; Keedy, D.A.; Hintze, B.J.; Chen, V.B.; et al. MolProbity: More and better reference data for improved all-atom structure validation. Protein Sci. 2018, 27, 293–315. [Google Scholar] [CrossRef] [PubMed]
  44. Krissinel, E.; Henrick, K. Inference of macromolecular assemblies from crystalline state. J. Mol. Biol. 2007, 372, 774–797. [Google Scholar] [CrossRef]
  45. Nagy, A. Thermal stability of chemically denatured green fluorescent protein (GFP) A preliminary study. Thermochim. Acta 2004, 410, 161–163. [Google Scholar] [CrossRef]
  46. Nam, K.H.; Kwon, O.Y.; Sugiyama, K.; Lee, W.H.; Kim, Y.K.; Song, H.K.; Kim, E.E.; Park, S.Y.; Jeon, H.; Hwang, K.Y. Structural characterization of the photoswitchable fluorescent protein Dronpa-C62S. Biochem. Biophys. Res. Commun. 2007, 354, 962–967. [Google Scholar] [CrossRef] [PubMed]
  47. Kim, I.J.; Xu, Y.; Nam, K.H. Spectroscopic Analysis of Fe Ion-Induced Fluorescence Quenching of the Green Fluorescent Protein ZsGreen. J. Fluoresc. 2021, 31, 307–314. [Google Scholar] [CrossRef] [PubMed]
  48. Nam, K.H. Fluorescent Protein-Based Metal Biosensors. Chemosensors 2023, 11, 216. [Google Scholar] [CrossRef]
  49. Kim, I.J.; Xu, Y.; Nam, K.H. Metal-Induced Fluorescence Quenching of Photoconvertible Fluorescent Protein DendFP. Molecules 2022, 27, 2922. [Google Scholar] [CrossRef]
  50. Kim, I.J.; Xu, Y.; Nam, K.H. Spectroscopic and Structural Analysis of Cu2+-Induced Fluorescence Quenching of ZsYellow. Biosensors 2020, 10, 29. [Google Scholar] [CrossRef]
  51. Yu, X.; Strub, M.P.; Barnard, T.J.; Noinaj, N.; Piszczek, G.; Buchanan, S.K.; Taraska, J.W. An engineered palette of metal ion quenchable fluorescent proteins. PLoS ONE 2014, 9, e95808. [Google Scholar] [CrossRef]
  52. Kim, I.J.; Kim, S.; Park, J.; Eom, I.; Kim, S.; Kim, J.H.; Ha, S.C.; Kim, Y.G.; Hwang, K.Y.; Nam, K.H. Crystal structures of Dronpa complexed with quenchable metal ions provide insight into metal biosensor development. FEBS Lett. 2016, 590, 2982–2990. [Google Scholar] [CrossRef] [PubMed]
  53. Nam, K.H. AI-based protein models enhance the accuracy of experimentally determined protein crystal structures. Front. Mol. Biosci. 2023, 10, 1208810. [Google Scholar] [CrossRef] [PubMed]
  54. Joosten, R.P.; Long, F.; Murshudov, G.N.; Perrakis, A. The PDB_REDO server for macromolecular structure model optimization. IUCrJ 2014, 1, 213–220. [Google Scholar] [CrossRef] [PubMed]
  55. Eli, P.; Chakrabartty, A. Variants of DsRed fluorescent protein: Development of a copper sensor. Protein Sci. 2006, 15, 2442–2447. [Google Scholar] [CrossRef]
Figure 1. Purification and crystallization of mDsRed. (a) Gel filtration profile of mDsRed. (Insert) Purity of mDsRed on SDS-PAGE. Fractions indicated by the red line were concentrated for crystallization. (b) Photo of mDsRed crystals. The mDsRed crystal used for collecting the diffraction data is indicated by a yellow arrow.
Crystals 14 00062 g001
Figure 2. Overall and surface structure of mDsRed. (a) Cartoon representation of mDsRed. Surface structure of (b) mDsRed-B molecules in the asymmetric unit and (c) the previously determined mDsRed (PDB code: 2VAD). Red circle and line indicate the hole between the β7- and β10-strands of mDsRed-B and mDsRed-2VAD.
Crystals 14 00062 g002
Figure 3. Structural flexibility of the mDsRed chromophore. (a) 2mFo-DFc (blue mesh, 1.0 σ) and mFo-DFc (green mesh, 3.0 σ and red mesh, −3.0 σ) electron density maps of the mDsRed chromophore. (b) Conformation of the mDsRed chromophore. (c) Superimposition of the mDsRed chromophores with DsRed-2VAD.
Crystals 14 00062 g003
Figure 4. Analysis of the temperature factor of mDsRed structures. (a) B-factor putty representation of mDsRed-A, mDsRed-B, and the previously determined mDsRed (PDB code: 2VAD). (b) Profile of the normalized B-factor for the mDsRed-A (blue), mDsRed-B (red), and mDsRed-2VAD (green).
Crystals 14 00062 g004
Figure 5. Structural comparison of side chains in mDsRed structures. (a) The crystal structure of metal ion-bound mDsRed-2VAD (PDB code 2VAD). Zn and Cl ions are indicated by yellow and green spheres, respectively. (b) Close-up view of the zinc binding site in mDsRed-2VAD (PDB code 2VAD). (c) Superimposition of the Zn binding site of mDsRed-2VAD (white), with mDsRed-A (raspberry) and mDsRed-B (cyan) determined in this experiment.
Crystals 14 00062 g005
Figure 6. Analysis of mDsRed-2VAD, (a) 2mFo-DFc (blue mesh, 1.0 σ), and mFo-DFc (green mesh, 3.0 σ and red mesh, −3.0 σ) electron density maps for the mDsRed-2VAD and mDsRed-2VAD re-chromophores refined by PDB-REDO. (b) Stick representation of the chromophore in mDsRed-2VAD and mDsRed-2VAD re-refined by PDB-REDO.
Crystals 14 00062 g006
Table 1. Data collection and refinement statistics of mDsRed.
Data CollectionmDsRed
X-ray source7C beamline, PLS-II
X-ray energy (eV)14,820
Space groupP21
Unit cell dimension
a, b, c (Å)
α, β, γ (°)

39.56, 107.00, 50.02
90.00, 104.86, 90.00
Resolution (Å)50.0–2.90 (2.95–2.90)
Unique reflections8136 (362)
Completeness (%)91.5 (80.6)
Redundancy2.8 (2.1)
I/σ12.62 (4.04)
Rmerge0.157 (0.354)
Rmeas0.152 (0.441)
Rpim0.188 (0.443)
Refinement
Resolution (Å)26.10–2.90
Rwork a0.1966
Rfree b0.2421
RMS deviations
Bonds (Å)0.011
Angles (°)1.680
B factors (Å2)
Protein13.50
Ligand25.53
Ramachandran plot
Favored (%)90.5
Allowed (%)7.9
Disallowed (%)1.6
Values for the outer shell are given in parentheses. a Rwork = Σ||Fobs| Σ |Fcalc||/Σ|Fobs|, where Fobs and Fcalc are the observed and calculated structure factor amplitudes, respectively. b Rfree was calculated as Rwork using a randomly selected subset (10%) of unique reflections not used for structural refinement.
Disclaimer/Publisher’s Note: The statements, opinions and data contained in all publications are solely those of the individual author(s) and contributor(s) and not of MDPI and/or the editor(s). MDPI and/or the editor(s) disclaim responsibility for any injury to people or property resulting from any ideas, methods, instructions or products referred to in the content.

