Article

Influence of Defects-Induced Stresses on Birefringence in SrTiO3 Single Crystals

Institute of Physics, University of Silesia in Katowice, ul. 75 Pułku Piechoty 1, 41-500 Chorzów, Poland
*
Author to whom correspondence should be addressed.
Crystals 2023, 13(7), 985; https://doi.org/10.3390/cryst13070985
Submission received: 30 May 2023 / Revised: 13 June 2023 / Accepted: 19 June 2023 / Published: 21 June 2023
(This article belongs to the Special Issue Electronic Phenomena of Transition Metal Oxides Volume II)

Abstract

:
Significant applications of SrTiO3 single crystals in electronics require knowledge about the influence of structural imperfections on their optical properties. Birefringence temperature changes were investigated in a few SrTiO3 single crystals in a broad temperature range, from 85 K to 250 K. The birefringence was found to be a non-linear function below the transition Ts at 105 K, and non-linear changes in the optical indicatrix orientation accompanied it. A weak residual birefringence was permanently present a dozen degrees above the phase transition temperature Ts. This is mainly connected with dislocations, which induce local stresses and shift transition points even up to about 200 K. The essential role of imperfections on optical properties was studied in a SrTiO3 24° bi-crystal reduced at 1000 K and under low oxygen pressure. In such an intentionally defected crystal, an increase of non-linearities in Δn(T) dependence was observed below and above the transition point Ts.

1. Introduction

The well-known phase transition in SrTiO3 (STO), around 105 K, between the cubic Pm 3 ¯ m and tetragonal I4/mcm (with uniaxial indicatrix) phases, has been studied for decades but has not been completely elucidated so far. Müller and Berlinger [1] showed that the phase transition in SrTiO3 adopts a classical mean-field behaviour, except for a region below Ts. However, between 101 K and TS, the critical exponent β was found to have the value 0.33 ± 0.02. One of the first papers on birefringence measurements in STO proved that an exponent critical value is 0.36 ± 0.02 [2]. In the same paper, a non-linear temperature dependence of birefringence Δn was observed below Ts, with a small local cusp close to Ts. Moreover, some traces of the birefringence could also be recognised a few degrees above the transition point. A later birefringence-imaging study for [110] oriented crystal [3] showed a phase transition close to 105 K with the critical exponent β = 0.5, pointing to a second-order mean-field transition in the whole temperature range below Ts.
On the other hand, in articles [4,5], several dozen Kelvins above the transition temperature, precursor dynamics connected with the presence of low-temperature clusters were discussed. However, the literature often reports the presence of dislocations in STO single crystals [6,7,8,9], which break local symmetry by inserting SrO and TiO2 planes into the crystal matrix [7]. Furthermore, according to [10], the band gap shrinks, causing an increase in conductivity due to the dislocations. Moreover, it was reported in [11] that the presence of domains could have a significant effect on the birefringence. Hence, we decided to re-investigate Δn(T) in a few STO single crystals to find the influence of structural imperfections on their optical properties.
The other way to investigate the impact of dislocation stresses on birefringence is by using a SrTiO3 bi-crystal [7,11,12]. Especially high stresses appear near the bi-crystal boundary and then expand out of it. The effect is magnified if such a crystal is subjected to a redox reaction [13]. During this process, oxygen is removed from the structure, and oxygen vacancies are compensated by electrons and a titanium ion valence change from Ti4+ to Ti3+ [14]. This preferentially occurs inside the dislocations, producing metallic nano-filaments along these extended defects [10,12,15,16,17]. In a single commercial crystal grown by the Verneuil method, the dislocation density is approximately 105/cm2 [9,12,18,19]. This density increases not only after the redox reaction but also during crystal cutting and polishing, especially near the surface region, and can reach 109/cm2 [12]. It must be stressed that such extended defects decide the physical properties in the mesoscale, microscale, and nanoscale [12,13,20]. In this article, we present an investigation of the birefringence for visible light in STO crystals of different thicknesses using light transmitted through them and thus being a result of the interrelation between the bulk and surface. The results allowed us to visualise the inhomogeneous optical properties of STO crystals because of dislocations in their structure, resulting from the crystal growth method, redox reaction, and crystal mechanical processing.

2. Materials and Methods

Commercial SrTiO3 single crystals in [100] orientation with the thickness of 250 µm, 100 µm, and 30 µm and SrTiO3 bi-crystal in [100] orientation with a tilt angle of 24° and thickness of 250 µm, produced by Verneuil growth (CrysTec GmbH, Berlin, Germany), were studied. The crystals’ surfaces were squares of 5 mm × 5 mm.
The crystals were epi-polished on both sides by the manufacturers. Additionally, STO single crystals in [100] orientation with a thickness of 30 µm, grown by the Top Seeded Solution Growth method, were also investigated.
The birefringence measurements were performed using a birefringence imaging system (Metripol, Oxford, UK). The technique’s details can be found in [3,21]. The Metripol consists of three data arrays (maps) representing images of the measured values of φ, |sinδ|, and I0. The arrays are generated by applying the equations defining these values on each pixel. To measure the intensity I of the transmitted light, a CCD detector was used with 1360 × 1024 pixels. Thus the CCD provides about 1.4 million separate measurement points of the transmitted light intensity I. By recording I for ten polariser angles, Equation (1) was used to find maps of φ and |sinδ|. The light intensity, measured by a microscope equipped with a rotating plane-polariser, a circular-polarising analyser, and a CCD camera, is given by the formula [22]:
I = 0.5 I0 × [1 + sin(2φ − 2α) × sinδ]
where I0 is the intensity of polarised light passing through the sample (transmittance), α is the angular position of the analyser as it rotates, and φ is the angle of the slow axis of the indicatrix (indicatrix orientation) with respect to the horizontal axis of the microscope. The parameter δ is the retardance for the sample of a thickness t between the two orthogonal components of the polarised light, and given by:
δ = (2π/λ) × Δn × t
Here Δn means birefringence of the sample, and the wavelength of the light was λ = 570 nm. The absolute values of |sinδ| and φ are shown on colour maps. When the |sinδ|values are small, then the relation |sinδ| ≈ δ is well fulfilled, and the Δn could be calculated directly from relation (2) provided the |sinδ| continuously goes to zero at TS. In such cases, the Δn(T) and φ(T) runs are determined for selected areas from the maps.
The sample was heated in a high-precision Linkam TMSG600 (LINKAM SCIENTIFIC INSTRUMENTS LTD.,Surrey, UK) temperature stage with a heating/cooling rate of 0.1 or 1 K/min. This hot stage maintains a temperature within an accuracy of 0.1 K. Thermal reduction of the bi-crystal was conducted at 950 °C for 0.5 h under O2 pressure of 1 × 10⁻¹² bar.
The STO crystals were highly transparent for birefringence measurements in the whole temperature range. It is assumed that below the continuous transition, such measurements enable the critical exponent β to be computed according to the relationship:
∆n(T) ~ (TS − T)
where exponent β = 0.5 is expected for a continuous (second-order) mean-field transition. In this equation, ∆n is the linear birefringence, and TS is the transition point. Equation (3) can be written in the following form:
∆n(t) = const · (t)
where t is the reduced temperature given by the ratio (TS − T)/TS. Hence, measuring ∆n as a function of temperature, the exponent β can be determined using:
ln(∆n) = ln(const) + 2β ln(t)
Such a procedure has been applied to determine β from the experimental results in Figure 1.

3. Results

This article compares the birefringence measurements for a few commercial STO single crystals oriented in [100], mechanically polished, and of different thicknesses. While some literature data on the Δn(T) runs are reported [2,3,5], there is a lack of information about the simultaneous temperature changes of the indicatrix orientation φ and birefringence Δn. Both φ and Δn have been determined for optically homogeneous crystal areas or inside a single domain. The behaviour was different for different regions, even in the same sample. Interestingly, these data allowed us to consider the influence of extended defects on birefringence in a broad temperature below and above Ts. Additionally, to prove the impact of extended defects, we compare an intentionally defective structure upon thermal reduction near and far from the bi-crystal boundary.

3.1. Birefringence and Optical Indicatrix Orientations in SrTiO3 Single Crystals

Figure 1a presents the temperature change of birefringence Δn in a [100] SrTiO3 single crystal of 100 µm thickness on heating with a 0.1 K/min temperature rate. Although the orientation of the indicatrix was constant, as expected for this structural transition (green points in Figure 1a), the temperature dependence of birefringence is almost consistent with a second-order phase transition. Figure 1b shows calculations of the critical exponent β, which takes values not far from that expected for a second-order transition. The characteristic is that above 100K a non-linear Δn(T) run begins, as also observed in [2], and is connected with the appearance of nano-ferroelastic domains because of defect-induced local stresses rather than due to critical fluctuations as suggested in [1].
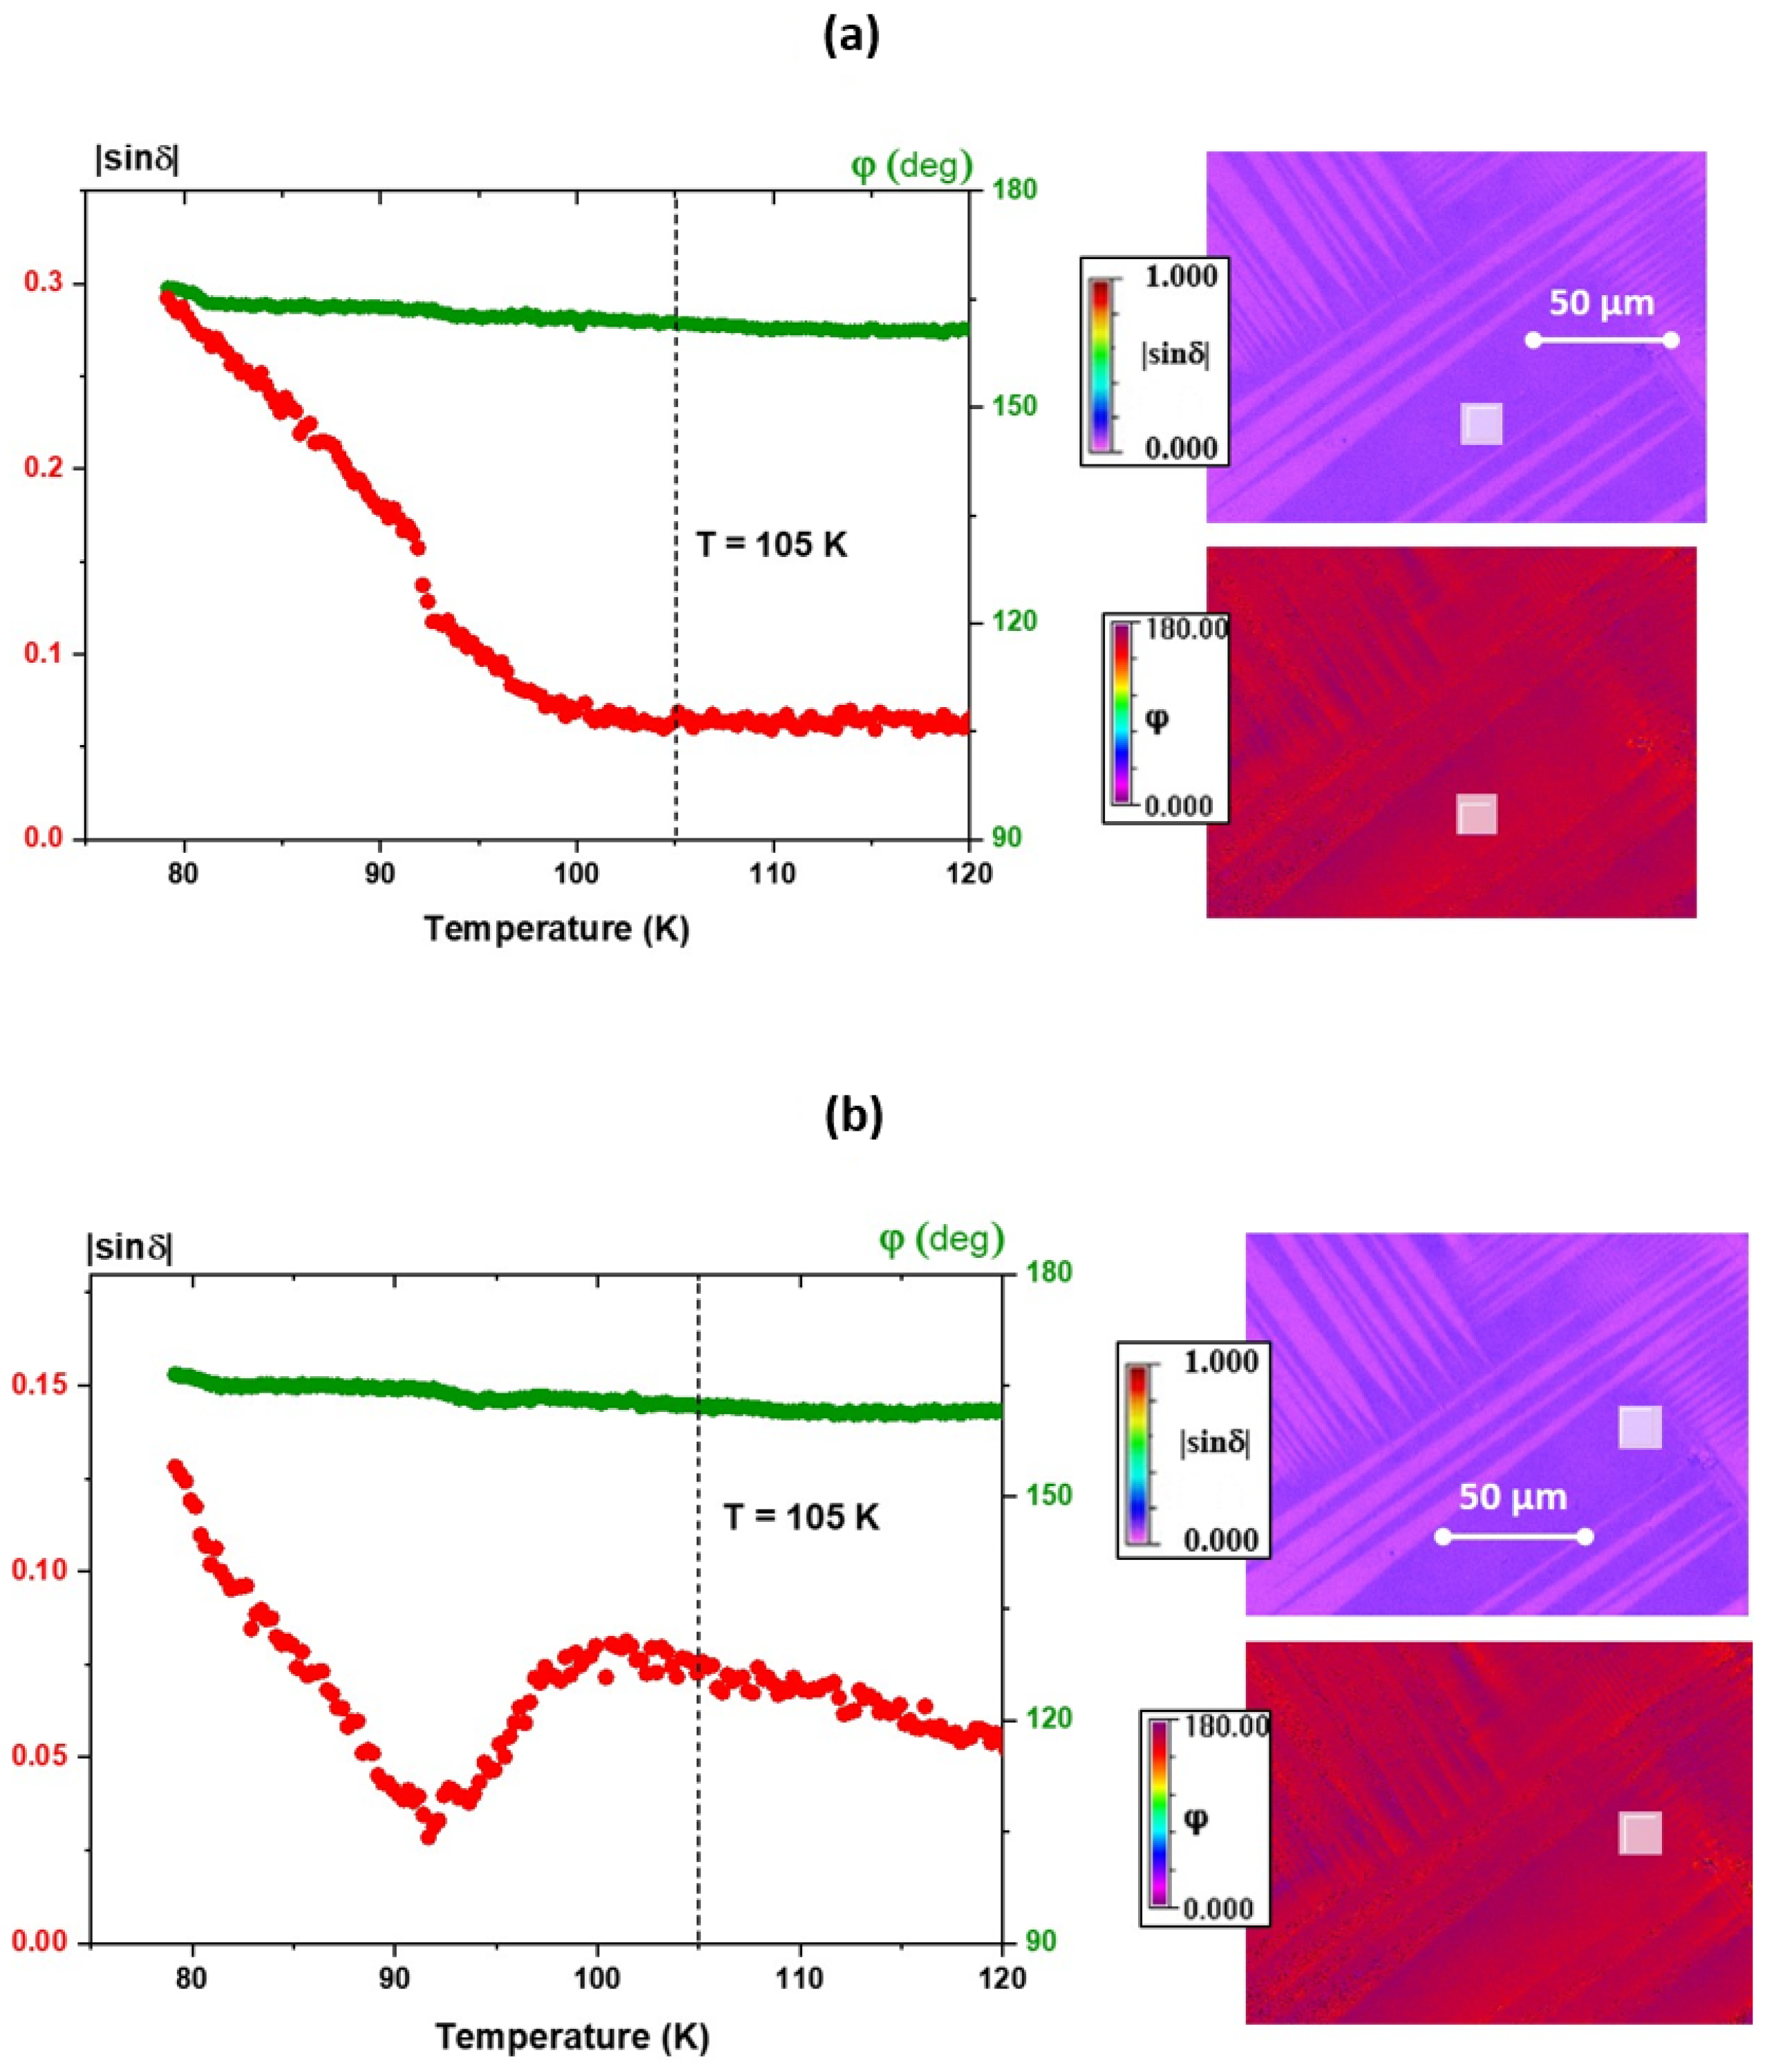
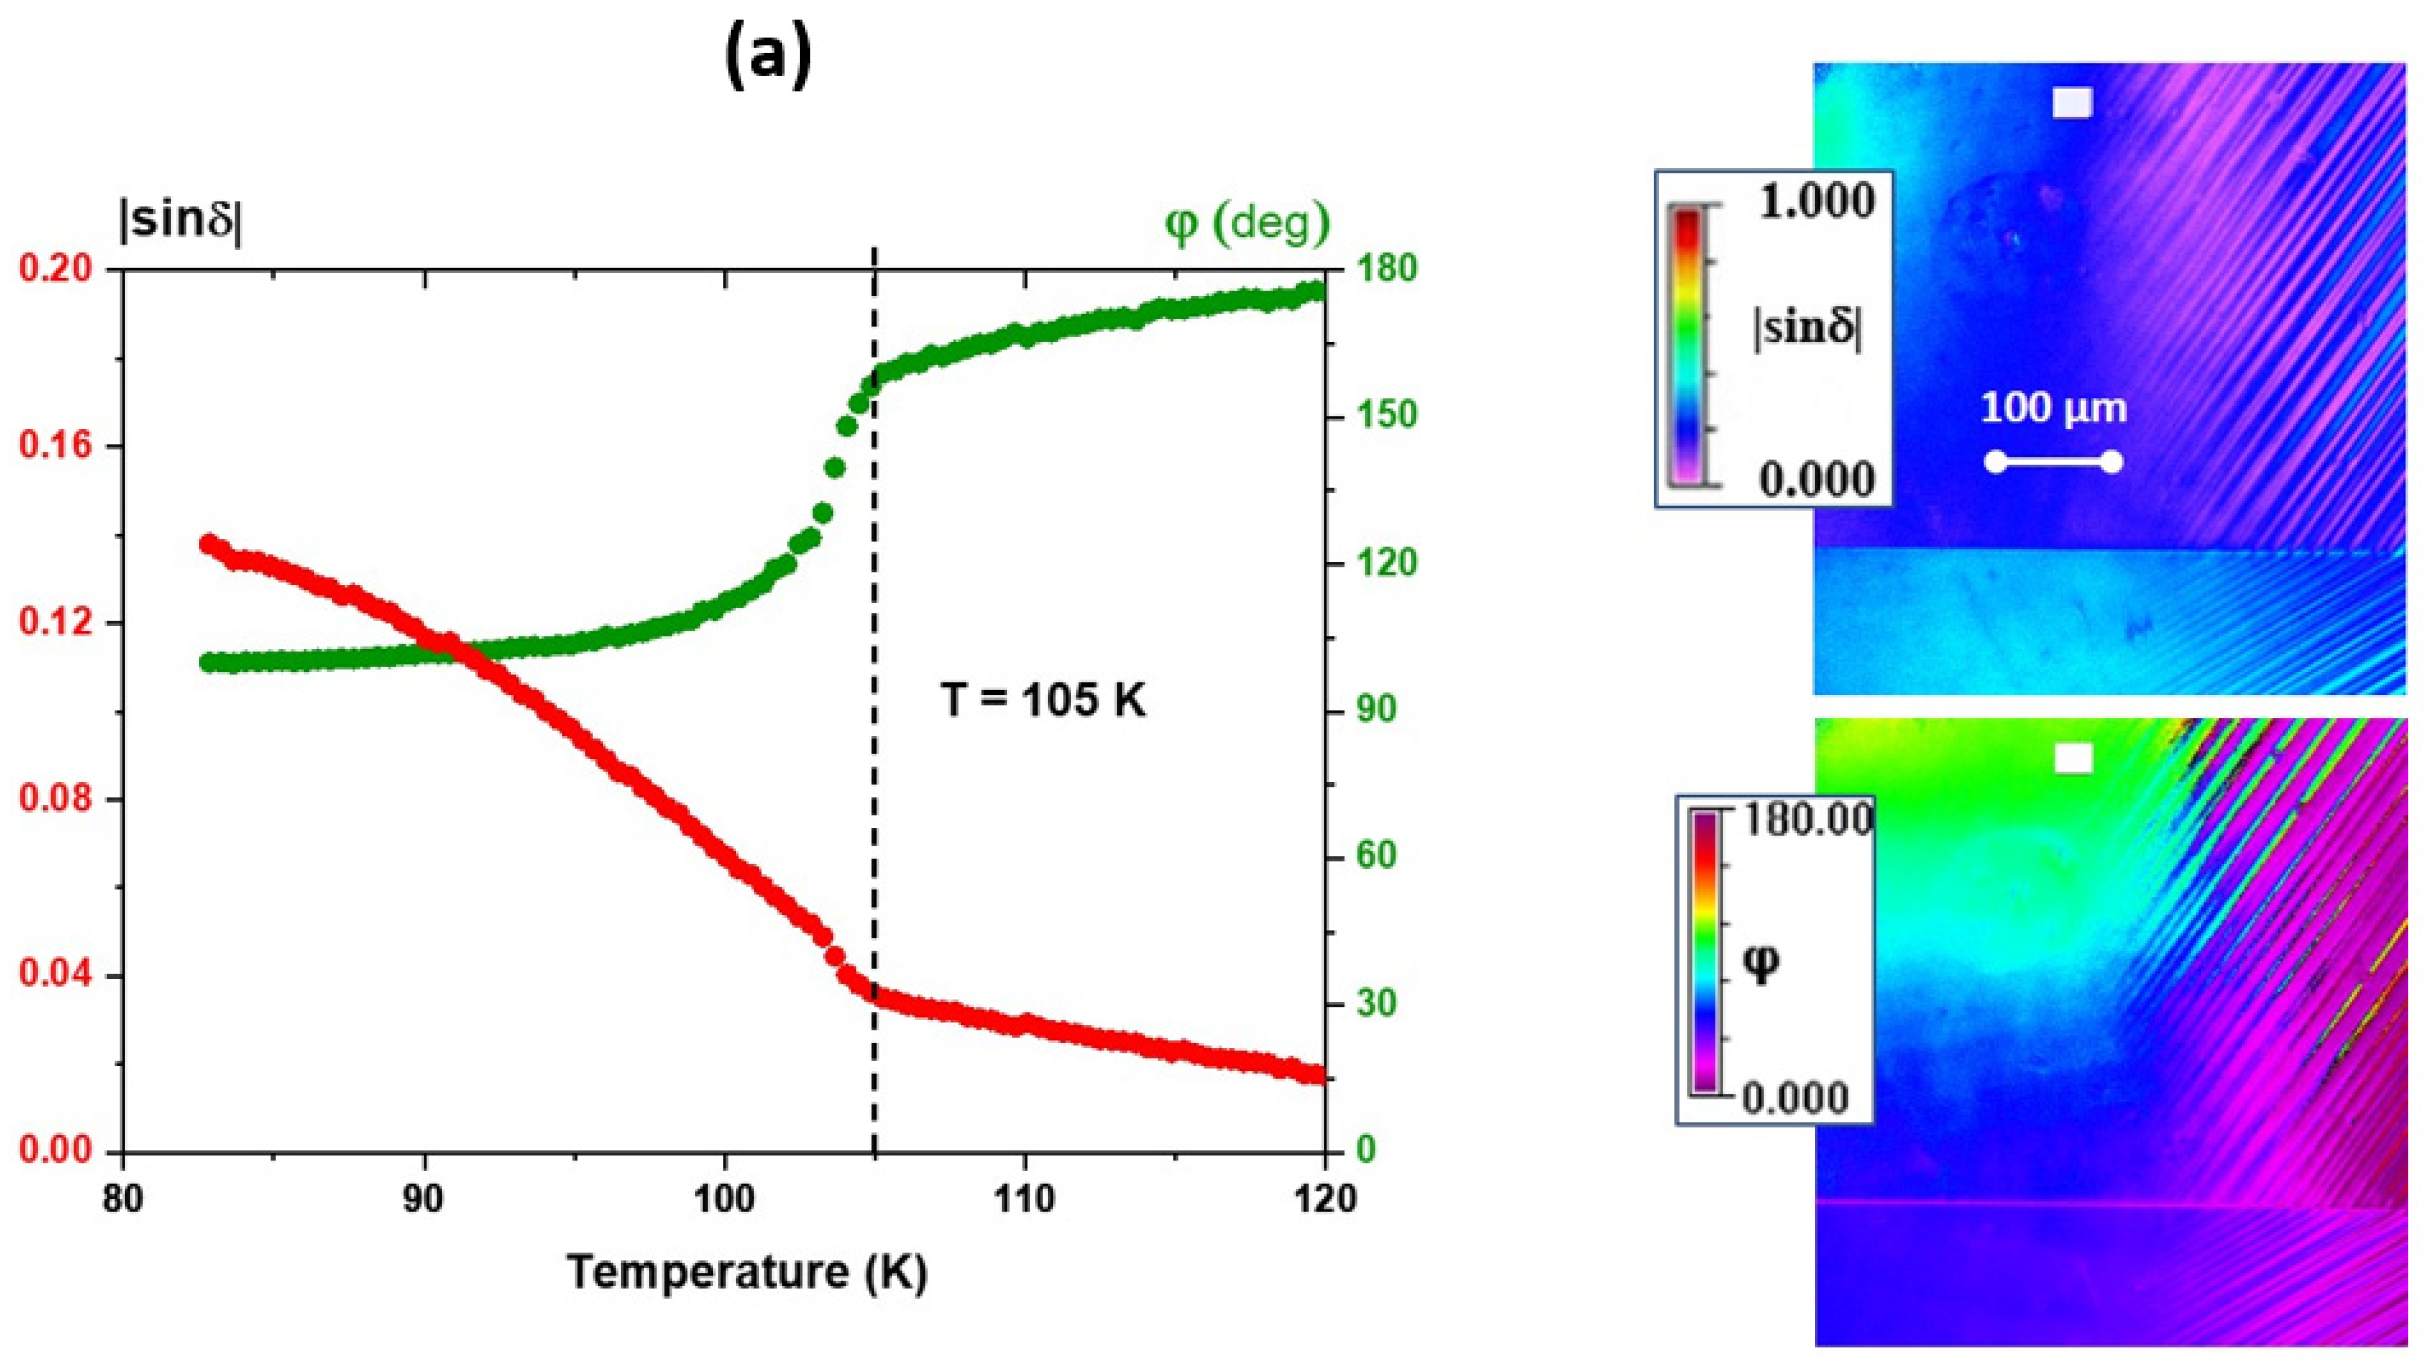
For other investigated STO crystals, the φ(T) runs did not take a constant value, as expected for this structural transition, and direct calculations of birefringence Δn cannot be conducted. Figure 2 and Figure 3 show the temperature dependence of |sinδ| and φ(T) near Ts for areas with a homogenous data distribution (areas of homogeneous colour on the |sinδ| map). As is seen, in each crystal, |sinδ| is a strongly non-linear function of temperature below transition at Ts. To better follow the results obtained, their description is included in the extended captions under the figures.
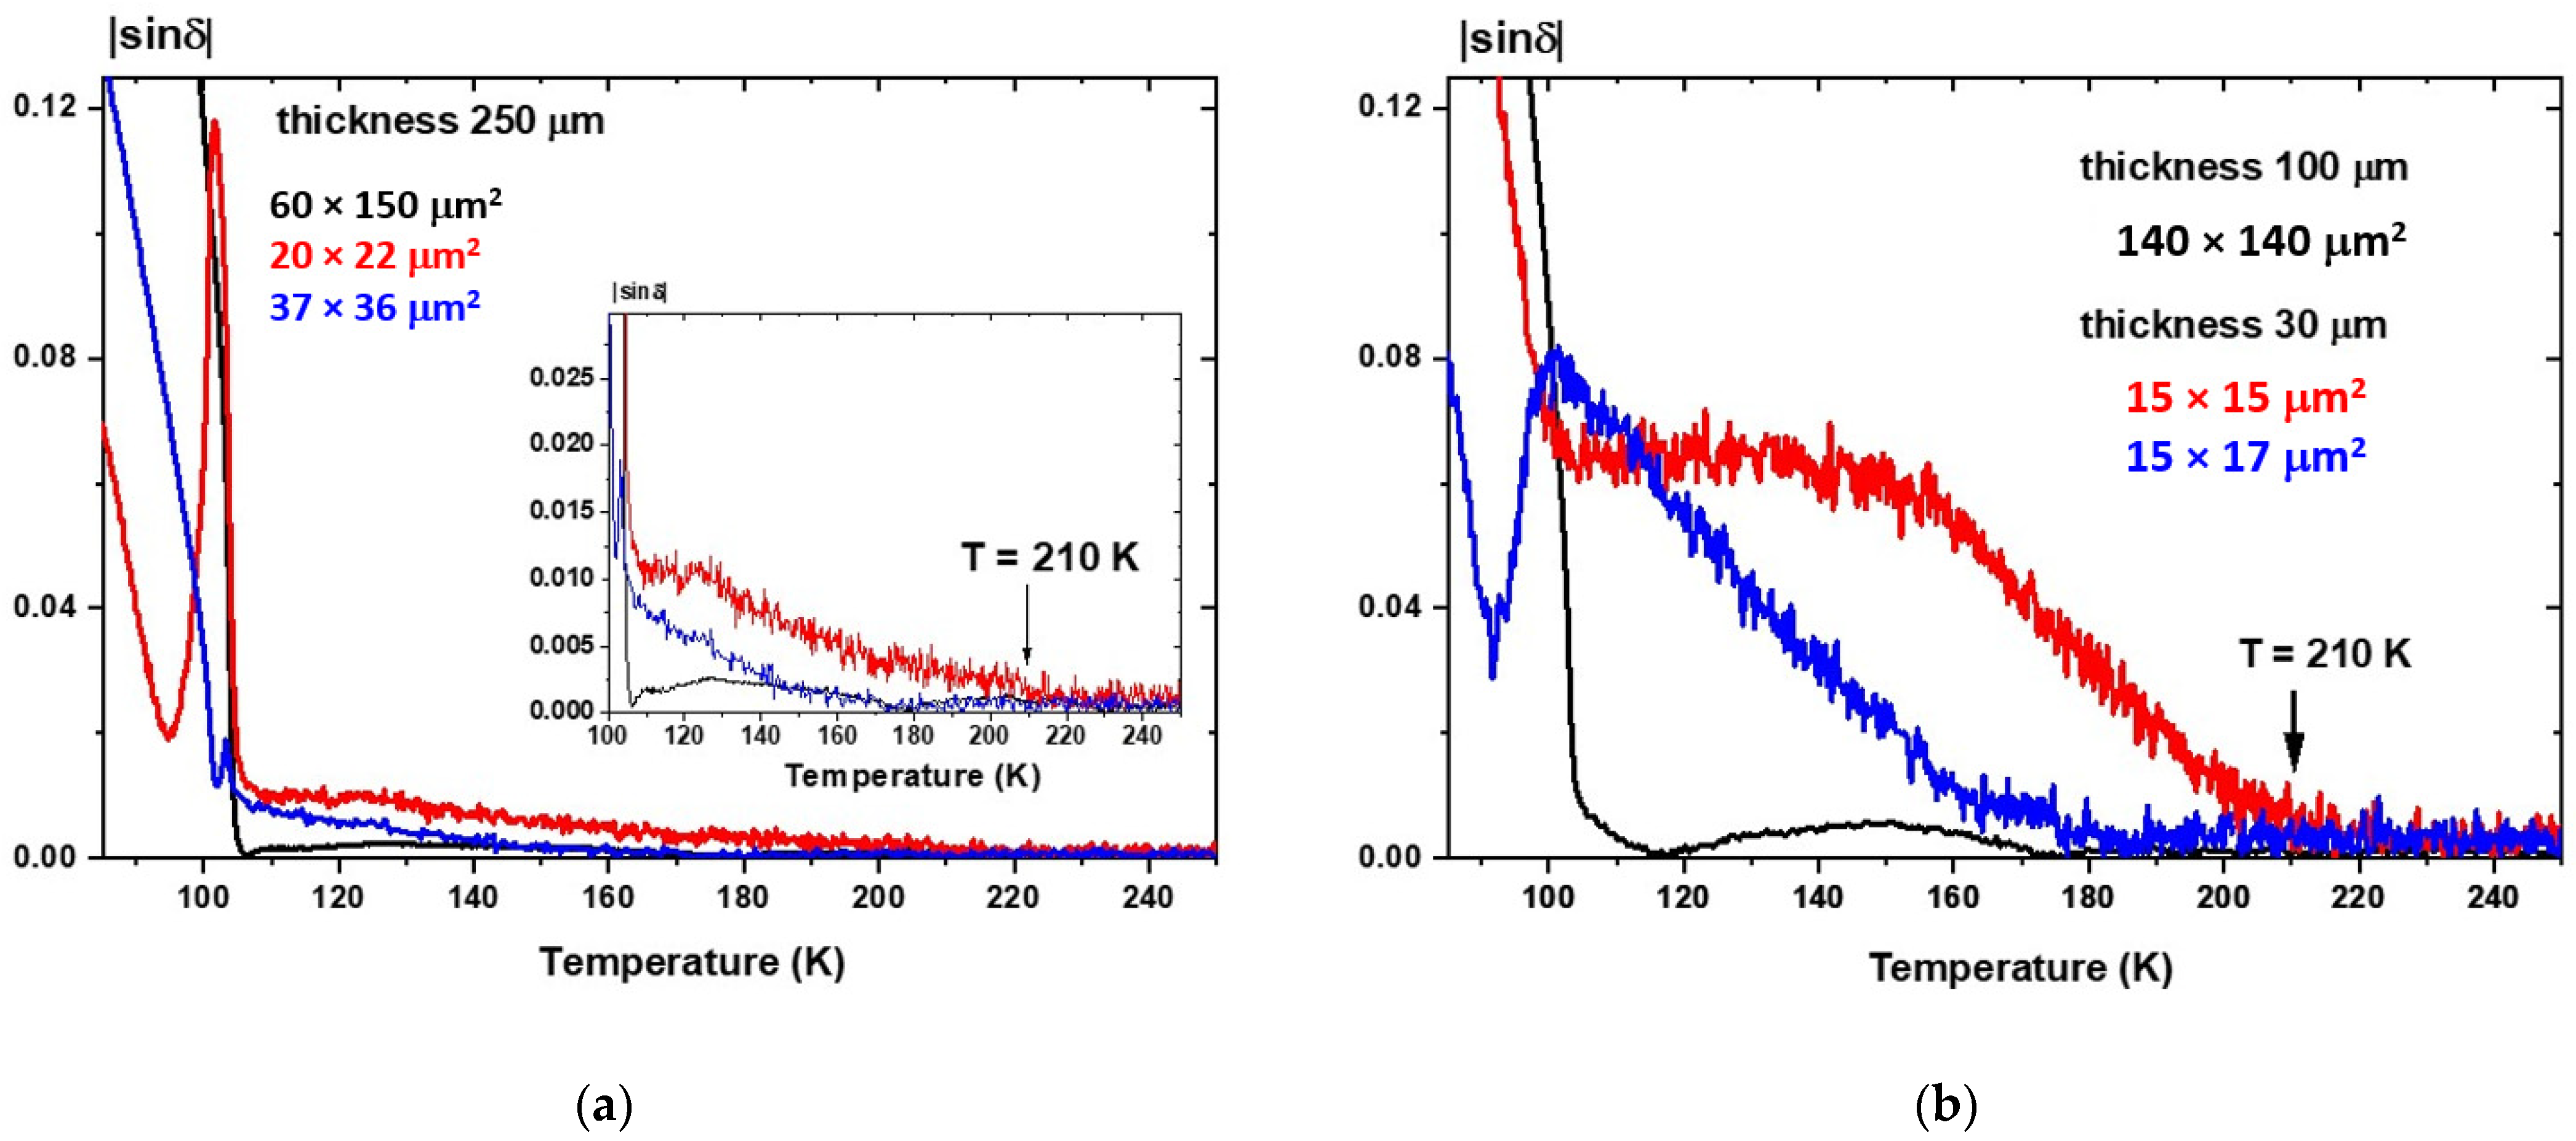
The investigations of the optical STO properties in a broad temperature range have revealed the different birefringence behaviours below Ts. Moreover, it was impossible to extract the value of Ts, and hence we have an arbitrary denoted transition point at 105 K. However, in every investigated single crystal, regardless of their thickness and regions taken for calculations, non-zero birefringence existed up to dozens of degrees above Ts (Figure 4). We have found that the threshold of birefringence disappearance was near 210 K.

3.2. Birefringence and Optical Indicatrix Orientations in a SrTiO3 24° Bicrystal

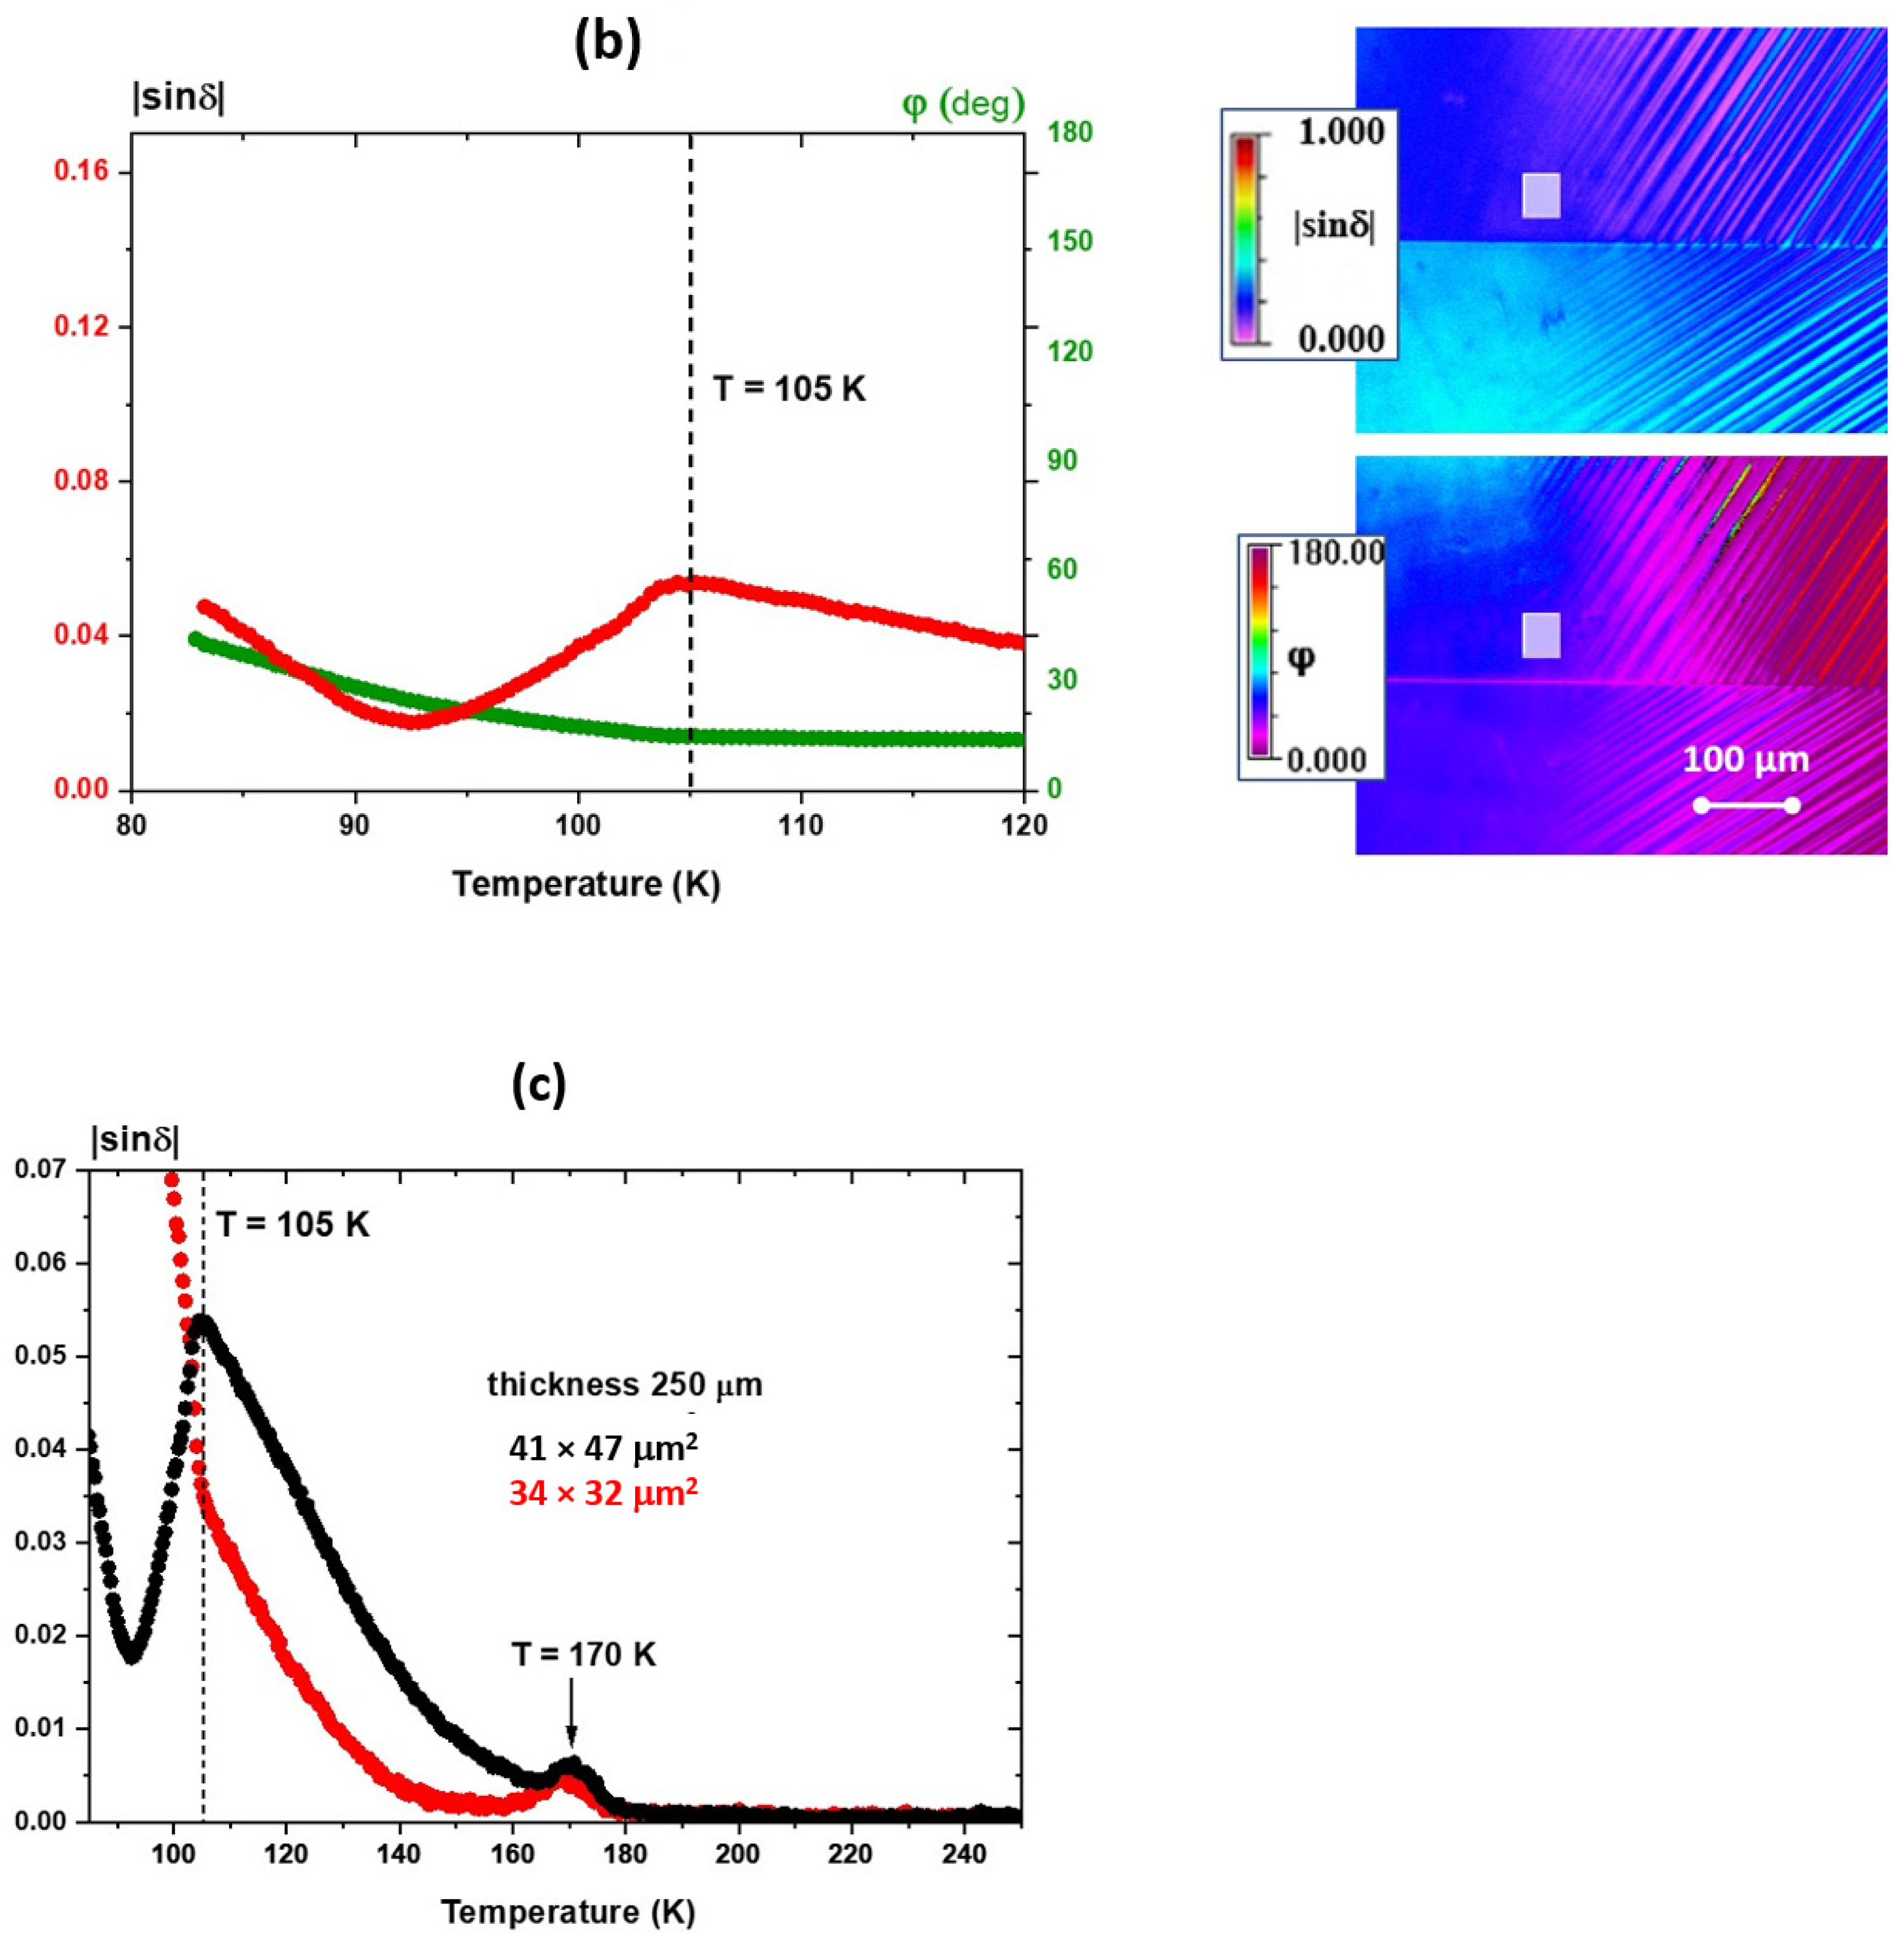
It is known that regions with a high density of dislocations are created in bi-crystals, especially at the boundary between the tilted STO counterparts. Such an accumulation near a boundary must impact the electrical and optical properties [29]. As reported in [12], the ideal distribution of dislocations along the boundary is characterised by a distance of a few nm. It is expected that the extended defects, such as dislocations in bi-crystals reported in [6,7,12], should have a high impact on the optical properties of SrTiO3. Indeed, it was reported in [25] that in the SrTiO3 bi−crystal with a tilt angle of 24°, there are highly defected regions of 0.1–1 μm in diameter. In this study, we describe experimental results on the same STO bi-crystal, and we have observed a much more defective structure near the bi-crystal boundary. The results are shown in Figure 5 and Figure 6 and commented on in their captions. Interestingly, the temperature point of complete disappearance of birefringent regions occurs near 170 K, independent of the distance between the considered areas to the bi-crystal boundary.
Table 1 presents the most characteristic features of the investigated commercial STO single crystal. Discrepancies are prescribed to defects, mainly dislocations, produced during the growing process or mechanical treatment of the crystal surfaces (polishing).

4. Discussion

Strontium titanate is ferroelastic perovskite and undergoes structural phase transitions near 105 K between the cubic and the tetragonal structures near Ts [26] with space groups notation Pm 3 ¯ m and I4/mcm [3,27], respectively. Certainly, it is worth mentioning that the tetragonality is extremely small at this transition and is of the order of c/a ~ 1.0005. In addition, surface properties differ from the bulk because the defect concentration depends on the sample depth [30,31] and impacts crystallographic parameters, such as mosaicity [7,12] and lattice parameter variation. As Hünnefeld et al. [30] proved, the occurrence of a long-range strain gradient gives rise to phase transition temperatures in the bulk of the different SrTiO3 samples between 98.7 K and 105.8 K. In recent years, special attention has been devoted to the presence of dislocations and their role in [6,7,10,12,15,24,29,30,32,33,34,35,36,37,38,39]. Unsurprisingly, an increase in the transition temperature in a region close to an edge dislocation can be extremely high and reach 255 K and even 340 K, as reported in [9]. We consider that, as described above, the unreproducible results on birefringence below Ts, change from crystal to crystal and from neighbouring areas, resulting from the presence of dislocations.
Interestingly, in all the investigated crystals, the birefringence, although not of the same dependence, was observed until 210 K. This looks like a shift of structural phase transition due to defect-induced stress. Assuming that it is connected with dislocations, we adopted the consideration by Wang et al. [9] to estimate stresses induced by these dislocations. The free energy of the tetragonal SrTiO3 is lowered in the strained regions in the sample and is described by the Landau free-energy density F:
F = 0.5 × [T − (Ts+ Kσ)] Q2 + …
where K is a constant in the term describing the coupling between the stress σ and the order parameter Q. This free-energy density F indicates the existence of regions with an increase of the transition temperature Ts by an amount equal to Kσ due to the actions of the stress σ:
Ts’ = Ts + Kσ
This means that some regions with non-paraelectric phases may exist above the transition point Ts. According to our studies (Figure 4 and Figure 6c), the Ts’ = 210 K and Ts = 105 K. If we designate K = 28 K/GPa for SrTiO3 in [28], the calculated stress σ = 3.75 GPa. At such a value, the theoretical calculations for SrTiO3 [40] predict a phase with tetragonal symmetry with antiferrodistortive instability and its interaction with ferroelectricity. Thus, the observed birefringence in a few STO crystals up to 210 K can be understood. It is worth mentioning that the stress field of a dislocation was established as σ(r) = r−1 at a point a distance r from an edge dislocation [9]. Because it is known that the density of the dislocations decreases with increasing depth from the crystal surface, the high dislocation density in the surface region gives a relatively high birefringence above 105 K. The proof can be seen in the thin (30 µm) STO crystal in Figure 5b. Another piece of evidence of stress-induced birefringence is provided by first-principles calculations [40]. It was shown that pressure strongly impacts the transition point in STO (Figure 2 and Figure 3 in [40]). For pressure about 4 GPa, i.e., as calculated above, the transition to the cubic phase is expected to be near 200 K, as in our experimental observation.
It is also worth noting that two-time scales in STO have been discussed [5]. The first is connected with static-ordered domains produced by surface long-range order defects, and the second is with frozen impurities giving rise to a central peak in scattering experiments. The latter occurs around 180 K, roughly at the same temperature, and is caused by finite-size dynamical clusters preceding the phase transition, thus questioning the notion that the transition is purely displacive in STO. Such clusters can, however, be induced by the presence of heterogeneously distributed dislocations in the whole crystal volume.
It was revealed in [39,41] that in the dislocation core, the region of Sr depletion is enriched in Ti of lower valence than Ti4+. Local co-ordinations of the edge-sharing TiO6 octahedra point to a local strain (tension) were produced because of the existence of dislocations. This local strain causes the appearance of a face-centred-cubic TiO phase, which is formed around the dislocation cores. The TiO lattice constant is larger than STO, and the TiO6 octahedra accommodates that tensional strain. Hence, dislocation-induced strain modifies the local STO structure, which birefringence measurements detect.
In the article [2], birefringence measurements were performed on a monodomain platelet of thickness 0.27 mm. Hence, a birefringence tail, presented in Figure 2 in that article, was explained by anisotropic fluctuations in the oxygen octahedra tilt angle. Such a cusp was also observed by us too and presented in Figure 2c, but it was not universal behaviour. Depending on crystal thickness and degree of defects (dislocations) density, the temperature dependencies of birefringence near TS were different and non-repeatable. Hence, we suggest that this cusp is associated either with stacked domains throughout the crystal thickness or local stresses because of dislocations producing local ferroelectric nano-domains below TS and is not an inherent feature of the transition.

5. Conclusions

We have shown that the optical properties of commercial STO single crystals reveal heterogeneous optical properties (in the range of visible light) in a broad temperature range. This is seen by studies of the birefringence, which behaves non-linearly below the transition at TS around 105 K, and which exists locally even at 200 K. Only above this temperature do the optical properties stabilise, although in the nanoscale—due to the dislocations—local ferroelectric, ferroelastic and piezoelectric properties can be found at higher temperatures. This is clearly seen in the case of the bi-crystal SrTiO3 in Figure 5 and Figure 6. While fine-domain structure disappears, as expected, at the transition point, the crystal became weakly birefringent far above the transition. In particular, the boundary between the tilted crystals was birefringent up to room temperature, with strongly birefringent points along the boundary, which may be explained as being due to bundles of dislocations. Based on these data, we consider that these dislocations influence the irregular changes in birefringence and optical indicatrix presented in Figure 2, Figure 3 and Figure 4. It was proved in articles [23,24,25,26,27,28] that the main role among the defects in STO is dislocations, which are created during crystal growth. Another factor introducing high-density dislocations in STO is crystal polishing. This was observed in a thin crystal with a thickness of 30 µm (Figure 4). It is worth mentioning that the highest dislocation density in the surface region occurs even up to a thickness of about 30 µm [12]. That is why Figure 3b shows no trace of a transition expected near 105 K, but which was pushed far above the transition point compared to a potentially stress-free crystal.
All this should be considered when commercial STO single crystals are used in optical and electronic applications, as they depend mainly on the electronic structure. As reported in [16], the core of dislocations investigated using scanning transmission microscopy (EDX with atomic resolution) and electron-energy loss spectroscopy showed essential differences in the electronic structure in the core of dislocations and the matrix. Mostly t is because of the presence of the Ti3+ ions and oxygen ions, which leads to local electron density fluctuations and much higher conductivity. It is worth stressing that STO reduction under low oxygen partial pressure or due to an electro-degradation process can easily modify this electronic structure. It can even cause a switch from a semiconducting to a metallic state for STO crystals. Birefringence described in this article is one of the physical properties showing the influence of such processes on STO properties.

Author Contributions

Conceptualisation, methodology, validation, investigation, writing, original draft preparation and editing, I.L., K.S. and K.R. All authors have read and agreed to the published version of the manuscript.

Funding

This research received no external funding.

Data Availability Statement

Data can be available on personal requests.

Acknowledgments

The authors are grateful to A.M. Glazer for the fruitful discussions and critical reading of the manuscript.

Conflicts of Interest

The authors declare no conflict of interest.

References

  1. Müller, K.A.; Berlinger, W. Static Critical Exponents at Structural Phase Transitions. Phys. Rev. Lett. 1971, 26, 13–16. [Google Scholar] [CrossRef]
  2. Courtens, E. Birefringence of SrTiO3 Produced by the 105 °K Structural Phase Transition. Phys. Review Lett. 1972, 29, 1380. [Google Scholar] [CrossRef]
  3. Geday, M.; Glazer, A.M. Birefringence of SrTiO3 at the ferroelastic phase transition. J. Physics: Condens. Matter 2004, 16, 3303–3310. [Google Scholar] [CrossRef]
  4. Bussmann-Holder, A.; Köhler, J.; Kremer, R.K.; Law, J.M. Relation between structural instabilities in EuTiO3 and SrTiO3. Phys. Rev. B 2011, 83, 212102. [Google Scholar] [CrossRef] [Green Version]
  5. Roleder, K.; Bussmann-Holder, A.; Górny, M.; Szot, K.; Glazer, A. Precursor dynamics to the structural instability in SrTiO3. Phase Transit. 2012, 85, 939–948. [Google Scholar] [CrossRef]
  6. Rodenbücher, C.; Bittkau, K.; Bihlmayer, G.; Wrana, D.; Gensch, T.; Korte, C.; Krok, F.; Szot, K. Mapping the conducting channels formed along extended defects in SrTiO3 by means of scanning near-field optical microscopy. Sci. Rep. 2020, 10, 17763. [Google Scholar] [CrossRef]
  7. Rodenbücher, C.; Wrana, D.; Gensch, T.; Krok, F.; Korte, C.; Szot, K. The Electronic Properties of Extended Defects in SrTiO3—A Case Study of a Real Bicrystal Boundary. Crystals 2020, 10, 665. [Google Scholar] [CrossRef]
  8. Zubko, P.; Catalan, G.; Buckley, A.; Welche PR, L.; Scott, J.F. Strain-gradient-induced polarization in SrTiO3 single crystals. Phys. Rev. Lett. 2007, 99, 167601. [Google Scholar] [CrossRef] [Green Version]
  9. Wang, R.; Zhu, Y.; Shapiro, S. Structural defects and the origin of the second length scale in SrTiO3. Phys. Rev. Lett. 1998, 80, 2370. [Google Scholar] [CrossRef]
  10. Szot, K.; Speier, W.; Bihlmayer, G.; Waser, R. Switching the electrical resistance of individual dislocations in single-crystalline SrTiO3. Nat. Mater. 2006, 5, 312–320. [Google Scholar] [CrossRef]
  11. Yamamoto, T.; Oba, F.; Ikuhara, Y.; Sakuma, T. Current-Voltage Characteristics Across Small Angle Symmetric Tilt Boundaries in Nb-Doped SrTiO3 Bicrystals. Mater. Trans. 2002, 43, 1537–1541. [Google Scholar] [CrossRef] [Green Version]
  12. Szot, K.; Bihlmayer, G.; Speier, W. Nature of the Resistive Switching Phenomena in TiO2 and SrTiO3: Origin of the Reversible Insulator–Metal Transition, in Solid State Physics; Elsevier: Amsterdam, The Netherlands, 2014; pp. 353–559. [Google Scholar]
  13. Wrana, D.; Rodenbücher, C.; Bełza, W.; Szot, K.; Krok, F. In situ study of redox processes on the surface of SrTiO3 single crystals. Appl. Surf. Sci. 2018, 432, 46–52. [Google Scholar] [CrossRef]
  14. Waser, R.; Dittmann, R.; Staikov, G.; Szot, K. Redox-based resistive switching memories–nanoionic mechanisms, prospects, and challenges. Adv. Mater. 2009, 21, 2632–2663. [Google Scholar] [CrossRef]
  15. Marrocchelli, D.; Sun, L.; Yildiz, B. Dislocations in SrTiO3: Easy To Reduce but Not so Fast for Oxygen Transport. J. Am. Chem. Soc. 2015, 137, 4735–4748. [Google Scholar] [CrossRef]
  16. Szot, K.; Rodenbücher, C.; Bihlmayer, G.; Speier, W.; Ishikawa, R.; Shibata, N.; Ikuhara, Y. Influence of Dislocations in Transition Metal Oxides on Selected Physical and Chemical Properties. Crystals 2018, 8, 241. [Google Scholar] [CrossRef] [Green Version]
  17. Spinelli, A.; Torija, M.A.; Liu, C.; Jan, C.; Leighton, C. Electronic transport in doped SrTiO3: Conduction mechanisms and potential applications. Phys. Rev. B 2010, 81, 155110. [Google Scholar] [CrossRef]
  18. Yoshimura, J.; Sakamoto, T.; Usui, S.; Kimura, S. X-ray perfection study of Verneuil-grown SrTiO3 crystals. J. Cryst. Growth 1998, 191, 483–491. [Google Scholar] [CrossRef]
  19. Rodenbücher, C.; Luysberg, M.; Schwedt, A.; Havel, V.; Gunkel, F.; Mayer, J.; Waser, R. Homogeneity and variation of donor doping in Verneuil-grown SrTiO3:Nb single crystals. Sci. Rep. 2016, 6, 32250. [Google Scholar] [CrossRef] [Green Version]
  20. Rodenbücher, C.; Bihlmayer, G.; Speier, W.; Kubacki, J.; Wojtyniak, M.; Rogala, M.; Wrana, D.; Krok, F.; Szot, K. Local surface conductivity of transition metal oxides mapped with true atomic resolution. Nanoscale 2018, 10, 11498–11505. [Google Scholar] [CrossRef]
  21. Geday, M.A.; Kaminsky, W.; Lewis, J.G.; Glazer, A.M. Images of absolute retardance L. Deltan, using the rotating polariser method. J. Microsc. 2000, 198, 1–9. [Google Scholar] [CrossRef] [Green Version]
  22. Glazer, A.M.; Lewis, J.G.; Kaminsky, W. An automatic optical imaging system for birefringent media. Proc. R. Soc. A Math. Phys. Eng. Sci. 1996, 452, 2751–2765. [Google Scholar] [CrossRef]
  23. Masuda, K.; Le Van, L.; Shimada, T.; Kitamura, T. Topological ferroelectric nanostructures induced by mechanical strain in strontium titanate. Phys. Chem. Chem. Phys. 2019, 21, 22420–22428. [Google Scholar] [CrossRef] [PubMed]
  24. Masuda, K.; Van Lich, L.; Shimada, T.; Kitamura, T. Periodically-arrayed ferroelectric nanostructures induced by dislocation structures in strontium titanate. Phys. Chem. Chem. Phys. 2019, 21, 22756–22762. [Google Scholar] [CrossRef] [PubMed]
  25. McDaniel, E.B.; Hsu, J.W.P. Direct imaging of submicron-scale defect-induced birefringence in SrTiO3 bicrystals. J. Appl. Phys. 1998, 84, 189–193. [Google Scholar] [CrossRef] [Green Version]
  26. Koyama, Y.; Moriyasu, T.; Okamura, E.; Yamada, Y.; Tanaka, K.; Kohmoto, T. Doping-induced ferroelectric phase transition in strontium titanate: Observation of birefringence and coherent phonons under ultraviolet illumination. Phys. Rev. B 2010, 81, 024104. [Google Scholar] [CrossRef] [Green Version]
  27. Aizu, K. Determination of the State Parameters and Formulation of Spontaneous Strain for Ferroelastics. J. Phys. Soc. Jpn. 1970, 28, 706–716. [Google Scholar] [CrossRef]
  28. Okai, B.; Yoshimoto, J. Pressure dependence of the structural phase transition temperature in SrTiO3 and KMnF3. J. Phys. Soc. Jpn. 1975, 39, 162–165. [Google Scholar] [CrossRef]
  29. Kurt, O.; Le, T.; Sahu, S.K.; Randall, C.A.; Ren, Y. Assessment of Strain Relaxation and Oxygen Vacancy Migration Near Grain Boundary in SrTiO3 Bicrystals by Second Harmonic Generation. J. Phys. Chem. C 2020, 124, 11892–11901. [Google Scholar] [CrossRef]
  30. Hünnefeld, H.; Niemöller, T.; Schneider, J.R.; Rütt, U.; Rodewald, S.; Fleig, J.; Shirane, G. Influence of defects on the critical behavior at the 105 K structural phase transition of SrTiO3: On the origin of the two length scale critical fluctuations. Phys. Rev. B 2002, 66, 014113. [Google Scholar] [CrossRef]
  31. Rütt, U.; Diederichs, A.; Schneider, J.R.; Shirane, G. Depth dependence of strain, mosaicity and sharp component in the critical scattering of SrTiO3. Europhys. Lett. 1997, 39, 395. [Google Scholar] [CrossRef]
  32. Armstrong, M.D.; Lan, K.-W.; Guo, Y.; Perry, N.H. Dislocation-Mediated Conductivity in Oxides: Progress, Challenges, and Opportunities. ACS Nano 2021, 15, 9211–9221. [Google Scholar] [CrossRef] [PubMed]
  33. Gao, P.; Yang, S.; Ishikawa, R.; Li, N.; Feng, B.; Kumamoto, A.; Shibata, N.; Yu, P.; Ikuhara, Y. Atomic-scale measurement of flexoelectric polarization at SrTiO3 dislocations. Phys. Rev. Lett. 2018, 120, 267601. [Google Scholar] [CrossRef] [PubMed]
  34. Kondo, S.; Mitsuma, T.; Shibata, N.; Ikuhara, Y. Direct observation of individual dislocation interaction processes with grain boundaries. Sci. Adv. 2016, 2, e1501926. [Google Scholar] [CrossRef] [PubMed] [Green Version]
  35. Metlenko, V.; Ramadan, A.H.; Gunkel, F.; Du, H.; Schraknepper, H.; Hoffmann-Eifert, S.; Dittmann, R.; Waser, R.; De Souza, R.A. Do dislocations act as atomic autobahns for oxygen in the perovskite oxide SrTiO3? Nanoscale 2014, 6, 12864–12876. [Google Scholar] [CrossRef]
  36. Okafor, C.; Ding, K.; Zhou, X.; Durst, K.; Rödel, J.; Fang, X. Mechanical tailoring of dislocation densities in SrTiO3 at room temperature. J. Am. Ceram. Soc. 2022, 105, 2399–2402. [Google Scholar] [CrossRef]
  37. Porz, L.; Frömling, T.; Nakamura, A.; Li, N.; Maruyama, R.; Matsunaga, K.; Gao, P.; Simons, H.; Dietz, C.; Rohnke, M.; et al. Conceptual Framework for Dislocation-Modified Conductivity in Oxide Ceramics Deconvoluting Mesoscopic Structure, Core, and Space Charge Exemplified for SrTiO3. ACS Nano 2020, 15, 9355–9367. [Google Scholar] [CrossRef]
  38. Schraknepper, H.; Weirich, T.E.; De Souza, R.A. The blocking effect of surface dislocations on oxygen tracer diffusion in SrTiO3. Phys. Chem. Chem. Phys. 2018, 20, 15455–15463. [Google Scholar] [CrossRef]
  39. Waldow, S.P.; De Souza, R.A. Computational Study of Oxygen Diffusion along a[100] Dislocations in the Perovskite Oxide SrTiO3. ACS Appl. Mater. Interfaces 2016, 8, 12246–12256. [Google Scholar] [CrossRef]
  40. Zhong, W.; Vanderbilt, D. Competing Structural Instabilities in Cubic Perovskites. Phys. Rev. Lett. 1995, 74, 2587–2590. [Google Scholar] [CrossRef]
  41. Du, H.; Jia, C.-L.; Houben, L.; Metlenko, V.; De Souza, R.A.; Waser, R.; Mayer, J. Atomic structure and chemistry of dislocation cores at low-angle tilt grain boundary in SrTiO3 bicrystals. Acta Mater. 2015, 89, 344–351. [Google Scholar] [CrossRef]
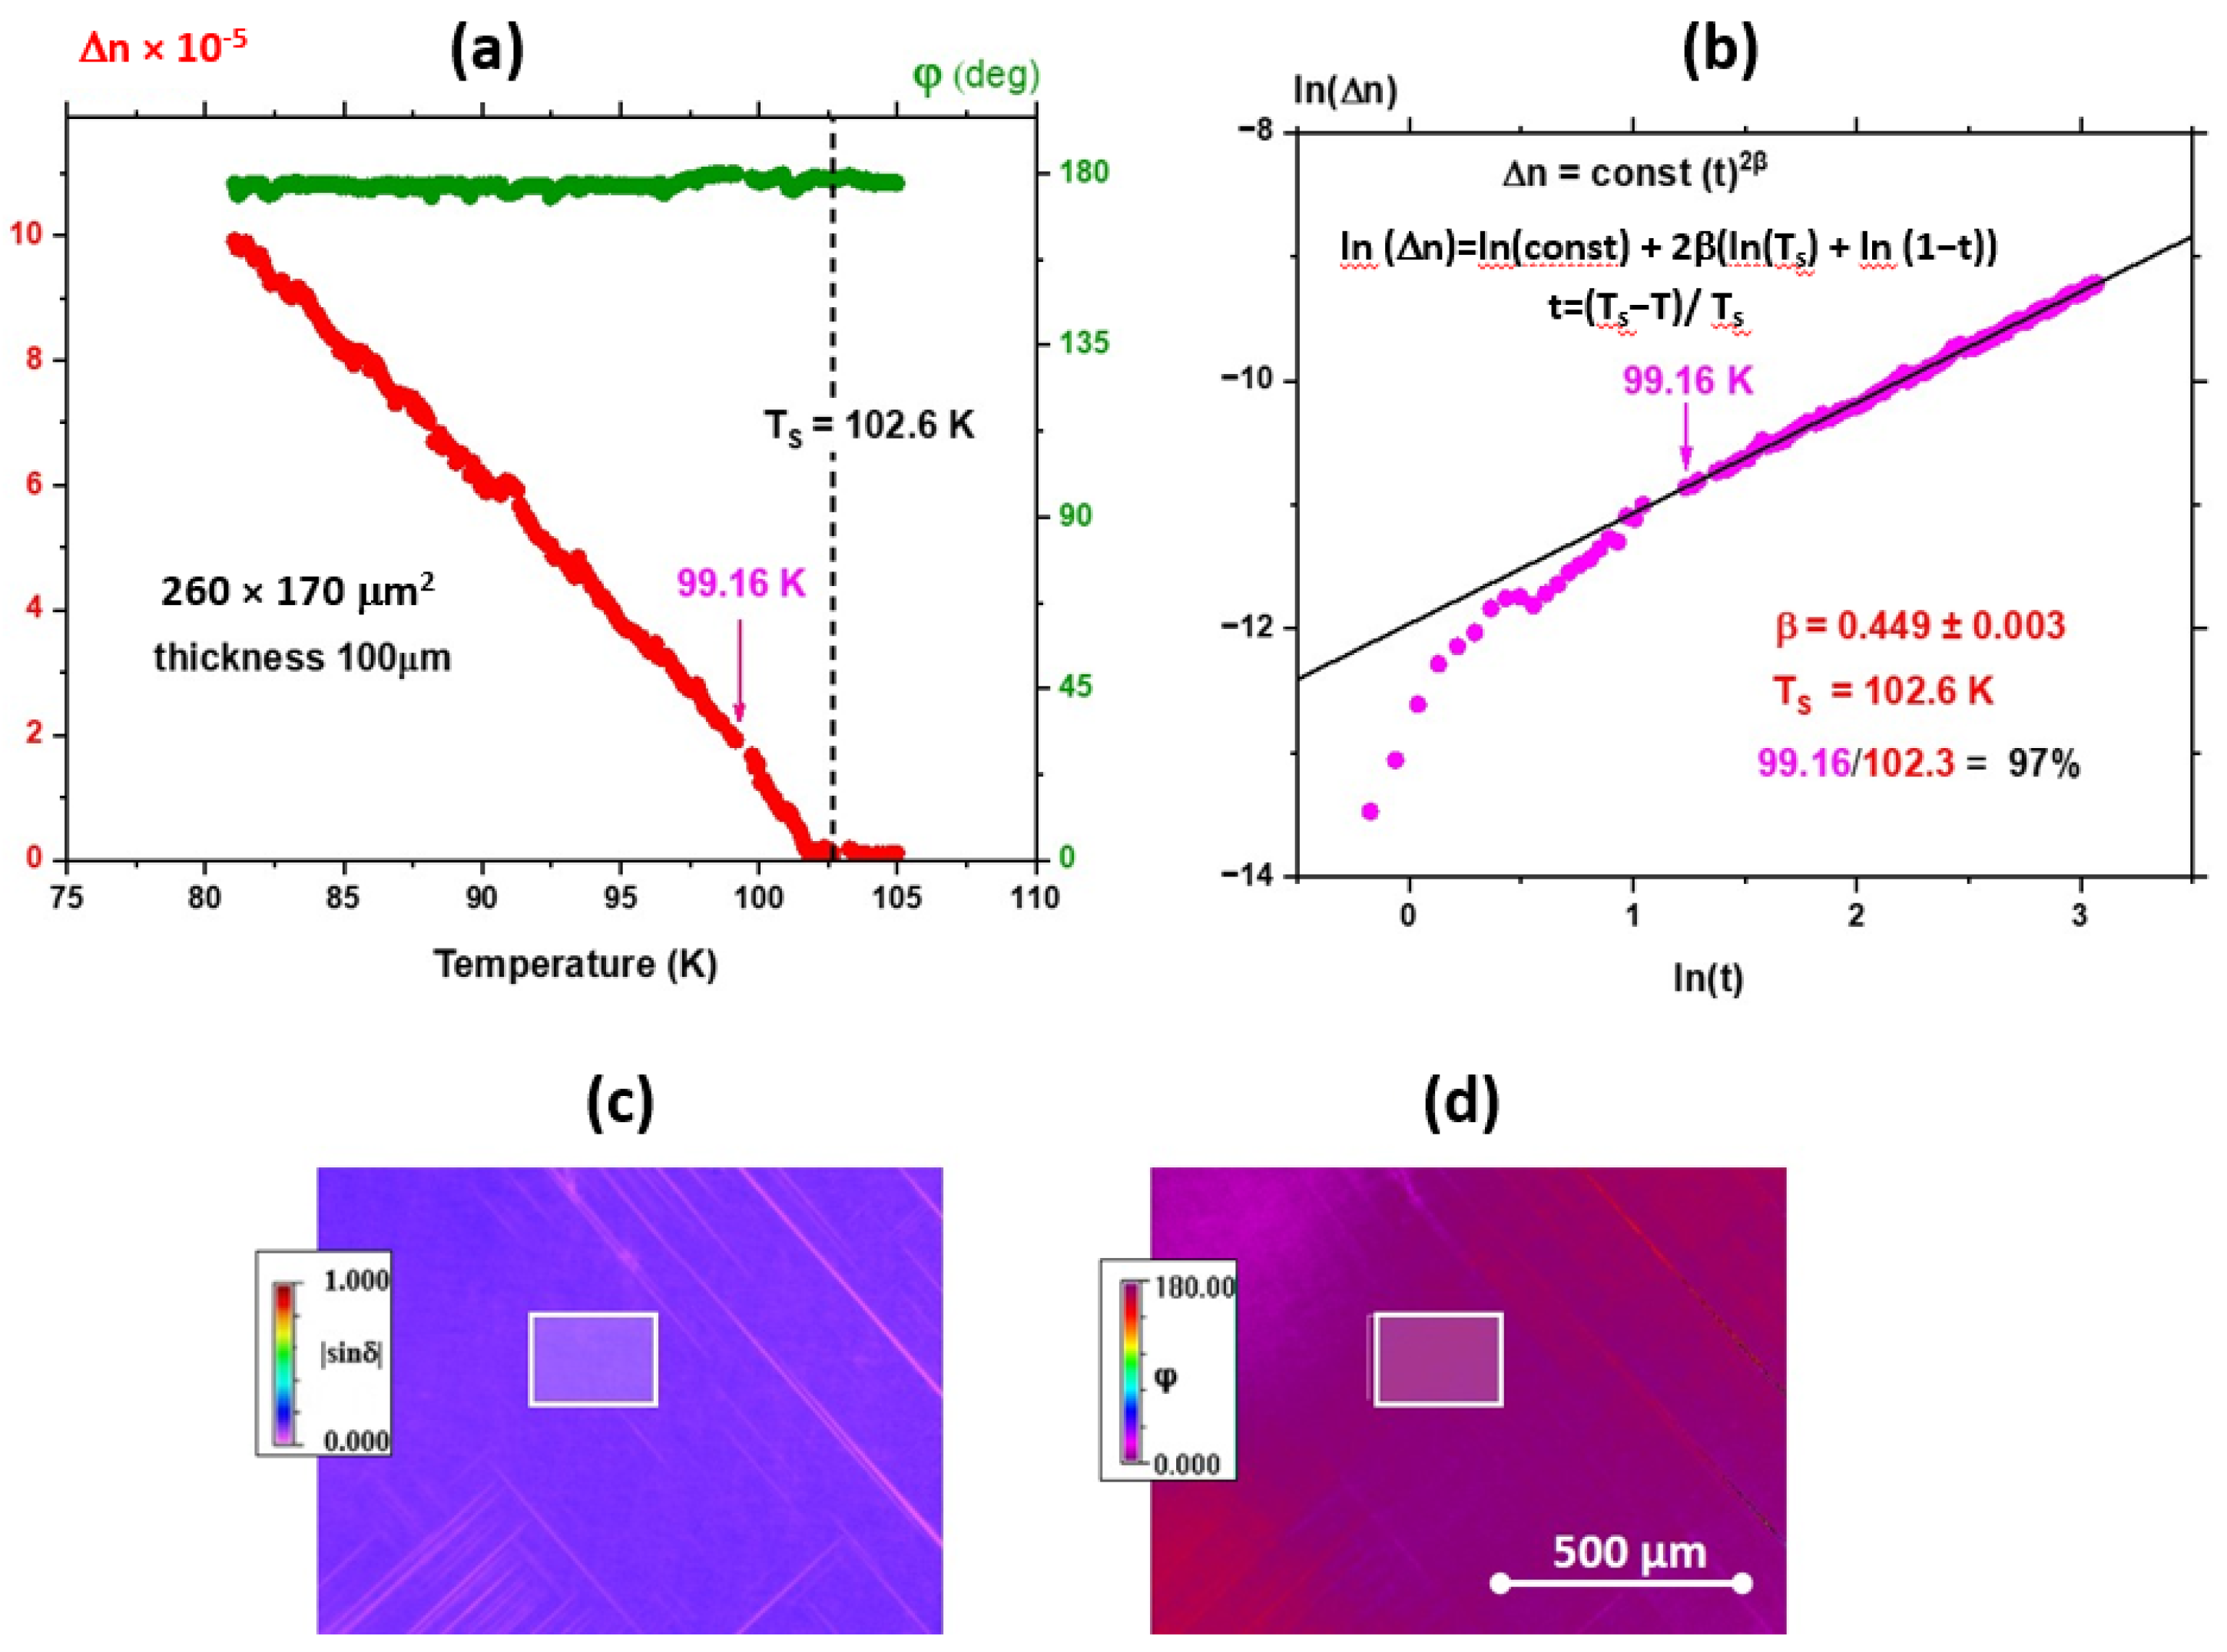
Figure 1. (a) Temperature changes of birefringence Δn in an STO single crystal with [100] orientation and thickness 100 μm in a broad temperature range, from 83 K to 300 K. Note the stable orientation of the optical indicatrix near 180°. (b) Exponent β, determined below TS in the 97% range of the data, takes a value close to that for a second-order phase transition. The discrepancy from the β = 0.5 is most probably connected with the incompletely single-domain state, especially close to TS. This is because the tetragonal STO is a ferroelastic material, and any strain from dislocations may break locally the symmetry influencing the birefringence data. TS = 102.6 K was determined based on the minimisation of the standard error when fitting the Δn(lnt) run with a linear function. (c,d) shows a homogeneous shadowed rectangle 260 × 170 μm2, out of the region with a fine domain structure, for which the Δn and φ values versus temperature were calculated. Both (c,d) are shown at 83 K.
Crystals 13 00985 g001
Figure 2. Temperature dependence (1 K/min) of |sinδ| and indicatrix orientation φ, calculated for areas (a) 56 × 50 μm2, (b) 20 × 22 μm2, and (c) 37 × 36 μm2 (maps presented at 83 K), inside differently oriented regions (domains) in [100] oriented STO crystal of thickness 250 μm. In all cases, unconventional behaviour of φ(T) below Ts is observed. The φ(T) should take a constant value, as in Figure 1a. Non-linear φ(T) runs point to an inhomogeneous volumetric structure of the commercial STO single crystals. It is worth mentioning that the cusp in the |sinδ|(T) run in (c) is similar to that reported in [2]. Note that in [2], no measurement of indicatrix orientation was reported.
Crystals 13 00985 g002aCrystals 13 00985 g002b
Figure 3. Temperature dependence (1 K/min) of |sinδ| and indicatrix orientation φ for [100] SrTiO3 single crystals of thickness 30 μm calculated inside the domains in the area (a) 15 × 15 μm2; and (b) 15 × 17 μm2, marked by the shadowed rectangle and presented on |sinδ| and φ maps for 83 K. Even inside the same domain, and at the smallest changes of the indicatrix orientation φ, the |sinδ|dependence calculated for close regions differ considerably. This points to the huge influence of local elastic stresses on crystal properties. The rich literature, to mention a few [23,24,25,26,27,28], on the defects in STO crystal, indicates the main role of dislocations created during crystal growth and/or their polishing. This becomes clearly apparent in a thin crystal with a thickness of 30 µm. As shown in [12], the highest dislocation density in the surface region occurs just up to the thickness of about 30 µm [12].
Crystals 13 00985 g003
Figure 4. Temperature dependence of |sinδ| for a broader temperature interval 85 K–250 K: (a) three regions for a crystal with a thickness of 250 μm; (b) two areas for a crystal with a thickness of 30 μm and one for a crystal with a thickness of 100 μm. We believe it is not an accident that in all the investigated crystals, the |sinδ| disappears around 180–210 K. Note that the |sinδ|(T) runs are different for different crystals, suggesting that they originate from heterogeneously distributed extended defects in the crystal volume. If the leading role is attributed to dislocations, we can understand the existence of the same critical temperature of stress-induced birefringence. Interestingly, the thinner the crystal, the greater the |sinδ| value above Ts. This can be related to the surface-bulk interrelationship, which is stronger for thinner crystals, meaning that defected surface is meanly responsible for the presence of birefringence above Ts. It could also be that the thinner crystals have fewer stacked domains through their thickness.
Crystals 13 00985 g004
Figure 5. (a) Arbitrary chosen |sinδ| maps below and above transition at Ts in the bi-crystal SrTiO3 with [100] orientation, 250 μm thickness, and 24° tilt. Fine domain structure disappears above the transition point, but the crystal is not isotropic; the maps do not show homogenous colour. The boundary between the tilted crystals is birefringent up to room temperature. Characteristically, strongly birefringent points occur along the boundary − strong bright blue droplets—well seen in (b), which can be explained as bundles of dislocations. Interestingly, the distance between the bundles—estimated to be 13 μm—is periodic, as is the stripe domain structure.
Crystals 13 00985 g005
Figure 6. Dependence |sinδ|(T) calculated for reduced SrTiO3 bi-crystal, measured at the rate 1K/min, in two different homogeneous areas marked as shadowed rectangles on |sinδ| and φ maps for 83 K: (a) 34 × 32 μm2 far from the boundary; (b) 41 × 47 μm2 near the bicrystal boundary. The much lower value of |sinδ|(T) and distinctly different run of |sinδ|(T) near the bi-crystal boundary demonstrate the significant stress-induced impact in these crystals; (c) sinδ|(T) with particular reference to the run above Ts. Only in the defected bi-crystal does the characteristic local maximum occur near 170 K. This may be interpreted as the limit to which the local stresses from the dislocations destroy the cubic STO structure.
Crystals 13 00985 g006aCrystals 13 00985 g006b
Table 1. The most characteristic features of the investigated commercial STO single crystal.
Thickness
of STO Crystal
TsType of TransitionBirefringence Disappearance/Value
30 µmDifficult to determineDifficult to determine210 K/strong
100 µm102.6 KClose to second-order transition210 K/very weak
250 µmClose to 105 KDifficult to determine210 K/ average
24 bi-crystal 250 µm Close to 105 KDifficult to determine180 K/strong, with a peak at 170 K
Disclaimer/Publisher’s Note: The statements, opinions and data contained in all publications are solely those of the individual author(s) and contributor(s) and not of MDPI and/or the editor(s). MDPI and/or the editor(s) disclaim responsibility for any injury to people or property resulting from any ideas, methods, instructions or products referred to in the content.