Article

3D Printed Microfluidic Cell for SAXS Time-Resolved Measurements of the Structure of Protein Crystallization Solutions

by
Margarita A. Marchenkova
1,2,*,
Sergei V. Chapek
3,
Petr V. Konarev
1,2,
Ksenia B. Ilina
1,2,
Georgy S. Peters
2,
Yury V. Pisarevsky
1,2,
Vladimir A. Shishkov
1,
Alexander V. Soldatov
3 and
Mikhail V. Kovalchuk
1,2
1
A.V. Shubnikov Institute of Crystallography, Federal Scientific Research Centre “Crystallography and Photonics”, Russian Academy of Sciences, 59, Leninskii Prospect, 119333 Moscow, Russia
2
National Research Centre “Kurchatov Institute”, 1, Akademika Kurchatova pl., 123182 Moscow, Russia
3
The Smart Materials Research Institute, Southern Federal University, 178/124, Andreya Sladkova Street, 344090 Rostov on Don, Russia
*
Author to whom correspondence should be addressed.
Crystals 2023, 13(6), 938; https://doi.org/10.3390/cryst13060938
Submission received: 26 May 2023 / Revised: 8 June 2023 / Accepted: 9 June 2023 / Published: 11 June 2023
(This article belongs to the Special Issue Macromolecular Crystallography: Progress and Prospects)

Abstract

:
A multichannel microfluidic cell (MFC) obtained using 3D printing for studying the structure of complex solutions by small-angle X-ray scattering (SAXS) is described. MFC was tested at the BioMUR beamline of the Kurchatov synchrotron. A comparative analysis of SAXS signal from the standard capillary and from the developed MFC was carried out, with MFC showing significant advantages. The dynamics of SAXS scattering curves for lysozyme solutions with NaCl precipitant were studied when the protein and precipitant concentrations changed. The obtained time series of data are well consistent with the known data for the lysozyme solution.

1. Introduction

The study of the structure of protein solutions by small-angle X-ray scattering allows one to facilitate the search for protein crystallization conditions and to study the peculiarities of the interaction of proteins with each other and with other organic and inorganic components involved in biological processes.
SAXS measurements are currently carried out in cylindrical capillaries into which a pre-prepared solution is injected. Therefore, the dynamics of the formation of the test solution remain unknown. In addition, the cylindrical shape of the capillary limits the effective size of the X-ray beam.
Microfluidic technologies solve the above problems by applying synchrotron and neutron radiation methods, such as small-angle X-ray scattering (SAXS) or neutron scattering (SANS), to study the structure of various objects. Along with the synthesis of various nanomaterials with controlled shapes and dimensions, two-dimensional (2D) and three-dimensional (3D) microfluidic devices can be used to study the interactions of macromolecules [1,2] and functionally significant domain movements in them under the influence of terahertz radiation [3], mechanisms and kinetics during the generation of self-assembled nanostructures [4,5,6,7] at different reaction times (from fractions of seconds to minutes), nucleation and crystal growth mechanisms [8], etc. There are quite a few works [9,10] justifying the usage of microfluidic cells for SAXS/SANS studies of structures in solutions. These cells are often designed and optimized for specific cases—for example, [11] shows a cell for studies of lipid exchange among citrem nanoparticles and ethanol micellar solutions, and in [12], the dynamics of surfactant molecules in solution is studied by SAXS, microscopy, and rheology methods.
The use of microfluidics can reduce the consumption of expensive samples and investigate the dynamics of the interaction process of macromolecules, which is critical in studying the initial stages of protein crystallization.
In the past few years, studies of the structure of crystallization solutions at nanometer unit scales have been carried out using SAXS/SANS methods as well as molecular dynamics method [13,14,15,16,17,18] s. Such work was carried out primarily for saturated crystallization solutions of a number of proteins [19,20,21,22,23,24] and potassium dihydrogen phosphate [25]. In these works, 3D fragments were isolated from the crystal structure of the compounds under study, from which a single crystal could be built. Additionally, these ordered formations were found in saturated solutions of lysozyme proteins (octamers [19,20,21,22,23,24]), thermolysin (hexamers [26]), and proteinase (dimers [27], aminotransferase (twelve-dimers [28]), as well as in potassium dihydrogen phosphate solutions (octamers [25]), which experimentally confirmed the hypothesis of the existence and structure of the precursor cluster in the crystallization solution.
This paper describes the multichannel microfluidic cell developed by us for studying the dynamics of the structure in solutions by the SAXS method and its testing at the synchrotron beamline “BioMUR” of the Kurchatov synchrotron radiation source (KISI-Kurchatov, National Research Center “Kurchatov Institute”, Moscow, Russia) using the example of a study of the formation of an oligomeric mixture in crystallization solutions of lysozyme protein.

2. Materials and Methods

2.1. Production of Microfluidic Cell

Microfluidic devices were printed using DLP technology (Digital Light Processing, one of the additive manufacturing methods that use liquid photopolymer resins to build objects, hardening as a result of exposure to light emitted by digital LED projectors). For printing, an Asiga UV MAX 3D printer (Asiga, Sydney, Australia) with a wavelength of 385 nm and a light intensity of 7.25 MW/cm2 was used.
In order to avoid delamination of the model from the platform, the following parameters based on protocol reported by Peter van der Linden et al. [29] and adapted to our model were chosen: the height of the first layer—25 microns; the exposure time of the first layer—20 s. The subsequent thicknesses and exposures of the illumination of the layers were 25 microns and 600 ms, respectively. In order to avoid delamination during printing, z-compensation was set to 300 μm.
The printing temperature was selected at 45 °C for better photopolymer resin workability (FunToDo Nano Clear, The Netherlands) during the layer-forming process. Immediately after printing, the microfluidic device was sonicated in isopropyl alcohol for 90 s at 80 kHz and then placed in a holder for manual channel washing. After the channels were washed, the devices were further sonicated and dried with nitrogen gas. Finally, the chips were post-treated for 2 min using a UV light lamp (Flash DR-301C type, Asiga, Australia, Sydney).

2.2. Description of the Microfluidic Cell

The flow-microfluidic cell is a device for conducting research on the crystallization processes of water-soluble proteins via the SAXS method using synchrotron radiation (SR). The device is intended for structural studies of protein solutions when their concentration and temperature change in various combinations.
The product includes (a) base, (b) X-ray transparent windows, (c) cell body, and (d) pressure platform (Figure 1).
The design of the cell and the presence of several input channels allow one to smoothly change the concentration inside the measuring chamber during the experiment. The required temperature of the solution can be in the range of 0–40 °C and is set using an external thermostat, with a heat exchanger that contacts the metal base (Figure 1a) of the cell. X-ray translucent windows are made of optical mica for optical vacuum devices with a thickness of 30 mm.
Technical data: overall dimensions—30 × 15 × 6 mm; the diameter of the research chamber is due to the size of the synchrotron beam (FWHM 0.48 × 0.26 mm, full Gauss 1.7 × 1.2 mm)—3 mm; the volume of the research chamber is 7 mL; the number of the input channels for samples is 3; the cross-section of the input channels is 30 mkm2; the volume of the input channels is short—0.1 mL, long—0.6 mL; section of the outlet channel—125 mCm2.
The microfluidic cell is a five-layer structure connected to the stack with screws. The cell body (Figure 1c) and the hold-down platform (Figure 1d) are made of photopolymer resin using 3D printing. The study chamber through which the X-ray beam passes is located in the center of the cell and is formed by a through hole in the cell body, closed on both sides by windows (Figure 1b).
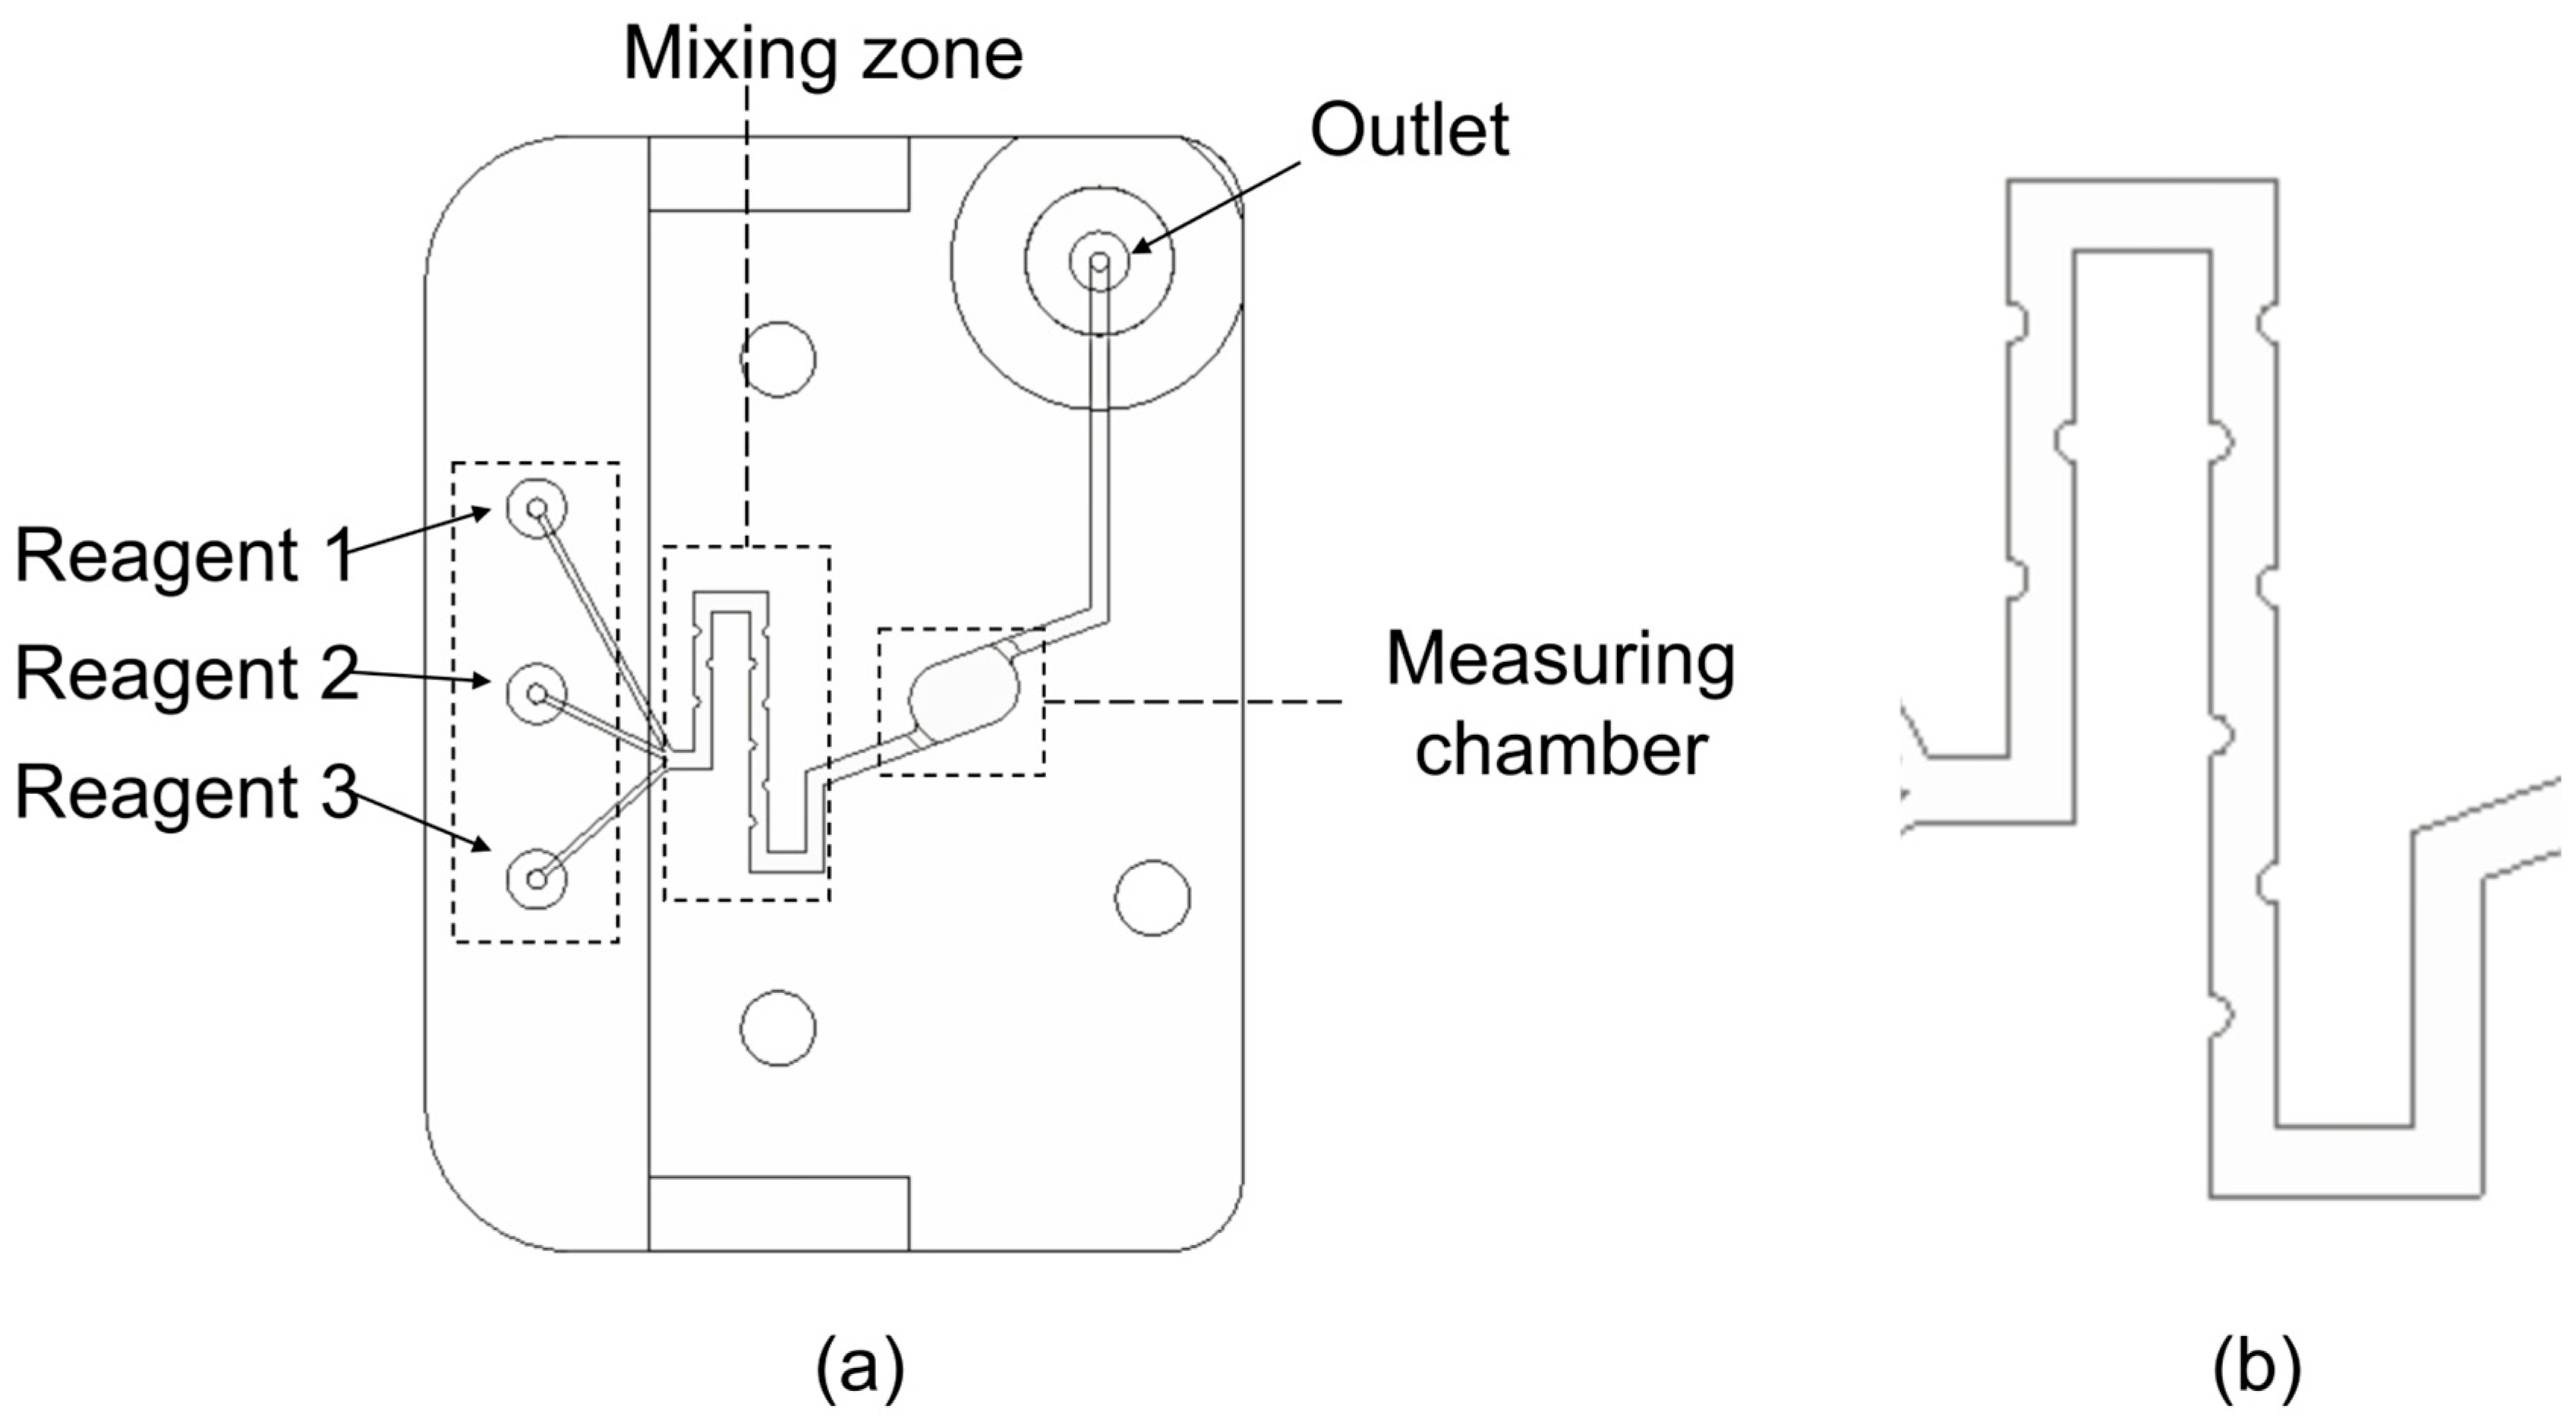
In the body of the cuvette, there are channels for the inlet and outlet of the analyzed fluid communicating with the research chamber. The configuration of the channels allows mixing of liquids entering the ditch due to special geometry with semicircular obstacles that create turbulent flow movement, which allows liquids to be mixed in small volumes with high mixing efficiency (Figure 2a,b). The transparent X-ray windows are connected to the cell body by means of a photocured polymeric resin, which ensures the tightness of the cell.
In order to form a closed volume of the chamber in which the sample solutions are exposed (in our case, crystallization), optical and X-ray transparent windows made of mica for optical vacuum devices with a thickness of 30 μm are glued to the cell body on both sides with photopolymer resin. To prevent the depressurization of the chamber, pressure covers are provided, which are connected to the cell body in a single package using screws (Figure 1).

2.3. Holder

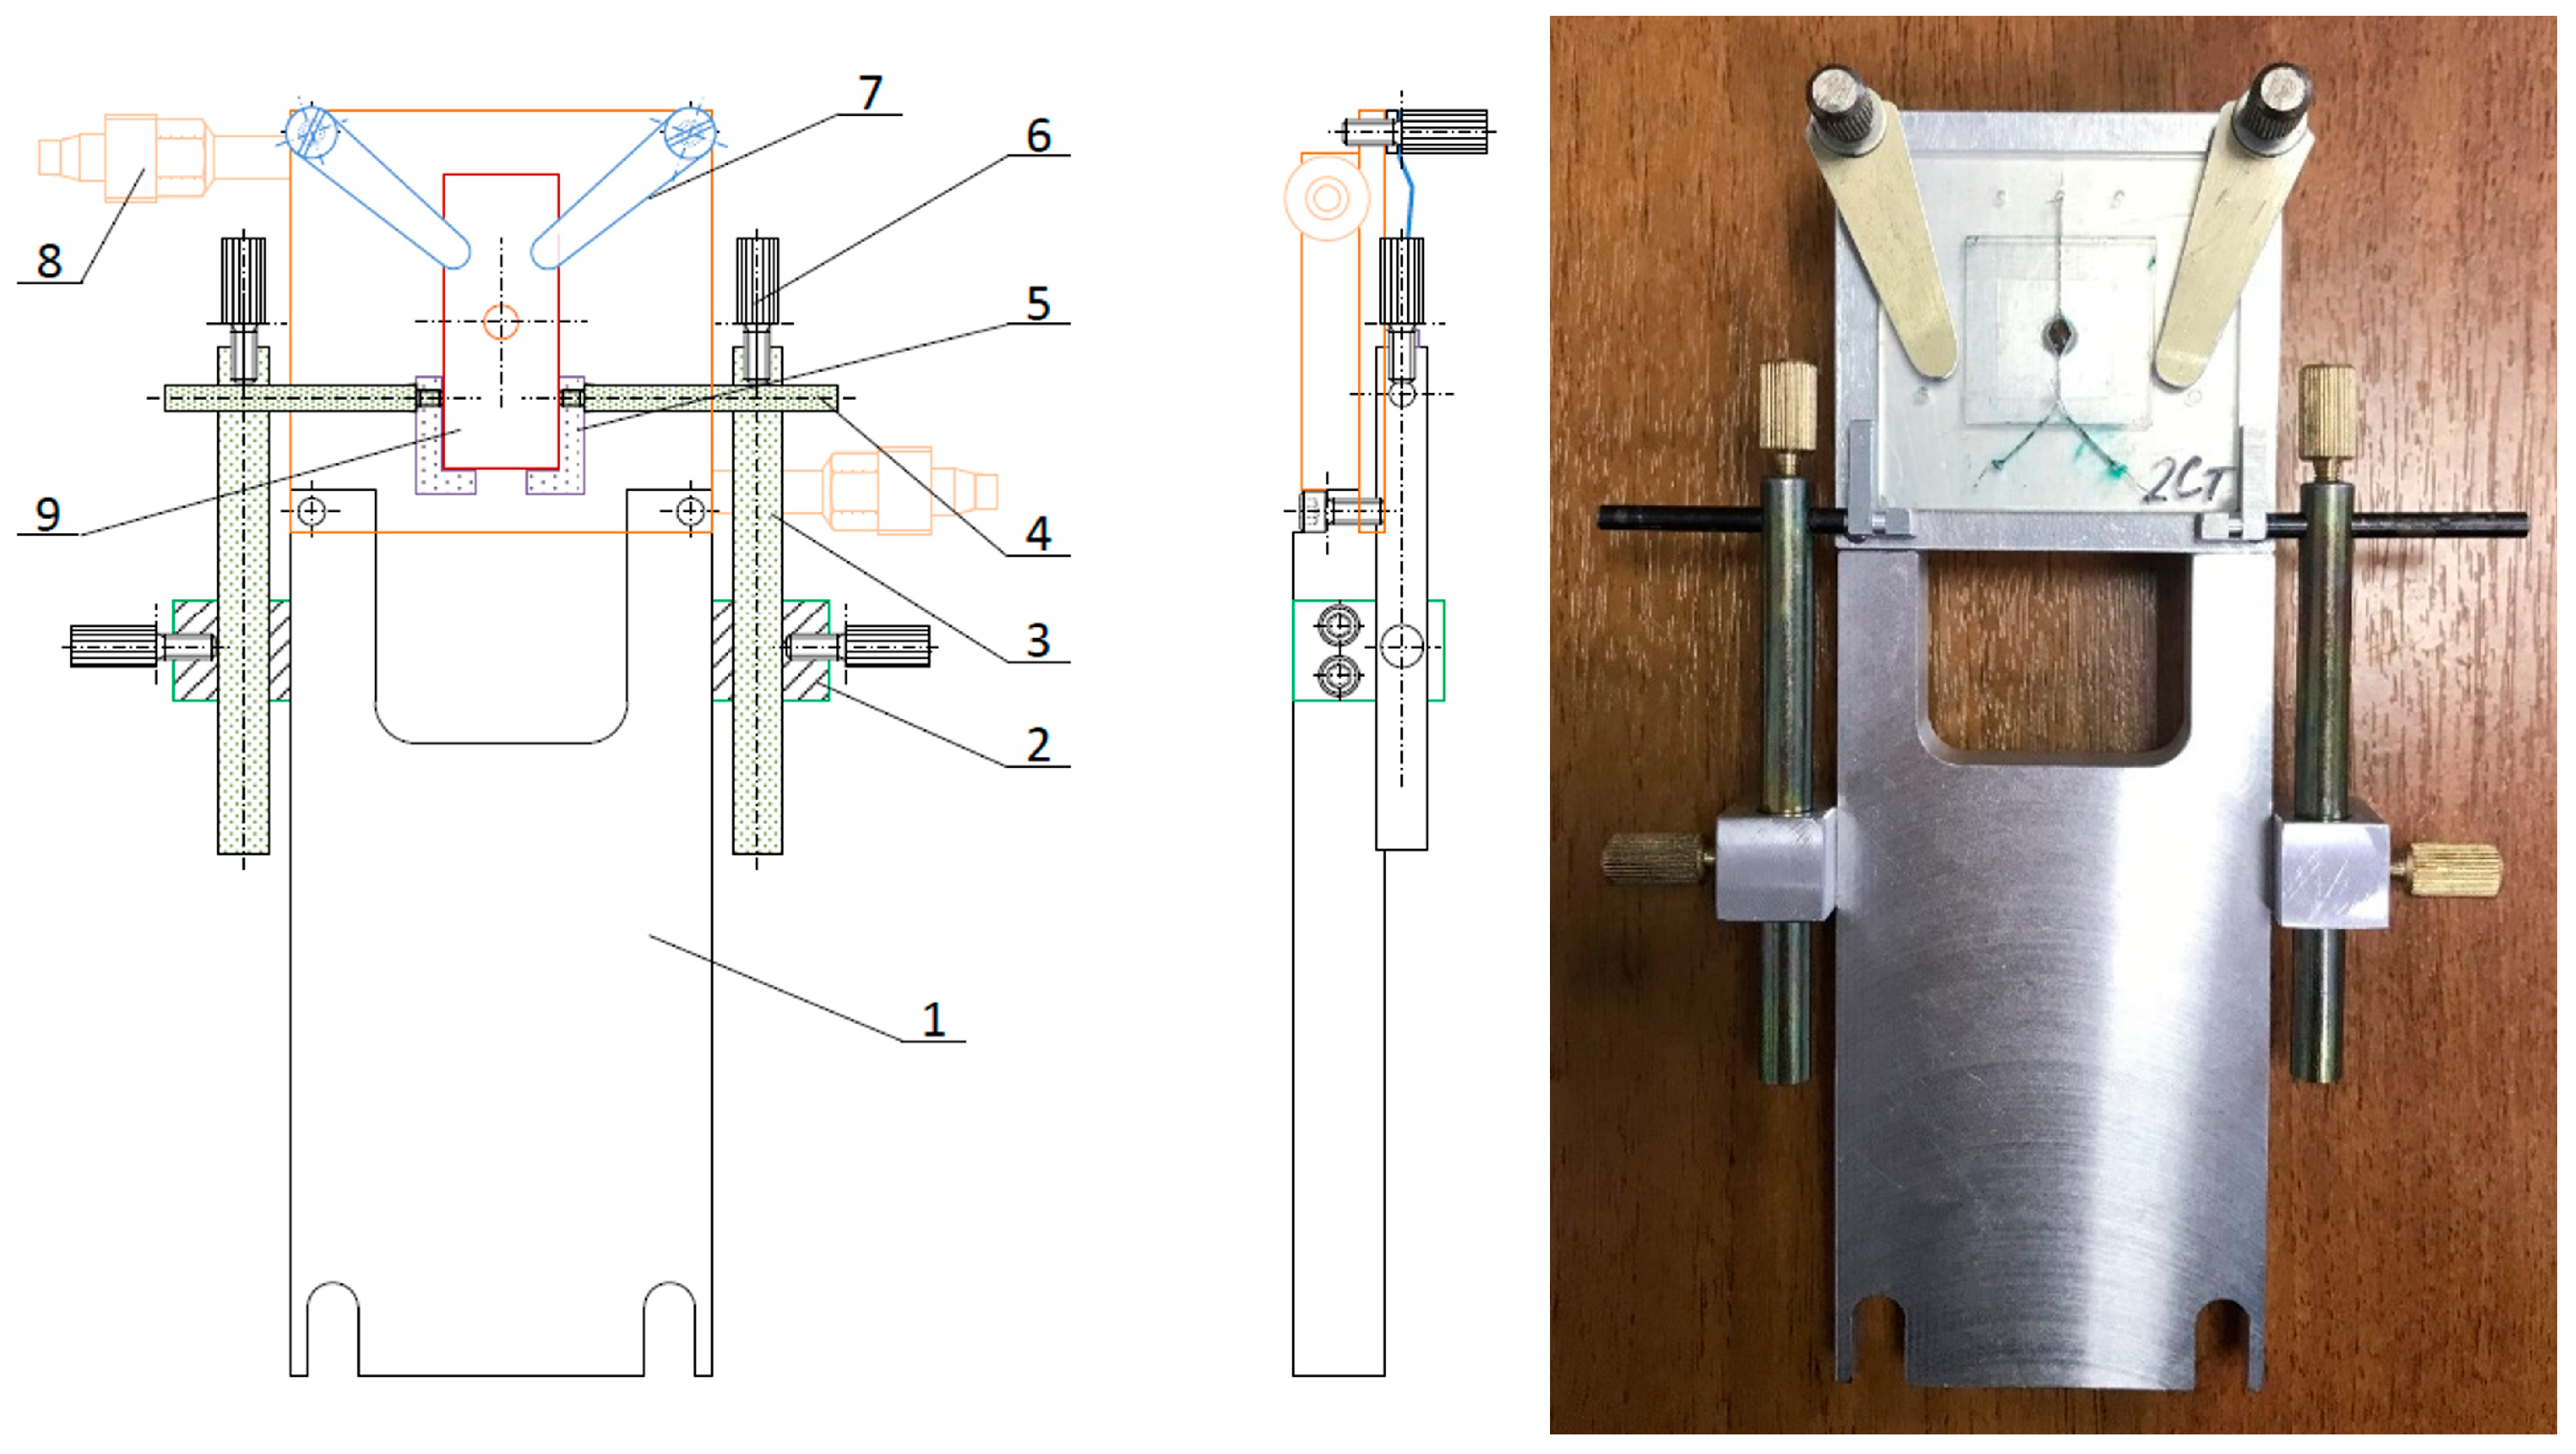
In order to obtain a SAXS patterns using microfluidic cells at the BioMUR beamline of the KISI-Kurchatov, a universal holder was designed and manufactured (Figure 3) with the ability to maintain a given temperature.
The holder, with overall dimensions of 150 × 100 × 22 mm, consists of three parts: the base (1), a rolling pin system with support brackets (2–6), and a heat exchange table (7).
The base (1) is made of aluminum alloy and is matched by connecting dimensions with the X-Y carriage of a BioMUR beamline. The clamps (2) of a rolling pin system are fixed on the sides of base, and holes for attachment of a heat exchange table (7) are provided in upper part.
The rolling pin system (3, 4) is designed to change and fix the position of the supporting L-shaped brackets (5), on which the cell (9) is installed when its optical axis is aligned with the axis of the SR beam. The adjustment ranges are as follows: by cuvette width, 8...50 mm; by distance from the lower end of the cell to the beam axis, 0...40 mm. The selected position of the system is fixed by locking screws (6) with corrugation. By means of such a system of screws positioning the cell, the holder can be used for cells of various sizes.
Heat exchange table with dimensions of 50 × 50 mm is made of copper and is equipped with two elastic lamellae (2) and with the help of which the cuvette is pressed to the table to set the required temperature of the investigated solution during measurements. In the center of the table, there is a through hole with a diameter of 4 mm for the SR beam. The table has a cavity in which cooling fluid circulates, the configuration and dimensions of the connecting connectors (8) are coordinated with the thermal stabilization system of the BioMUR beamline.

2.4. SAXS Measurement

Measurements in the microfluidic cell were carried out at the BioMUR synchrotron beamline, KISI-Kurchatov [30]. Monochromatized radiation was used at a wavelength of 0.1445 nm (which corresponds to a radiation energy of 8.58 keV). The signal was detected using a two-dimensional Pilatus3 1M pixel detector (Dectris, Switzerland). The signal was averaged along the radial direction using the FIT2D program [31]. The PRIMUS program [32] was used to subtract the buffer signal.
The X-ray beam cross-section was 0.35 × 0.50 mm, the scattering angle region corresponded to the range of scattering vector modulus values:
0.2   <   q   <   6.0   nm 1   | q | = 4 π sin θ λ ,   2 θ scattering   angle
The exposure time was 60 s, and the sample–detector distance was 700 mm. The cell temperature was maintained at 20 °C.

2.5. Materials and Sample Preparation

Tests were carried out on crystallization solutions of lysozyme (growth conditions of tetragonal syngony), determining the radius of gyration, type, and volume fraction of oligomers. For this purpose, one cell channel was filled with lysozyme solution, the second with precipitant, and the third with sodium acetate buffer. Syringe pumps, disposable plastic syringes, and PEEK tubes were used to load the solutions into the ducts.
The samples were prepared using purified chicken egg lysozyme (HEWL) from Sigma (CAS # 12650-88-3) without further purification and Helicon high purity sodium chloride (CAS # 7647-14-5) as a precipitant. Millipore Ultrafine Water (18 MOm * cm) was used as the solvent. Lysozyme and sodium chloride were dissolved in 0.2 M sodium acetate buffer (hereinafter referred to as a buffer) pH 4.5 from Helicon (CAS # 6131-90-4). All solutions were filtered with 0.22 μm Millex membrane syringe filters and the protein solution centrifuged for 10 min at 10,000 rpm.
In order to achieve a different composition in the central measuring chamber of the cell, solutions were continuously fed at different rates such that the final concentration of protein and precipitation the test sample zone was 0 to 40 mg/mL and 0 to 24 mg/mL, respectively.
In order to simplify the procedure, the NaCl concentration in the measuring chamber was increased at a fixed protein concentration (Table 1, line by line). For this purpose, stock solutions of lysozyme 0, 20, 40, 80 mg/mL, NaCl 60 mg/mL, and NaAc buffer were used.

3. Results and Discussion

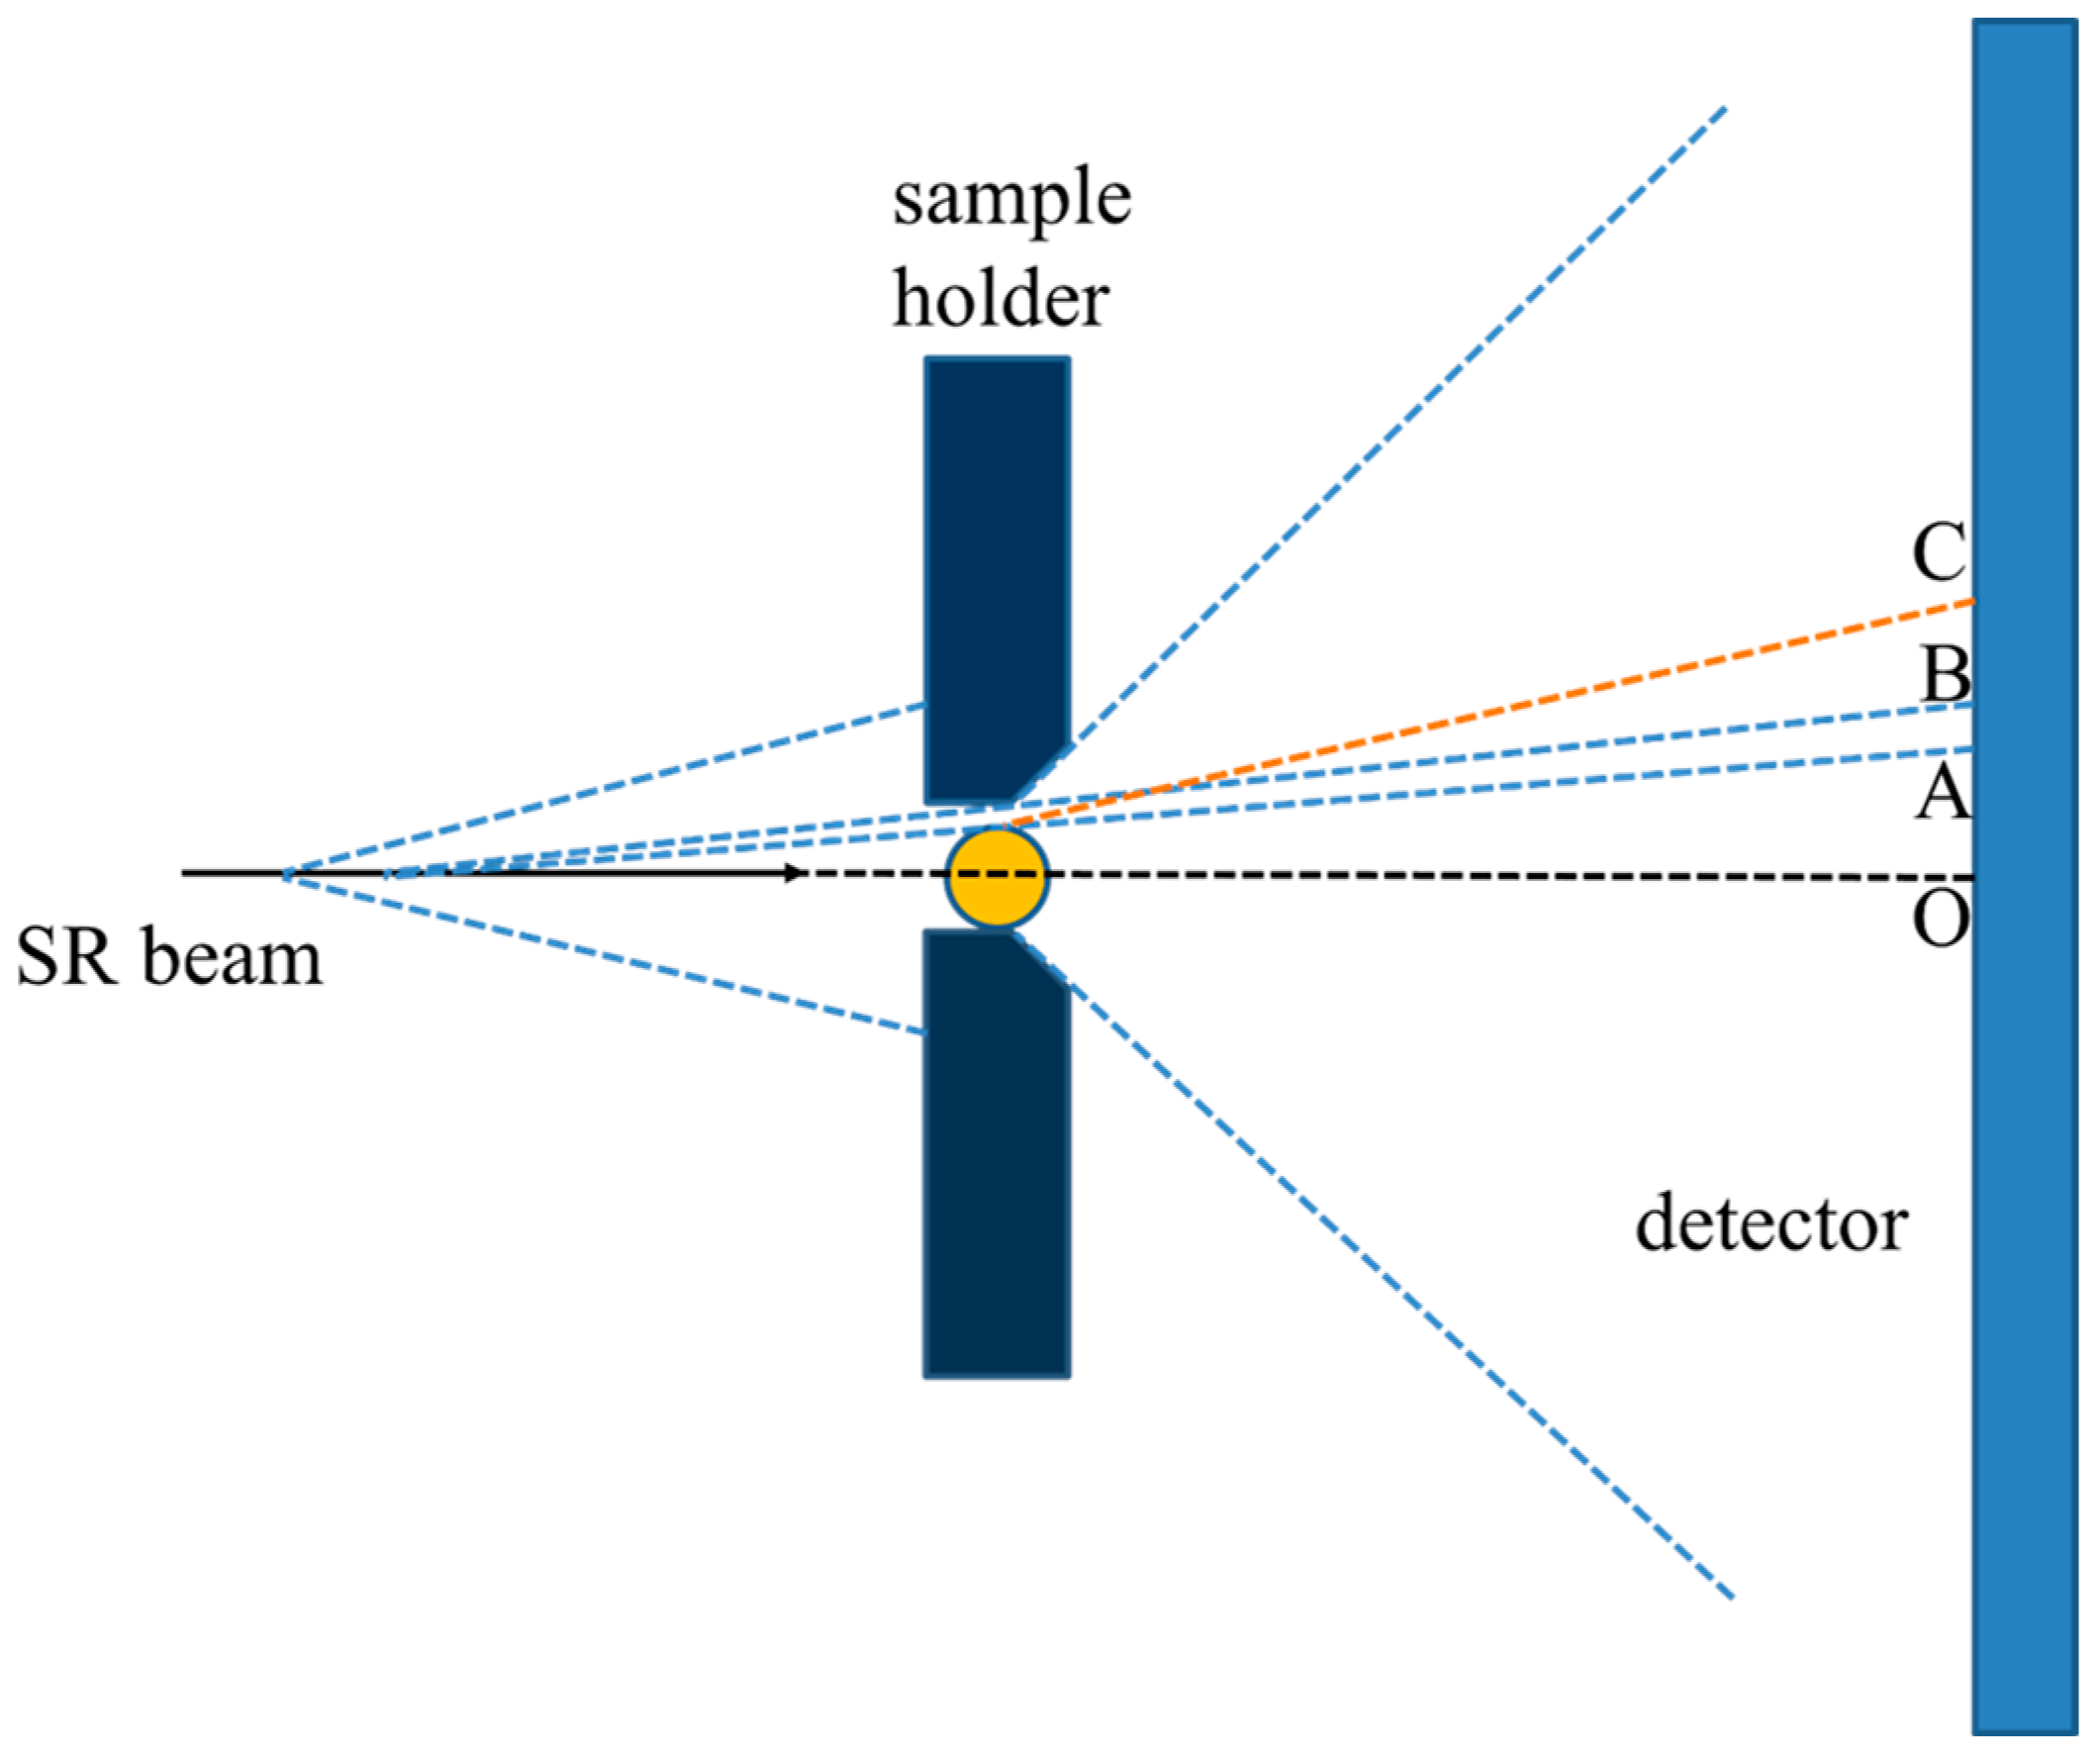
In the case of standard sample capillaries for SAXS data acquisition, the SR beam travels to the sample, scattering in the air. Then, hitting the holder, the radiation is partially absorbed by the capillary and scattered by it, as well as the sample solution present inside (which gives a useful signal for further processing). If the diameter of the capillary is slightly smaller than the size of the hole in the holder, the radiation scattered to the capillary passes further unhindered, scatters even more, and ultimately leaves a noticeable “shadow” on the detector (section AB in Figure 4). When the capillary is positioned horizontally, its upper and lower walls work as elements of X-ray optics with a negative refractive index and the effect of total external reflection of radiation scattered in the air. As a result, the detector concentrates in the vertical direction a weak halo of radiation scattered in the air, and in the horizontal direction, this effect occupies a larger angular range (section BC in Figure 4).
Such artifacts have significant intensity compared to the useful SAXS signal and are poorly accounted for and masked due to size differences (up to 30%) and capillary positions used in the experiment. It is necessary to integrate the 2D image in the radial direction separately in the areas inside the capillary and outside the capillary, excluding illumination artifacts from the integration area, and then merge the two obtained curves along the area of overlapped scattering angles.
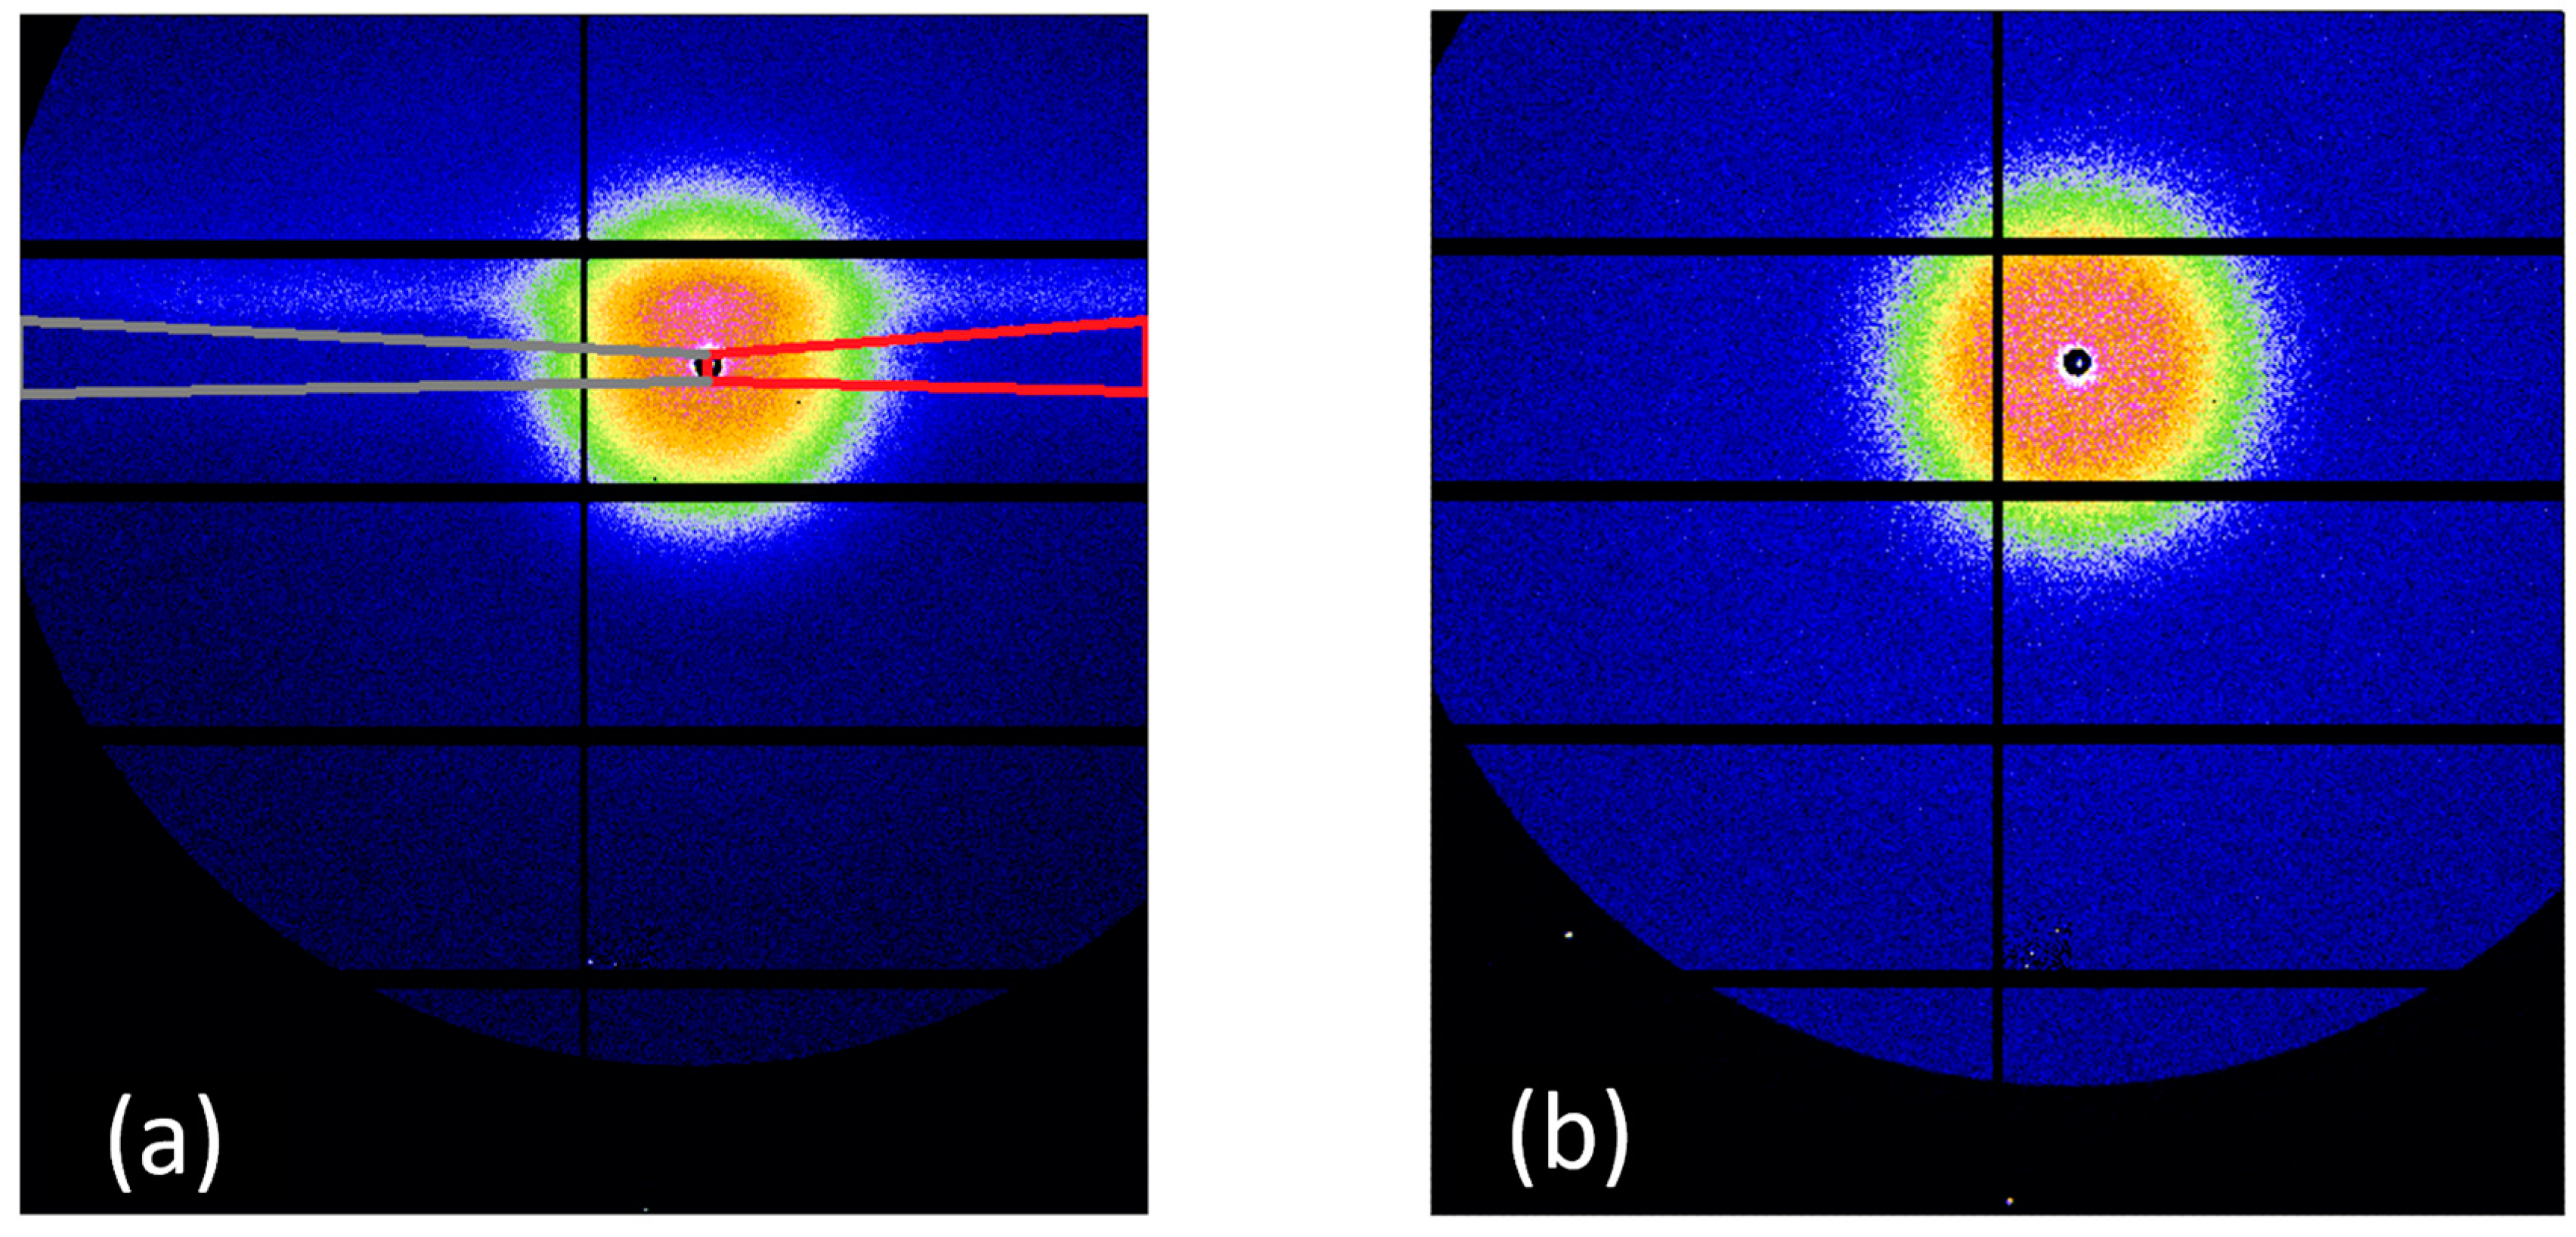
Figure 5 shows SAXS patterns from lysozyme solution in standard capillary (a) and microfluidic cell (b).
Due to the parallel camera windows of the microfluidic cell sample, it was possible to eliminate the “shadow” and gallo from the spherical walls of the capillary (Figure 5b). Only the area inside the capillary (shown in red in Figure 5a) remains available for integration experiments without distortion of the final SAXS curve (shown in Figure 5a), whereas for experiments in the microfluidic cell, the integration can be carried out throughout the whole detector working area, increasing the collected scattering intensity by an order of magnitude.
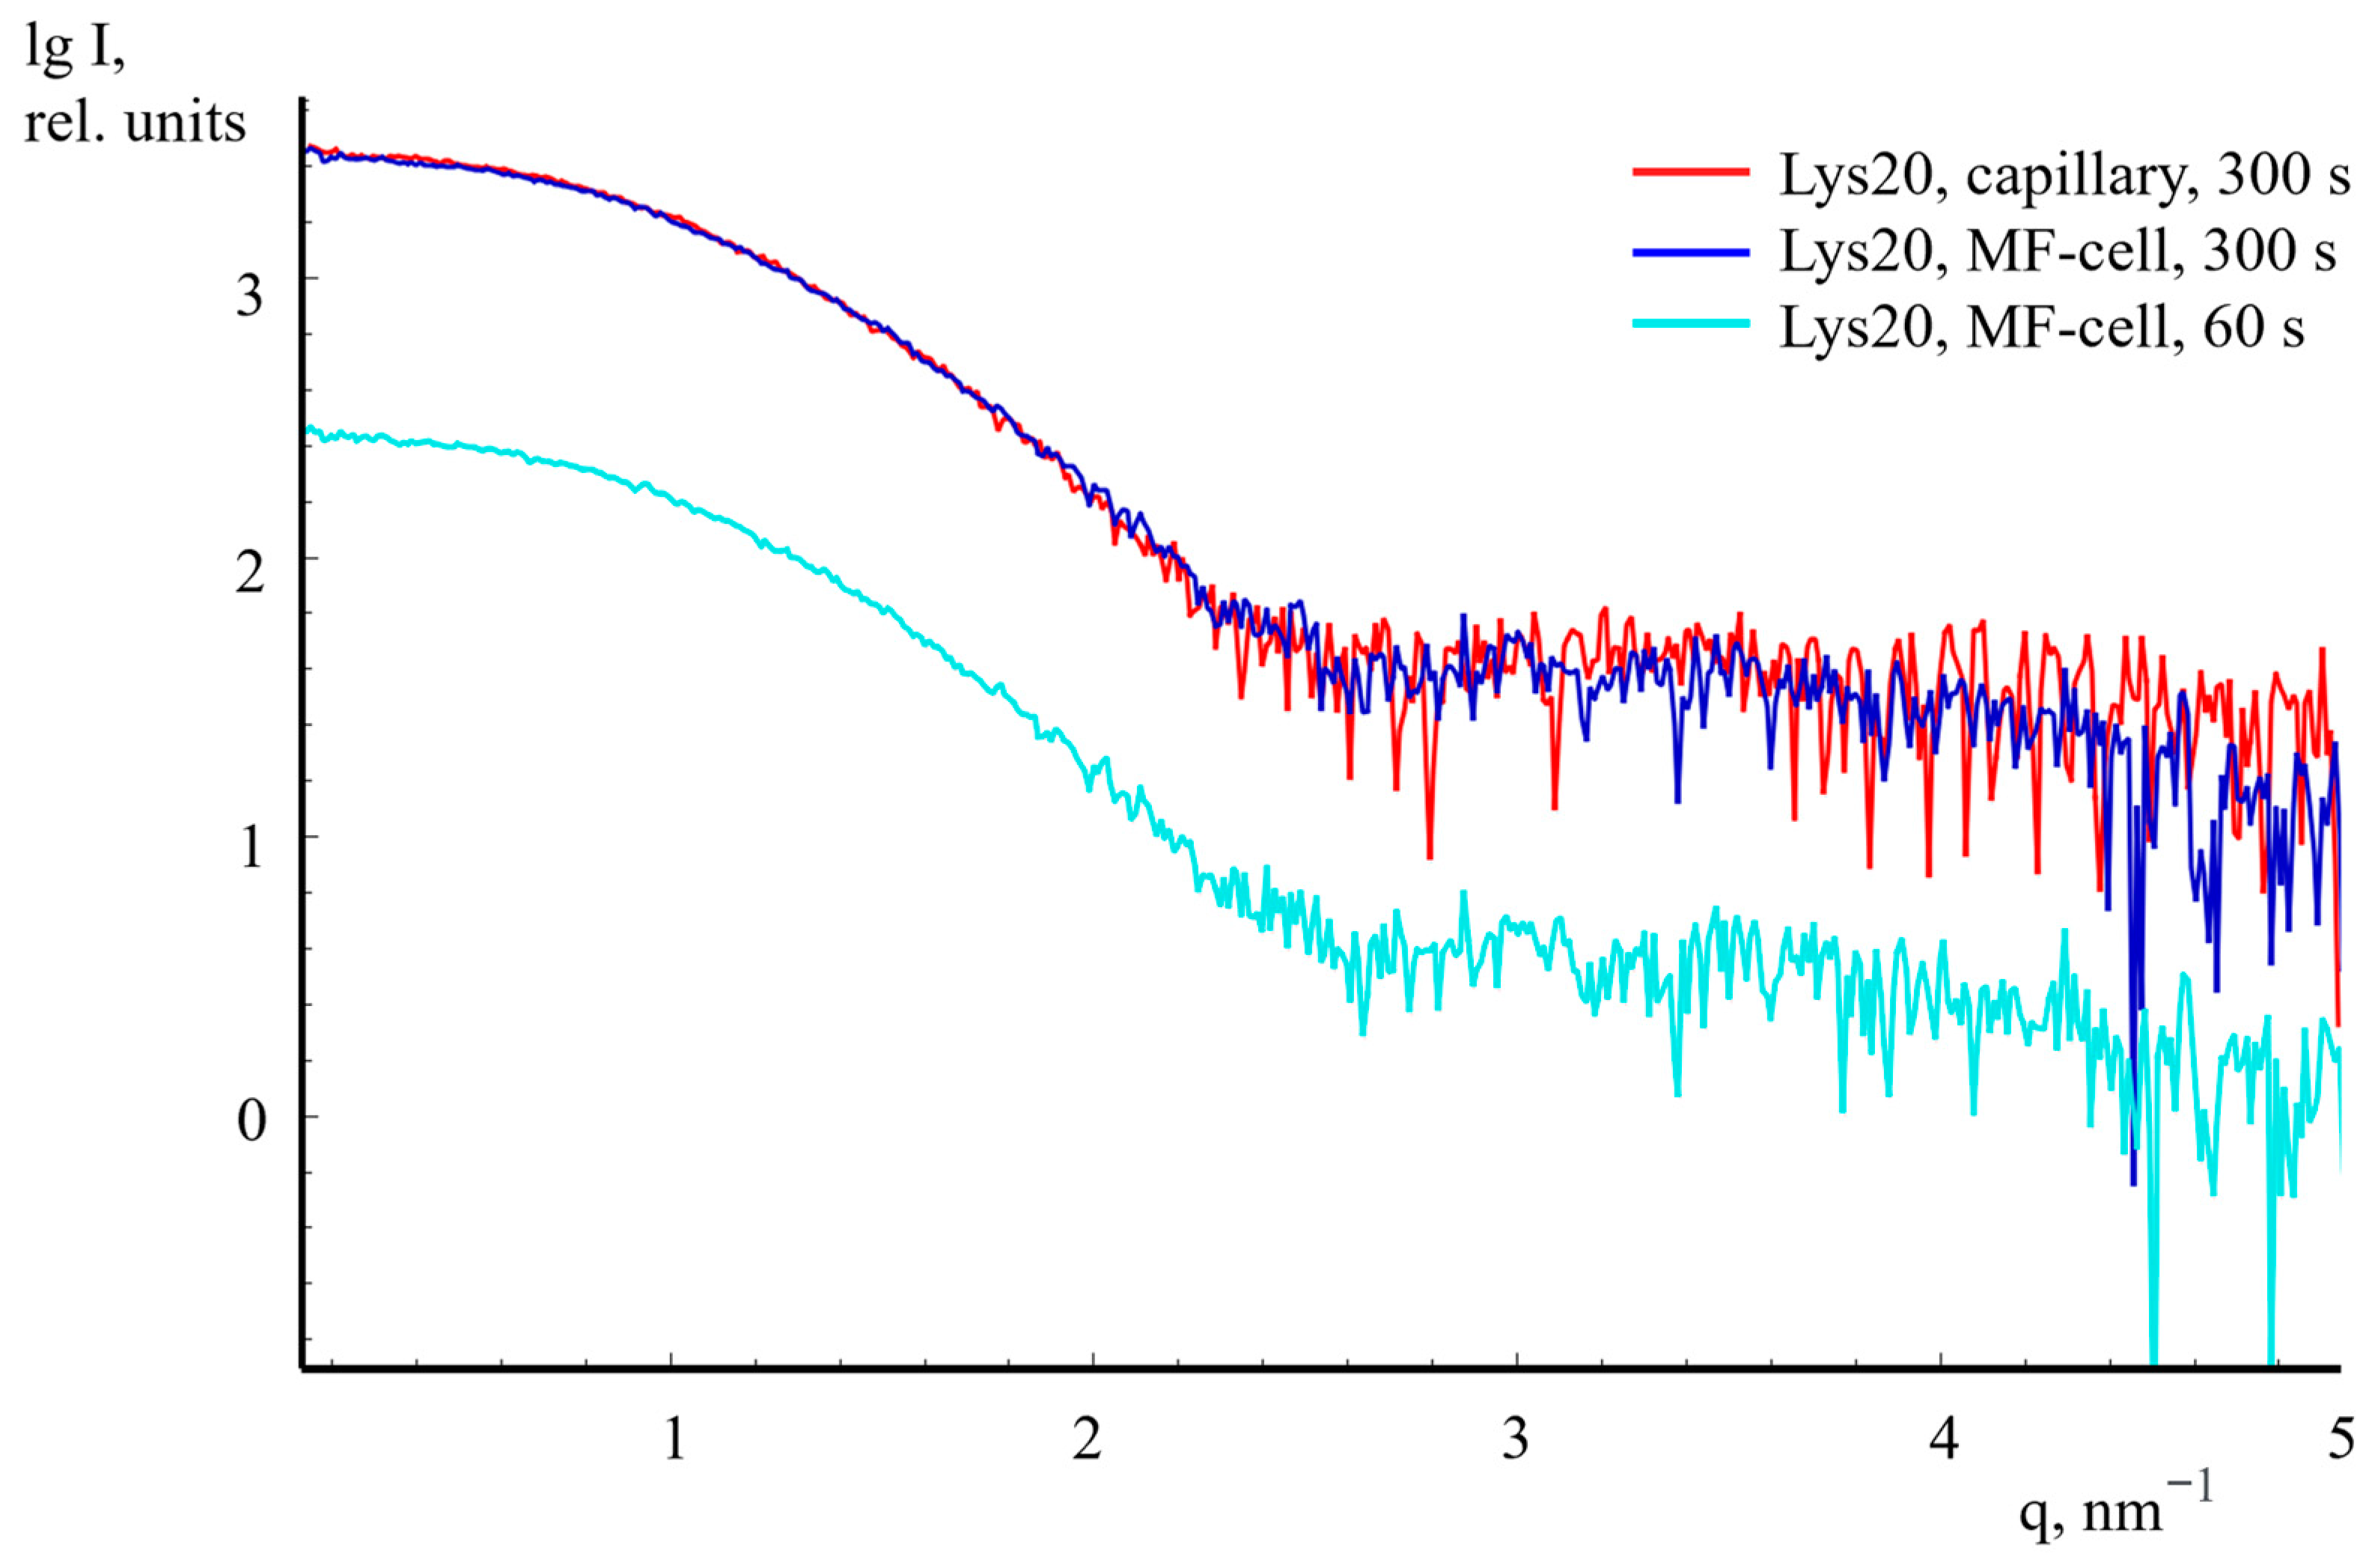
Based on the data obtained for lysozymes at a concentration of 20 mg/mL, the total noise level of the obtained SAXS curves was estimated, which reflects the sigma(rms)/mean parameter. For the curves obtained by subtracting the buffer solution data from the lysozyme solution at an exposure time of 300 s, the ratio of mean square deviations in the range q from 2.5 to 3.5 nm−1 to the average scattering signal level using integration only inside the capillary was 3.29 × 10⁻¹, which is a very high value. When using a microfluidic cell, the ratio of mean square deviations to the average signal level with the same exposure time was 2.14 × 10⁻² (Figure 6).
Reducing exposure by an order of magnitude without significantly losing the quality of SAXS curves, in turn, makes it possible to conduct studies of the dynamics of processes occurring during cell filling.
In order to test the microfluidic cell, the following experiment was performed during such studies: three Shenchen syringe pumps were connected to the microfluidic cell SPLab-04 with syringes filled with (1) NaAc buffer solution pH 4.5, (2) purified lysozyme solution, and (3) high-purity sodium chloride NaCl. Lysozyme and sodium chloride were dissolved in 0.2 M buffer 1. Next, a command was given to start filling the cell with the one solution only at a rate of 1 μL/min, and a time of 10 min was maintained, during which, as expected, based on the technical characteristics indicated above, the microfluidic cell was completely filled with the one solution. After that, a series of continuous exposures was launched with a duration of 60 s and with a detector of the BioMUR beamline, and at the same time, a command was given to start supplying lysozyme and/or precipitant solutions. First, a lysozyme solution of one of three concentrations, 10, 20, or 40 mg/mL, was added to the buffer solution, and SAXS patterns were taken for 10 min (10 exposures in total for each protein concentration). A solution of sodium chloride (precipitant) was then added to the lysozyme solution, the concentration of which increased stepwise every 10 min with values of 12, 18, 24 mg/mL. Thus, the total time of the experiment with each of the concentrations of the lysozyme solution was 40 min, and a total of 120 exposures were recorded (40 for each of the three concentrations).
Figure 7a shows a comparison of 10 time frames (1 min each) when filling the cell with two channels (while supplying the lysozyme solution and the solution containing the precipitant). As can be seen from Figure 7a, the curves obtained starting from the 6th minute coincide with each other, while the preceding curves are very different from each other, which indicates an incomplete change in the sample during this time due to the resulting flows in the area larger than the diameter of the input channels to the sample chamber. Therefore, in the initial data processing, averaging was applied for each sample using the corresponding frame 6÷10. (Figure 7b).
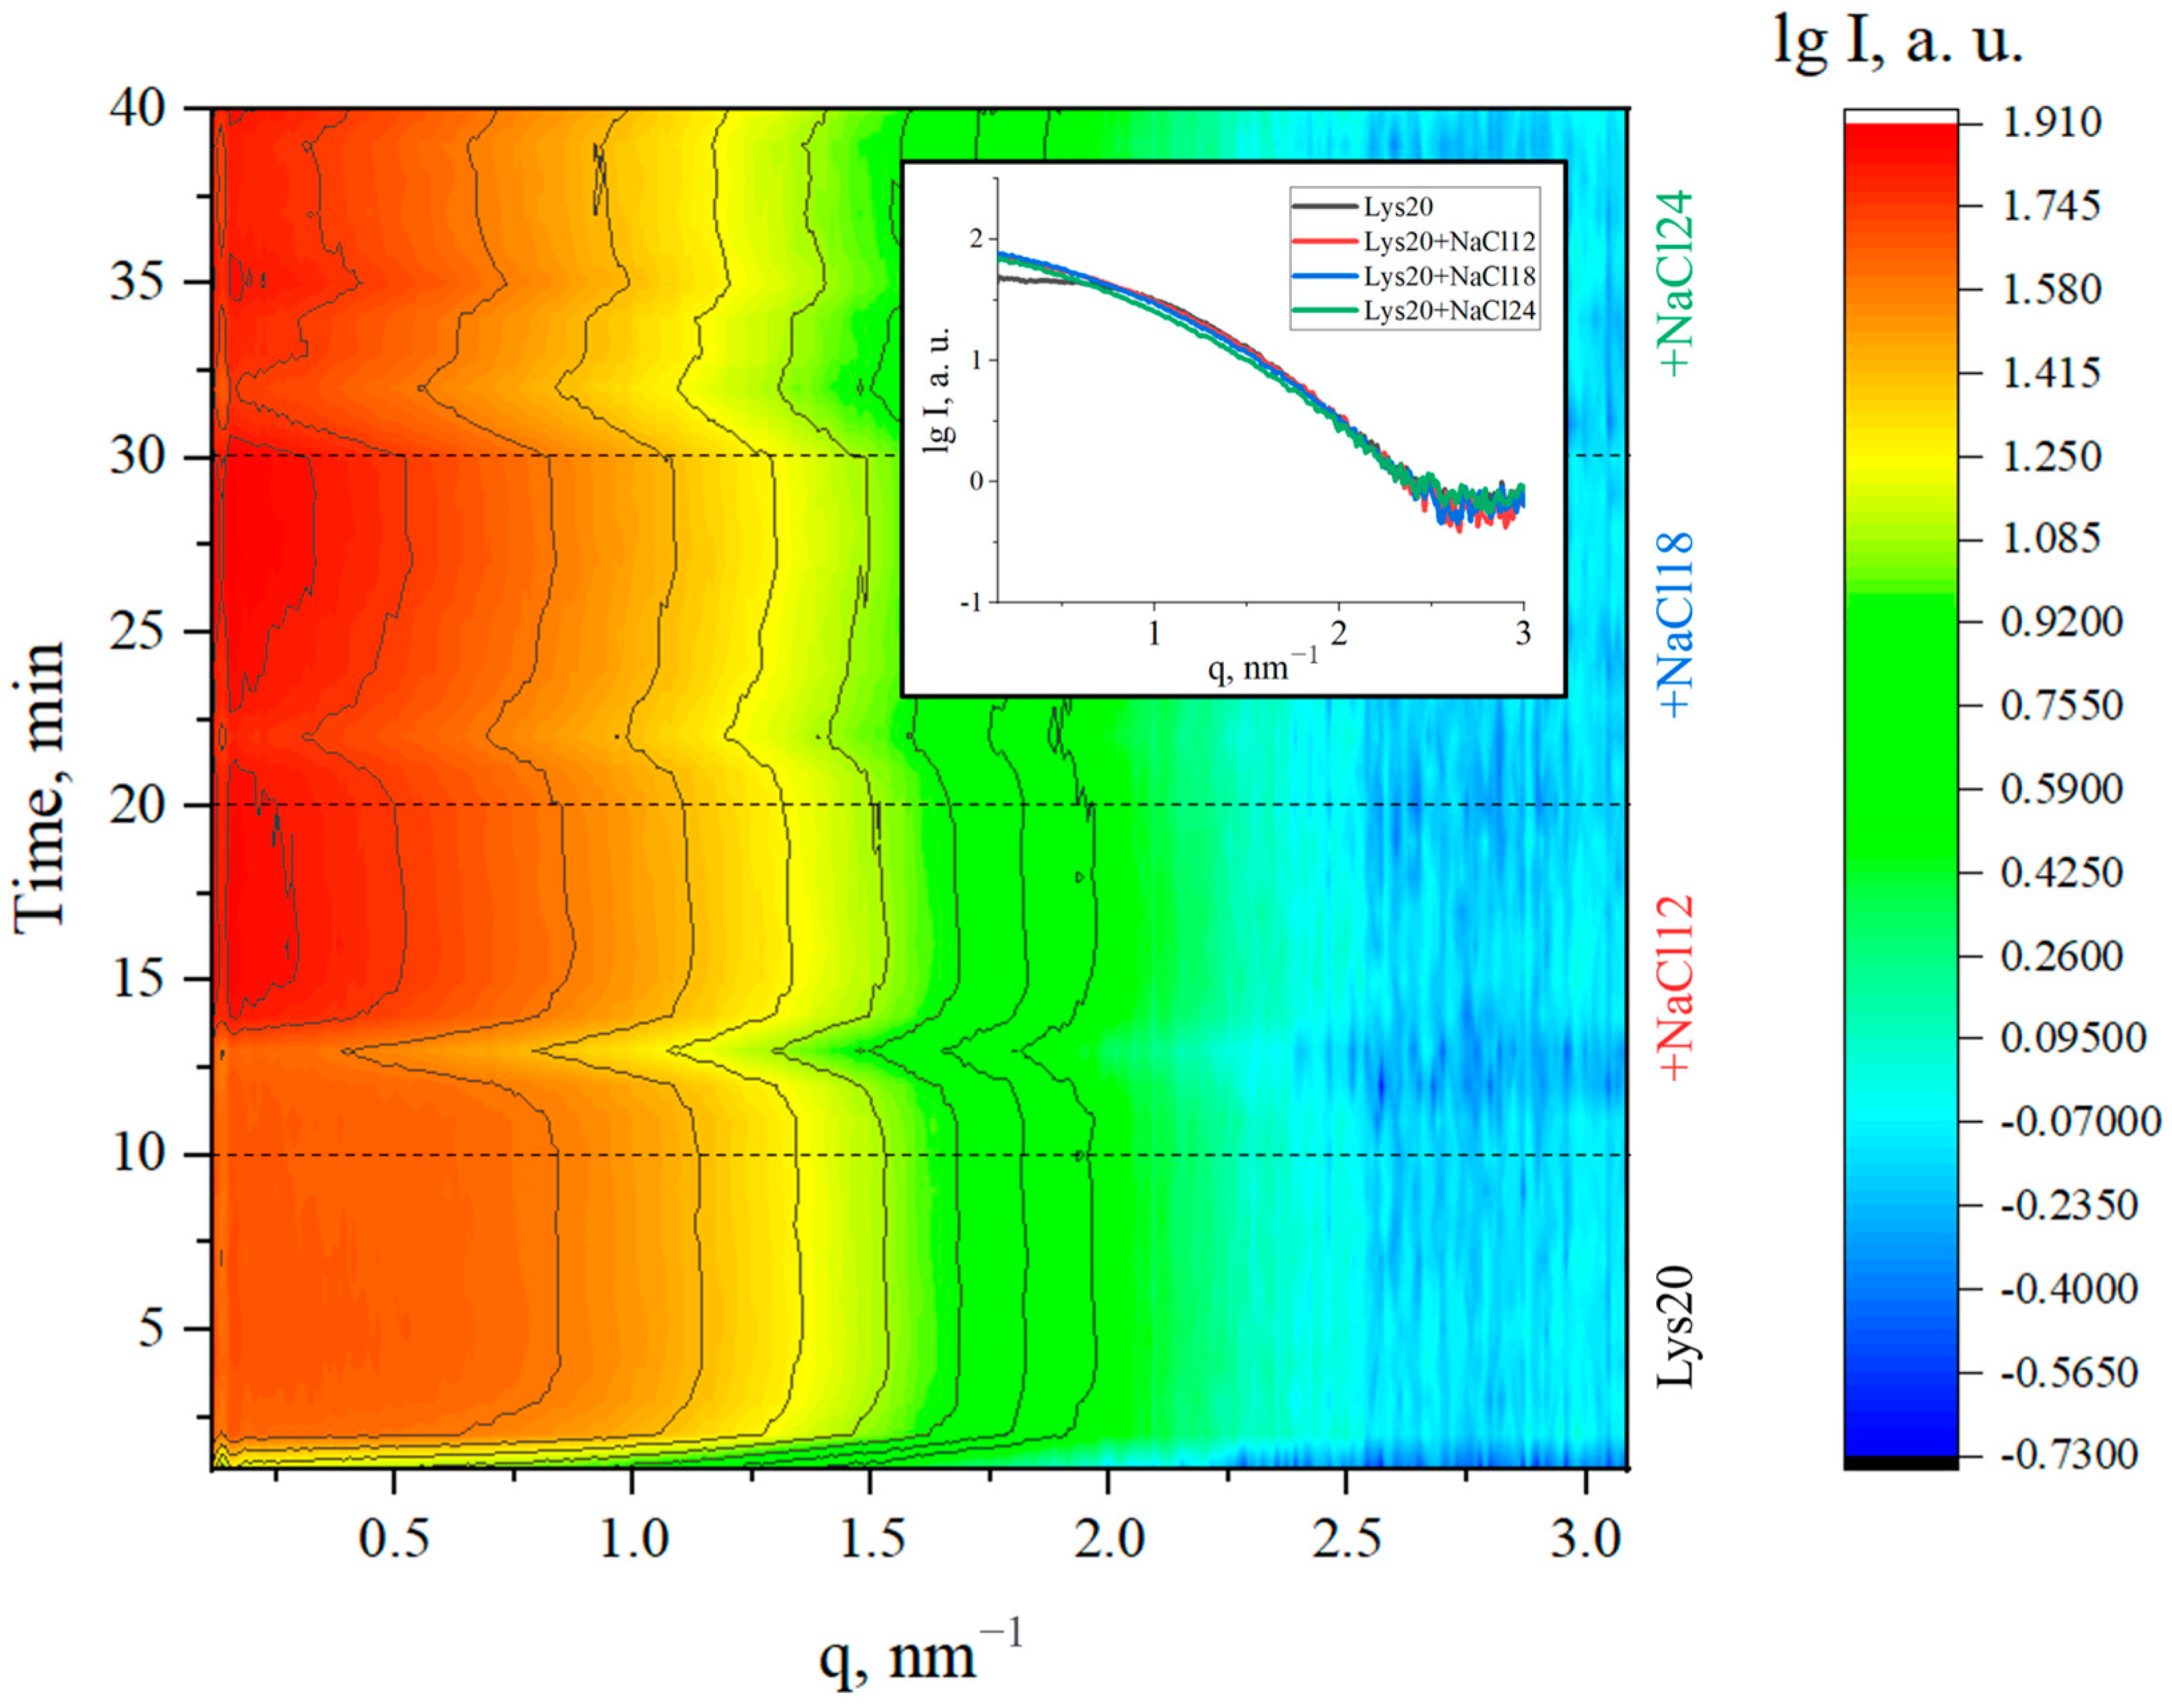
Figure 8 shows two-dimensional contour plots obtained by measuring a complete batch of a 20 mg/mL lysozyme solution with different concentrations of precipitant (0–24 mg/mL), where the color shows the scattering intensity (after subtracting the corresponding buffer signal) depending on the scattering vector and time. It can be clearly seen that stabilization of the solutions takes place after the 5th minute since the beginning of the filling of the samples.
Typical results of experimental data of lysozyme and lysozyme scattering with a precipitant and model curves obtained via the OLIGOMER program [32] using crystallographic models of lysozyme oligomers are shown in Figure 9.
The oligomeric composition of lysozyme protein solution alone and lysozyme solutions with sodium chloride precipitant was obtained by processing experimental data with the OLIGOMER program using crystallographic models of oligomers isolated from the structure of the tetragonal syngony lysozyme crystal. The radius of gyration of the particles (Rg) increased with the addition of precipitant from Rg = 1.41 ± 0.03 nm (without precipitant) to Rg = 2.53 ± 0.03 nm (at a maximum concentration of lysozyme protein and precipitant NaCl), indicating the formation of larger particles in the lysozyme solution upon addition of the precipitant. The use of crystallographic models—dimer, tetramer, hexamer, and octamer—in the processing of experimental data allowed us to determine the type of oligomers and the volume fractions of each of the types of oligomers contained in the solutions. One hundred percent of monomers were found in the lysozyme solution without a precipitant, whereas octamers with volume fractions ranging from 0.4% to 2.6% were found in the lysozyme solution with a precipitant. No intermediate oligomers such as tetramers and hexamers and larger oligomers were found. The results of the SAXS data analysis are presented in Table 2.
The tendency to increase the proportion of octamers with an increase in protein or precipitant concentrations is consistent with the previously obtained results on standard quartz capillaries [15,16,17,18,19,20].

4. Conclusions

A new design of a multichannel microfluidic cell for operation at the BioMUR synchrotron beamline of the KISI-Kurchatov (Kurchatov Institute Research Center, Moscow, Russia) was designed, created, and tested using the example of crystallization solutions of lysozyme in the range of protein concentrations (0–40 mg/mL) and sodium chloride precipitant (0–24 mg/mL).
The use of flat–parallel X-ray transparent windows made it possible to get rid of artifacts in SAXS patterns formed using standard measuring capillaries. As a result of more than an order of magnitude improvement in the signal/noise ratio, it was possible to reduce the exposure time by 10 times without significant loss of SAXS data quality.
The reduction in exposure time, in turn, made it possible to conduct studies of the dynamics of processes occurring during cell filling. It was shown that for the dimensions of the cell made for the parameters of the KISI beam (beam dimensions 0.35 × 0.50 mm on the sample), during the first 6 min in the sample chamber, one solution is replaced by another due to emerging flows in a larger sample chamber compared to the diameter of the input channels. Therefore, data analysis can be performed for measurements taken after 6 min. This is the main disadvantage of the new cell compared with chips described in [9,10,11,12]—the flow velocity in the described cell cannot be higher than 1–2 µL min−1, and, in addition, it requires a significant time for establishing thermodynamical equilibrium after mixing the solutions. However, the advantage of our cell design is the careful selection of the chip material and X-ray translucent windows, which makes the cell environment-independent.
In the future, for more intense third- and fourth-generation SR sources (beam sizes 0.20 × 0.05 mm on the sample), the sample chamber dimensions can be reduced down to the diameter of the inlet channels. This will not only give a gain in the volume of samples used but will also prevent the artifacts from mixing and replacing the old sample with a new one. The high intensity of SR radiation will further reduce exposure time. Along with the above achievements, all this will provide an opportunity to investigate the dynamics of chemical processes.
The study of crystallization solutions of lysozyme confirmed the formation of octamers, which are fragments of the structure of the tetragonal crystal. The observed increase in the octamer ratio with increasing protein or precipitant concentrations is consistent with the previously obtained results of experiments using standard quartz capillaries.

Author Contributions

Conceptualization, M.A.M. and K.B.I.; methodology, P.V.K., M.A.M. and Y.V.P.; software, G.S.P. and P.V.K.; validation, M.A.M., S.V.C., K.B.I., G.S.P., P.V.K. and V.A.S.; formal analysis, G.S.P. and P.V.K.; physical and computational experiment, M.A.M., S.V.C., K.B.I., G.S.P., P.V.K. and V.A.S.; resources, A.V.S.; data curation, G.S.P. and P.V.K.; original draft preparation, M.A.M., G.S.P. and P.V.K.; writing—review, M.A.M., S.V.C., G.S.P., P.V.K. and Y.V.P.; editing, M.A.M., S.V.C., K.B.I., G.S.P., Y.V.P., V.A.S., P.V.K., M.V.K. and A.V.S.; discussion of results, M.A.M., G.S.P., Y.V.P., P.V.K., M.V.K. and A.V.S.; visualization, S.V.C., G.S.P., V.A.S. and P.V.K.; supervision, M.V.K.; project administration, M.A.M.; funding acquisition, M.A.M. and A.V.S. All authors have read and agreed to the published version of the manuscript.

Funding

This research was performed by the Ministry of Science and Higher Education, grant № 075-15-2021-1363, contract No. 208 EP in part of creating the cell, processing SAXS data, and the Ministry of Science and Higher Education within the State assignment FSRC “Crystallography and Photonics” RAS in a part of analyzing the results, creating the cell holder and by the Russian Foundation for Basic Research (project number 19-29-12042 mk) in a part of cell and cell holder design.

Data Availability Statement

Not applicable.

Conflicts of Interest

The authors declare no conflict of interest.

References

  1. Kozyr, E.G.; Njoroge, P.N.; Chapek, S.V.; Shapovalov, V.V.; Skorynina, A.A.; Pnevskaya, A.Y.; Bulgakov, A.N.; Soldatov, A.V.; Pellegrino, F.; Groppo, E.; et al. Operando Laboratory X-ray Absorption Spectroscopy and UV–Vis Study of Pt/TiO2 Photocatalysts during Photodeposition and Hydrogen Evolution Reactions. Catalysts 2023, 13, 414. [Google Scholar] [CrossRef]
  2. Schwemmer, F.; Blanchet, C.E.; Spilotros, A.; Kosse, D.; Zehnle, S.; Mertens, H.D.T.; Graewert, M.A.; Rössle, M.; Paust, N.; Svergun, D.I.; et al. LabDisk for SAXS: A Centrifugal Microfluidic Sample Preparation Platform for Small-Angle X-ray Scattering. Lab Chip 2016, 16, 1161–1170. [Google Scholar] [CrossRef] [PubMed] [Green Version]
  3. Schewa, S.; Schroer, M.A.; Zickmantel, T.; Song, Y.-H.; Blanchet, C.E.; Gruzinov, A.Y.; Katona, G.; Svergun, D.I.; Roessle, M. A THz Transparent 3D Printed Microfluidic Cell for Small Angle X-ray Scattering. Rev. Sci. Instrum. 2020, 91, 084101. [Google Scholar] [CrossRef] [PubMed]
  4. García-Lojo, D.; Modin, E.; Gómez-Graña, S.; Impéror-Clerc, M.; Chuvilin, A.; Pastoriza-Santos, I.; Pérez-Juste, J.; Constantin, D.; Hamon, C. Structure and Formation Kinetics of Millimeter-Size Single Domain Supercrystals. Adv. Funct. Mater. 2021, 31, 2101869. [Google Scholar] [CrossRef]
  5. Anaraki, N.I.; Sadeghpour, A.; Iranshahi, K.; Toncelli, C.; Cendrowska, U.; Stellacci, F.; Dommann, A.; Wick, P.; Neels, A. New Approach for Time-Resolved and Dynamic Investigations on Nanoparticles Agglomeration. Nano Res. 2020, 13, 2847–2856. [Google Scholar] [CrossRef]
  6. Lange, T.; Charton, S.; Bizien, T.; Testard, F.; Malloggi, F. OSTE+ for in Situ SAXS Analysis with Droplet Microfluidic Devices. Lab Chip 2020, 20, 2990–3000. [Google Scholar] [CrossRef] [PubMed]
  7. Guda, A.A.; Kirichkov, M.V.; Shapovalov, V.V.; Muravlev, A.I.; Pashkov, D.M.; Guda, S.A.; Bagliy, A.P.; Soldatov, S.A.; Chapek, S.V.; Soldatov, A.V. Machine Learning Analysis of Reaction Parameters in UV-Mediated Synthesis of Gold Nanoparticles. J. Phys. Chem. C 2023, 127, 1097–1108. [Google Scholar] [CrossRef]
  8. Khvostichenko, D.S.; Kondrashkina, E.; Perry, S.L.; Pawate, A.S.; Brister, K.; Kenis, P.J.A. An X-ray Transparent Microfluidic Platform for Screening of the Phase Behavior of Lipidic Mesophases. Analyst 2013, 138, 5384. [Google Scholar] [CrossRef] [Green Version]
  9. Ghazal, A.; Lafleur, J.P.; Mortensen, K.; Kutter, J.P.; Arleth, L.; Jensen, G.V. Recent advances in X-ray compatible microfluidics for applications in soft materials and life sciences. Lab Chip 2016, 16, 4263–4295. [Google Scholar] [CrossRef] [Green Version]
  10. Silva, B.F. SAXS on a chip: From dynamics of phase transitions to alignment phenomena at interfaces studied with microfluidic devices. Phys. Chem. Chem. Phys. 2017, 19, 23690–23703. [Google Scholar] [CrossRef]
  11. Khaliqi, K.; Ghazal, A.; Azmi, I.D.M.; Amenitsch, H.; Mortensen, K.; Salentinig, S.; Yaghmur, A. Direct monitoring of lipid transfer on exposure of citrem nanoparticles to an ethanol solution containing soybean phospholipids by combining synchrotron SAXS with microfluidics. Analyst 2017, 142, 3118–3126. [Google Scholar] [CrossRef] [PubMed]
  12. Martin, H.P.; Brooks, N.J.; Seddon, J.M.; Luckham, P.F.; Terrill, N.J.; Kowalski, A.J.; Cabral, J.T. Microfluidic processing of concentrated surfactant mixtures: Online SAXS, microscopy and rheology. Soft Matter 2016, 12, 1750–1758. [Google Scholar] [CrossRef] [PubMed] [Green Version]
  13. Karthika, S.; Radhakrishnan, T.K.; Kalaichelvi, P. A Review of Classical and Nonclassical Nucleation Theories. Cryst. Growth Des. 2016, 16, 6663–6681. [Google Scholar] [CrossRef]
  14. Ivanov, V.K.; Fedorov, P.P.; Baranchikov, A.Y.; Osiko, V. V Oriented Attachment of Particles: 100 Years of Investigations of Non-Classical Crystal Growth. Russ. Chem. Rev. 2014, 83, 1204–1222. [Google Scholar] [CrossRef]
  15. De Yoreo, J.J.; Gilbert, P.U.P.A.; Sommerdijk, N.A.J.M.; Penn, R.L.; Whitelam, S.; Joester, D.; Zhang, H.; Rimer, J.D.; Navrotsky, A.; Banfield, J.F.; et al. Crystallization by Particle Attachment in Synthetic, Biogenic, and Geologic Environments. Science 2015, 349, aaa6760. [Google Scholar] [CrossRef] [PubMed]
  16. Krauss, I.R.; Merlino, A.; Vergara, A.; Sica, F.; Russo Krauss, I.; Merlino, A.; Vergara, A.; Sica, F. An Overview of Biological Macromolecule Crystallization. Int. J. Mol. Sci. 2013, 14, 11643–11691. [Google Scholar] [CrossRef] [Green Version]
  17. McPherson, A. Introduction to Protein Crystallization. Methods 2004, 34, 254–265. [Google Scholar] [CrossRef] [Green Version]
  18. Berman, H.M. The Protein Data Bank. Nucleic Acids Res. 2000, 28, 235–242. [Google Scholar] [CrossRef] [PubMed] [Green Version]
  19. Kovalchuk, M.V.; Blagov, A.E.; Dyakova, Y.A.; Gruzinov, A.Y.; Marchenkova, M.A.; Peters, G.S.; Pisarevsky, Y.V.; Timofeev, V.I.; Volkov, V.V. Investigation of the Initial Crystallization Stage in Lysozyme Solutions by Small-Angle X-ray Scattering. Cryst. Growth Des. 2016, 16, 1792–1797. [Google Scholar] [CrossRef]
  20. Marchenkova, M.A.; Volkov, V.V.; Blagov, A.E.; Dyakova, Y.A.; Ilina, K.B.; Tereschenko, E.Y.; Timofeev, V.I.; Pisarevsky, Y.V.; Kovalchuk, M.V. In Situ Study of the State of Lysozyme Molecules at the Very Early Stage of the Crystallization Process by Small-Angle X-ray Scattering. Crystallogr. Rep. 2016, 61, 5–10. [Google Scholar] [CrossRef]
  21. Boikova, A.S.; Dyakova, Y.A.; Ilina, K.B.; Konarev, P.V.; Kryukova, A.E.; Kuklin, A.I.; Marchenkova, M.A.; Nabatov, B.V.; Blagov, A.E.; Pisarevsky, Y.V.; et al. Octamer Formation in Lysozyme Solutions at the Initial Crystallization Stage Detected by Small-Angle Neutron Scattering. Acta Crystallogr. Sect. D 2017, 73, 591–599. [Google Scholar] [CrossRef] [PubMed]
  22. Boikova, A.S.; D’yakova, Y.A.; Il’ina, K.B.; Konarev, P.V.; Kryukova, A.E.; Marchenkova, M.A.; Blagov, A.E.; Pisarevskii, Y.V.; Koval’chuk, M.V. Small-Angle X-ray Scattering Study of the Influence of Solvent Replacement (from H2O to D2O) on the Initial Crystallization Stage of Tetragonal Lysozyme. Crystallogr. Rep. 2017, 62, 837–842. [Google Scholar] [CrossRef]
  23. Dyakova, Y.A.; Boikova, A.S.; Ilina, K.B.; Konarev, P.V.; Marchenkova, M.A.; Pisarevsky, Y.V.; Timofeev, V.I.; Kovalchuk, M.V. Study of the Influence of a Precipitant Cation on the Formation of Oligomers in Crystallization Solutions of Lysozyme Protein. Crystallogr. Rep. 2019, 64, 11–15. [Google Scholar] [CrossRef]
  24. Marchenkova, M.A.; Konarev, P.V.; Boikova, A.S.; Ilina, K.B.; Pisarevsky, Y.V.; Kovalchuk, M.V. Influence of Chlorides of Mono- and Divalent Metals on the Oligomeric Composition of Lysozyme Crystallization Solutions and Further Crystal Growth. Crystallogr. Rep. 2021, 66, 751–757. [Google Scholar] [CrossRef]
  25. Kovalchuk, M.V.; Alekseeva, O.A.; Blagov, A.E.; Ilyushin, G.D.; Il’ina, K.B.; Konarev, P.V.; Lomonov, V.A.; Pisarevsky, Y.V.; Peters, G.S. Investigation of the Structure of Crystal-Forming Solutions of Potassium Dihydrogen Phosphate K(H2PO4) (KDP Type) on the Basis of Modeling Precursor Clusters and According to Small-Angle X-ray Scattering Data. Crystallogr. Rep. 2019, 64, 6–10. [Google Scholar] [CrossRef]
  26. Kovalchuk, M.V.; Boikova, A.S.; Dyakova, Y.A.; Ilina, K.B.; Konarev, P.V.; Kryukova, A.E.; Marchenkova, M.A.; Pisarevsky, Y.V.; Timofeev, V.I. Pre-Crystallization Phase Formation of Thermolysin Hexamers in Solution Close to Crystallization Conditions. J. Biomol. Struct. Dyn. 2019, 37, 3058–3064. [Google Scholar] [CrossRef]
  27. Boikova, A.S.; Dyakova, Y.A.; Ilina, K.B.; Konarev, P.V.; Kryukova, A.E.; Marchenkova, M.A.; Pisarevsky, Y.V.; Kovalchuk, M.V. Investigation of the Pre-Crystallization Stage of Proteinase K in Solution (Influence of Temperature and Precipitant Type) by Small-Angle X-ray Scattering. Crystallogr. Rep. 2018, 63, 865–870. [Google Scholar] [CrossRef]
  28. Marchenkova, M.A.; Konarev, P.V.; Rakitina, T.V.; Timofeev, V.I.; Boikova, A.S.; Dyakova, Y.A.; Ilina, K.B.; Korzhenevskiy, D.A.; Yu Nikolaeva, A.; Pisarevsky, Y.V.; et al. Dodecamers Derived from the Crystal Structure Were Found in the Pre-Crystallization Solution of the Transaminase from the Thermophilic Bacterium Thermobaculum Terrenum by Small-Angle X-ray Scattering. J. Biomol. Struct. Dyn. 2020, 38, 2939–2944. [Google Scholar] [CrossRef]
  29. van der Linden, P.J.E.M.; Popov, A.M.; Pontoni, D. Accurate and Rapid 3D Printing of Microfluidic Devices Using Wavelength Selection on a DLP Printer. Lab Chip 2020, 20, 4128–4140. [Google Scholar] [CrossRef] [PubMed]
  30. Peters, G.S.; Zakharchenko, O.A.; Konarev, P.V.; Karmazikov, Y.V.; Smirnov, M.A.; Zabelin, A.V.; Mukhamedzhanov, E.H.; Veligzhanin, A.A.; Blagov, A.E.; Kovalchuk, M.V. The Small-Angle X-ray Scattering Beamline BioMUR at the Kurchatov Synchrotron Radiation Source. Nucl. Instrum. Methods Phys. Res. A 2019, 945, 162616. [Google Scholar] [CrossRef]
  31. Hammersley, A.P. FIT2D: A Multi-Purpose Data Reduction, Analysis and Visualization Program. J. Appl. Crystallogr. 2016, 49, 646–652. [Google Scholar] [CrossRef]
  32. Konarev, P.V.; Volkov, V.V.; Sokolova, A.V.; Koch, M.H.J.; Svergun, D.I. PRIMUS: A Windows PC-Based System for Small-Angle Scattering Data Analysis. J. Appl. Crystallogr. 2003, 36, 1277–1282. [Google Scholar] [CrossRef]
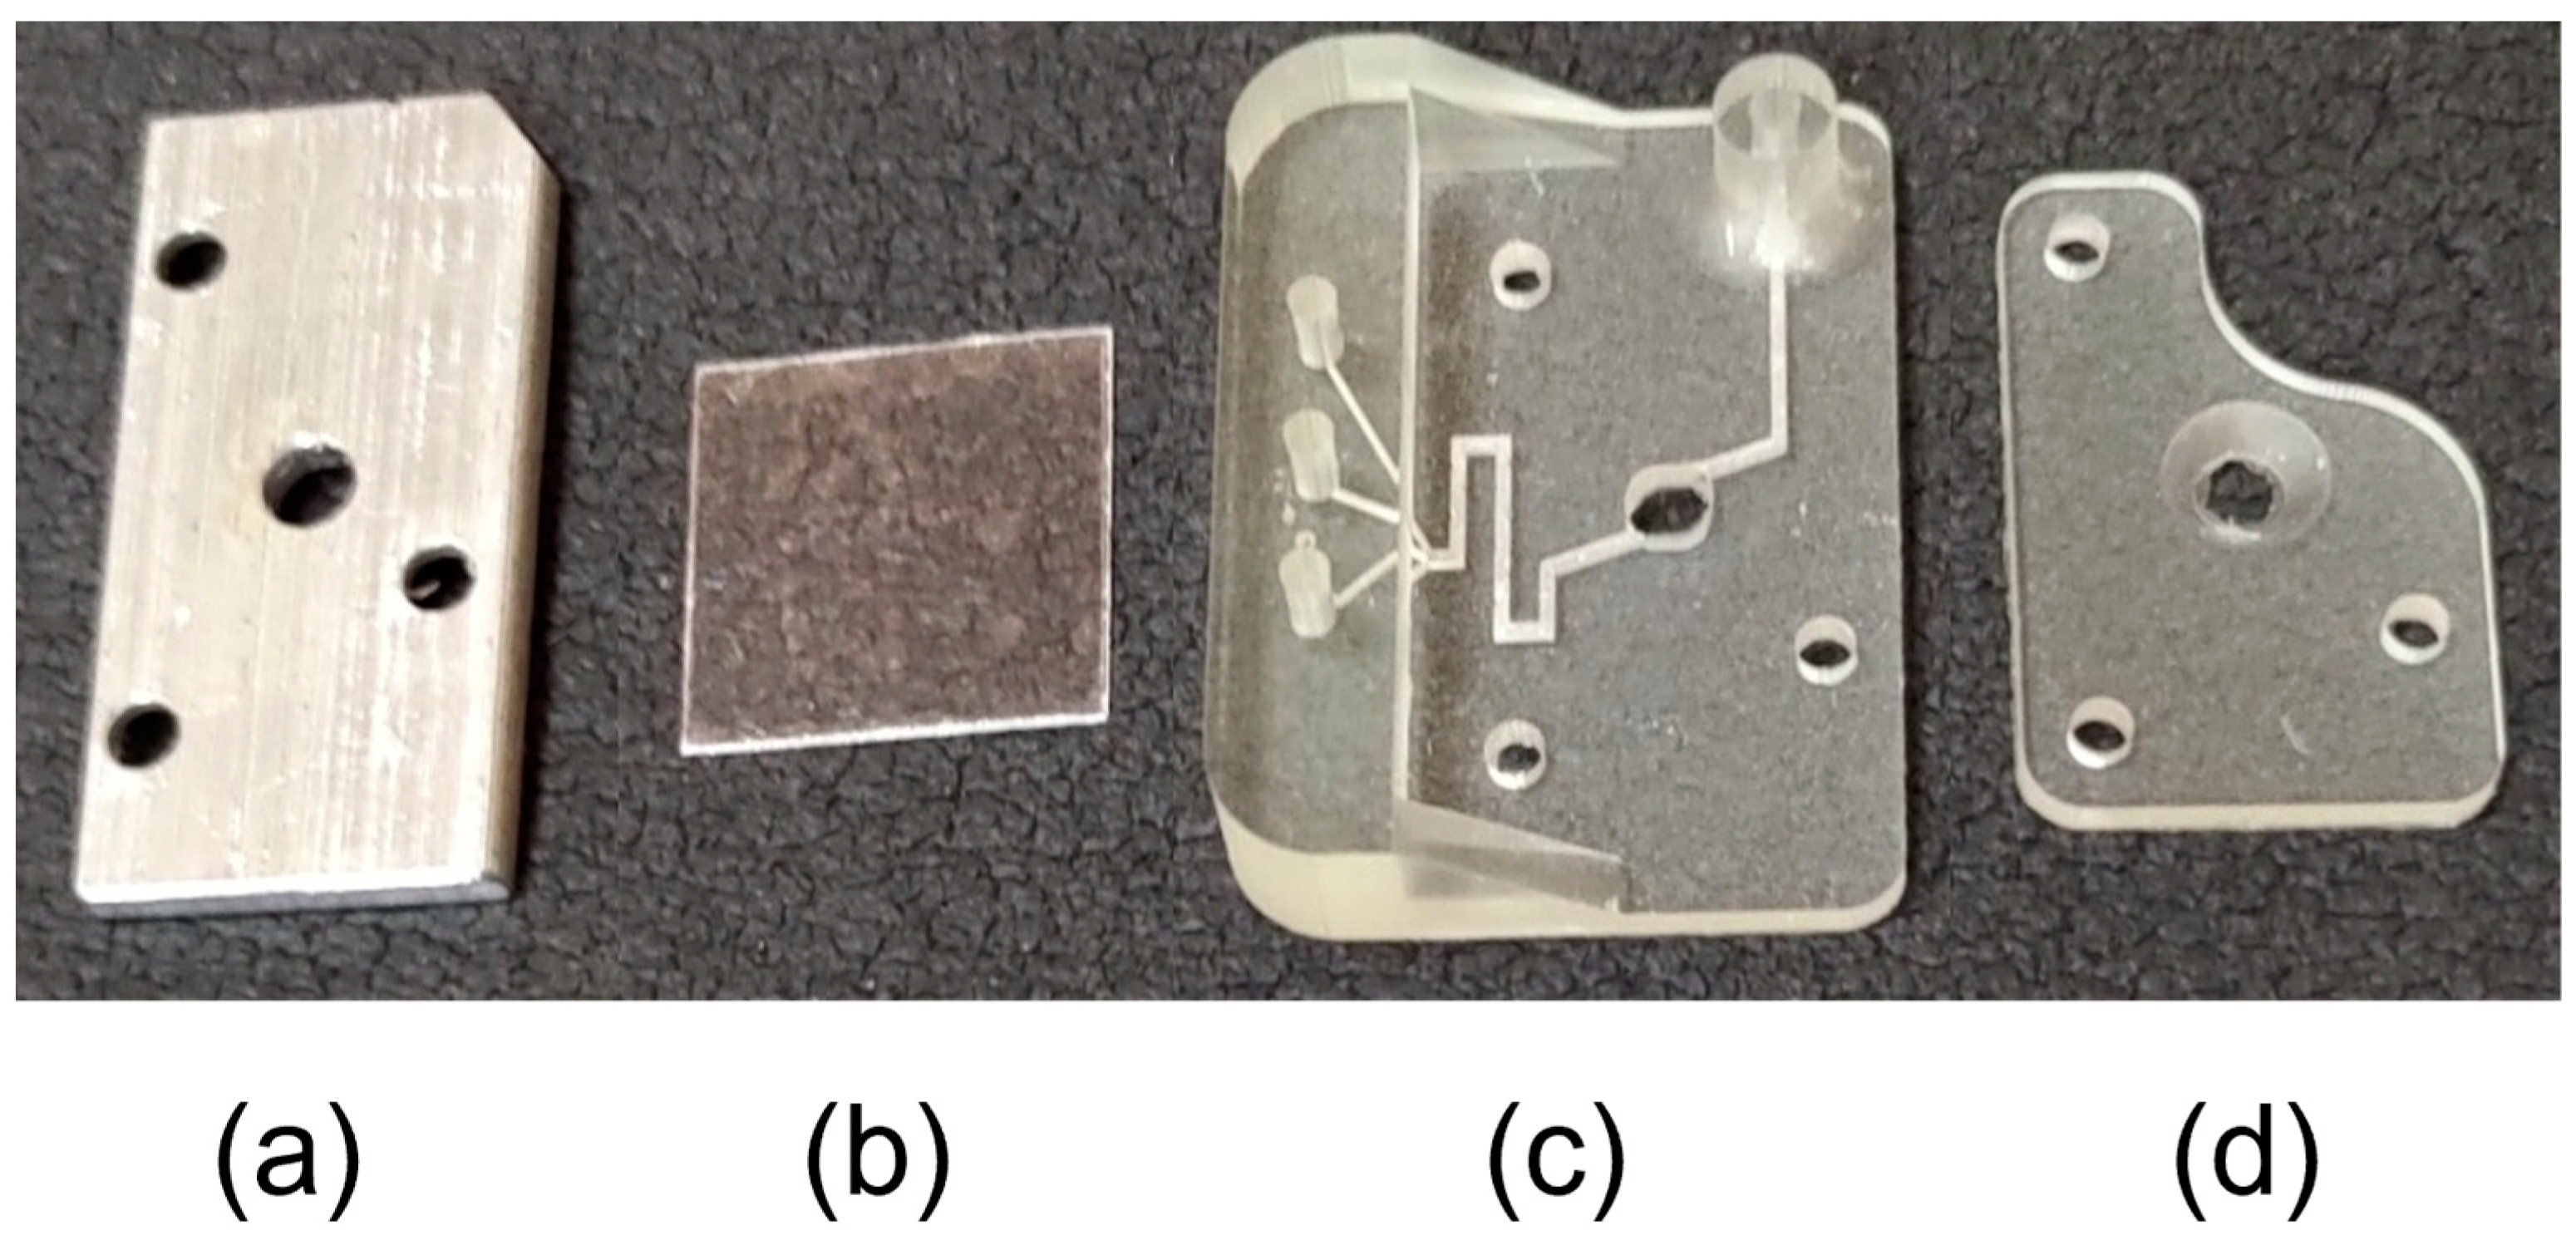
Figure 1. Multichannel microfluidic measuring cell: (a) base, (b) X-ray transparent window, (c) cell body, (d) pressure platform.
Crystals 13 00938 g001
Figure 2. Diagram of a multichannel microfluidic measuring cell (a) and configuration of channels (b).
Crystals 13 00938 g002
Figure 3. Drawing (left and center) and photo (right) of monolithic microfluidic cell holder: 1—base; 2—clamps of a rolling pin system a rolling pin system; 3, 4—rolling pin system; 5—supporting L-shaped brackets; 6—locking screws; 7—heat exchange table.
Crystals 13 00938 g003
Figure 4. Scheme of artifacts appearing on the detector when shooting in the capillary. Length AB—radiation scattered to the sample that is not absorbed by the sample; segment BC—radiation provoked by the effect of complete external reflection of scattered radiation from the walls of the capillary.
Crystals 13 00938 g004
Figure 5. Two-dimensional SAXS patterns of lysozyme solutions with a concentration of 20 mg/mL in the capillary (a) and in the microfluidic cell (b). Red indicates the integration area, which does not contain artifacts at all scattering angles. Gray—a possible expansion of the integration area, which turned out to be inappropriate due to the presence of an inactive gap between the detecting units of the detector.
Crystals 13 00938 g005
Figure 6. Plots of Lys20 curves—at an exposure of 300 s in the capillary (red), in the microfluidic cell (blue), and with a decrease in exposure to 60 s (cyan).
Crystals 13 00938 g006
Figure 7. (a) Microfluidic cell-filling dynamics using two input channels. Experimental SAXS curves from 20 mg/mL lysozyme solution and 18 mg/mL NaCl precipitant concentration. The figure shows ten frames (exposure time—1 min), and signal stabilization occurs after frame 5. (b) Experimental SAXS curves from 10 mg/mL (curve 1), 20 mg/mL (curve 2), and 40 mg/mL (curve 3) lysozyme solutions and buffer solution (curve 4); the concentration of NaCl precipitant in buffer solution was 18 mg/mL. The signal was averaged over frames corresponding to the stabilized signal (time frames 6/10).
Crystals 13 00938 g007
Figure 8. Scattering intensity (color) versus scattering vector and time obtained for a series of lysozyme solution of 20 mg/mL concentration with different concentrations of precipitant (0–24 mg/mL) (intensities obtained after subtracting the corresponding buffer signals). Solid lines show the levels of equal intensity. Dashed lines show the starting points of each new solution. On the insert are the final SAXS curves from each mixture obtained 10 min after the start of the solution supply.
Crystals 13 00938 g008
Figure 9. Buffer-subtracted experimental SAXS curves (points) and the best fits (black lines) calculated by the OLIGOMER program from lysozyme solutions with concentrations of 10 mg/mL (a), 20 mg/mL (b), and 40 mg/mL (c). The concentration of NaCl precipitant ranged from 12 to 24 mg/mL (6 mg/mL increments). The curves are vertically shifted for better visualization. Measurements are made in a flow-through multichannel microfluidic cell at a temperature of 20 °C.
Crystals 13 00938 g009
Table 1. Feed rates of protein, precipitant, and buffer solutions to achieve different crystallization conditions. The rates are indicated in mL/hr. The concentrations of the sample mother liquors are shown in parentheses.
Precipitant0 mg/mL12 mg/mL (60 mg/mL)18 mg/mL (60 mg/mL)24 mg/mL (60 mg/mL)
Protein
0 mg/mLVprot = 0Vprot = 0Vprot = 0Vprot = 0
Vpret = 0Vpret = 0.2Vpret = 0.3Vpret = 0.4
Vbuf = 1Vbuf = 0.8Vbuf = 0.7Vbuf = 0.6
10 mg/mL (20 mg/mL)Vprot = 0.5Vprot = 0.5Vprot = 0.5Vprot = 0.5
Vpret = 0Vpret = 0.2Vpret = 0.3Vpret = 0.4
Vbuf = 0.5Vbuf = 0.3Vbuf = 0.2Vbuf = 0.3
20 mg/mL (40 mg/mL)Vprot = 0.5Vprot = 0.5Vprot = 0.5Vprot = 0.5
Vpret = 0Vpret = 0.2Vpret = 0.3Vpret = 0.4
Vbuf = 0.5Vbuf = 0.3Vbuf = 0.2Vbuf = 0.3
40 mg/mL (80 mg/mL)Vprot = 0.5Vprot = 0.5Vprot = 0.5Vprot = 0.5
Vpret = 0Vpret = 0.2Vpret = 0.3Vpret = 0.4
Vbuf = 0.5Vbuf = 0.3Vbuf = 0.2Vbuf = 0.3
Table 2. Radii of gyration and volume fractions of monomers, dimers, and octamers for lysozyme crystallization solutions (10, 20, and 40 mg/mL) without precipitant and with the addition of sodium chloride precipitating agent (12 mg/mL, 18 mg/mL, 24 mg/mL). The final concentrations of substances in the sample chamber are indicated.
Lysozyme Concentration, mg/mLConcentration of NaCl Precipitant, mg/mLRg, nmProportion of Monomers,%Proportion of Dimers, %Percentage of Octamers,%
1001.41 ± 0.0310000
10121.69 ± 0.0398.7 ± 0.501.3 ± 0.1
10181.72 ± 0.0398.4 ± 0.501.6 ± 0.1
10241.85 ± 0.0397.6 ± 0.502.4 ± 0.1
2001.42 ± 0.0310000
20121.80 ± 0.0396.4 ± 0.51.8 ± 0.11.8 ± 0.1
20182.04 ± 0.0394.5 ± 0.51.7 ± 0.13.8 ± 0.1
20242.16 ± 0.0393.1 ± 0.51.8 ± 0.15.1 ± 0.1
4001.43 ± 0.0310000
40121.94 ± 0.0396.6 ± 0.50.8 ± 0.12.6 ± 0.1
40182.43 ± 0.0389.9 ± 0.51.2 ± 0.18.9 ± 0.1
40242.53 ± 0.0387.1 ± 0.52.0 ± 0.110.9 ± 0.1
Disclaimer/Publisher’s Note: The statements, opinions and data contained in all publications are solely those of the individual author(s) and contributor(s) and not of MDPI and/or the editor(s). MDPI and/or the editor(s) disclaim responsibility for any injury to people or property resulting from any ideas, methods, instructions or products referred to in the content.