Abstract
Power generation based on thermoelectric (TE) materials is very attractive due to its low environmental impact and waste heat recovery. Thermoelectric materials based on cobalt triantimonide CoSb3 exhibit one of the highest energy conversion efficiencies, revealing thermoelectric figures of merit, ZTs > 1, but undergo oxidation above 380 °C and sublimation above 500 °C. In this work, a glass-ceramic coating was chosen to match the coefficient of thermal expansion (CTE) of the TE substrate 9.2 × 10⁻⁶ K−1 (200–400 °C), deposition temperature (max. 700 °C), and maximum working temperature (600 °C). Coating processing involved the production of glass powder and glass-ceramic sintering. The glass-ceramic and the coating/CoSb3 interface were systematically investigated by means of dilatometry, X-ray diffraction, and scanning and transmission electron microscopy. As a result, a coating with good substrate coverage and adherence was developed. Finally, oxidation tests were carried out at 500 and 600 °C in order to assess the protective properties of the glass-ceramic. Microstructural and chemical composition analysis indicated limited protective properties of the coating.
1. Introduction
In today’s world, growing attention is focused on eco-friendly power generation. In addition to alternative energy sources, another possibility for lowering CO2 emissions is to increase the efficiency of the current energy conversion processes. This is the potential offered by thermoelectric materials, owing to their ability to convert heat energy directly into electricity. They allow the generation of energy from natural heat sources, as well as from waste heat, which in some processes can be up to 70% [1]. Modern thermoelectric materials usually offer efficiencies of less than 10% [2]. Therefore, maintaining their high performance for a long time is of great importance. Generally, the ability of TE materials for power generation is defined by the so-called thermoelectric figure of merit, ZT, which initially grows with temperature, and after reaching the maximum, it decreases. Since the efficiency of TE material is the highest within a certain temperature range, TE devices often require operation at elevated temperatures. This in turn carries the risk of intensified degradation, especially for materials prone to oxidation. Providing protection or limiting degradation processes can thus significantly contribute to improving the overall efficiency of the power generation process.
Among many thermoelectrics, skutterudites based on cobalt triantimonide CoSb3 exhibit promising properties for efficient power generation, such as a relatively high Seebeck coefficient (up to 210 μV/K for p-type and −280 μV/K for n-type at 527 °C) and ZT > 1 [3,4,5]. However, in the temperature range of the highest efficiency (~450–650 °C), skutterudites tend to degrade. In the air above 380 °C, CoSb3 undergoes strong oxidation associated with the formation of a multilayer scale, even at short-term exposure [6,7]. Moreover, antimony sublimates from the bulk starting from 500 °C [8,9]; thus, CoSb3 decomposes to the lower antimonides CoSb2 and CoSb, and deterioration of thermoelectric properties is observed.
Anticorrosion coatings have been investigated for decades, and many reliable solutions are well-known, and new ones are constantly under development. Depending on the application, either in electrochemical corrosion protection or hot-temperature oxidation, different concepts can be proposed. For example, for electrochemical corrosion, relatively new and interesting coatings are self-healing systems [10,11,12,13,14,15,16] employing electrically conductive polymers [17,18,19,20,21]. In the case of protective coatings for high-temperature applications, such as those for skutterudites, the selection of the protection system depends on several important factors. Demands for oxidation-resistant coatings incorporate chemical compatibility (wetting properties and chemical stability) and thermomechanical compatibility (thermal expansion). High-temperature protective coatings should show as high oxidation resistance as possible. Depending on the operating conditions, they should provide a diffusion barrier for gases and/or liquids as well as stability in contact with chemical agents. Other important factors are good adhesion, low oxygen permeability, and oxidation resistance of the coating. Among the anticorrosion coatings for high-temperature applications, the most commonly used are carbides, oxides, borides, nitrides, and silicides, or their mixtures, e.g., MCrAlY and TBC [22,23,24,25,26,27,28].
Different types of high-temperature protective systems for CoSb3-based materials were tested over the years. Several approaches addressed protection against antimony sublimation in an oxygen-free environment [29,30,31,32] and a few against oxidation [33,34,35,36,37]. Glass-based coatings are of interest as protective coatings for both n- and p-type thermoelectrics. There is a growing body of literature that recognizes the importance of glass and glass-ceramic resistant coatings as a potential method to overcome the main drawback of oxidation and to further extend the temperature range of application [38,39,40]. So far, a couple of solutions based on glass coatings have been proposed to improve the oxidation resistance of CoSb3 [33,36,37]. The advantages of using glass-based coatings include the simplicity of the sinter-crystallization process and the possibility to tailor their composition and thermo-mechanical properties. Furthermore, they are low-cost and easy to scale up. Moreover, relatively low thermal conductivity and insulating electrical properties are particularly attractive for thermoelectric applications.
In the present paper, the glass-ceramic coating is proposed as an oxidation-resistant coating for CoSb3. Tests included processing, characterization, and evaluation of protective properties during oxidation in the air up to 600 °C.
2. Materials and Methods
2.1. Substrate Material Synthesis
The substrate material, CoSb3, was produced by combustion synthesis [41]. Reactants used for the combustion synthesis were elemental powders of cobalt (>99.9% or 99.8%, Sigma Aldrich, St. Louis, MO, USA) and antimony (99.8%, Alfa Aesar, Ward Hill, MA, USA). Powders mixed in appropriate proportions were homogenized and cold-pressed. Combustion synthesis was carried out under a vacuum and initiated by global ignition. The product was milled, sieved, and subsequently hot-pressed in a graphite die under an argon atmosphere (25 MPa; 800 °C; 0.5 h). Finally, the product was cut into rectangular bars with approximate dimensions 3 × 5 × 7 mm, ground on SiC papers up to 1000 grit, and degreased in acetone using an ultrasonic cleaner for 3 min.
2.2. Glass-Ceramic Processing and Oxidation
The G10 parent glass, previously developed by the authors [42], was selected for the glass-ceramic coating preparation to match the coefficient of thermal expansion (CTE) of the substrate and the coating, deposition temperature (up to 700 °C), and maximum working temperature (600 °C). The composition of G10 is presented in Table 1.

Table 1.
Composition of G10 parent glass [42].
All components, after weighing and homogenizing in a rolling mill for 18 h, were put into a platinum–rhodium crucible (Figure 1a) in a 10 g batch and melted in a furnace in air atmosphere in a two-step process: first at 1500 °C for 1 h (covered by a lid) and then at 1550 °C for 20 min. After this time, glass was cast and quenched at room temperature on a brass plate (Figure 1b,c). So prepared glass was milled for 1h into a fine powder using a vibrational mill and sieved at grain size < 38 μm.
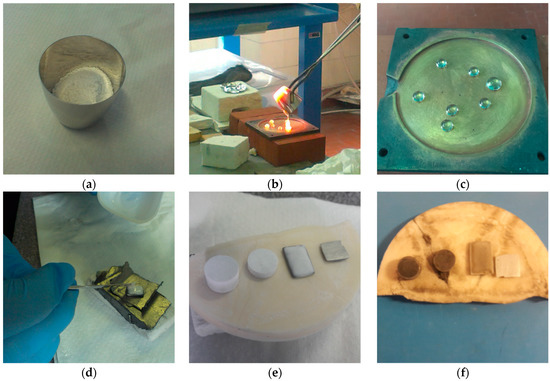
Figure 1.
(a) Oxide precursors for glass-ceramic coating in platinum–rhodium crucible before melting; (b) casting of the glass after melting at 1500 °C; (c) quenched glass, (d) coating deposition using slurry composed of crushed glass and ethanol; (e) cold-pressed pellets of the powdered glass, coated substrate, and uncoated substrate before heat treatment; (f) samples (G10 glass-ceramic pellets, G10 glass-ceramic coated CoSb3, uncoated CoSb3) after heat treatment at 650 °C for 30 min in Ar atmosphere.
The CoSb3 samples were coated using the slurry technique (Figure 1d). Slurry, composed of G10 glass powder (30 vol.%) dispersed using an ultrasonic cleaner in ethanol (70 vol.%) (99.8 Fluka 02860), was deposited on each surface of the bars one-by-one at room temperature and dried in air. Moreover, two cylindrical cold-pressed green pellets of glass powder were prepared for XRD and dilatometry examination (Figure 1e). Finally, the samples were subjected to the thermal treatment in a furnace at 650 °C for 30 min in Ar flow with a heating and cooling rate of 10 °C/min.
Isothermal oxidation tests were carried out at 500 and 600 °C for 80 h in the air. After exposure, the specimens were cooled down to room temperature with the furnace.
2.3. Examination Methods
Samples were systematically tested by dilatometry (DIL), X-ray diffraction (XRD), and electron microscopy (SEM, TEM) in terms of properties, microstructure, chemical, and phase composition characterization.
Dilatometry was carried out on 5 mm long samples in the temperature range of 25–500 °C with a heating rate of 5 °C/min using Netzsch’s DIL 402 F3 (Netzsch, Germany) in order to measure the thermal expansion coefficient of the substrate, glass, and glass-ceramic pellet.
The XRD measurements of phase composition were taken by the PanalyticalX’Pert PRO (PANalytical, The Netherlands) diffractometer in the range of 10–80° [2θ] using Cu Kα radiation in a standard Bragg–Brentano configuration. The crystalline phase analysis was accomplished with X’PertHighScore Plus software (v. 2.2b) using the JCPDS ICDD database.
A high-resolution (HR) scanning electron microscope Merlin Gemini II (ZEISS, Germany) equipped with a field-electron gun (FEG) was utilized to examine the microstructure of interfaces, surfaces, and cross-sections of the samples. Chemical composition was determined on the basis of maps of chemical element distributions recorded by the energy dispersive X-ray spectrometry (EDS) detector with the Quantax 800 microanalysis system of Bruker.
The thin lamellas for S/TEM analysis were received by sectioning the samples with a focused ion beam (FIB) Crossbeam 350 (ZEISS) microscope. High-resolution analyses were performed using probe Cs-corrected Titan3 G2 60-300 with the ChemiSTEM™ system (FEI). The chemical composition was determined using energy dispersive X-ray spectrometry (STEM-EDS) and electron energy loss spectroscopy (EELS).
The quantitative analyses of the microstructure were performed using ImageJ 1.51j8 software (National Institute of Health, USA). First, the images were subjected to appropriate qualitative processing, to improve the visibility of relevant microstructural elements, followed by binarization and quantitative analysis. All measurements were carried out on representative SEM-BSE images of crystals and pores projected onto the image plane.
3. Results
The CTEs of glass, glass-ceramic, and TE substrate were measured by dilatometry up to 500 °C. As shown in Figure 2, CTEs are well matched: 9.2 × 10⁻⁶ K−1 for CoSb3 and 9.4 × 10⁻⁶ K−1 for glass-ceramic.
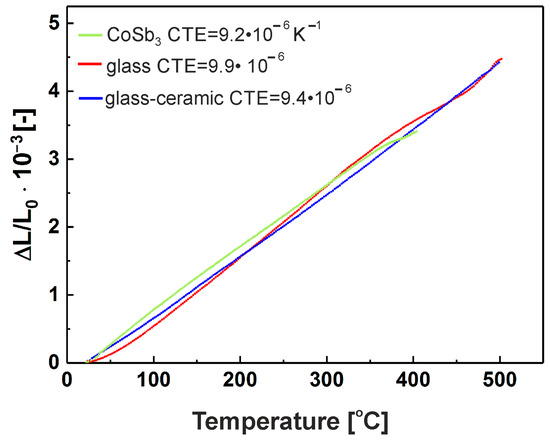
Figure 2.
The CTE of CoSb3, glass, and glass-ceramic determined by dilatometry in the range 200–400 °C.
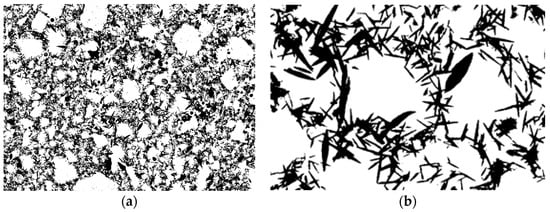
The cross-sectional view of the as-received glass-ceramic pellet with different magnifications is presented in the SEM-BSE images (Figure 3a–c). Darker, needle-like crystals were embedded in a bright gray glassy matrix. Based on binarized SEM images, the average length, elongation, and volume fraction of the crystals were estimated. All measurements were carried out on representative SEM-BSE images of crystals projected onto the image plane. The distribution of the crystals’ length together with an example image of measurement is shown in Figure 4. The average length was calculated as 3.3 ± 1.8 μm, whereas the elongation ranged from 1:3 to 1:25 with the predominance of needles with larger elongations. From the binary images (Figure 5), the volume fraction of crystals was estimated to be about 30 %. Moreover, some exclusively closed pores were present in the bulk. However, the number and sizes of pores were small. From binary images, it was estimated that pores were smaller than a few micrometers, and the concentration was lower than 1%.
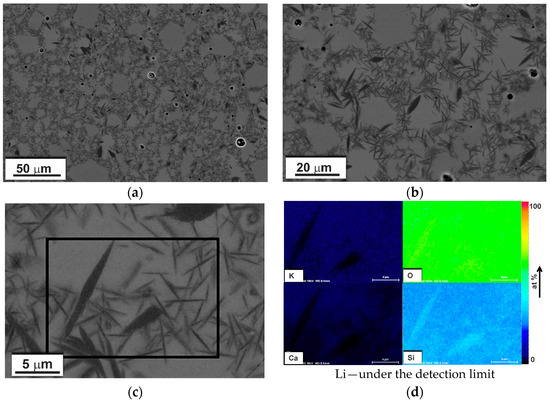
Figure 3.
(a–c) The SEM-BSE images of free-standing glass-ceramic with different magnifications; (d) SEM-EDS quantified maps of selected chemical elements distribution of region marked in (c).
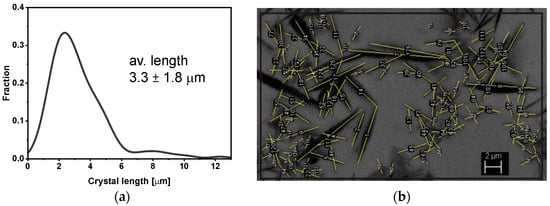
Figure 4.
(a) Crystal length distribution and (b) an example of measurements.
Crystalline phases and chemical composition were determined using XRD and SEM-EDS. The distribution of chemical elements in glass-ceramic is presented in SEM-EDS (quantified) and TEM-EDS (intensity) elemental maps in Figure 3d and Figure 6. It can be observed that there was some enrichment in Si in the crystals, while Ca and K concentrations decreased. The presence of Li in the samples was confirmed by EELS (Figure 7).
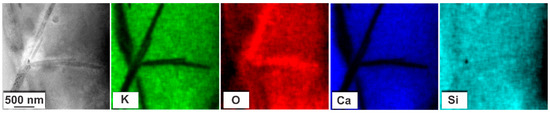
Figure 6.
STEM-HAADF image of the glass-ceramic and the STEM-EDS intensity elemental maps.
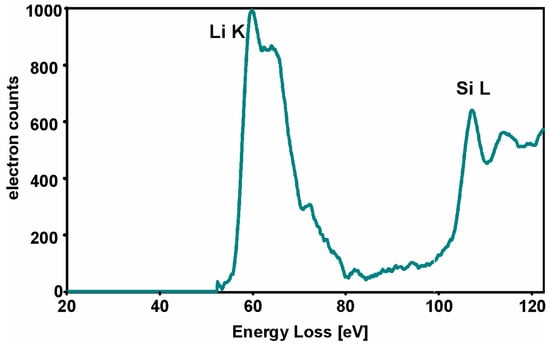
Figure 7.
The EELS (EEL spectra) spectra of glass-ceramic pellet with visible Li-K edge and Si-L edge.
The crystalline phase on XRD diffraction was recognized as Li2SiO3 (Figure 8a). In the case of the coated CoSb3 sample, the positions of Li2Si2O5 peaks are marked in Figure 8c; however, the presence cannot be conclusively confirmed. The HR-STEM image of glass-ceramic is presented in Figure 9a. Presence of the glassy phase was confirmed by selected area electron diffraction (SAED) (Figure 9), as well as revealed in the XRD diffractogram as an amorphous halo (Figure 8a). Nanometer-sized crystalline areas were present in the amorphous matrix, confirmed by the Fourier transform (FFT) of the high-resolution image (Figure 9c).
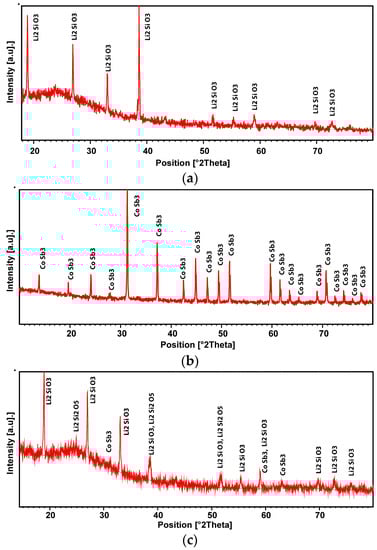
Figure 8.
XRD patterns of (a) the glass-ceramic pellet, (b) uncoated CoSb3, and (c) glass-ceramic coated CoSb3.
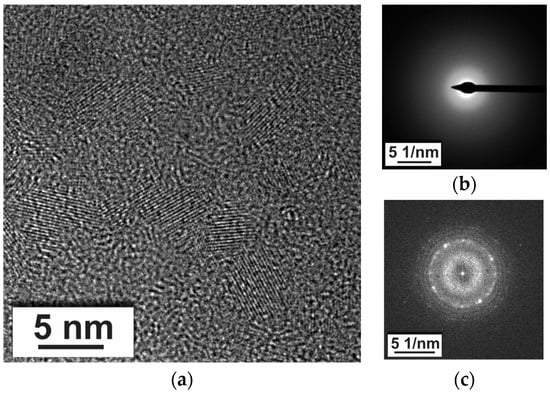
Figure 9.
(a) HR-STEM image of glass-ceramic; (b) SAED pattern of the amorphous region; (c) the FFT pattern of the nano-crystallites.
A cross-sectional view of the TE substrate coated with G10 glass-ceramic is presented in Figure 10. The thickness of the coating ranged from about 100 μm near the corners of the sample to more than 500 μm in the thickest parts. In Figure 10, it is visible that the glass-ceramic coating was continuous, showed good adherence, and tightly covered the substrate without macroscopic defects. In general, the coating was smooth on the surface and free of discontinuities or cracks but with some porosity (Figure 11). Nonetheless, porosity was exclusively closed. A major difference compared to the cross-sectional image of the glass-ceramic pellet (Figure 3) is the size and distribution of the pores. In this case, the highest porosity and pore size can be observed right next to the CoSb3/coating interface (Figure 11). With the increasing distance from the interface, both the number and size of pores decreased. Furthermore, the shape of the pores was also changed, from almost perfectly spherical to irregular, edgy forms. From the binarized image (Figure 11b), the equivalent diameter (calculated as a diameter of a circle with the same area as a plane area of a pore) of the largest pores was estimated to be about 30 μm, and the pore volume fraction was calculated to be close to 6%. Moreover, it is worth noting that if the coating was divided into halves, the porosity in the innermost part was estimated to be as high as 10%, while in the outermost at approximately 2–3%. Pore size distribution in the coating is presented in Figure 12.
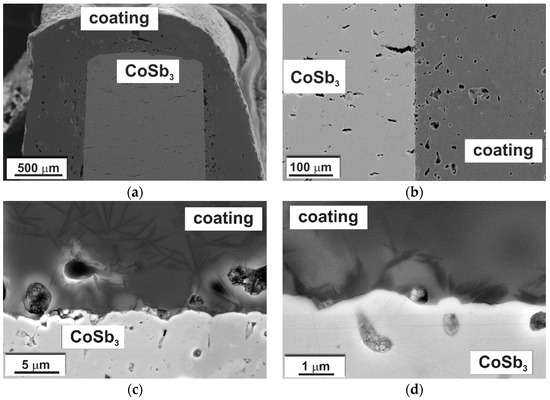
Figure 10.
(a) Cross-section of the coated sample; (b–d) magnification of the interface (SEM-SE).
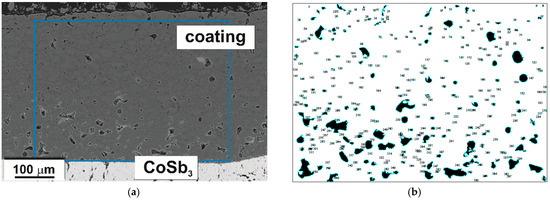
Figure 11.
(a) The SEM-SE image of the coating with a marked region of pore distribution analysis and (b) the image after binarization.

Figure 12.
Pore size distribution in the coating.
As can be seen in Figure 10, the glass-ceramic coating after deposition on CoSb3 remained amorphous in the bulk with uniformly distributed crystals. The overall picture and size of the crystals appeared essentially unchanged from that of the glass-ceramic pellet (Figure 3).
The CoSb3/glass-ceramic interface at different magnifications is shown in Figure 10b–d. No microstructural changes were observed in the substrate, which was also confirmed by chemical composition analysis of the interface. Figure 13 presents distribution maps of chemical element concentration recorded by SEM-EDS indicating only Co and Sb in the substrate. Although the map for Ca may suggest the presence of this element in the substrate, this is an incorrect finding. It will be clarified in detail in the Discussion section. The negligible variation range of chemical element concentration can also be observed on the EDS line-scan, presented in Figure 14, which crosses the interface at the point where the coating is in exclusive contact with the substrate. In both the CoSb3 and in the coating, the composition in general was constant, even at the crystals. This results from the nature of the EDS measurements, where the recorded signal origins from a certain volume, limiting the resolution. The only noticeable variation of the coating composition is an approx. 10% decrease in the oxygen concentration with a corresponding drop in silicon concentration, close to the interface over a length of about 2.5 μm. In the XRD diffractogram of the coated CoSb3 sample, shown in Figure 8c, besides peaks characteristic of the glass-ceramic (compare Figure 8a), peaks coming from the CoSb3 phase were also present. No peaks of any other phase were identified.
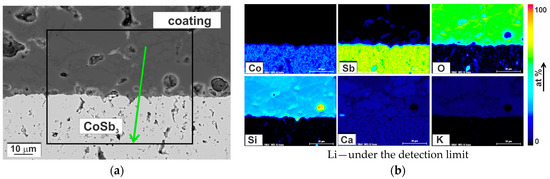
Figure 13.
(a) The SEM-SE image of the glass-ceramic coating/CoSb3 interface and (b) SEM-EDS quantified maps of chemical elements distribution for a region marked in (a).
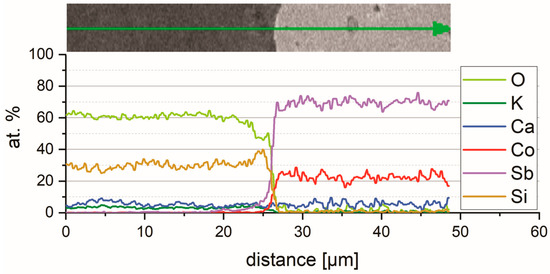
Figure 14.
The SEM-EDS chemical element concentration profile across the CoSb3/coating interface. The precise position of the line of analysis is marked in Figure 13 a by a green arrow.
Figure 15 presents SEM-BSE cross-sectional images of the CoSb3 sample coated with glass-ceramic after an oxidation test at 500 and 600 °C for 80 h. In both cases, a middle gray layer at the interface was recognized as an oxide scale. At 500 °C, the scale was single-layered, and at 600 °C it seemed to consist of at least two layers. In both cases, the thickness was not uniform over the length of the sample. At 500 °C it was up to a few micrometers, while at 600 °C it was much thicker, even in the range of tens of micrometers. The thickness of the scale varied depending on the location, being much larger near the pores, then decreasing toward areas with good contact between the coating and the substrate, e.g., sample corners in Figure 15b,d.
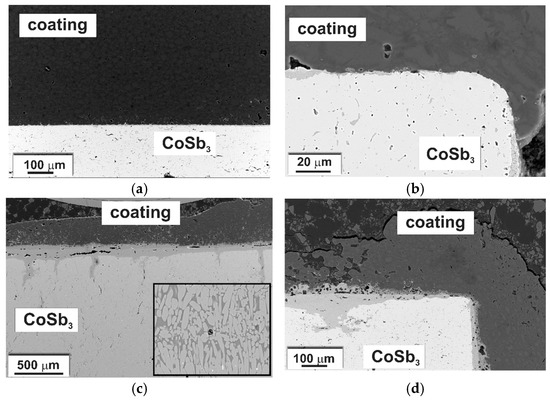
Figure 15.
(a,b) SEM-BSE images of coated samples oxidized at 500 and (c,d) at 600 °C for 80 h. Inset in (c) presents eutectic regions in the scale at 600 °C.
Chemical composition analysis using SEM-EDS indicated the presence of oxygen in the scale formed at the CoSb3/coating interface. EDS elemental distribution maps for samples oxidized at 500 and 600 °C are presented in Figure 16. At 500 °C it consisted of Co, Sb, and O with approximately uniform concentrations across the scale growing inwards CoSb3. At 600 °C, a chemical reaction occurred both at the inner and outer side of the interface. The coating was penetrated mainly by antimony, and the scale in some areas exhibited morphological features of a eutectic (inset in Figure 15).
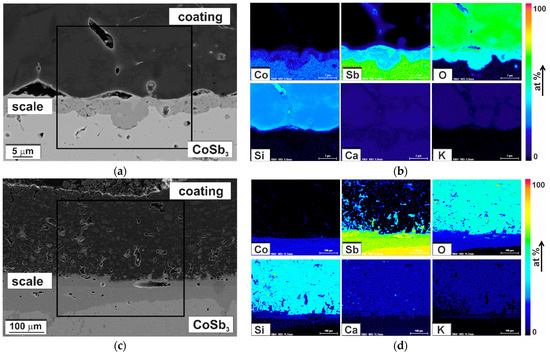
Figure 16.
SEM-BSE images of the coated CoSb3 oxidized at (a) 500 and (c) 600 °C for 80 h and SEM-EDS quantified maps of chemical elements distribution (b) at 500 °C for a region marked in (a) and at (d) 600 °C for a region marked in (c).
4. Discussion
The principal difficulty during the deposition of glass-ceramic coating is a requirement of high sintering temperature. Unfortunately, cobalt triantimonide is sensitive to temperature [6,7,8,9]. In the air above 380 °C, it undergoes strong oxidation associated with the formation of a multilayer scale, even at short-term exposure [6,7]. Furthermore, antimony tends to sublimate from the bulk starting from 500 °C (at 700 °C, the sublimation rate is as high as 21.5 mg/(cm2∙h) [8]), and CoSb3 decomposes to the lower antimonides. Based on the characteristic temperatures: glass transition temperature Tg onset = 490 °C, first shrinkage temperature TFS = 515 °C, and maximum shrinkage temperature TMS = 630 °C reported in [42], the optimum sintering temperature of G10 was determined to be in the range of 650–750 °C. The coating composition was selected to ensure the lowest possible sintering temperature to minimize the risk of oxidation and Sb sublimation, but not lower than the expected CoSb3 operating temperature (up to 600 °C). Therefore, the optimum glass-ceramic sinter-crystallization temperature was determined as 650 °C.
Another consideration was to match the chemical composition of the coating to prevent secondary chemical reactions with the substrate during operating at elevated temperatures. As shown in Figure 17, the dissociation pressures of antimony and cobalt oxides are higher than the dissociation pressures of SiO2, CaO, Li2O, and K2O. In such cases, the reduction of oxides composing the coating by the substrate was not thermodynamically favorable, and the chemical composition of the substrate remained unchanged after the glass-ceramic coating deposition. Furthermore, there were no significant changes in the chemical and phase composition of the glass-ceramic after deposition on CoSb3 compared to the glass-ceramic pellet. This can be confirmed by the comparison of XRD diffractograms (Figure 8), where in both cases an amorphous halo was visible, indicating an amorphous matrix, as well as characteristic peaks coming from Li2SiO3. Nevertheless, in contrast to the glass-ceramic pellet, it was found on the basis of XRD that G10 coating on the CoSb3 may contain small amounts of Li2Si2O5. This phase was also observed in an XRD diffractogram of G10 glass-ceramic coating deposited on another substrate [42]. The presence of the Li2Si2O5 crystalline phase is reported to be related to the enhancement of the glass-ceramic strength, while the presence of Li2SiO3 does not affect the strength of the matrix glass [43]. However, since many of the characteristic Li2Si2O5 peaks overlap with peaks originating from Li2SiO3, and the most intense peak at 2θ = ~25° only slightly extends above the background, the presence of Li2Si2O5 requires further confirmation. Moreover, although differences in crystals’ color could be observed in the phase-contrast SEM-BSE image (Figure 3), this is rather since the crystals are at different depths. It was also impossible to claim any apparent changes in the chemical composition of different crystals on the SEM-EDS maps (Figure 3d).
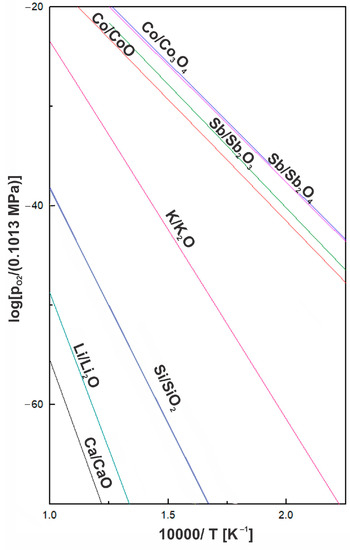
Figure 17.
Oxygen partial pressure vs. absolute temperature in the Arrhenius plot for selected oxide equilibria following [44].
Some concerns might arise from the quantified maps of Ca distribution in the coated sample (Figure 13 and Figure 18). They showed the presence of Ca in the substrate in an amount comparable to the amount of Ca in the coating. However, the energy of characteristic X-ray radiation for Ca and Sb is approximate: Ca Kα = 3.69 keV and Sb Lα = 3.60 keV. If comparing the recorded EDS intensity elemental map for Ca with the quantified map (Figure 18), it can be observed that the correction procedure involved (P/B-ZAF) addressed energy overlapping. Nonetheless, the accuracy was probably not enough for the perfect separation of the Ca and Sb peaks. Therefore, it can be assumed with high confidence that Ca was not present in the substrate area.
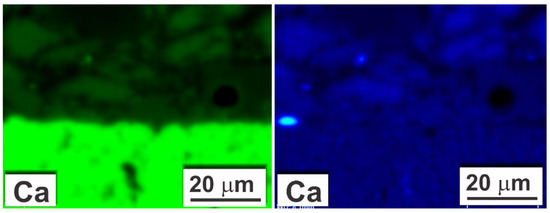
Figure 18.
Comparison of SEM-EDS map of Ca distribution in as-coated sample: intensity map directly after recording (green) and quantified map (blue).
To ensure effective protection against degradation, good coating adherence is one of the most important factors. Adherence of the glass-ceramic coating was determined by inspection of microstructure and chemical composition. Analyzing the EDS elemental maps of the CoSb3/coating interface recorded on the as-sintered sample (Figure 13), a slight enrichment in Sb in the coating at a limited distance was observed, while no enrichment in cobalt was noticed. Antimony could have penetrated the coating through a chemical reaction or as a result of sublimation. The method by which antimony is built into the glass-ceramic directly affects the coating/substrate bonding. Adherence can be provided by physical, chemical, or mechanical bonding. The best results are achieved with chemical bonding. It can be formed by a direct reaction between the substrate and the coating or by the initial oxidation of the substrate surface, followed by the dissolution of substrate oxides in the coating [45]. In the studied case, the composition of the glass-ceramic coating was chosen to avoid reduction of the substrate elements; therefore, the first possibility can be rejected. In general, at the first moment when CoSb3 is in contact with the oxidizing agent, the scale is composed only of antimony oxides [6,44]. Since Sb2O3 and SiO2 form a low-melting eutectic at 492 °C [46], the dissolution of the oxide scale on CoSb3 in glass-ceramic coating facilitates the formation of the chemical bonding. The requirement for developing sufficient adhesion is the complete dissolution of the oxide in the amorphous phase; thus, oxide thickness should be small. Nevertheless, the formation of Sb2O3 scale entails the assumption that CoSb3 surface oxidation occurred at the initial stages of sintering, e.g., by oxygen trapped in the sample (in pores of the substrate and/or in the powdered glass). Considering the presence of pores in the specimen covered by a layer of glass powder, this possibility cannot be excluded, but it has not been investigated in this study. In addition, since the oxide scale was not observed at the interface (Figure 10), it can be assumed that either it was completely dissolved or not formed entirely. Therefore, the formation of a chemical bonding cannot be conclusively confirmed. Furthermore, visual evaluation of the coating/CoSb3 interface at high magnification (Figure 10c,d) indicated that it exhibited no typical morphological features of mechanical bonding [37,45].
A second source of Sb enrichment at the interface could be antimony vapor trapped in the pores, arising from Sb sublimation from CoSb3 starting at about 500 °C [8,37]. When the coating was sintered, the antimony could be dissolved in the glass-ceramic. Antimony vapors also lead to the formation of coating porosity at the interface. In SEM-BSE images presented in Figure 10 at high magnifications; this effect could be observed as bright surroundings of the pores. Once the sintering was finished and the coating hardened, the elevated vapor pressure of Sb in the closed pores inhibited further sublimation from the substrate. As a direct reaction between the substrate and the coating cannot occur, this process does not ensure chemical bonding.
Although SiO2 and Sb2O3 form a low-melting eutectic, it has been reported in the literature that an excess of Sb2O3 (more than 50 mol %), leads to the crystallization of the glass and results in insufficient adhesion of the coating to the substrate [47]. As can be seen in SEM images (Figure 10), increased crystallization of the as-sintered coating was not observed. It can be expected that crystallization was limited by carrying out the process in the oxygen-depleted environment (Ar flow). As a result, the range of antimony in the coating was insignificant but sufficient to ensure high coating adherence. Calculations of CTE based on the Winkelman and Schott model modified by Eppler [48] indicate that a small amount of dissolved antimony had no negative effect on CTE tailoring. Nevertheless, a noticeable difference in the shape and number of pores near the substrate was observed. This can be attributed to the increased vapor pressure of antimony close to the CoSb3 surface during the early stages of glass-ceramic sintering.
Oxidation tests at 500 and 600 °C were performed to assess the effect of the glass-ceramic coating on the corrosion resistance of cobalt triantimonide. In both cases, an oxide layer was identified on the samples at the interface, indicating limited protection against oxidation at elevated temperatures. Nevertheless, at 500 °C, non-oxidized areas could be observed, and at 600 °C, regions with a significantly reduced scale thickness compared to unprotected samples oxidized in the corresponding conditions [6]. These were mostly areas where the coating was tightly bonded to the CoSb3. The phase composition of the scale was also changed compared to the uncoated samples. In the studied case, it consisted mainly of Co, Sb, and O (Figure 16), whereas on uncoated samples the scale was multilayered and consisted of both antimony oxides (Sb2O3 and Sb2O4) and cobalt–antimony oxides (CoSb2O4 and CoSb2O6) [6]. Comparing with the literature data, it can be concluded that the scale was composed mainly of CoSb2O4 [6]. The antimony oxides were digested by the coating, in some cases forming a eutectic (Figure 15c). The formation of a liquid phase led to rapid degradation of the material during oxidation at 600 °C.
5. Conclusions
In the studied case, a glass-ceramic coating on CoSb3 with an optimized sintering temperature (650 °C) and well-matched CTE coefficient was successfully provided. Analysis of the phase composition confirmed that the coating consists mainly of Li2SiO3 crystals with an average size of a few micrometers embedded in a glassy matrix. The HR-TEM results indicated the presence of nanocrystallites in the amorphous phase. The coating showed some closed porosity, mainly in regions close to the interface. Good adherence of the coating was observed; however, the formation of a chemical bonding between the coating and the substrate could not be conclusively confirmed. The phase and chemical composition of the substrate remained unchanged after coating deposition. During oxidation tests, the glass-ceramic coating showed limited protective properties. Promising results were obtained for the glass-based coated TE tested at 500 °C for 80 h, while at 600 °C effectiveness of the coating was limited to the formation of a liquid phase in the system.
Author Contributions
Conceptualization, K.M.Z. and M.S.; validation, K.M.Z.; formal analysis, K.M.Z.; investigation, K.M.Z. and F.D.; resources, K.M.Z., K.M. and M.S.; data curation, K.M.Z.; writing—original draft preparation, K.M.Z.; writing—review and editing, M.S., F.D. and F.S.; visualization, K.M.Z.; supervision, K.M.Z. and M.S.; project administration, K.M.Z.; funding acquisition, K.M.Z. All authors have read and agreed to the published version of the manuscript.
Funding
This research was supported by The European Virtual Institute on Knowledge based Multifunctional Materials (KMM-VIN) within the K. Zawadzka KMM-VIN Fellowship and The Polish Ministry of Education and Science within the subvention funds (project no. 16.16.110.663).
Data Availability Statement
Not applicable.
Acknowledgments
The authors acknowledge A. Gruszczyński (AGH-UST in Krakow, Poland) for providing the TEM lamellas and DSc. A. Kryshtal (AGH-UST in Krakow, Poland) for the consultation of the TEM results.
Conflicts of Interest
The authors declare no conflict of interest.
References
- Lawrence Livermore National Laboratory. Estimated U’S. 2019; Energy Consumption in 2019: 100.2 Quads. Available online: https://flowcharts.llnl.gov/sites/flowcharts/files/2022-09/Energy_2021_United-States.pdf (accessed on 27 April 2023).
- Finn, P.A.; Asker, C.; Wan, K.; Bilotti, E.; Fenwick, O.; Nielsen, C.B. Thermoelectric Materials: Current Status and Future Challenges. Front. Electron. Mater. 2021, 1, 677845. [Google Scholar] [CrossRef]
- Snyder, G.J.; Toberer, E.S. Complex Thermoelectric Materials. Nat. Mater. 2008, 7, 105–114. [Google Scholar] [CrossRef]
- Jouhara, H.; Żabnieńska-Góra, A.; Khordehgah, N.; Doraghi, Q.; Ahmad, L.; Norman, L.; Axcell, B.; Wrobel, L.; Dai, S. Thermoelectric Generator (TEG) Technologies and Applications. Int. J. Thermofluid Sci. Technol. 2021, 9, 100063. [Google Scholar] [CrossRef]
- Rogl, G.; Rogl, P.F. Filled Sb-Based Skutterudites from 1996–2022. Crystals 2022, 12, 1843. [Google Scholar] [CrossRef]
- Godlewska, E.; Zawadzka, K.; Adamczyk, A.; Mitoraj, M.; Mars, K. Degradation of CoSb3 in Air at Elevated Temperatures. Oxid. Met. 2010, 74, 113–124. [Google Scholar] [CrossRef]
- Zhao, D.; Tian, C.; Tang, S.; Liu, Y.; Chen, L. High Temperature Oxidation Behavior of Cobalt Triantimonide Thermoelectric Material. J. Alloys Compd. 2010, 504, 552–558. [Google Scholar] [CrossRef]
- Caillat, T.; Sakamato, J.; Jewell, A.; Cheng, J.; Paik, J.; Gascoin, F.; Snyder, J.; Blair, R.; Huang, C.-K.; Fleurial, J.-P. Advanced radioisotope power systems technology development at JPL. JPL Open Repository, V1. 2005. Available online: https://hdl.handle.net/2014/37768 (accessed on 25 April 2023).
- Zhao, D.; Tian, C.; Liu, Y.; Zhan, C.; Chen, L. High Temperature Sublimation Behavior of Antimony in CoSb3 Thermoelectric Material during Thermal Duration Test. J. Alloys Compd. 2011, 509, 3166–3171. [Google Scholar] [CrossRef]
- Udoh, I.I.; Shi, H.; Daniel, E.F.; Li, J.; Gu, S.; Liu, F.; Han, E.H. Active Anticorrosion and Self-Healing Coatings: A Review with Focus on Multi-Action Smart Coating Strategies. J. Mater. Sci. Technol. 2022, 116, 224–237. [Google Scholar] [CrossRef]
- Wen, J.; Lei, J.; Chen, J.; Liu, L.; Zhang, X.; Li, L. Polyethylenimine Wrapped Mesoporous Silica Loaded Benzotriazole with High PH-Sensitivity for Assembling Self-Healing Anti-Corrosive Coatings. Mater. Chem. Phys. 2020, 253, 123425. [Google Scholar] [CrossRef]
- Ye, Y.; Chen, H.; Zou, Y.; Ye, Y.; Zhao, H. Corrosion Protective Mechanism of Smart Graphene-Based Self-Healing Coating on Carbon Steel. Corros. Sci. 2020, 174, 108825. [Google Scholar] [CrossRef]
- Pulikkalparambil, H.; Siengchin, S.; Parameswaranpillai, J. Corrosion Protective Self-Healing Epoxy Resin Coatings Based on Inhibitor and Polymeric Healing Agents Encapsulated in Organic and Inorganic Micro and Nanocontainers. Nano-Struct. Nano-Objects 2018, 16, 381–395. [Google Scholar] [CrossRef]
- Zhang, F.; Ju, P.; Pan, M.; Zhang, D.; Huang, Y.; Li, G.; Li, X. Self-Healing Mechanisms in Smart Protective Coatings: A Review. Corros. Sci. 2018, 144, 74–88. [Google Scholar] [CrossRef]
- Yoshimoto, N.; Fathona, I.W.; Yabuki, A. Self-Healing Polymer Coating with Efficient Delivery for Alginates and Calcium Nitrite to Provide Corrosion Protection for Carbon Steel. Colloids Surf. A Physicochem. Eng. Asp. 2023, 662, 130970. [Google Scholar] [CrossRef]
- Cui, G.; Bi, Z.; Wang, S.; Liu, J.; Xing, X.; Li, Z.; Wang, B. A Comprehensive Review on Smart Anti-Corrosive Coatings. Prog. Org. Coat. 2020, 148, 105821. [Google Scholar] [CrossRef]
- Merz, A.; Uebel, M.; Rohwerder, M. The Protection Zone: A Long-Range Corrosion Protection Mechanism around Conducting Polymer Particles in Composite Coatings: Part I. Polyaniline and Polypyrrole. J. Electrochem. Soc. 2019, 166, C304–C313. [Google Scholar] [CrossRef]
- Merz, A.; Rohwerder, M. The Protection Zone: A Long-Range Corrosion Protection Mechanism around Conducting Polymer Particles in Composite Coatings: Part II. PEDOT: PSS. J. Electrochem. Soc. 2019, 166, C314–C320. [Google Scholar] [CrossRef]
- Hou, J.; Zhu, G.; Xu, J.; Liu, H. Anticorrosion Performance of Epoxy Coatings Containing Small Amount of Inherently Conducting PEDOT/PSS on Hull Steel in Seawater. J. Mater. Sci. Technol. 2013, 29, 678–684. [Google Scholar] [CrossRef]
- Kamil, M.P.; Suhartono, T.; Ko, Y.G. Corrosion Behavior of Plasma Electrolysis Layer Cross-Linked with a Conductive Polymer Coating. J. Mater. Res. Technol. 2021, 15, 4672–4682. [Google Scholar] [CrossRef]
- Hou, J.; Zhu, G.; Xu, J.; Wang, J.; Huang, Y. Epoxy Resin Modified with PEDOT/PSS and Corrosion Protection of Steel. Adv. Mat. Res. 2012, 560–561, 947–951. [Google Scholar] [CrossRef]
- Sharma, P.; Dwivedi, V.K.; Kumar, D. A Review on Thermal Barrier Coatings (TBC) Usage and Effect on Internal Combustion Engine. In Lecture Notes in Mechanical Engineering; Springer: Singapore, 2021; pp. 77–85. [Google Scholar] [CrossRef]
- Godiganur, V.S.; Nayaka, S.; Kumar, G.N. Thermal Barrier Coating for Diesel Engine Application—A Review. Mater. Today Proc. 2021, 45, 133–137. [Google Scholar] [CrossRef]
- Sloof, W.G.; Nijdam, T.J. On the High-Temperature Oxidation of MCrAlY Coatings. Int. J. Mater. Res. 2009, 100, 1318–1330. [Google Scholar] [CrossRef]
- Ghadami, F.; Sabour Rouh Aghdam, A.; Ghadami, S. Microstructural Characteristics and Oxidation Behavior of the Modified MCrAlX Coatings: A Critical Review. Vacuum 2021, 185, 109980. [Google Scholar] [CrossRef]
- Chellaganes, D.; Khan, M.A.; Jappes, J.T.W. Thermal Barrier Coatings for High Temperature Applications—A Short Review. Mater. Today Proc. 2021, 45, 1529–1534. [Google Scholar] [CrossRef]
- Bose, S. High Temperature Coatings, 2nd ed.; Elsevier: Burlington, MA, USA, 2017; pp. 1–398. [Google Scholar] [CrossRef]
- Awang, M.; Khalili, A.A.; Pedapati, S.R. A Review: Thin Protective Coating for Wear Protection in High-Temperature Application. Metals 2020, 10, 42. [Google Scholar] [CrossRef]
- Saber, H.H.; El-Genk, M.S. Effects of Metallic Coatings on the Performance of Skutterudite-Based Segmented Unicouples. Energy Convers. Manag. 2007, 48, 1383–1400. [Google Scholar] [CrossRef]
- El-Genk, M.S.; Saber, H.H.; Caillat, T.; Sakamoto, J. Tests Results and Performance Comparisons of Coated and Un-Coated Skutterudite Based Segmented Unicouples. Energy Convers. Manag. 2006, 47, 174–200. [Google Scholar] [CrossRef]
- Dong, H.; Li, X.; Tang, Y.; Zou, J.; Huang, X.; Zhou, Y.; Jiang, W.; Zhang, G.J.; Chen, L. Fabrication and Thermal Aging Behavior of Skutterudites with Silica-Based Composite Protective Coatings. J. Alloys Compd. 2012, 527, 247–251. [Google Scholar] [CrossRef]
- Xia, X.; Huang, X.; Li, X.; Gu, M.; Qiu, P.; Liao, J.; Tang, Y.; Bai, S.; Chen, L. Preparation and Structural Evolution of Mo/SiOx Protective Coating on CoSb3-Based Filled Skutterudite Thermoelectric Material. J. Alloys Compd. 2014, 604, 94–99. [Google Scholar] [CrossRef]
- Dong, H.; Li, X.; Huang, X.; Zhou, Y.; Jiang, W.; Chen, L. Improved Oxidation Resistance of Thermoelectric Skutterudites Coated with Composite Glass. Ceram. Int. 2013, 39, 4551–4557. [Google Scholar] [CrossRef]
- Park, Y.S.; Thompson, T.; Kim, Y.; Salvador, J.R.; Sakamoto, J.S. Protective Enamel Coating for N- and p-Type Skutterudite Thermoelectric Materials. J. Mater. Sci. 2015, 50, 1500–1512. [Google Scholar] [CrossRef]
- Godlewska, E.; Zawadzka, K.; Mars, K.; Mania, R.; Wojciechowski, K.; Opoka, A. Protective Properties of Magnetron-Sputtered Cr-Si Layers on CoSb3. Oxid. Met. 2010, 74, 205–213. [Google Scholar] [CrossRef]
- Leszczyński, J.; Nieroda, P.; Nieroda, J.; Zybała, R.; Król, M.; Łacz, A.; Kaszyca, K.; Mikuła, A.; Schmidt, M.; Sitarz, M.; et al. Si-O-C Amorphous Coatings for High Temperature Protection of In0.4Co4Sb12 Skutterudite for Thermoelectric Applications. J. Appl. Phys. 2019, 125, 215113. [Google Scholar] [CrossRef]
- Zawadzka, K.; Godlewska, E.; Mars, K.; Nocun, M.; Kryshtal, A.; Czyrska-Filemonowicz, A. Enhancement of Oxidation Resistance of CoSb3 thermoelectric Material by Glass Coating. Mater. Des. 2017, 119, 65–75. [Google Scholar] [CrossRef]
- Salvo, M.; Smeacetto, F.; D’Isanto, F.; Viola, G.; Demitri, P.; Gucci, F.; Reece, M.J. Glass-Ceramic Oxidation Protection of Higher Manganese Silicide Thermoelectrics. J. Eur. Ceram. Soc. 2019, 39, 66–71. [Google Scholar] [CrossRef]
- D’Isanto, F.; Smeacetto, F.; Reece, M.J.; Chen, K.; Salvo, M. Oxidation Protective Glass Coating for Magnesium Silicide Based Thermoelectrics. Ceram. Int. 2020, 46, 24312–24317. [Google Scholar] [CrossRef]
- D’Isanto, F.; Smeacetto, F.; Martin, H.P.; Sedlák, R.; Lisnichuk, M.; Chrysanthou, A.; Salvo, M. Development and Characterisation of a Y2Ti2O7-Based Glass-Ceramic as a Potential Oxidation Protective Coating for Titanium Suboxide (TiOx). Ceram. Int. 2021, 47, 19774–19783. [Google Scholar] [CrossRef]
- Godlewska, E.; Mars, K.; Zawadzka, K. Alternative Route for the Preparation of CoSb3 and Mg2Si Derivatives. J. Solid. State Chem. 2012, 193, 109–113. [Google Scholar] [CrossRef]
- Smeacetto, F.; Salvo, M.; Ventrella, A.; Rizzo, S.; Ferraris, M. Durable Glass-Ceramic Coatings for Foam Glass. Int. J. Appl. Glass Sci. 2012, 3, 69–74. [Google Scholar] [CrossRef]
- Fernandes, H.R.; Tulyaganov, D.U.; Goel, I.K.; Ferreira, J.M.F. Crystallization Process and Some Properties of Li2O–SiO2 Glass–Ceramics Doped with Al2O3 and K2O. J. Am. Ceram. 2008, 91, 3698–3703. [Google Scholar] [CrossRef]
- Kubaschewski, O.; Alcock, C.B.; Spencer, P.J. Materials Thermochemistry, 6th ed.; Pergamon Press: Oxford, UK; New York, NY, USA, 1993. [Google Scholar]
- Eppler, R.A.; Eppler, D.R. Chapter 14: Adherence. In Glazes and Glass Coatings; The American Ceramic Society: Westerville, OH, USA, 2000; pp. 231–238. ISBN 1574980548. [Google Scholar]
- Kopytko, M.; Przybyło, W.; Onderka, B.; Fitzner, K. Thermodynamic Properties of Sb2O3-SiO2 and PbO-Sb2O3-SiO2 Liquid Solutions. Arch. Metall. Mater. 2009, 54, 811–822. [Google Scholar]
- Kokorina, V.; Webber, M. Elaboration of Commercial Glasses. In Glasses for Infrared Optics; Kokorina, V.F., Ed.; CRC Press, Inc.: Boca Raton, FL, USA, 1996; p. 109. [Google Scholar]
- Eppler, R.A. The Fundamentals of Leadless Glaze Development. In A Collection of Papers Presented at the 95th Annual Meeting and the 1993 Fall Meeting of the Materials & Equipment/Whitewares Manufacturing: Ceramic Engineering and Science Proceedings; Wachtman, B., Ed.; The American Ceramic Society: Columbus, OH, USA; John Wiley & Sons, Inc.: Hoboken, NJ, USA, 1994; Volume 15, pp. 118–125. [Google Scholar] [CrossRef]
Disclaimer/Publisher’s Note: The statements, opinions and data contained in all publications are solely those of the individual author(s) and contributor(s) and not of MDPI and/or the editor(s). MDPI and/or the editor(s) disclaim responsibility for any injury to people or property resulting from any ideas, methods, instructions or products referred to in the content. |
© 2023 by the authors. Licensee MDPI, Basel, Switzerland. This article is an open access article distributed under the terms and conditions of the Creative Commons Attribution (CC BY) license (https://creativecommons.org/licenses/by/4.0/).