Article

Microstructure, Mechanical Properties and Thermal Stability of Ni-Based Single Crystal Superalloys with Low Specific Weight

1
School of Materials Science and Engineering, Zhejiang University, Hangzhou 310027, China
2
State Key Laboratory of Silicon Materials, Zhejiang University, Hangzhou 310027, China
*
Authors to whom correspondence should be addressed.
Crystals 2023, 13(4), 610; https://doi.org/10.3390/cryst13040610
Submission received: 13 March 2023 / Revised: 25 March 2023 / Accepted: 31 March 2023 / Published: 2 April 2023
(This article belongs to the Special Issue Crystallization of High Performance Metallic Materials)

Abstract

:
Ni-based single crystal (SX) superalloy with low specific weight is vital for developing aero engines with a high strength-to-weight ratio. Based on an alloy system with 3 wt.% Re but without W, namely Ni-Co-Cr-Mo-Ta-Re-Al-Ti, a specific weight below 8.4 g/cm3 has been achieved. To reveal the relationship among the composition, mechanical properties, and thermal stability of Ni-based SX superalloys, SXs with desirable microstructures are fabricated. Tensile tests revealed that the SX alloys have comparable strength to commercial second-generation SX CMSX-4 (3 wt.% Re and 6 wt.% W) and Rene′ N5 alloys (3 wt.% Re and 5 wt.% W) above 800 °C. Moreover, the elongation to fracture (EF) below 850 °C (>20%) is better than that of those two commercial SX superalloys. During thermal exposure at 1050 °C for up to 500 h, the topological close-packed (TCP) phase does not appear, indicating excellent phase stability. Decreasing Al concentration increases the resistance of γ′ rafting and replacing 1 wt.% Ti with 3 wt.% Ta is beneficial to the stability of the shape and size of γ′ phase during thermal exposure. The current work might provide scientific insights for developing Ni-based SX superalloys with low specific weight.

1. Introduction

Ni-based SX superalloys are widely employed in turbine blades of aero engines because of their unique combination of mechanical properties and corrosion resistance at high temperatures [1,2,3,4]. Developing aero engines with high strength/weight ratio, improved temperature capacity, and reduced specific weight are still major research directions for the development of Ni-based SX superalloys [5,6,7]. Improving temperature capacity can directly increase the turbine inlet temperature and, therefore, the performance of aero engines [8]. Current advanced Ni-based SX superalloys have a temperature capacity as high as 1100 °C [9], but the hottest spots in turbine blades occasionally approach 1200 °C, which is already ~90% of the melting point of the alloy [10,11,12]. Therefore, further increase in the temperature capability by alloy design is intrinsically limited by the onset of melting/phase stability [13,14]. Low specific weight can directly reduce the weight of Ni-based SX superalloys used as turbine blades and indirectly reduce the weight of the entire rotor (disk, hub, and shaft) as well as non-rotating support structures [6].
To reduce the specific weight in first-generation Ni-based SX superalloys, increasing the concentration of light elements (Ti + Al) is adopted in the 1980s [15]. For example, Wortmann et al. [15] developed CMSX-6 with a specific weight of less than 8.0 g/cm3, which still has comparable creep strength to first-generation SX CMSX-2 and CMSX-3 superalloys, by increasing the concentration of Al + Ti to 9.5 wt.%. With Ni-based SX superalloys developing into higher generations, the research direction toward low specific weight mainly focuses on balancing the concentration of heavy elements (Re + Ta + W + Mo + Ru). Among those heavy elements, Re, Ta, and W have the greatest influence on increasing the specific weight of the alloys [16,17,18]. Macky et al. [6]. reduced the specific weight of Ni-based SX superalloy to less than 8.8 g/cm3 by using Mo replacement of W and Re, and the creep rupture strength is higher than that of second-generation Rene′ N5 superalloy. Helmer et al. [19] removed Re and obtained the SX ERBO/15 alloy (specific weight is 8.4 g/cm3), whose creep properties at stress below 150 MPa are still equivalent to that of the second-generation CMSX-4 superalloy. In addition to Re, DD16 alloy further removes W, making its specific weight less than 8.0 g/cm3, but it has a yield strength (YS) equivalent to first-generation DD3 superalloy (with ~5.4 wt.% W) [20]. In addition, Du et al. [21] confirmed that the SX superalloy with a specific weight of less than 8.2 g/cm3 could be obtained by controlling the concentration of heavy elements (Mo + W + Ta) to 7.9 wt.%. However, the Ni-based SX superalloys with low specific weight still need further systematic development.
Recently, through numerical models on specific weight, γ/γ′ phase volume fraction, elemental partitioning behavior, heavy elements are carefully balanced, and several compositions (with Re but without W) were designed, and their microstructures validated in their polycrystalline form [16]. After solution and aging treatments, all alloys have a typical γ/γ′ two-phase microstructure, and the specific weights are all lower than 8.4 g/cm3. However, SX growth has not been performed [16]. Thus, all properties and principles of alloy development based on SXs, such as mechanical properties, thermal stability, and dendrite segregation, have not been reported. Here, in order to reveal the relationship among the composition, mechanical properties, and thermal stability of newly developed compositions [16], the entire processing circle, including casting, SX growth, and heat treatment, is employed. Tensile tests at temperatures ranging from room temperature (RT) to 1050 °C are used to understand mechanical behaviors. Thermal exposure experiments at 1050 °C for up to 500 h are used to investigate the thermal/phase stability of the SX superalloys. With the help of advanced microscopy, the fracture behavior in tensile tests and microstructure evolution during thermal exposure can be investigated in multi-scales. The current work might provide scientific insights for the development of Ni-based SX superalloys with low specific weight.

2. Materials and Methods

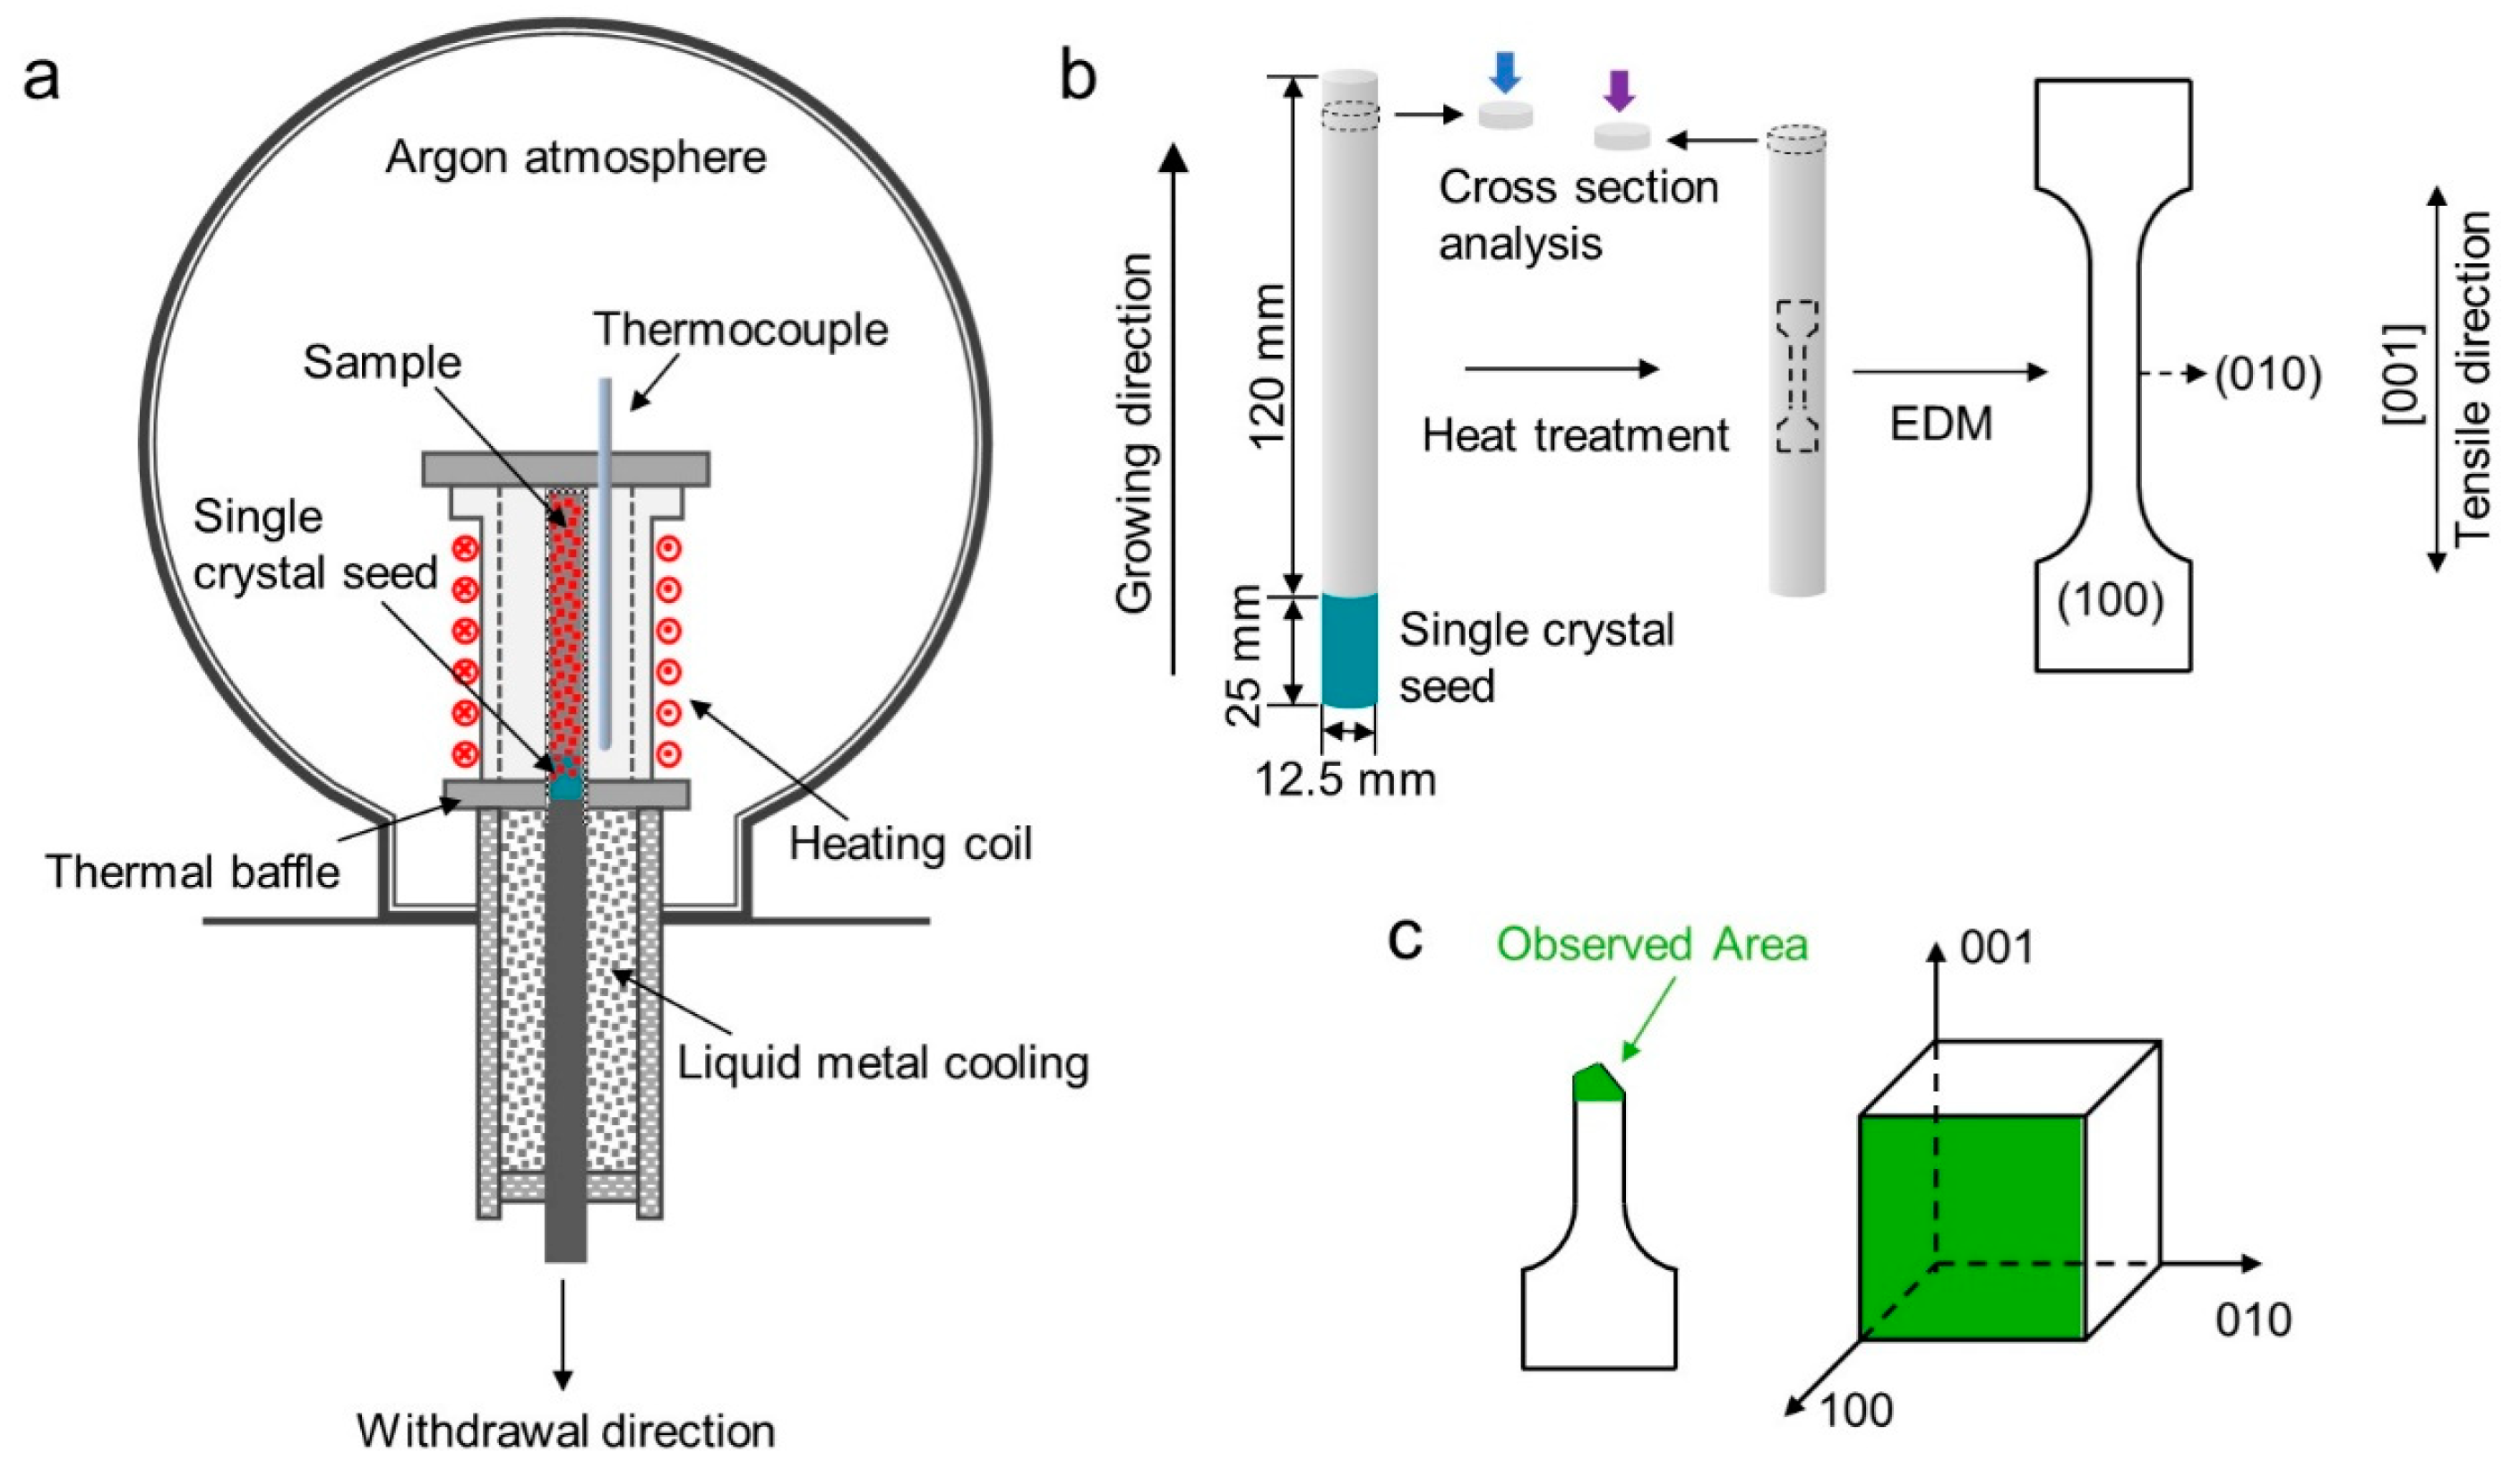
2.1. Alloy Preparation and SX Growth

Four Ni-based SX superalloys are fabricated to reveal the relationship among the composition, mechanical properties, and thermal stability. The nominal and measured compositions of those alloys are given in Table 1. Master alloys are prepared by arc melting of pure Ni, Co, Mo, Re, Ti, Ta, Al, and Cr (purity > 99.9 wt.%) in an argon atmosphere, and the details of arc melting and drop-casting can be found elsewhere [16,22]. Subsequently, the as-cast polycrystalline rod is placed in an alumina crucible with an SX seed with a [001] direction and directional solidified to produce SX in a Bridgman furnace [13], as shown schematically in Figure 1. During SX growth, the withdrawal rate has been tried from 17 to 55 μm/s. When the withdrawal rate is 33 μm/s, the dendrite spacing is about 320 μm, which is similar to the dendrite spacing in a second-generation SX superalloy (~350 μm) [23]. Thus the withdrawal rate of 33 μm/s is selected in this study. The diameter of our experimental SX rods is about 12.5 mm.

2.2. Heat Treatment

To eliminate the compositional inhomogeneities after SX growth and obtain a typical γ/γ′ two-phase microstructure, the as-grown SX rods need solid solution and aging treatments. Similar to heat treatment procedures adopted previously [16], a stepwise process [1290 °C/2 h + 1305 °C/2 h + 1320 °C/4 h + 1330 °C/4 h/AC (air cooling)] is used to eliminate the dendritic segregation in the as-grown SXs and two-step aging treatment (1080 °C/4 h/AC + 870 °C/4 h/AC) is carried out to obtain typical γ/γ′ two-phase microstructure. All solution and aging heat treatments are conducted in an argon-protected tube furnace to prevent surface oxidation of alloys.

2.3. Mechanical Testing

Dog bone-shaped tensile specimens with a gauge section of 1.9 × 1.0 × 9.5 mm3 are cut by using an electro-discharge machining (EDM) from the SX rods after the two-step aging treatment (as shown in Figure 1b). The axial direction of the tensile specimen is [001], and the other two sides of the gauge section are (100) and (010), respectively. All samples are carefully polished with 600 grit SiC paper to eliminate micro-cracks and oxide layer caused by EDM.
Tensile tests at a temperature range from RT to 1050 °C are carried out on a screw-driven mechanical testing machine equipped with an induction heater [24]. Specimens are heated to the test temperature and retained for 15 min to ensure temperature uniformity in the sample before loading. All samples are tested at a constant displacement rate of 0.57 mm/min, corresponding to an engineering strain rate of 1 × 10⁻³ s−1. YS is calculated by using the 0.2% offset method.

2.4. Thermal Stability

Specimens for thermal stability tests are disks 12.5 mm in diameter and 4 mm in height, which are cut from the SX rods after the two-step aging treatment using EDM (as shown in Figure 1b). Before thermal exposure, all disks are ground down to 600 grit SiC papers to ensure a flat and shiny surface. Thermal exposure up to 500 h is carried out at 1050 °C in the laboratory atmosphere. A thermocouple is placed at a 10 mm distance from the sample to ensure temperature accuracy in the thermal stability experiments.

2.5. Microstructure Characterization

Samples for optical microscopy (OM) and scanning electron microscopy (SEM) are prepared using standard metallographic procedures, including grinding and mechanical polishing. To better reveal the microstructures, some samples are electrochemically etched in 90% H2O + 10% H3PO4 solution at 6 V at RT.
Secondary electron (SE) images, energy dispersive spectroscopy (EDS) results, and electron backscattered diffraction (EBSD) patterns are all captured in an FEI Quanta 650 SEM (FEI Company, Eindhoven, The Netherlands) equipped with Oxford EDS and EBSD detectors, using an acceleration voltage of 15 kV and a working distance of 12 mm. Crystal orientations of the SX rods are determined by EBSD. Image J software (V1.8.0) is used to measure the γ′ size.
For the transmission electron microscopy (TEM) investigations, thin disks were first mechanically ground to a thickness of about 50 μm using SiC paper and then punched into 3 mm diameter disks. TEM samples are prepared using a twin-jet electropolisher in an alcoholic solution containing 5 vol.% perchloric acid at −30 °C. The composition of two phases in the four alloys is analyzed by EDS equipped on an FEI Tecnai G2 F20 TEM operated at 200 kV.

3. Results and Discussion
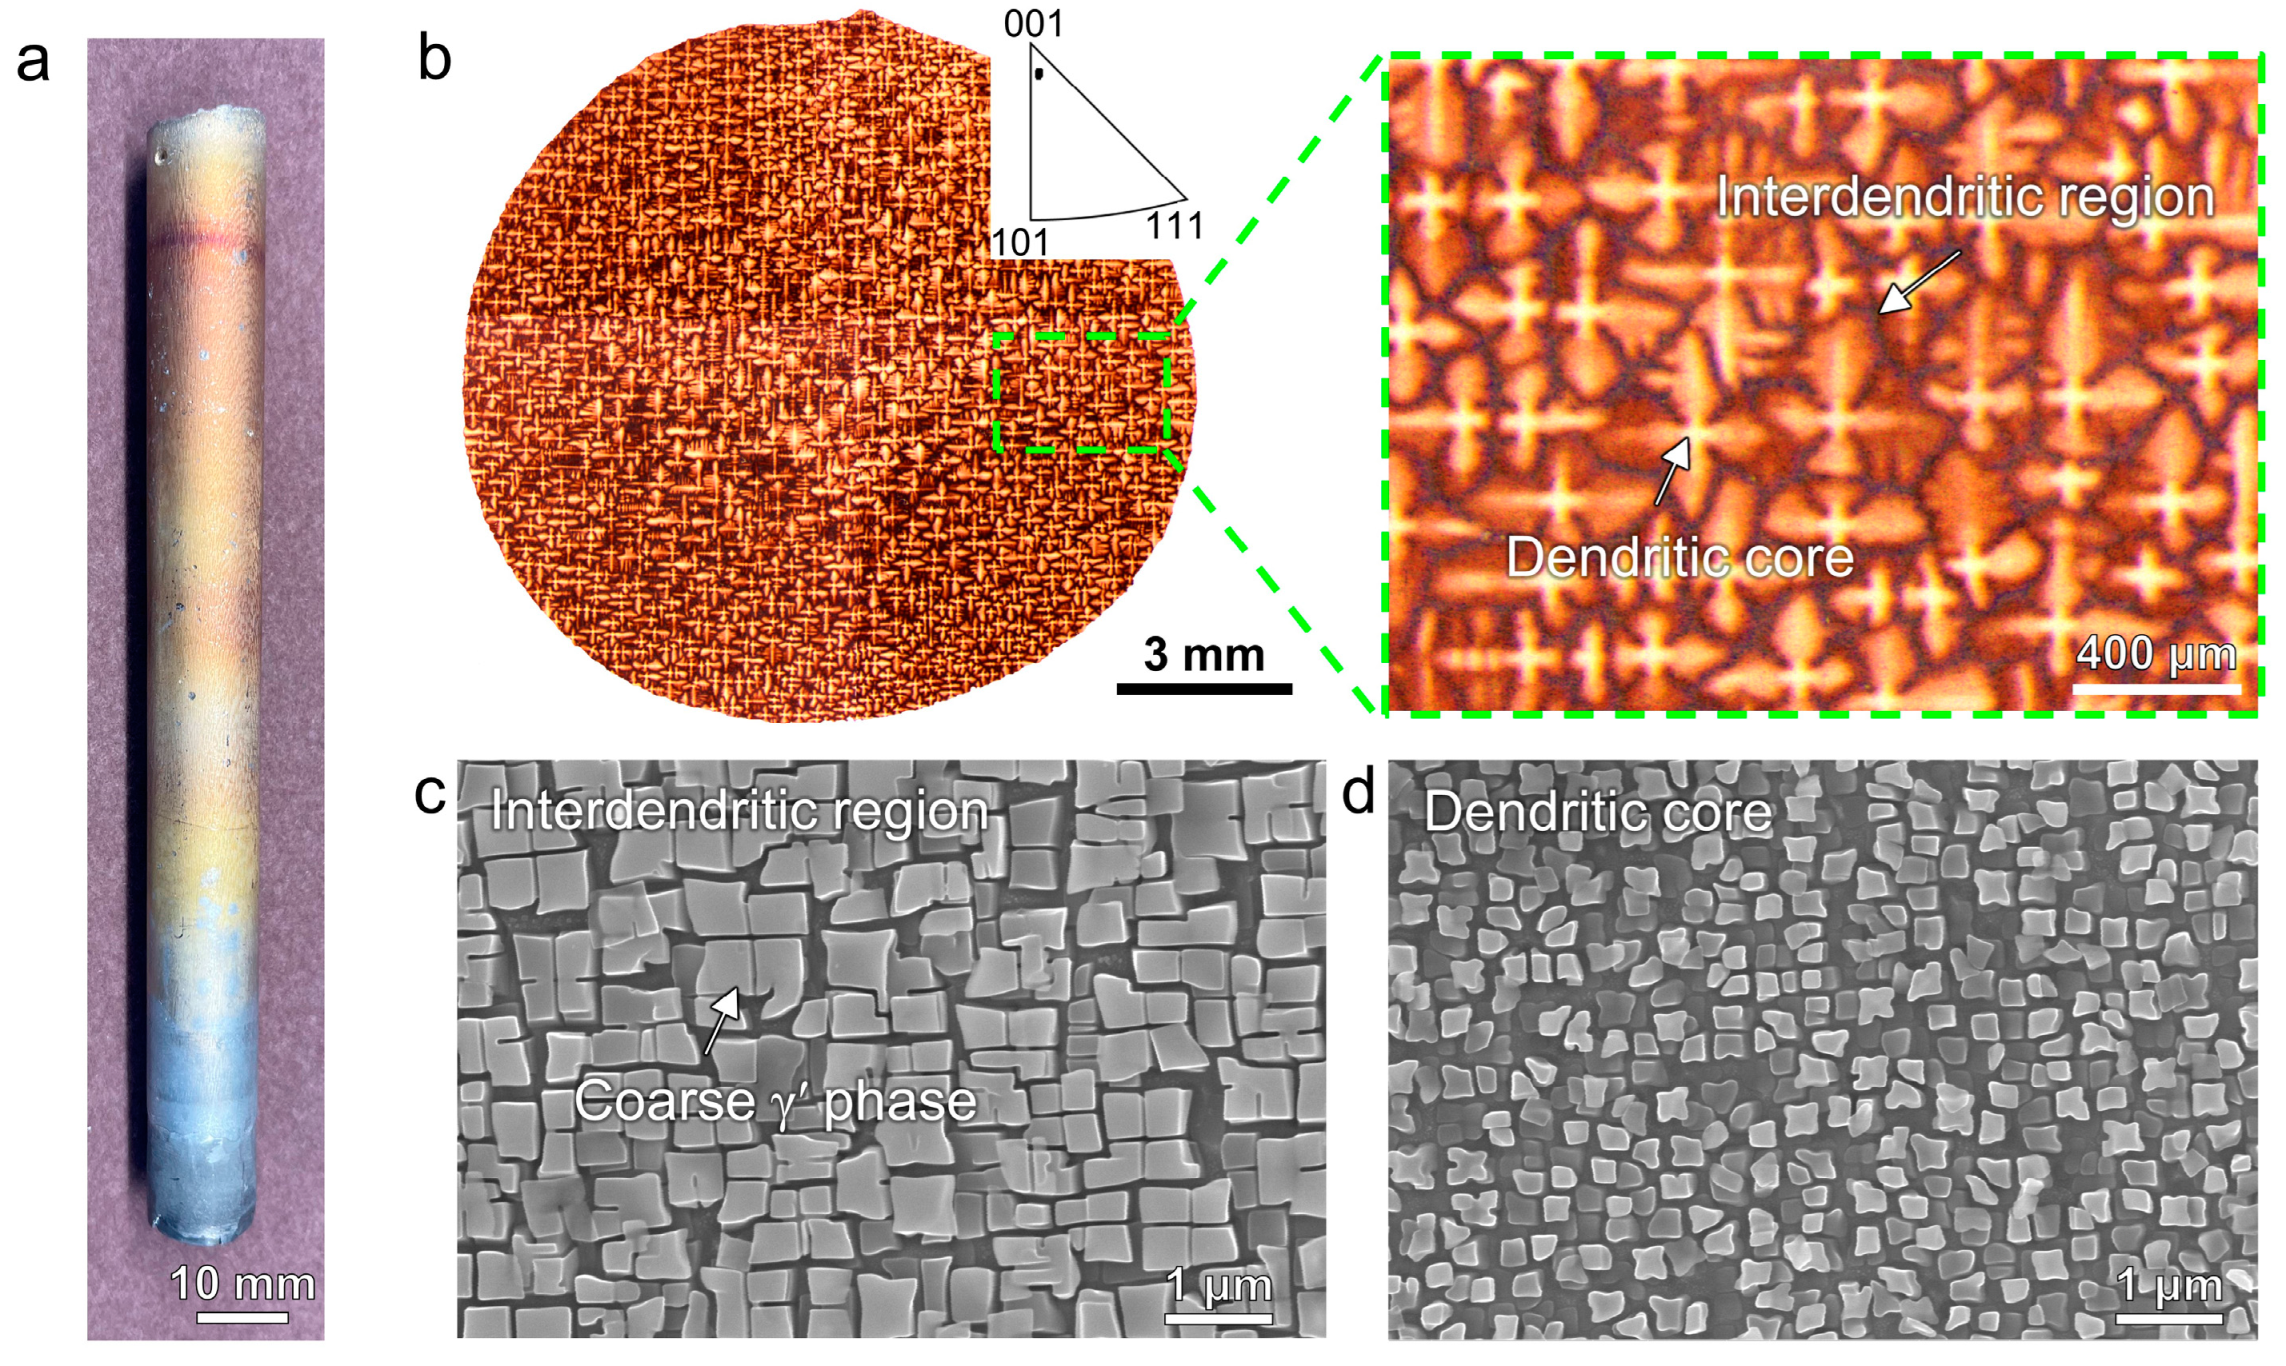
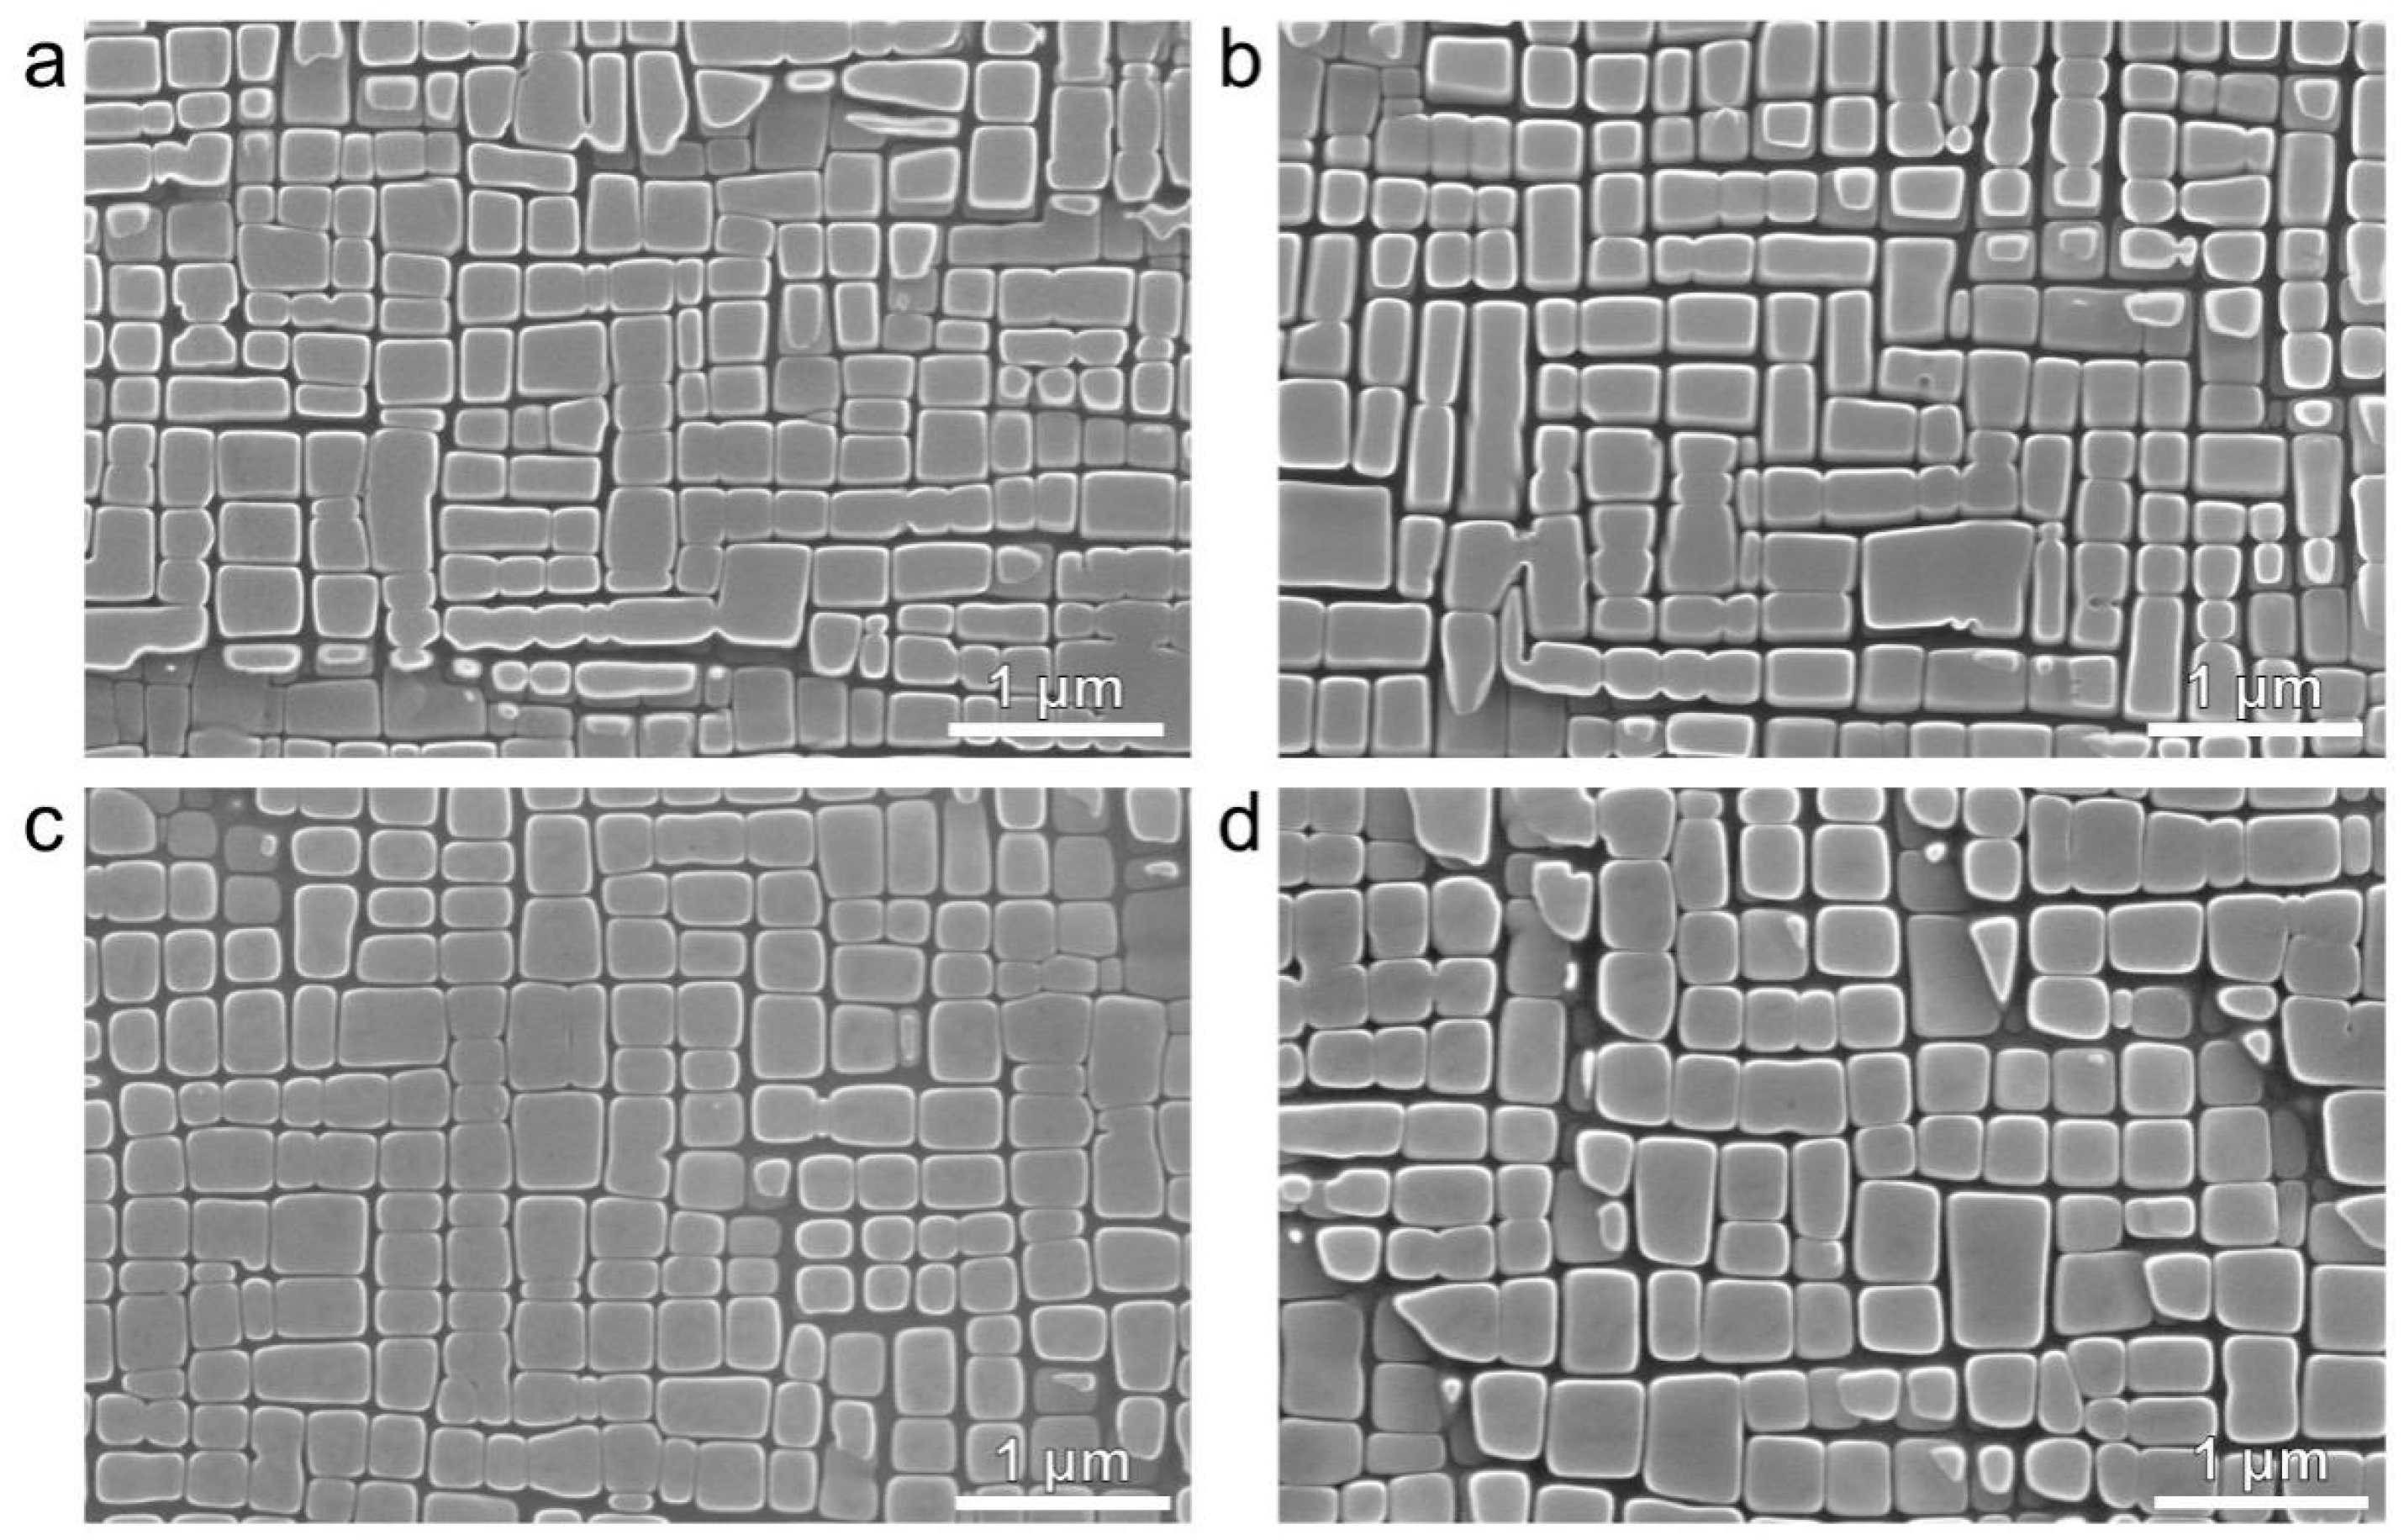
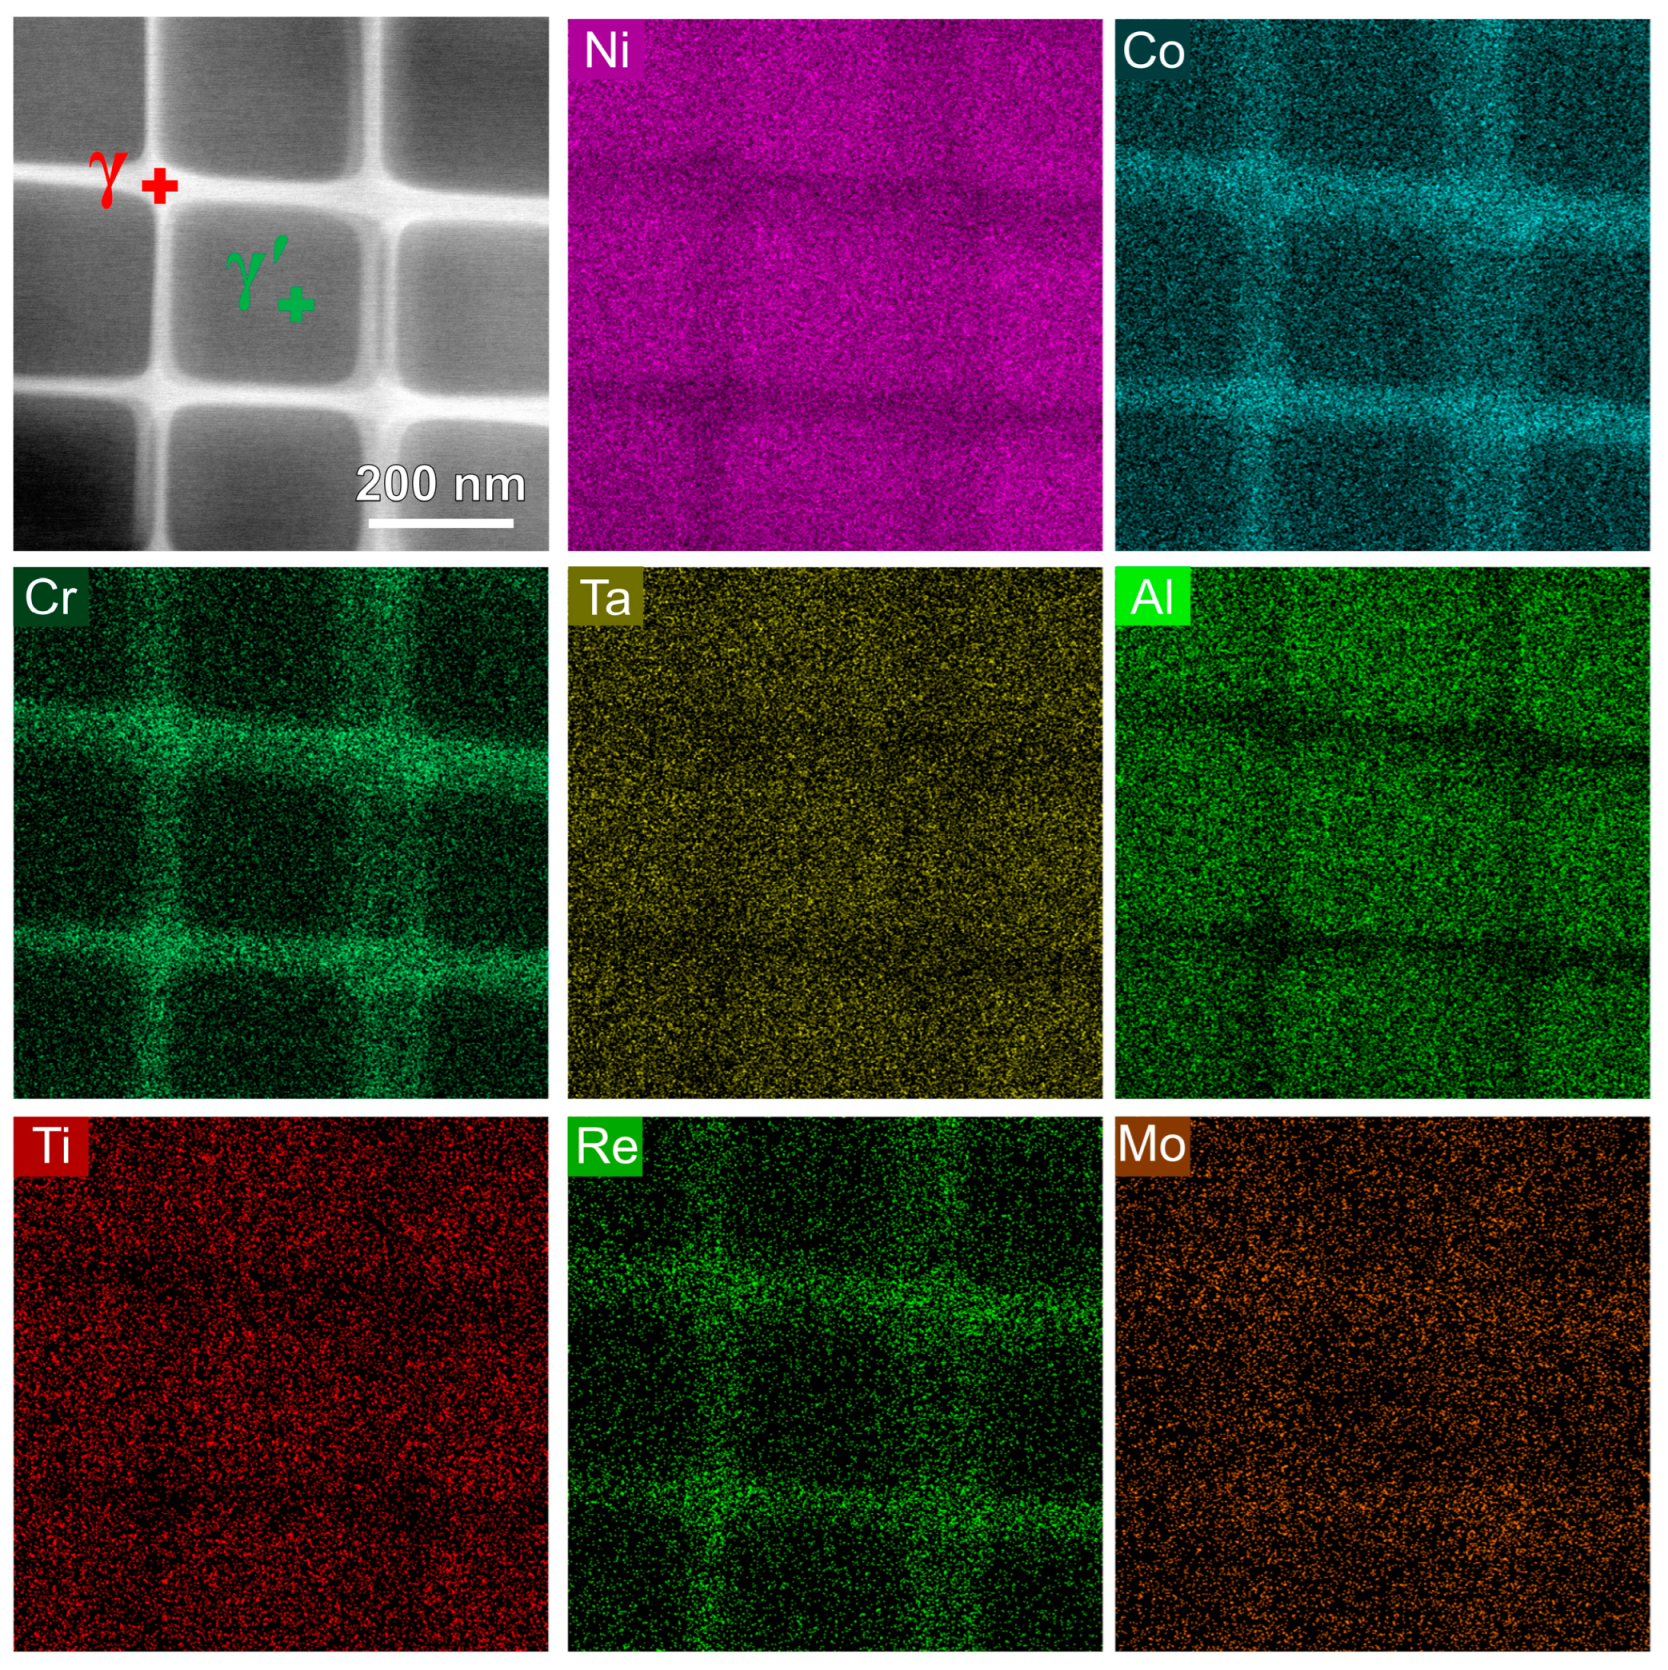
3.1. Microstructure

SX rods for all four compositions are successfully grown using the Bridgman method and exhibit similar microstructure. An example of an as-grown SX rod before solution and aging treatments is shown in Figure 2a. A cross-sectional optical micrograph of the as-grown rod (Figure 2b) confirms that no high-angle grain boundaries are observed on the entire surface, indicating the good quality of the SX. EBSD is used to determine the orientation of the SX, as shown in the inverse pole figure (inset of Figure 2b). The growth direction is within 10° of the [001] direction. The as-grown microstructures are typical dendrite structures with an average primary dendrite spacing of ~320 μm. The interdendritic region mainly consists of coarse γ′ particles with an average size of 370 (±68) nm (Figure 2c). In contrast, the γ′ particles in dendritic regions are relatively fine, and the average size is 220 (±30) nm (Figure 2d).
Microstructures of the four SX alloys after solution and aging treatments are presented in Figure 3. Typical γ/γ′ two-phase microstructure of Ni-based SX superalloy is obtained for all four alloys, and the γ′ particles are square and uniformly distributed in the γ phase. Moreover, the inhomogeneity between the dendritic and interdendritic region are eliminated after heat treatment. Based on the measurement of more than 100 γ′ particles in each alloy, average sizes of γ′ particles in 3Ta6.4Al1Ti, 0Ta6.4Al2Ti, 3Ta6Al1Ti, and 0Ta6Al2Ti SX superalloys are 260 (±61) nm, 270 (±59) nm, 270 (±59) nm, and 290 (±66) nm, respectively.

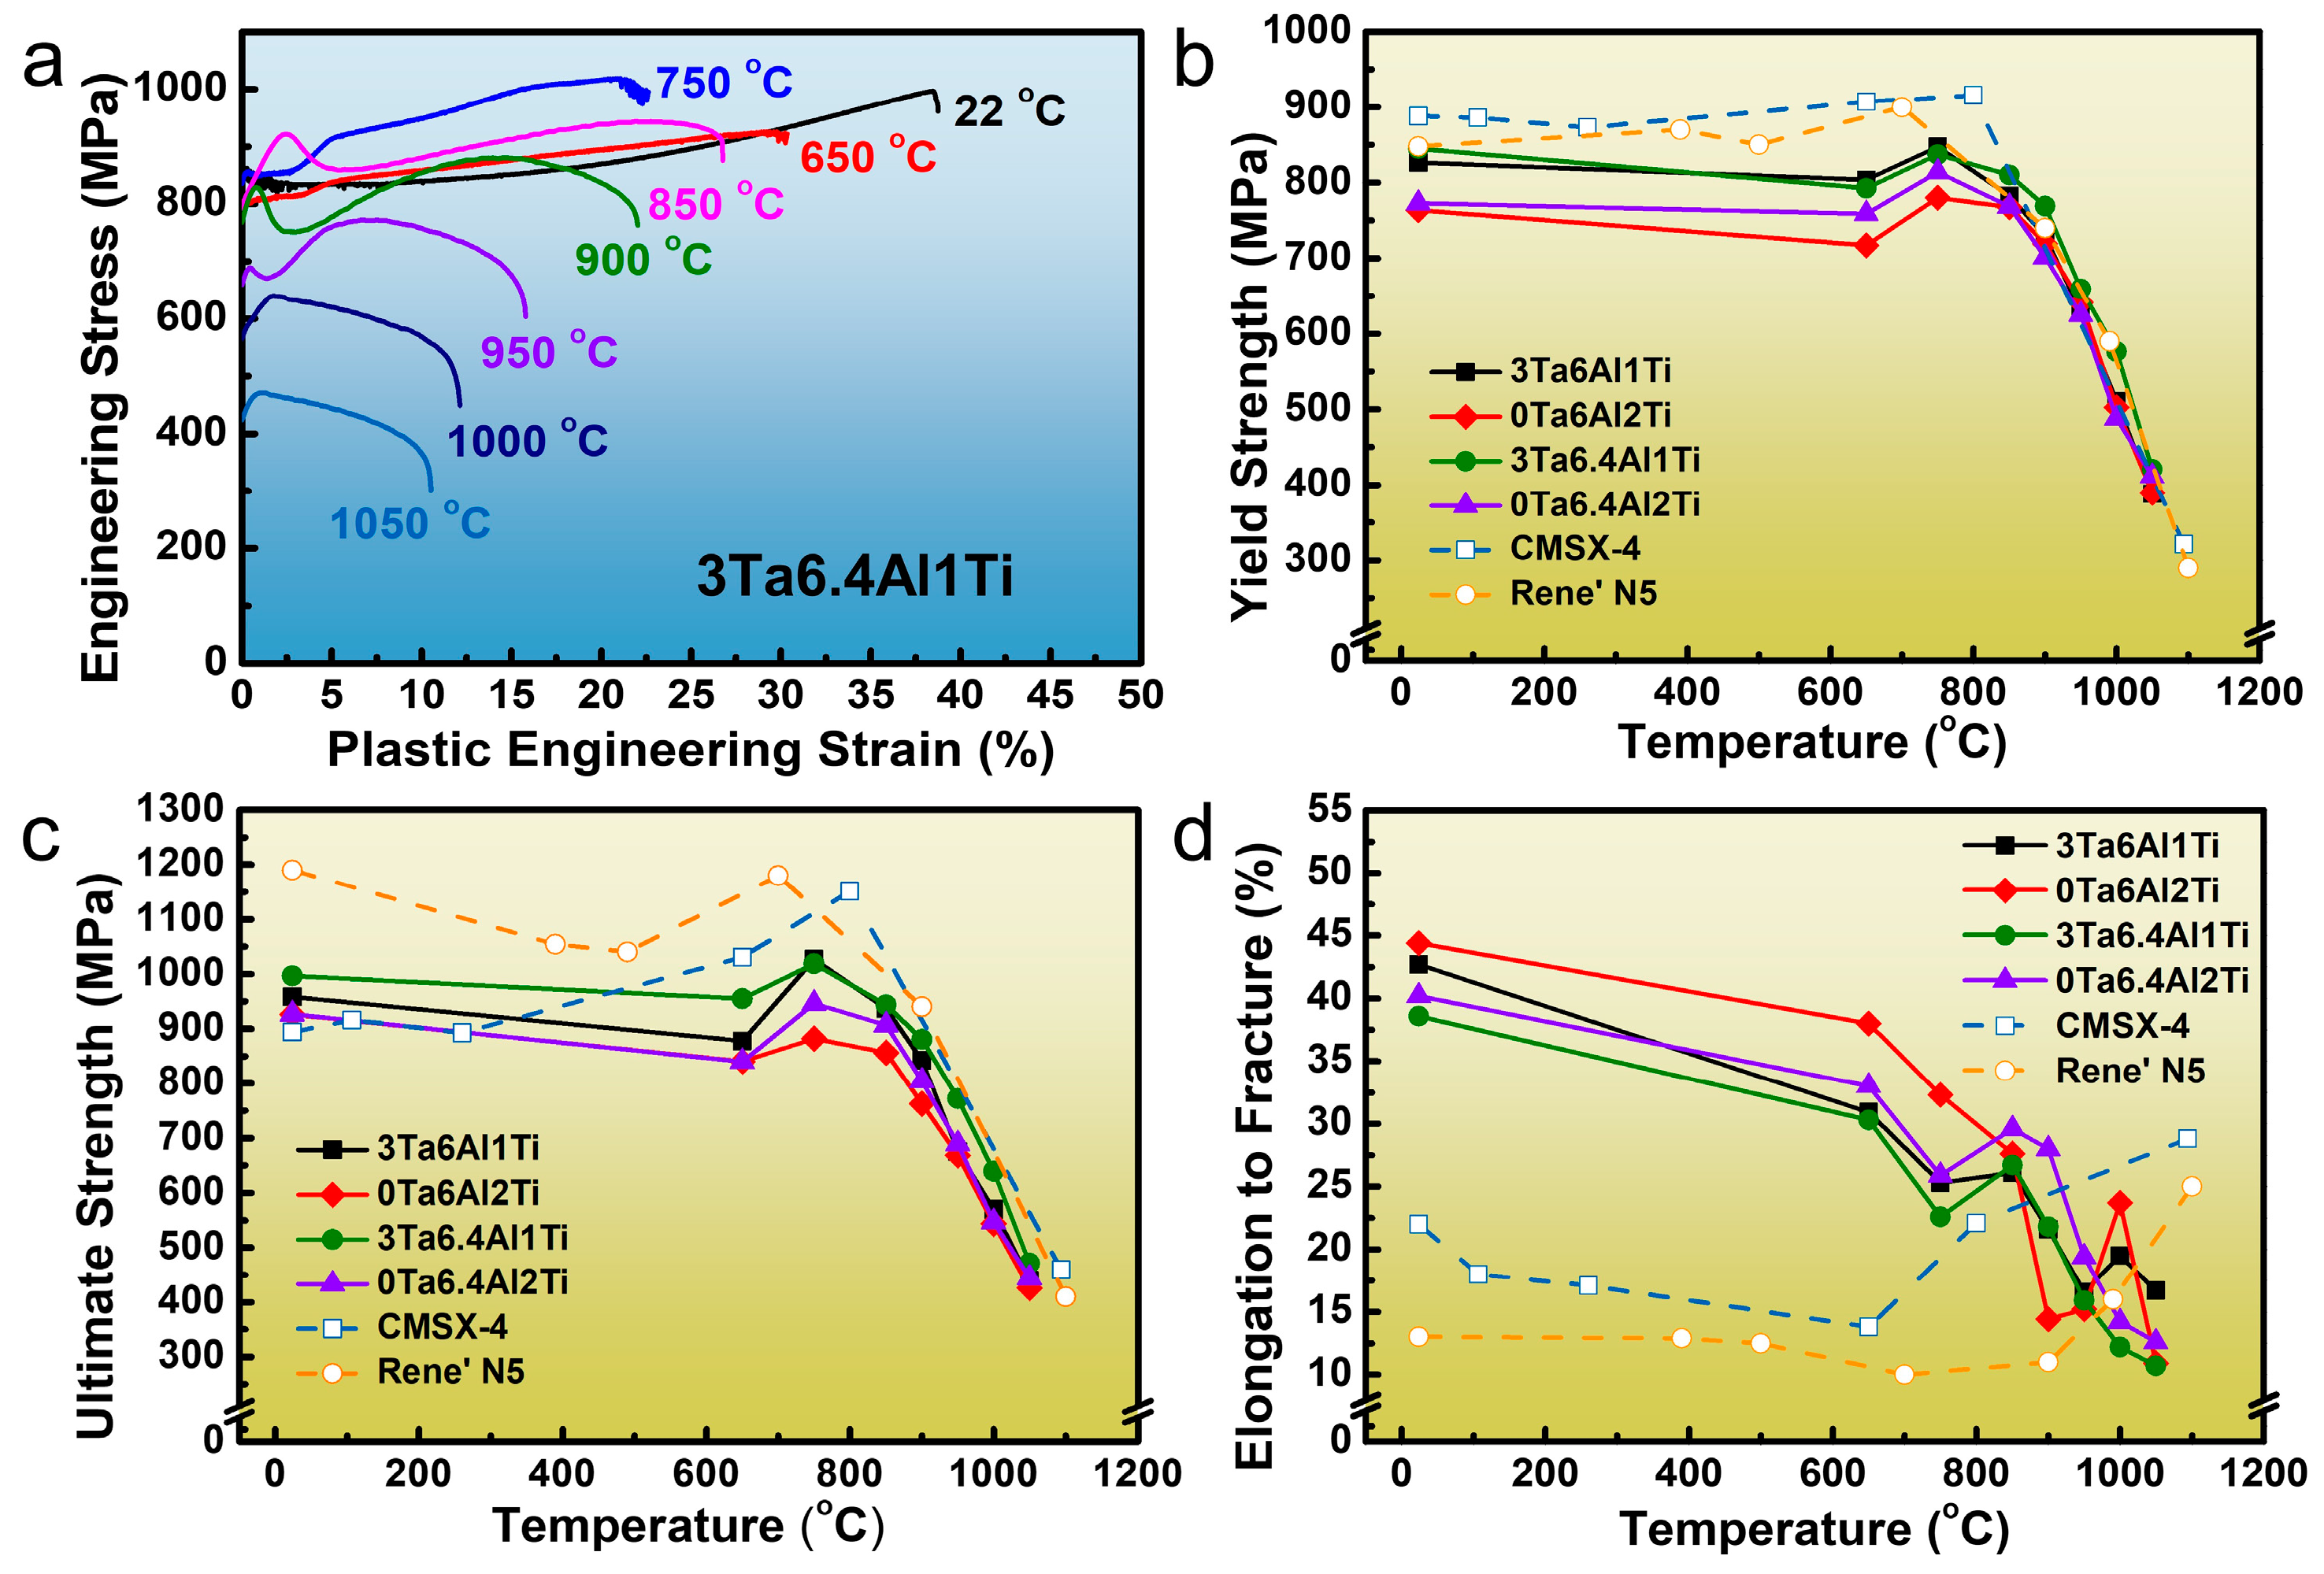
3.2. Tensile Properties

Tensile tests at the temperature range from RT to 1050 °C are conducted to investigate the mechanical properties of SX superalloys with typical γ/γ′ two-phase microstructure (shown in Figure 3). Four alloys have similar plastic deformation behavior. Therefore, stress-strain curves for one alloy (3Ta6.4Al1Ti alloy) are shown in Figure 4a as a representative. Similar to other Ni-based SX superalloys [25,26,27], at RT-750 °C, the samples fail after continuous work hardening, which might be related to the dislocation slip in the matrix and superdislocation shearing of γ′ precipitates [28]. At 850–950 °C, the flow stress decreases and then increases after yielding, which is the so-called yield drop phenomenon. The yield drop phenomena have been observed in other Ni-based SX superalloys as well, such as 3.8Cr-8.5Co-7W-5.2Al-6Ta-1.6Re-1.5Mo-Ni [29] and 5.8Al-8Co-2Mo-18(W + Cr + Ta)-3Re-Ni [30] alloys, which is often companied by the observation of Kear-Wilsdorf lock (KWL) during deformation in this temperature range [30]. At 950–1050 °C, only slight work hardening is observed after the yield point, then the flow stress gradually decreases until fracture. The decrease in flow stress may be related to the low strength of γ and γ′ phases at high temperatures because the movement of dislocations is fast and cannot provide effective obstacles to dislocation movements [23,31].
Figure 4b–d summarizes the temperature dependence of YS, ultimate tensile strength (UTS), and elongation to fracture (EF) of four experimental SX superalloys. The newly developed SX superalloys contain 3 wt.%Re but without W for a low specific weight. For comparison, data for two commercial Ni-based single crystal superalloys CMSX-4 and Rene′ N5 [32,33], which also have 3 wt.% Re but contain W, is also included in the figures. As Figure 4b,c shows, both YS and UTS of four experimental alloys slightly increase to the maximum value from RT to 750 °C, then drop quickly with increased temperature, which is consistent with those two commercial alloys and many other Ni-based SX superalloys [32,33]. At temperatures below 800 °C, the four experimental alloys have slightly lower YS and UTS than CMSX-4 and Rene′ N5 alloys. However, service temperatures of Ni-based SX superalloys as turbine blades are normally in the range from 780 to 1050 °C [1]. The YS and UTS of the four alloys at temperatures above 800 °C are close to those of the two commercial superalloys. Moreover, the specific weight of the four alloys is lower than 8.4 g/cm3. Therefore, the newly developed SX superalloys might have potential applications at high temperatures. The comparison of the EF is shown in Figure 4d. The EF of all four alloys below 850 °C exceeds 20%, which is significantly better than that of CMSX-4 and Rene′ N5 alloys. This is consistent with the previously alloy design principle [16]. The high concentration of Co (about 15 wt.%) in the four alloys may effectively reduce the stacking fault energy (SFE) of the face centered cubic (FCC) structured γ matrix. This might be responsible for the good ductility below 850 °C and relatively low ductility above 850 °C [25,34,35,36]. However, at temperatures above 850 °C, the alloys still exhibit reasonable ductility with EF exceeding 10%.

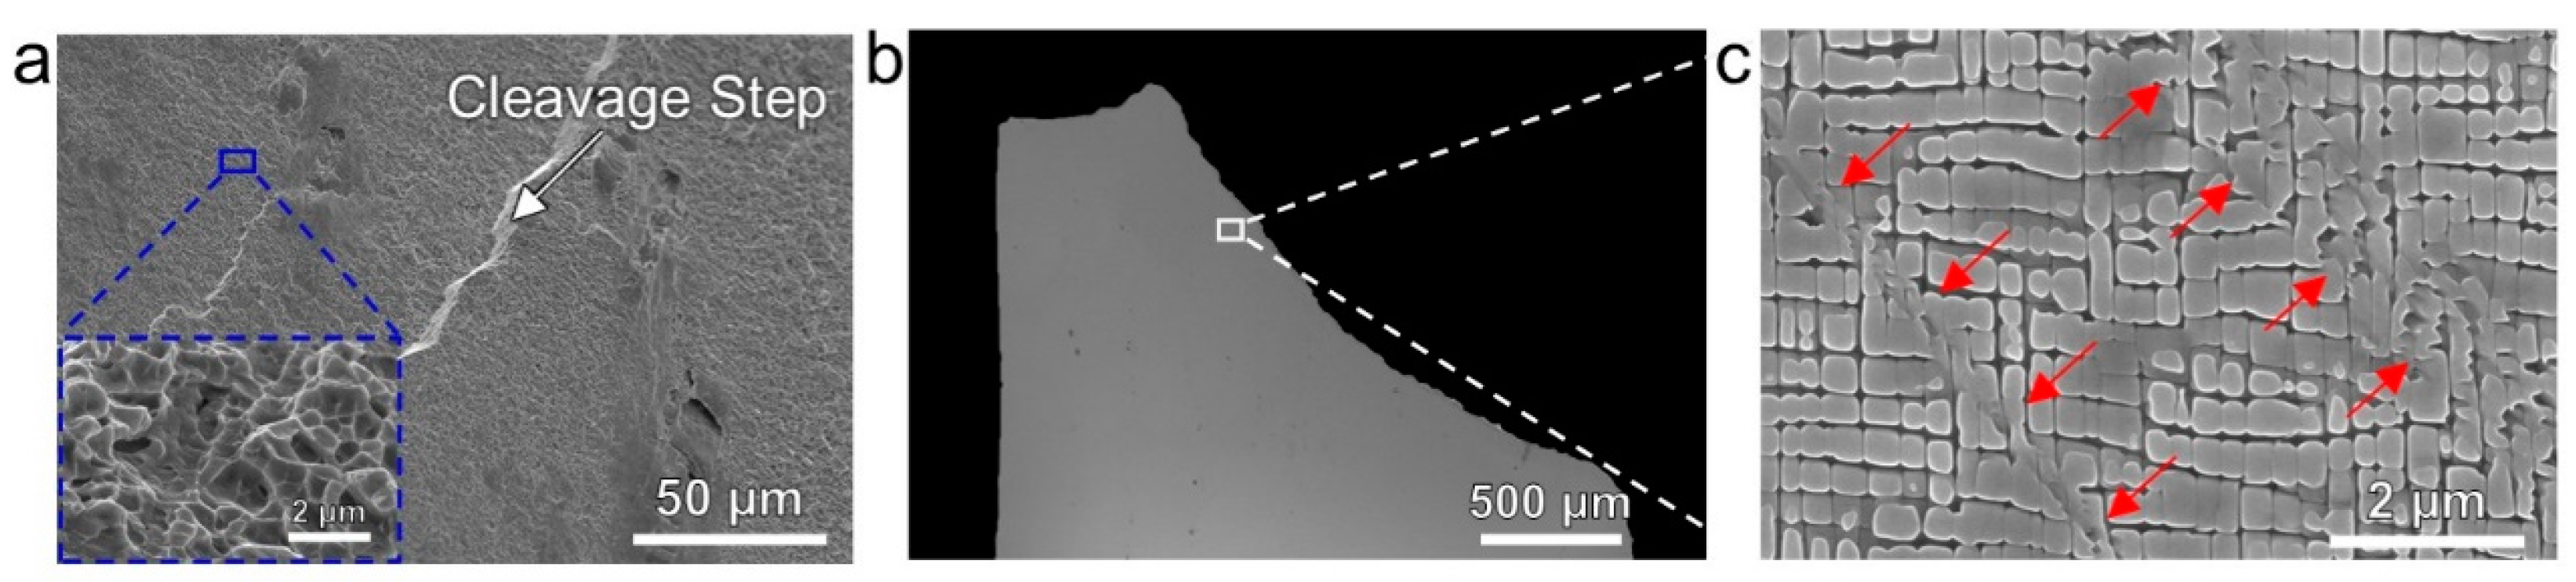
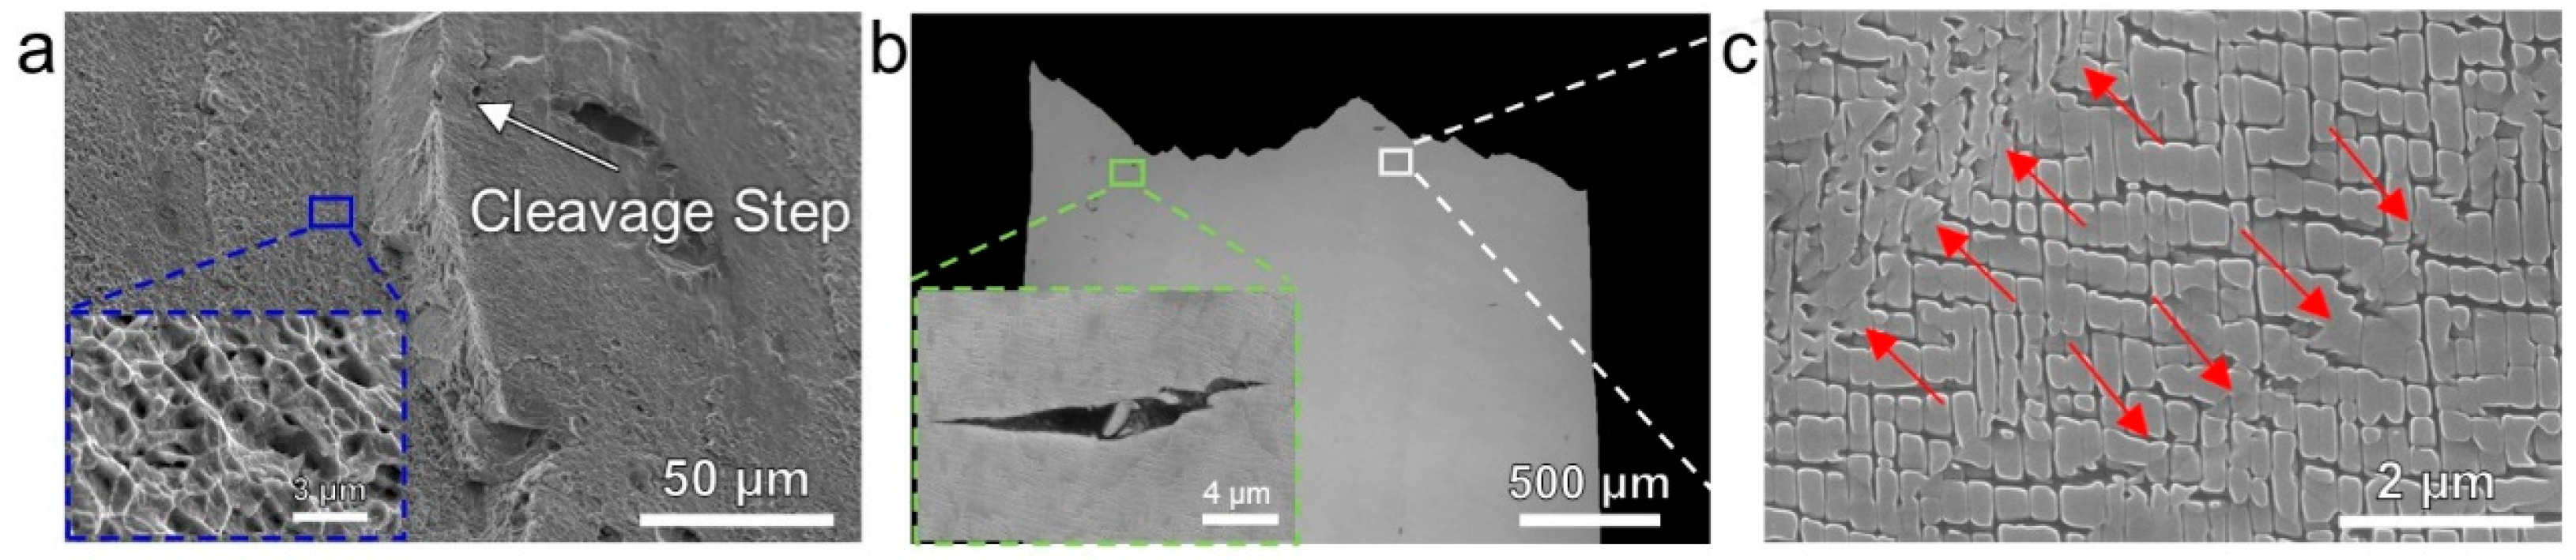
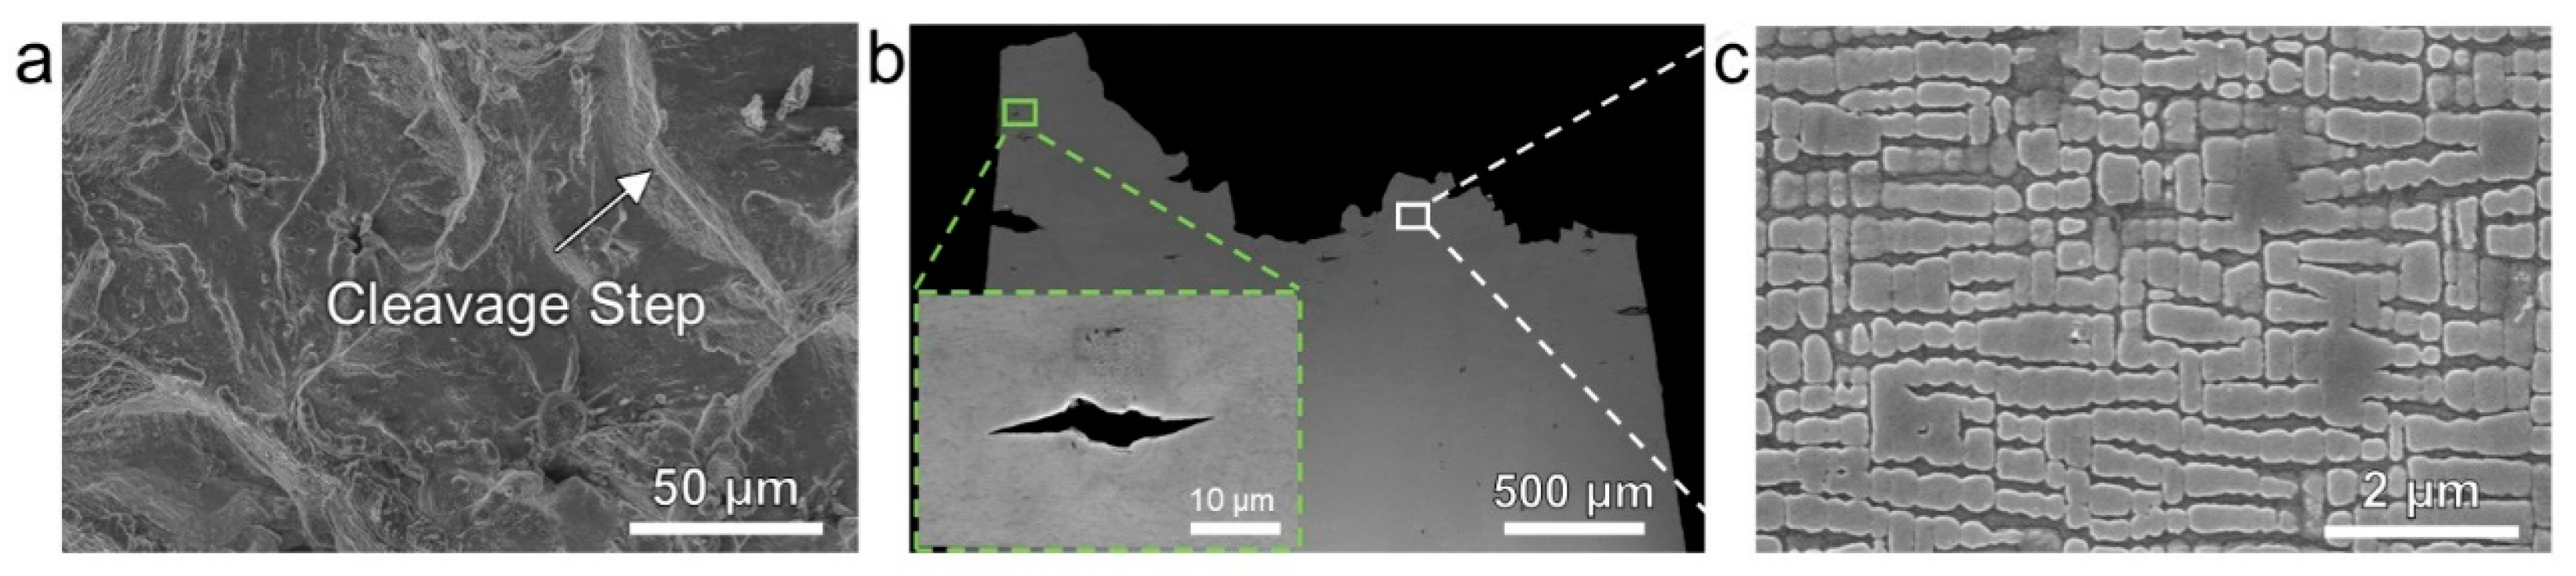
3.3. Fracture Analysis

Microstructural analysis after tensile tests is examined to reveal the fracture behavior of the alloys. In consistence with the stress-strain behavior, the temperature dependence of fracture modes can also be divided into three groups according to the deformation temperature for all four alloys: low temperatures (RT-750 °C), intermediate temperatures (850–900 °C), and high temperatures (950–1050 °C). The microstructures for one alloy (3Ta6.4Al1Ti) fractured at RT, 850 °C, and 1050 °C are shown as representatives in Figure 5, Figure 6 and Figure 7.
As shown in Figure 5a, the alloy fractures in a ductile manner at RT. A large number of cleavage steps and dimples appear on the fracture surface, indicating that the alloy has undergone a large amount of plastic deformation before fracture, which is consistent with the large EF of 35%. The deformation mechanism can be preliminarily determined in Figure 5b,c. There are some shear traces along 45° of the tensile direction passing through the γ/γ′ interface (red arrows in Figure 5c), indicating that some of the γ′ precipitates are already sheared off. Therefore, the deformation of the alloy at RT is dominated by the localized shear of both phases.
As shown in Figure 6a, similar to the RT samples, the cleavage step and dimples on the fracture surface at 850 °C also show a ductile nature, corresponding to the high EF (>20%). The shear traces on the side image also indicate that the failure of the alloy is dominated by the localized shear of both phases (Figure 6c). One significant difference between the 850 °C and RT samples is that many microvoids (inset in Figure 6b) are observed on the side surface of the tensile specimens after fracturing at 850 °C. Careful examination reveals that those microvoids are located in the interdendritic region, indicating that the interdendritic region is weak during deformation at this temperature range.
As the testing temperature increases to 1050 °C, the fracture surface and deformation mechanism of the samples are changed. The fracture surface is dominated by cleavage steps and without dimples (Figure 7a), which is consistent with the relatively low EF of ~10% (shown in Figure 4d). Moreover, no shear traces in both phases have been observed at 1050 °C (Figure 7c), indicating that deformation might be diffusion dominated rather than dislocation slip [23]. The γ′ phase appears to be stretched along the tensile direction of [001] and starts to connect in the horizontal direction indicating that γ phase has been squeezed due to Poisson’s effect. In addition, similar to the sample fractured at 850 °C, the weak region is still the interdendritic region, where microvoids are observed (Figure 7b).

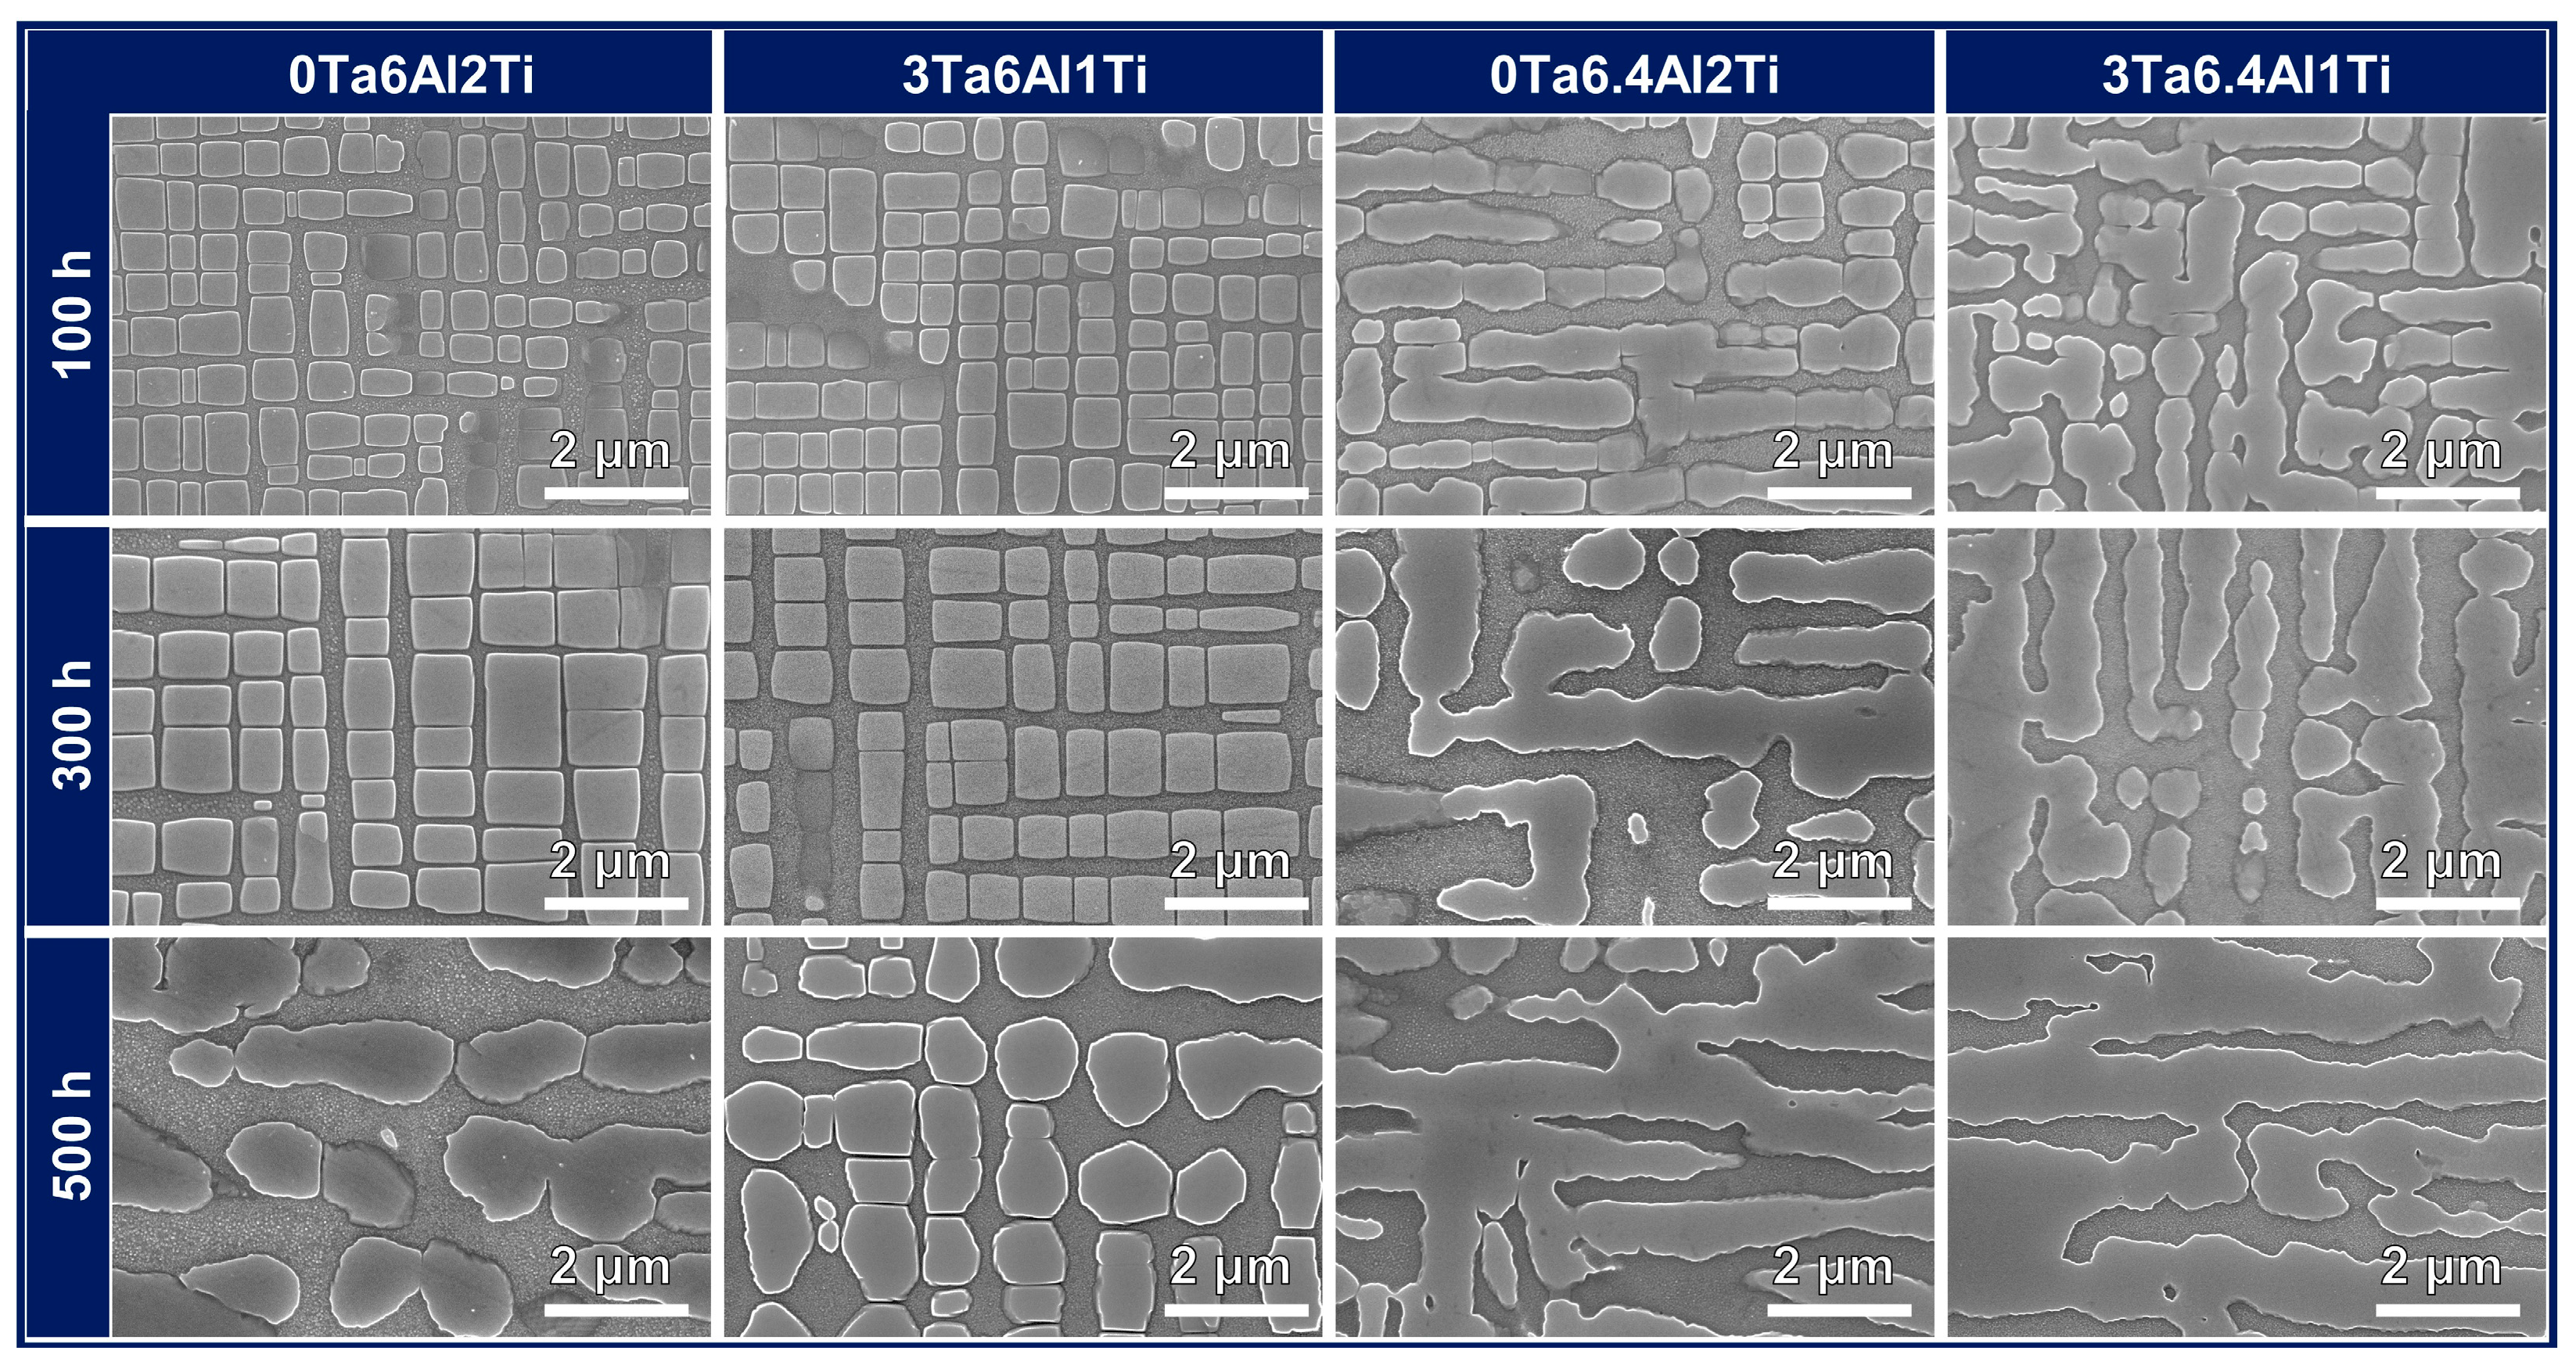
3.4. Microstructural Evolution during Thermal Exposure at 1050 °C

The microstructures of the four SX superalloys after thermal exposure at 1050 °C for up to 500 h are shown in Figure 8. No TCP phase formation is observed in all four alloys, indicating excellent phase stability. The γ′ morphology evolution during thermal exposure of those SX superalloys shows that the coarsening behavior depends on the composition. During 500 h thermal exposure, the γ′ phase of alloys with 6 wt.% Al (3Ta6Al1Ti and 0Ta6Al2Ti) coarsens slower than that with 6.4 wt.% Al. Moreover, γ′ particles in the alloys with 6 wt.% Al become irregular, but they are still separated by the γ phase after 500 h exposure at 1050 °C. In comparison, γ′ particles in alloys with 6.4 wt.% Al start connection to form rafting microstructure after 100 h thermal exposure, which continuously coarsens as thermal exposure time increases. It is clear that decreasing Al concentration appears to increase the resistance to rafting in the four alloys.
Normally, the γ′ phase coarsening behavior is closely related to lattice misfit (δ) between γ′ and γ phases [37,38], which is defined in ref. [1] as:
δ = 2 × a γ a γ a γ + a γ
where aγ and aγ are lattice parameters of the γ and γ′ phases, which can be calculated by using the Caron model [37,39,40] according to the elemental concentrations in γ and γ′ phases:
a R T γ Å = 3.524 + 0.11 C C r γ + 0.0196 C C o γ + 0.478 C M o γ + 0.444 C W γ + 0.179 C A l γ + 0.422 C T i γ + 0.7 C T a γ + 1.03 C H f γ + 0.15 C F e γ + 0.441 C R e γ + 0.3125 C R u γ + 0.7 C N b γ + 5.741 × 10 5 Å K × T 1.010 × 10 9 Å K 2 × T 2  
a R T γ Å = 3.57 0.004 C C r γ 0.0042 C C o γ + 0.208 C M o γ + 0.194 C W γ + 0.258 C T i γ + 0.5 C T a γ + 0.78 C H f γ 0.004 C F e γ + 0.262 C R e γ + 0.1335 C R u γ + 0.46 C N b γ + 6.162 × 10 5 Å K × T 1.132 × 10 8 Å K 2 × T 2      
where C i γ and C i γ are the atomic percentages of the element i in the γ and γ′ phases, and T is the temperature of Kelvin.
In order to calculate the lattice parameters by using the Caron model, compositions of both phases after solid solution and aging treatments are obtained by using EDS quantification analysis. TEM-EDS maps (Figure 9) show the elemental distribution of the 3Ta6.4Al1Ti alloy and locations for quantification in γ and γ′ phases. To guarantee data accuracy, more than six positions are selected for each phase in each alloy. The averaged value of phase composition is calculated and listed in Table 2. Accordingly, the lattice misfits of four SX superalloys are calculated using Equations (1)–(3), and the results are also listed in Table 2.
The calculated δ of 3Ta6.4Al1Ti, 0Ta6.4Al2Ti, 3Ta6Al1Ti, and 0Ta6Al2Ti alloys at 1050 °C are −0.37%, −0.3%, −0.27%, and −0.26%, respectively. Generally, high absolute values of the lattice misfit between the γ and γ′ phases indicate relatively high interphase boundary energy, which is responsible for quick coarsening/rafting during thermal exposure [38,41,42]. In the four alloys, both 6 wt.% Al alloys have lower absolute values of lattice misfit (~0.26%) than that in the 6.4 wt.% Al alloys, which is consistent with the experimental observation of relatively slow coarsening/rafting.
Although 3Ta6Al1Ti and 0Ta6Al2Ti alloys have similar lattice misfits (about −0.26%), their γ′ phase coarsening behavior shows a slight difference. After 500 h thermal exposure, the γ′ phase of 3Ta6Al1Ti alloy still maintains a certain cubic shape, while the γ′ phase in 0Ta6Al2Ti alloy has changed completely into an irregular shape and started to join together (Figure 8). Moreover, the γ′ size of 3Ta6Al1Ti alloy is lower than that of 0Ta6Al2Ti alloy. Coarsening is not only influenced by the lattice misfit of the alloy but also requires elemental diffusion in the γ phase, which might be slowed down by the addition of Ta. To maintain consistency with the experimental observation that replacing 1 wt.% Ti with 3 wt.% Ta is beneficial to the stability of the shape and size of γ′ phase during thermal exposure, replacing 1 wt.% Ti with 3 wt.% Ta increases the Re and Mo partitioning into the γ phase, which leads to a slow diffusion rate of the γ phase due to both Re and Mo being slow diffusers [42,43].
Collectively, with carefully balancing heavy elements Mo, Ta, Re, and W, four low specific weight SX superalloys with 3 wt.% Re but without W have been fabricated. Tensile tests revealed that the SX alloys have comparable strength to commercial second-generation SX CMSX-4 (3 wt.% Re and 6 wt.% W) and Rene′ N5 alloys (3 wt.% Re and 5 wt.% W) above 800 °C. Moreover, the EF below 850 °C (>20%) is better than that of those two commercial SX superalloys. The TCP phase does not appear during thermal exposure at 1050 °C for up to 500 h, indicating excellent phase stability of the alloys. The current work might provide scientific insights for developing Ni-based SX superalloys with low specific weight. However, current work focuses on 3 wt.% Re (typically in second-generation superalloys) without W, how the heavy elements type (Mo, Ta, W, and Re) and concentration combinatorially affect the microstructure, mechanical properties, thermal stability as well as specific weight are complicated and need further systematic exploration.

4. Conclusions

In order to reveal the relationship among the composition, mechanical properties, and thermal stability of SX Ni-based superalloys with low specific weight, SXs are grown. After solution and aging heat treatments, typical γ/γ′ two-phase microstructures are obtained to conduct tensile tests at a wide temperature range between RT and 1050 °C and thermal exposure tests at 1050 °C. With the help of advanced microscopy, the following conclusions can be drawn:
(1)
All four alloys can be grown into SXs form using the Bridgman method, and the as-grown SXs have typical dendritic microstructure. After solution and aging treatments, alloys all have typical γ/γ′ two-phase microstructure, with γ′ size of about 260–290 nm.
(2)
Tensile tests revealed that the yield strength and ultimate tensile strength of the newly developed SX superalloys are similar to those of typical commercial second-generation SX CMSX-4 and Rene′ N5 superalloys at a temperature above 800 °C. Moreover, the ductility below 850 °C is greater than 20 %, better than that of those two commercial alloys.
(3)
Four alloys show similar plastic deformation and fracture behaviors. At RT to 850 °C, the deformation is dominated by localized shear of both phases. Above 950 °C, the deformation appears to be diffusion-dominated and rafting-like microstructures are observed.
(4)
During thermal exposure at 1050 °C for up to 500 h, the topological close-packed phase does not appear, indicating excellent phase stability.
(5)
The evolution of γ′ phase during thermal exposure at 1050 °C is related to the concentration of Al, Ti, and Ta. Decreasing Al concentration appears to increase the resistance of rafting in current experimental alloys and replacing 1 wt.% Ti with 3 wt.% Ta is beneficial to the stability of the shape and size of γ′ phase during thermal exposure.

Author Contributions

D.L.: formal analysis, investigation, writing—original draft, writing—review and editing. Q.D.: conceptualization, methodology, formal analysis, investigation, writing—original draft, writing—review and editing. Q.Z.: investigation, writing—review, and editing. D.Z.: investigation, writing—review, and editing. X.W.: resources, writing—review and editing. X.Z.: resources, writing—review and editing. Z.Z.: conceptualization, formal analysis, resources, writing—review and editing, supervision. H.B.: conceptualization, methodology, formal analysis, investigation, resources, writing—original draft, writing—review and editing, supervision. All authors have read and agreed to the published version of the manuscript.

Funding

This work was supported by Basic Science Center Program for Multiphase Media Evolution in Hypergravity of the National Natural Science Foundation of China (No. 51988101), the Key R & D Project of Zhejiang Province (No. 2020C01002), National Science and Technology Major Project of China (J2019-III-0008-0051), National Natural Science Foundation of China (No. 52201027 & 91960201).

Data Availability Statement

The data presented in this study are available on request from the corresponding author.

Conflicts of Interest

The authors declare no conflict of interest.

References

  1. Reed, R.C. The Superalloys Fundamentals and Applications; Cambridge University Press: Cambridge, UK, 2008; pp. 1–28. [Google Scholar]
  2. Yao, X.; Ding, Q.; Zhao, X.; Wei, X.; Wang, J.; Zhang, Z.; Bei, H. Microstructural rejuvenation in a Ni-based single crystal superalloy. Mater. Today Nano 2021, 17, 100152. [Google Scholar] [CrossRef]
  3. Wang, M.; Cheng, X.; Jiang, W.; Cao, T.; Liu, X.; Lu, J.; Zhang, Y.; Zhang, Z. The effect of amorphous coating on high temperature oxidation resistance of Ni-based single crystal superalloy. Corros. Sci. 2023, 213, 111000. [Google Scholar] [CrossRef]
  4. Giamei, A.F. Development of Single Crystal Superalloys: A Brief History. Adv. Mater. Process 2013, 171, 26–30. [Google Scholar]
  5. Li, J.R.; Zhong, Z.G.; Liu, S.Z.; Tang, D.Z.; Han, M. A Low-Cost Second Generation Single Crystal Superalloy DD6. In Superalloys 2000, Proceedings of the Ninth International Symposium on Superalloys, Seven Springs, PA, USA, 17–21 September 2000; Pollock, T.M., Ed.; The Minerals, Metals & Materials Society: Warrendale, PA, USA, 2000; pp. 777–783. [Google Scholar]
  6. Mackay, R.A.; Gabb, T.P.; Smialek, J.L.; Nathal, M.V. Alloy Design Challenge: Development of Low Density Superalloys for Turbine Blade Applications. Available online: https://ntrs.nasa.gov/citations/20100011899 (accessed on 30 September 2020).
  7. Xia, W.; Zhao, X.; Yue, L.; Zhang, Z. A review of composition evolution in Ni-based single crystal superalloys. J. Mate. Sci. Technol. 2020, 44, 76–95. [Google Scholar] [CrossRef]
  8. Yokokawa, T.; Harada, H.; Kawagishi, K.; Kobayashi, T.; Yuyama, M.; Takata, Y. Advanced Alloy Design Program and Improvement of Sixth-Generation Ni-Base Single Crystal Superalloy TMS-238. In Proceedings of the Fourteenth International Symposium on Superalloys, Seven Springs, PA, USA, 12–16 September 2021; Sammy, T., Ed.; The Minerals, Metals & Materials Society: Warrendale, PA, USA, 2020; pp. 122–130. [Google Scholar]
  9. Yao, X.; Ding, Q.; Wei, X.; Wang, J.; Zhang, Z.; Bei, H. The effects of key elements Re and Ru on the phase morphologies and microstructure in Ni-based single crystal superalloys. J. Alloys Compd. 2022, 926, 166835. [Google Scholar] [CrossRef]
  10. Bewlay, B.P.; Jackson, M.R.; Zhao, J.C. A Review of Very-High-Temperature Nb-Suicide-Based Composites. Metall. Mater. Trans. A 2003, 34A, 2043–2052. [Google Scholar] [CrossRef]
  11. Lemberg, J.A.; Ritchie, R.O. Mo-Si-B alloys for ultrahigh-temperature structural applications. Adv. Mater. 2012, 24, 3445–3480. [Google Scholar] [CrossRef]
  12. Luo, L.; Ru, Y.; Qin, L.; Pei, Y.; Ma, Y.; Li, S.; Zhao, X.; Gong, S. Effects of Alloyed Aluminum and Tantalum on the Topological Inversion Behavior of Ni-Based Single Crystal Superalloys at High Temperature. Adv. Eng. Mater. 2019, 21, 1800793. [Google Scholar] [CrossRef]
  13. Pollock, T.M. Alloy design for aircraft engines. Nat. Mater. 2016, 15, 809–815. [Google Scholar] [CrossRef]
  14. Xia, W.; Zhao, X.; Yue, L.; Zhang, Z. Microstructural evolution and creep mechanisms in Ni-based single crystal superalloys: A review. J. Alloys Compd. 2020, 819, 152954. [Google Scholar] [CrossRef]
  15. Harris, K.; Erickson, G.; Wortmann, J.; Froschhammer, D. Development of low density single crystal superalloy CMSX-6. TMS (Metall. Soc.) Pap. Sel. (USA) 1984, 56, CONF-840909. [Google Scholar]
  16. Liu, D.; Ding, Q.; Yao, X.; Wei, X.; Zhao, X.; Zhang, Z.; Bei, H. Composition design and microstructure of Ni-based single crystal superalloy with low specific weight—Numerical modeling and experimental validation. J. Mater. Res. 2022, 37, 3773–3783. [Google Scholar] [CrossRef]
  17. Fleischmann, E.; Miller, M.K.; Affeldt, E.; Glatzel, U. Quantitative experimental determination of the solid solution hardening potential of rhenium, tungsten and molybdenum in single-crystal nickel-based superalloys. Acta Mater. 2015, 87, 350–356. [Google Scholar] [CrossRef] [Green Version]
  18. Horst, O.M.; Adler, D.; Git, P.; Wang, H.; Streitberger, J.; Holtkamp, M.; Jöns, N.; Singer, R.F.; Körner, C.; Eggeler, G. Exploring the fundamentals of Ni-based superalloy single crystal (SX) alloy design: Chemical composition vs. microstructure. Mater. Des. 2020, 195, 108976. [Google Scholar] [CrossRef]
  19. Helmer, H.; Matuszewski, K.; Müller, A.; Rettig, R.; Ritter, N.; Singer, R. Development of a Low-Density Rhenium-Free Single Crystal Nickel-Based Superalloy by Application of Numerical Multi-Criteria Optimization Using Thermodynamic Calculations. In Proceedings of the Thirteenth International Symposium on Superalloys, Seven Springs, PA, USA, 11–15 September 2016; Mark, H., Ed.; The Minerals, Metals & Materials Society: Warrendale, PA, USA, 2016; pp. 35–44. [Google Scholar]
  20. Zhang, J.; Luo, Y.; Zhao, Y.; Yang, S.; Jia, Y.; Cui, L.; Xu, J.; Tang, D. The research of microstructure and property of a low density nickel base single crystal superalloy. J. Aeron. Mater. 2011, 31, 90–93. [Google Scholar]
  21. Du, Y.; Tan, Z.; Yang, Y.; Wang, X.; Zhou, Y.; Li, J.; Sun, X. Creep Properties of a Nickel-Based Single Crystal Superalloy with Low Density. Met. Mater. Int. 2021, 27, 5173–5178. [Google Scholar] [CrossRef]
  22. Ding, Q.; Bei, H.; Wei, X.; Gao, Y.F.; Zhang, Z. Nano-twin-induced exceptionally superior cryogenic mechanical properties of a Ni-based GH3536 (Hastelloy X) superalloy. Mater. Today Nano 2021, 14, 100110. [Google Scholar] [CrossRef]
  23. Ding, Q.; Bei, H.; Zhao, X.; Gao, Y.; Zhang, Z. Processing, Microstructures and Mechanical Properties of a Ni-Based Single Crystal Superalloy. Crystals 2020, 10, 572. [Google Scholar] [CrossRef]
  24. Ding, Q.; Bei, H.; Li, L.; Ouyang, J.; Zhao, X.; Wei, X.; Zhang, Z. The dependence of stress and strain rate on the deformation behavior of a Ni-based single crystal superalloy at 1050 °C. Int. J. Mech. Syst. Dyn. 2021, 1, 121–131. [Google Scholar] [CrossRef]
  25. Song, W.; Wang, X.G.; Li, J.G.; Meng, J.; Yang, Y.H.; Liu, J.L.; Liu, J.D.; Zhou, Y.Z.; Sun, X.F. Effect of Ru on tensile behavior and deformation mechanism of a nickel-based single crystal superalloy. Mater. Sci. Eng. A 2021, 802, 140430. [Google Scholar] [CrossRef]
  26. Wang, G.L.; Liu, J.L.; Liu, J.D.; Wang, X.G.; Zhou, Y.Z.; Sun, X.D.; Zhang, H.F.; Jin, T. Temperature dependence of tensile behavior and deformation microstructure of a Re-containing Ni-base single crystal superalloy. Mater. Des. 2017, 130, 131–139. [Google Scholar] [CrossRef]
  27. Xiong, X.; Quan, D.; Dai, P.; Wang, Z.; Zhang, Q.; Yue, Z. Tensile behavior of nickel-base single-crystal superalloy DD6. Mater. Sci. Eng. A 2015, 636, 608–612. [Google Scholar] [CrossRef]
  28. Ding, Q.; Bei, H.; Yao, X.; Zhao, X.; Wei, X.; Wang, J.; Zhang, Z. Temperature effects on deformation substructures and mechanisms of a Ni-based single crystal superalloy. Appl. Mater. Today 2021, 23, 101061. [Google Scholar] [CrossRef]
  29. Yin, Q.; Wen, Z.; Wang, J.; Lian, Y.; Lu, G.; Zhang, C.; Yue, Z. Microstructure characterization and damage coupled constitutive modeling of nickel-based single-crystal alloy with different orientations. Mater. Sci. Eng. A 2022, 853, 143761. [Google Scholar] [CrossRef]
  30. Tan, Z.H.; Wang, X.G.; Du, Y.L.; Duan, T.F.; Yang, Y.H.; Liu, J.L.; Liu, J.D.; Yang, L.; Li, J.G.; Zhou, Y.Z.; et al. Temperature dependence on tensile deformation mechanisms in a novel Nickel-based single crystal superalloy. Mater. Sci. Eng. A 2020, 776, 138997. [Google Scholar] [CrossRef]
  31. Dieter, G.E. Mechanical Metallurgy; McGraw-Hill Book Company: New York, NY, USA, 1961; pp. 110–117. [Google Scholar]
  32. Sengupta, A.; Putatunda, S.K.; Bartosiewicz, L.; Hangas, J.; Nailos, P.J.; Peputapeck, M.; Alberts, F.E. Tensile behavior of a new single-crystal nickel-based superalloy (CMSX-4) at room and elevated temperatures. J. Mater. Eng. Perform. 1994, 3, 73–81. [Google Scholar] [CrossRef]
  33. Corrigan, J.; Launsbach, M.G.; Mihalisin, J.R. Nickel Base Superalloy and Single Crystal Castings. U.S. Patent 8241560 B2, 14 August 2012. [Google Scholar]
  34. Yang, W.; Qu, P.; Sun, J.; Yue, Q.; Su, H.; Zhang, J.; Liu, L. Effect of alloying elements on stacking fault energies of γ and γʹ phases in Ni-based superalloy calculated by first principles. Vacuum 2020, 181, 109682. [Google Scholar] [CrossRef]
  35. Yang, W.; Qu, P.; Liu, C.; Cao, K.; Qin, J.; Su, H.; Zhang, J.; Ren, C.; Liu, L. Temperature dependence of compressive behavior and deformation microstructure of a Ni-based single crystal superalloy with low stacking fault energy. Trans. Nonferrous Met. Soc. China 2023, 33, 157–167. [Google Scholar] [CrossRef]
  36. Tian, C.; Han, G.; Cui, C.; Sun, X. Effects of stacking fault energy on the creep behaviors of Ni-base superalloy. Mater. Des. 2014, 64, 316–323. [Google Scholar] [CrossRef]
  37. Long, H.; Wei, H.; Liu, Y.; Mao, S.; Zhang, J.; Xiang, S.; Chen, Y.; Gui, W.; Li, Q.; Zhang, Z.; et al. Effect of lattice misfit on the evolution of the dislocation structure in Ni-based single crystal superalloys during thermal exposure. Acta Mater. 2016, 120, 95–107. [Google Scholar] [CrossRef]
  38. Zhuang, X.; Antonov, S.; Li, L.; Feng, Q. Effect of alloying elements on the coarsening rate of γʹ precipitates in multi-component CoNi-based superalloys with high Cr content. Scr. Mater. 2021, 202, 114004. [Google Scholar] [CrossRef]
  39. Reed, R.C.; Tao, T.; Warnken, N. Alloys-By-Design: Application to nickel-based single crystal superalloys. Acta Mater. 2009, 57, 5898–5913. [Google Scholar] [CrossRef]
  40. Wei, B.; Lin, Y.; Huang, Z.; Huang, L.; Zhou, K.; Zhang, L.; Zhang, L. A novel Re-free Ni-based single-crystal superalloy with enhanced creep resistance and microstructure stability. Acta Mater. 2022, 240, 118336. [Google Scholar] [CrossRef]
  41. Harada, H.; Murakami, H. Design of Ni-base superalloys. In Computational Materials Design; Saito, T., Ed.; Springer: Heidelberg, Germany, 1999; Volume 34, pp. 39–70. [Google Scholar]
  42. Pan, Q.; Zhao, X.; Cheng, Y.; Yue, Q.; Gu, Y.; Bei, H.; Zhang, Z. Effects of Co on microstructure evolution of a 4th generation nickel-based single crystal superalloys. Intermetallics 2023, 153, 107798. [Google Scholar] [CrossRef]
  43. Lu, F.; Antonov, S.; Lu, S.; Zhang, J.; Li, L.; Wang, D.; Zhang, J.; Feng, Q. Unveiling the Re effect on long-term coarsening behaviors of γ′ precipitates in Ni-based single crystal superalloys. Acta Mater. 2022, 233, 117979. [Google Scholar] [CrossRef]
Figure 1. Schematic diagram showing SX growth and sample preparation procedures. (a) SX growth in a Bridgeman furnace; (b) The preparation and the orientation of tensile samples; (c) Observation position for deformed microstructure. The viewing direction is normal to (100) plane.
Crystals 13 00610 g001
Figure 2. Photograph and cross-sectional microstructures of an as-grown Ni-based SX rod (3Ta6Al1Ti). (a) An SX rod; (b) Optical micrograph and inverse pole figure (inset) of the cross-section of the SX alloy, indicating that growth direction is along the [001] direction. SE images show that the γ′ phase in the interdendritic region (c) is larger than that in the dendritic core (d).
Crystals 13 00610 g002
Figure 3. SEM images of Ni-based SX superalloys after solution and aging treatments: (a) 3Ta6.4Al1Ti; (b) 0Ta6.4Al2Ti; (c) 3Ta6Al1Ti; (d) 0Ta6Al2Ti. Four SX superalloys all have typical γ/γ′ two-phase microstructure.
Crystals 13 00610 g003
Figure 4. Tensile properties of Ni-based SX superalloys at a temperature range from RT to 1050 °C. (a) Stress-strain curves of Ni-based SX superalloy (3Ta6.4Al1Ti). (b) YS, (c) UTS, and (d) EF of four experimental alloys. For comparison, YS, UTS, and EF of two second-generation commercial alloys, CMSX-4 [32] and Rene′ N5 [33], are also included in (bd).
Crystals 13 00610 g004
Figure 5. Fracture analysis after the tensile tests at RT. (a) Fracture surface of the sample showing the cleavage step (white arrow) and ductile dimples (blue rectangle). The loading direction is out of the plane. (b) Side view of the fractured sample. (c) Magnified image of the white rectangle in (b). The red arrows in (c) indicate the shear traces near the fracture surface. The tensile direction in (b,c) is vertical.
Crystals 13 00610 g005
Figure 6. Fracture analysis after the tensile tests at 850 °C. (a) Fracture surface of the sample showing the cleavage step (white arrow) and ductile dimples (blue rectangle). The loading direction is out of plane. (b) Side view of the fractured sample showing the microvoids (green rectangle) in the interdendritic region. (c) Magnified image of the white rectangle in (b). The red arrows in (c) indicate shear traces near the fracture surface. The tensile direction in (b,c) is vertical.
Crystals 13 00610 g006
Figure 7. Fracture analysis after the tensile tests at 1050 °C. (a) Fracture surface of the sample showing the cleavage step (white arrow). The loading direction is out of the plane. (b) Side view of the fractured sample showing the microvoids (green rectangle) in the interdendritic region. (c) Magnified image of the white rectangle in (b), showing rafting microstructures. The tensile direction in (b) and (c) is vertical.
Crystals 13 00610 g007
Figure 8. Microstructure evolution of 0Ta6Al2Ti, 3Ta6Al1Ti, Ta6.4Al2Ti, and 3Ta6.4Al1Ti alloys after thermal exposure at 1050 °C for up to 500 h. The microscopic observations identify no TCP phase formation at different exposure times in all alloys.
Crystals 13 00610 g008
Figure 9. TEM-EDS maps showing the elemental distribution in γ and γ′ phases of the 3Ta6.4Al1Ti alloy.
Crystals 13 00610 g009
Table 1. The nominal and measured compositions (wt.%) of Ni-based SX superalloys. The measured compositions are listed in parentheses. The alloys are named by the concentration of Ta, Al, and Ti. For example, if the alloy contains 3 wt.% Ta, 6.4 wt.% Al, and 1 wt.% Ti, the alloy is called 3Ta6.4Al1Ti alloy for convenience.
AlloysCrCoMoTaReAlTiNi
3Ta6.4Al1Ti5 (4.9)15 (15.1)6 (5.8)3 (3.1)3 (2.2)6.4 (6.4)1 (1.1)Bal.
0Ta6.4Al2Ti5 (4.9)15 (15.2)6 (6.0)-3 (2.4)6.4 (6.5)2 (2.0)Bal.
3Ta6Al1Ti5 (4.9)15 (14.9)6 (6.0)3 (3.1)3 (2.3)6 (6.1)1 (1.1)Bal.
0Ta6Al2Ti5 (5.0)15 (15.1)6 (6.1)-3 (2.4)6 (6.0)2 (2.0)Bal.
Table 2. Two-phase compositions (at.%) of four SX superalloys after the solid solution and two-step aging treatments and their lattice misfit at 1050 °C.
Alloy CrCoMoTaReAlTiNiLattice Misfit (%)
at 1050 °C
3Ta6.4Al1Tiγ14.626.45.40.33.24.50.245.4−0.37
γ′2.310.32.71.80.216.01.665.2
0Ta6.4Al2Tiγ14.326.64.9-3.03.30.447.5−0.3
γ′3.211.22.9-0.412.63.066.8
3Ta6Al1Tiγ13.525.25.20.33.44.70.247.5−0.27
γ′2.19.72.62.20.216.11.866.2
0Ta6Al2Tiγ13.325.34.8-2.94.00.549.2−0.26
γ′2.49.82.6-0.315.13.666.3
Disclaimer/Publisher’s Note: The statements, opinions and data contained in all publications are solely those of the individual author(s) and contributor(s) and not of MDPI and/or the editor(s). MDPI and/or the editor(s) disclaim responsibility for any injury to people or property resulting from any ideas, methods, instructions or products referred to in the content.

