Article

Enhanced Photodegradation of Rhodamine B Using Visible-Light Sensitive N-TiO2/rGO Composite

1
Department of Chemistry, Faculty of Mathematics and Natural Sciences, Universitas Islam Indonesia, Yogyakarta 55584, Indonesia
2
School of Chemical Engineering and Advanced Materials, University of Adelaide, Adelaide, SA 5005, Australia
*
Author to whom correspondence should be addressed.
Crystals 2023, 13(4), 588; https://doi.org/10.3390/cryst13040588
Submission received: 28 February 2023 / Revised: 25 March 2023 / Accepted: 27 March 2023 / Published: 30 March 2023

Abstract

:
Rhodamine B (RhB) is extensively used for dyeing purposes, and cannot be completely removed using traditional water treatment technologies. Here, we report for the first time the photodegradation of RhB using nitrogen-doped titanium dioxide (N-TiO2) on reduced graphene oxide (rGO) composite (N-TiO2/rGO). The work primarily highlights the synergistic effect of the incorporation of N-TiO2 and rGO and its kinetic study for the photodegradation of RhB. The N-TiO2/rGO composite was synthesized by dispersing titanium(IV) isopropoxide and urea, followed by annealing treatment via the hydrothermal method with rGO. Scanning electron microscopy (SEM) images illustrated that N-TiO2 particles with an irregular round shape and white color were dispersed onto the rGO surface. X-Ray diffraction (XRD) patterns revealed that N-TiO2/rGO composite showed an anatase phase of TiO2 with a diffraction peak of 2θ = 25.622°. The gas sorption analysis (GSA) showed that N-TiO2/rGO had surface area, pore volume, and pore size of 53.393 m2/g, 0.096 cc/g, and 3.588 nm, respectively. The thermogravimetric-differential thermal analysis (TG-DTA) showed an anatase phase of TiO2 that appeared at a temperature of 200–500 °C, with a weight loss of 2.50%. According to the ultraviolet-visible diffuse reflectance spectroscopy (UV-Vis DRS) study, TiO2, N-TiO2, and N-TiO2/rGO had band gap energies of 3.25, 2.95, and 2.86 eV, respectively. The highest photodegradation of RhB was obtained at the optimum condition in pH 2 with a photocatalyst mass of 20 mg and an irradiation time of 90 min. The photocatalytic activity of N-TiO2/rGO using visible light showed a higher percentage of photodegradation at 78.29%, compared to 44.08% under UV light. The kinetic study of the photodegradation of RhB using N-TiO2/rGO followed the pseudo-second-order model.

1. Introduction

A significant environmental problem is the pollution caused by harmful organic dyes used in the textile industries; these industries are growing as a result of consumer demand, and fashion trends are continuously shifting over time. The textile industry does not produce significant amounts of solid waste, though liquid waste in the form of dyes is produced in large volumes; these dyes contaminate the waterways (rivers and sewers [1,2,3]). Depending upon the industrial application, dyes can be classified into various classes, including simple dyes, acidic dyes, vat dyes, disperse dyes, basic dyes, azo dyes, reactive dyes, and solvent dyes [4].
RhB is one of the most widely used cationic xanthene dyes in the textiles and foodstuffs; it also plays a crucial role in the dyeing process in the paint, leather, and paper industries. RhB exposure, however, has several negative impacts on humans. RhB can cause skin, eye, and gastrointestinal irritation, as well as liver cancer when it is directly exposed or consumed. As a result of the impact of a significant amount of organic waste, particularly textile dyes, researchers are concentrating on how to deal with the environmental liquid waste generated by the textile sector. As a wastewater treatment technology, organic, chemical, and physical, as well as merging the three processes, have all been employed [5,6,7].
A variety of conventional techniques, most notably electrodialysis, membrane filtration, precipitation, adsorption, electrochemical reduction, and electro-deionization, were frequently used in the past to remove contaminants from wastewater. However, these procedures use a significant amount of energy and may be made more challenging by the transfer of contaminants across different fluids, distinct wastes, and by-products produced during the treatment of wastewater. Photocatalysis, a simple and green technology process using mild conditions, is the preferred process due to its effectiveness at degrading organic pollutants contained in wastewater into carbon dioxide, water, or other small molecules, and reducing or oxidizing inorganic pollutants into harmless substances [8,9].
TiO2 is frequently employed for the photodegradation of many organic contaminants, including heavy metals, pesticides, dyes, and phenols for water purification [10,11]. Several modifications of TiO2, performed by combining TiO2 with metals, non-metals, or semiconductors, were conducted to produce TiO2 with high photocatalytic activity. The modification of TiO2 with carbon materials is one of the most promising researched techniques for the preparation of highly active photocatalysts since the electron-hole pairs recombination is inhibited, thus enhancing the performance of photocatalysts under the visible light. Carbon materials represent an intriguing class of carbon precursors that can be employed in TiO2 modification due to their distinctive porous structure, electrical characteristics, and substantial adsorptive capacity. Heterogeneous catalysis extensively uses conventional carbon materials, including graphene-based materials. Numerous preparation methods for TiO2/rGO photocatalysts have been published in the literature, including simple mixing, sol-gel, and hydrothermal or solvothermal [12,13,14,15,16,17,18].
Non-metal doping is another approach used to increase the photocatalytic activity of TiO2. Non-metal dopant has advantages when compared to metal dopant; the resulting catalyst is more affordable, has higher photostability, and emits less pollutants [19,20]. Doping TiO2 with N atoms modifies the electronic structure, where N 2p energy level is generated close to the valence band, leading to a decrease in the band gap of TiO2. As a result, the light absorption of the semiconductor is extended to visible light. Moreover, N atoms can form metastable centers and suppress the recombination of charge carriers in N-TiO2 due to their precise balance, small ionization energy, and an atomic radius similar to O atoms. However, electron-hole pairs photogenerated with N-TiO2 under visible light have a limited time to inhibit recombination [21,22]. This limitation can be overcome by supporting N-TiO2 on carbon materials such as reduced graphene oxide (rGO). rGO provides increased excitability formation and a reduced recombination rate [23]. Thus, the photocatalytic performance of the overall reaction also be increased due to the presence of a synergistic effect. Therefore, a composite of N-TiO2/rGO may exhibit efficient and sustainable photocatalytic material under visible light.
To the best of our knowledge, however, there has never been a work that discusses the use of N-TiO2/rGO as a photocatalyst for the degradation of RhB. In this present study, we hypothesize that N-TiO2/rGO can produce significantly reactive oxygen species so that the degradation efficiency of RhB dyestuffs can be advanced. The photocatalytic performance and kinetics of N-TiO2/rGO under optimal conditions were systematically investigated. RhB is often considered as one of the main dye pollutants in textile industry waste, which is difficult to degrade by conventional treatment. Thus, RhB was used as a model pollutant in evaluating the photocatalytic performance.

2. Materials and Methods

2.1. Materials

Graphite powder, potassium permanganate (KMnO4 99%), hydrogen peroxide (H2O2 80%), sulfuric acid (H2SO4 97%), hydrazine (N2H4 60%), sodium nitrate (NaNO3 99%), nitric acid (HNO3 99%), titanium(IV) isopropoxide (Ti[OCH(CH3)2]4 98%), urea (CH₄N₂O 99%), hydrochloric acid (HCl 37%), n-propanol (C3H7OH 99%), and ethanol (C2H5OH 99%) were obtained from Merck.

2.2. Material Synthesis

2.2.1. Synthesis of rGO

A total of 1 g of graphite was oxidized with 0.5 g of NaNO3, 3 g of KMnO4, and 23 mL of H2SO4 at a temperature below 20 °C. Then, the mixture was stirred at 40 °C for 3 h. A total of 50 mL of distilled water was slowly added and stirred at 50 °C for 1 h, followed by the addition of 50 mL distilled water and 5 mL H2O2. Next, the solution was filtered and washed with HCl, and rinsed until pH was neutral. The precipitate obtained was dried at 80 °C for 4 h to obtain graphite oxide (GO) [24]. Then, 1.2 g of solid GO in 400 mL H2O was sonicated for 3 h, then combined with 0.4 mL of N2H4 as a reducing agent and stirred for 3 h at 70 °C. The precipitate was filtered and dried at 90 °C for 1 h to obtain rGO.

2.2.2. Synthesis of N-TiO2

A solution of C3H7OH and Ti[OCH(CH3)2]4 with a ratio of 95:5 v/v was diluted with HNO3 until it reached pH 2. The mixture was stirred for 12 h at room temperature. Then, 100 mL of CH₄N₂O 1 M solution was added and underwent sonification for 2 h. The solution was filtered and dried at 100 °C for 5 h and calcined at 450 °C for 3 h to obtain N-TiO2 [25]. Then, 40 mg of rGO was dissolved with 80 mL of aqueous and 40 mL of C2H5OH and sonicated for 30 min.

2.2.3. Synthesis of N-TiO2-rGO

A total of 400 mg of N-TiO2 was added to the solution and stirred for 2 h. The solution was then transferred to an autoclave and heated in the oven at 120 °C for 3 h. The solution was transferred into a beaker glass and stirred under UV light (T5 UV light 8 W) for 2 h. Then, the solution was filtered and rinsed with distilled water. The precipitate was dried at 70 °C for 12 h to obtain N-TiO2/rGO. Stages of the synthesis method of N-TiO2/rGO are schematically shown in Figure 1.

2.3. Material Characterization

The crystalline phase of the material was determined using an XRD (Shimadzu XRD-7000, Japan), the surface morphology and element content of the material were analyzed using a SEM-EDX (Hitachi S-4800, Japan), and the textural properties of the material were determined using a GSA (Quantachrome Novatouch LX-4, Austria). To detect variations in material weight as a function of temperature or time, a TG-DTA (Hitachi STA-200RV, Japan) was employed. To find the band gap energy of the material, a UV-Vis DRS (Shimadzu UV-2401 PC, Japan) was used.

2.4. Study of Photocatalytic Activity

The determination of the optimum pH was carried out at various pH solutions of 2, 3, 4, 5, 6, 7, 8, 9, and 10 with the addition of 20 mg N-TiO2/rGO photocatalyst in 10 ppm RhB solution for 60 min under UV light. Determination of the optimum photocatalyst mass used variations of 10, 20, and 30 mg at the optimum pH with an irradiation time of 60 min under UV light (T5 UV light 8 Watt). The results of the optimum pH and photocatalyst mass were used for variations in irradiation time of 0, 30, 60, 90, and 120 min. A UV-Vis spectrophotometer was then used to analyze the filtrate at the optimum wavelength of 554 nm [26].

3. Results and Discussion

3.1. SEM-EDX Characterization

Figure 2 depicts the SEM images of different morphology of materials. Graphite shows large flakes and an irregular surface structure. After being oxidized, the graphite turned into GO with a more regular surface due to the agglomeration of the graphite sheets so that it became thicker. Thus, the GO had wrinkles at the edges of the material; this was caused by the presence of angle tension between the carbon atom bonds so that wrinkles were formed by stabilization of the atomic arrangement [27]. Furthermore, the morphology of the rGO material became completely irregular due to thermal reduction; this resulted in smaller particles and thinner sheet exfoliation when compared to GO by chemical exfoliation [28]. N-TiO2 had white granules with an uneven spherical form, and small round particles were sticking to the surface. After the modification, N-TiO2/rGO had a more regular shape when compared to N-TiO2; small white particles of N-TiO2 were dispersed onto the rGO surface [29].
The presence of elemental composition of material can be ascertained by conducting EDX. Table 1 lists the C element of graphite with a percentage of 100 wt%; GO materials were observed for the appearance of O, indicating that graphite was successfully oxidized. The decrease in the mass percentage of the O element in rGO was caused by the reduction process of groups containing oxides. N-TiO2 contained N element with a percentage of 1.85 wt%, so it could be seen that the N dopant was successfully doped on the TiO2 material. The lower percentage of Ti element in N-TiO2/rGO indicates that some TiO2 enter the interlayers of rGO.

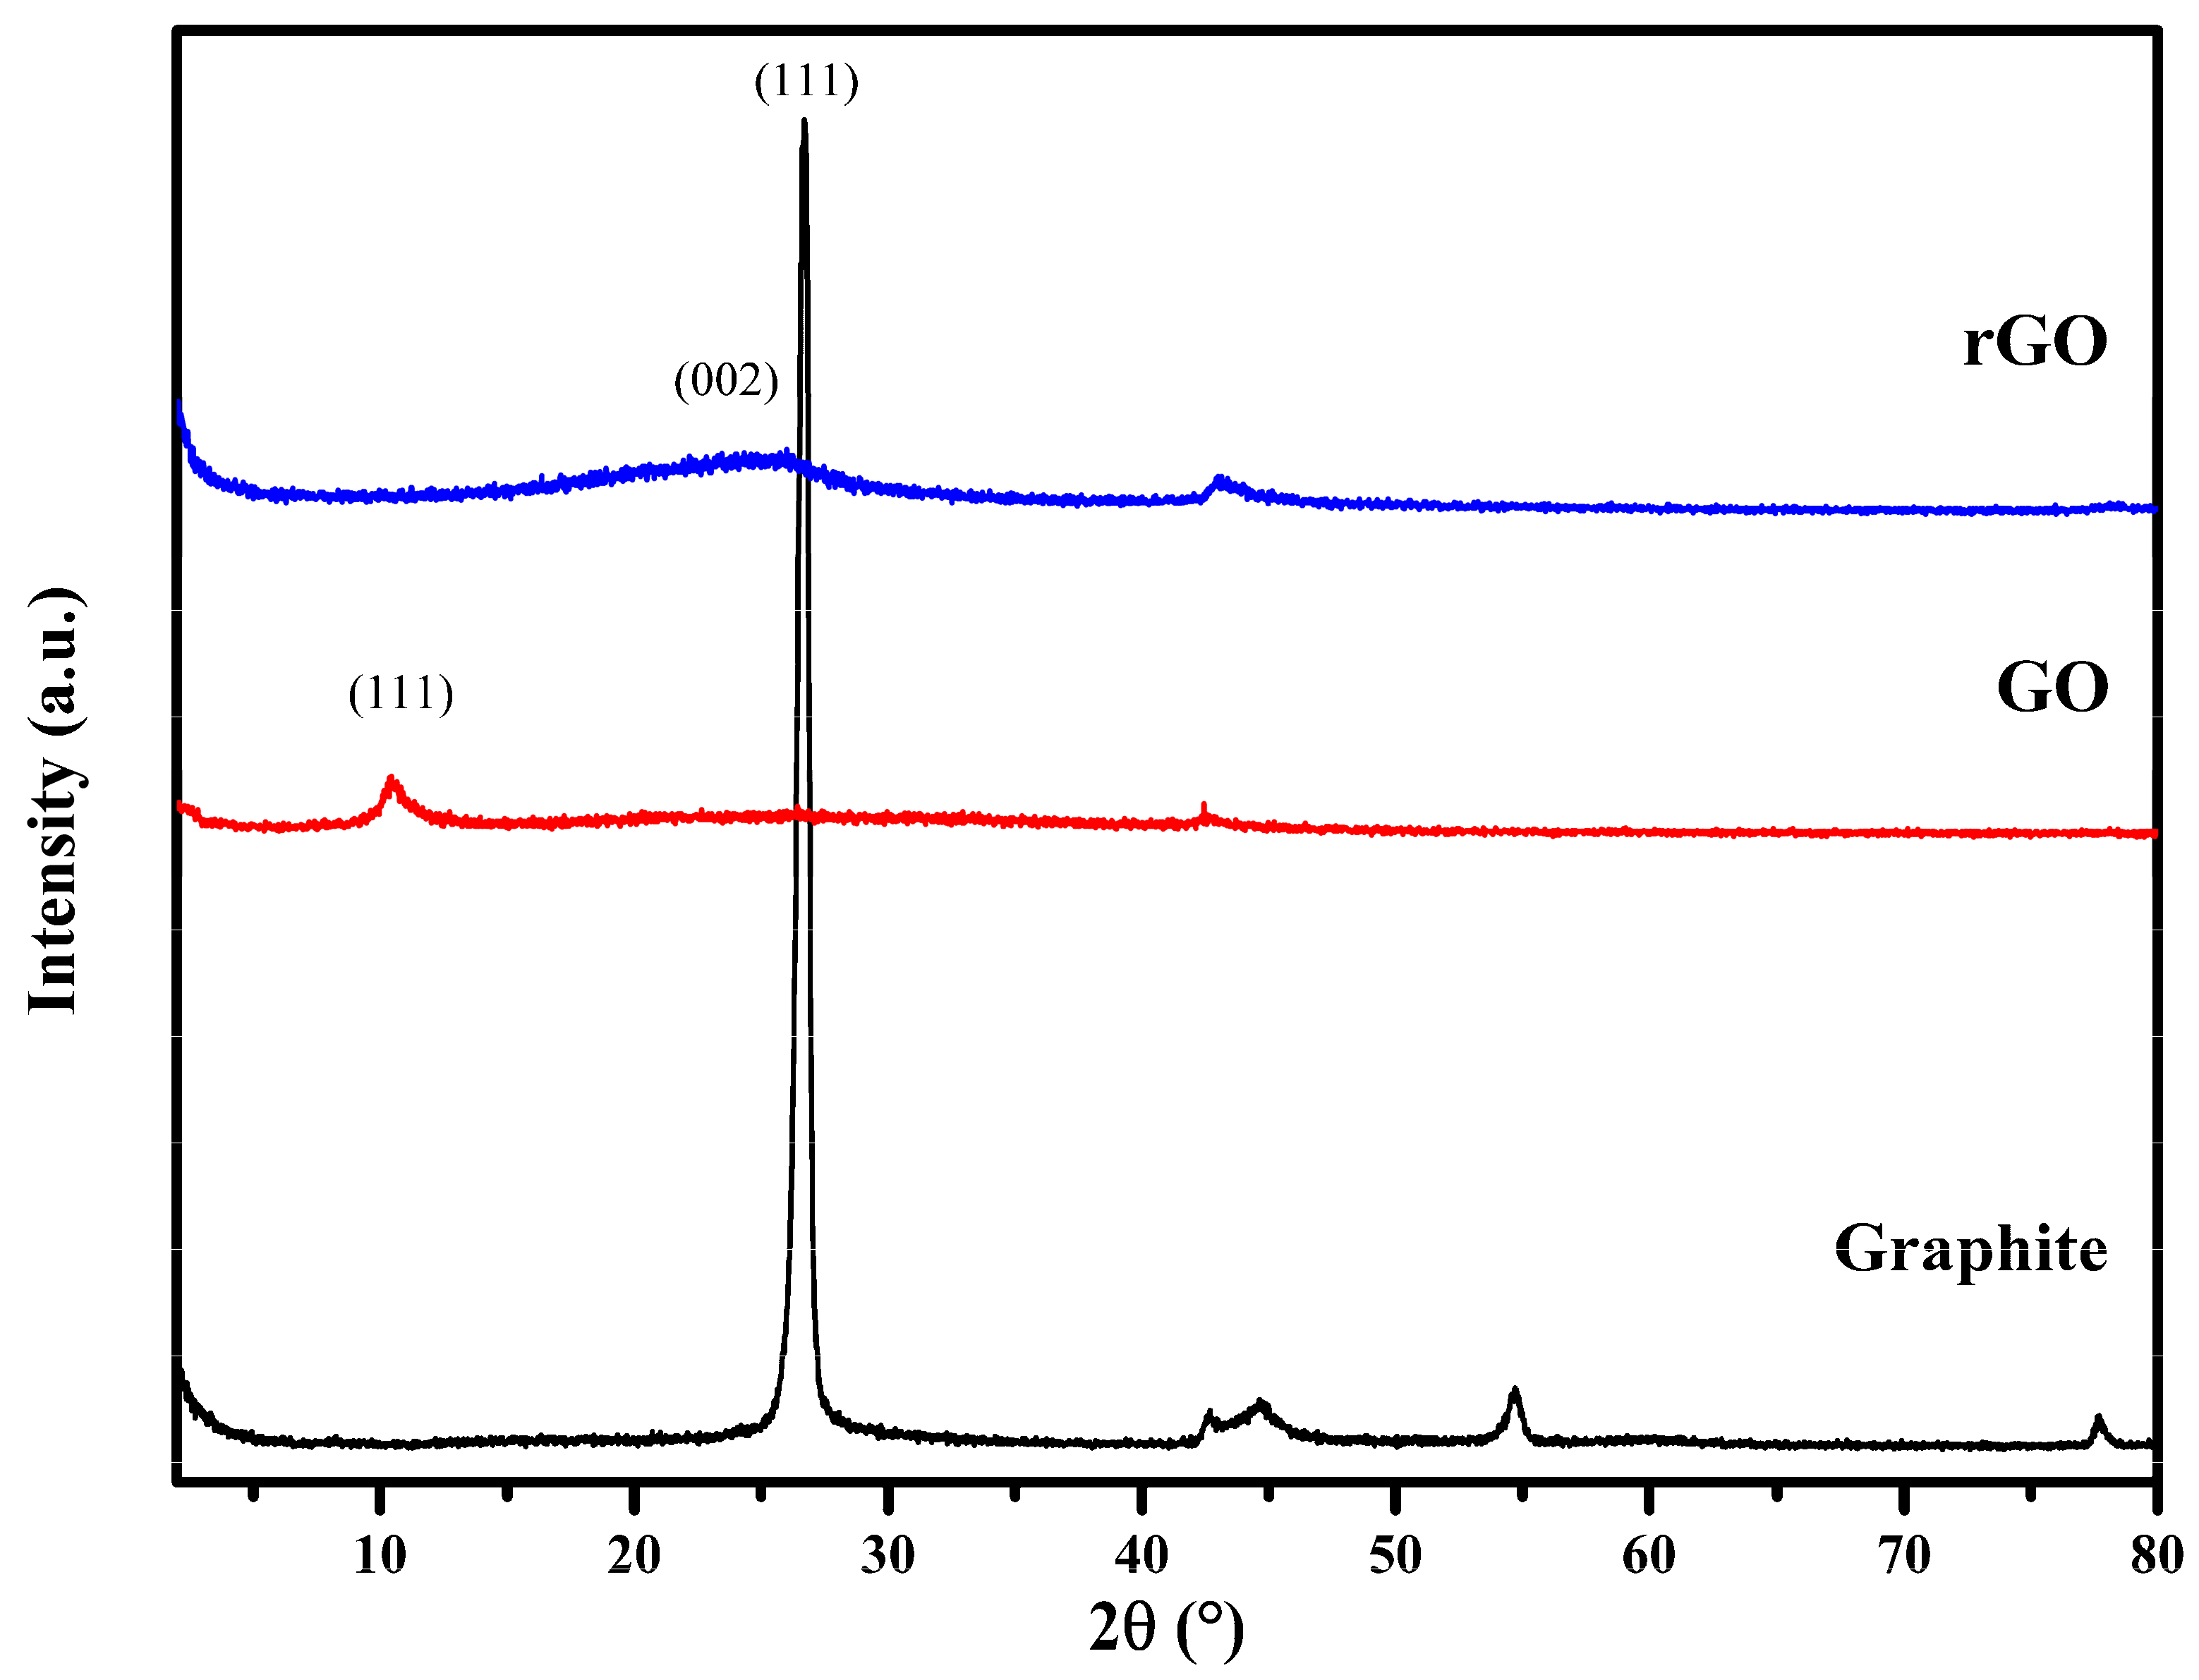
3.2. XRD Characterization

The diffractogram patterns of material recorded at diffraction angle range 2θ = 2–80° and Cu Kα radiation (λ = 1.5406 Å) are shown in Figure 3 and Figure 4, respectively. The diffractogram pattern of pure graphite material shows characteristic sharp peaks with high intensity at 2θ = 26.669° (111), with a distance between layers of 0.334 nm, according to Joint Committee on Powder Diffraction Standards (JCPDS) data No. 01-075-2078.
GO material show the low intensity of the reflection peak at 2θ = 10.651° (111), with a spacing between layers of 0.339 nm, and a small peak at 2θ = 26.274° (111), with a spacing between layers of 0.339 nm, according to JCPDS data No. 01-082-2261. The crystallinity of the material decreases as the peak intensity decreases. The intercalation of oxide groups, consisting of carbonyl, epoxy, carboxyl, and hydroxyl groups at the basic plane of graphite, was produced by an oxidation process that increased the space between the layers. In addition, these groups also contributed to hydrophilicity of atomic layers [30].
The diffractogram pattern of the rGO material shows a low intensity broad peak at 2θ = 26.024° (002), with a distance between layers of 0.342 nm. Functional groups containing oxygen were removed efficiently as shown by the reduced peak intensity at 2θ = 10.651° (111) and the reduced distance between the rGO layers. The wide peaks of the rGO material are due to its amorphous nature.
The diffractogram pattern of the N-TiO2 material shows sharp peaks at 2θ = 25.582°, 38.262°, 48.266°, 54.214°, 55.154°, 62.531°, and 75.438°; meanwhile, the N-TiO2/rGO material shows peaks at 2θ = 25.622°, 26.364°, 38.187°, 48.306°, 54.344°, 55.144°, 62.7014°, and 75.288°. The diffractograms of the TiO2-based materials had peaks corresponding to plane reflections (101), (112), (200), (105), (211), (213), and (215). These peaks were ascribed to the anatase phase of TiO2 in accordance with JCPDS data No. 00-021-1272. The structure and phase of TiO2 did not change in the presence of rGO in the composite. No typical diffraction peak of rGO was found in N-TiO2/rGO; this was due to the low rGO ratio in the synthesis process and the possibility of a new peak being covered by the TiO2 diffraction peak at 25.622° (111) [31].
The Debye–Scherrer equation shown in Equation (1) can be used to calculate the size of a crystal shown in Equation (1), where D indicates the size of crystal, λ indicates wavelength of X-ray (1.5406 Å), β denotes Full Width at Half Maximum (FWHM), K represents Scherrer constant (0.9), and θ indicates Bragg diffraction angle [32]. Table 2 presents crystal size data. The average crystal size of graphite, GO, rGO, N-TiO2, and N-TiO2/rGO were 15.801, 7.208, 6.438, 13.215, and 12.818 nm, respectively.
D = K λ / β cos   θ
The crystal size of graphite decreased after the oxidation and reduction processes. The incorporation of N-TiO2 and rGO caused a decrease in crystal size from 13.215 nm to 12.818 nm. The modification of rGO suppressed the phase transition and exhibited the sintering of TiO2 crystallites. A smaller crystal size indicated better photocatalytic activity due to its stronger redox ability [12,33]. In general, crystal size influences photocatalytic performance, but it should be noted that photocatalytic activity is not only affected by crystal size. Other factors that can affect photocatalytic performance are crystallinity, surface area, pore size, energy band gap, electronic material properties, and so on. Although rGO has the smallest size, it is amorphous; this means that its potential for photocatalytic activity is lower [34]. N-TiO2/rGO has good photocatalytic performance due to its small size and crystalline nature.

3.3. GSA Characterization

Table 3 shows the textural characteristic of materials. Graphite, GO, rGO, N-TiO2, and N-TiO2/rGO had pore sizes of 7.144, 5.225, 2.469, 3.602, and 3.588 nm, respectively. All materials exhibited as mesoporous material in the range of 2–50 nm. The surface area of rGO reduced when GO was transformed into rGO. The sonification-based exfoliation of GO into reduced graphene oxide was one of the reasons contributing to this decrease. The most efficient method for almost completely exfoliating GO was discovered to be sonication, although it severely damaged the graphene sheet, causing a change in surface size from micron to nano [35].
In comparison to N-TiO2, N-TiO2/rGO composite has less surface area and porosity. A lower pore volume was generated due to a decrease caused by the significant accumulation of N-TiO2 particles on the rGO surface; consequently, the surface area was reduced. When the particle size was reduced, the surface area to pore volume ratio increased, which was a sign that the ratio of surface area to pore volume was becoming increasingly relevant. The decrease in surface area and pore volume in N-TiO2/rGO was caused by N-TiO2 occupying the surface of rGO [36].

3.4. TG-DTA Characterization

Figure 5 shows the results of TG-DTA characterization to measure weight loss from materials as a function of temperature or time. The TG-DTA analysis shows that graphite did not exhibit any decomposition or change in mass. In the GO, there was a weight loss of 17.50% at a temperature of less than 180 °C, which indicates the evaporation of free water in the graphite material. The second stage of decomposition was possibly the partial release of large amounts of oxygen-containing functional groups, shown to occur with a weight loss of 74.30% in the range of 100–200 °C. GO material showed good thermal stability at temperatures above 200 °C. In the rGO, there was a weight loss of 5.92% at a temperature of 100 °C which indicates the presence of water evaporation; further weight loss occurred at a temperature of 100–200 °C with a weight loss of 6.79%. A temperature above 200 °C indicates good thermal stability in the rGO.
Figure 5 demonstrates the three steps of weight reduction in N-TiO2 as the temperature increases. First, at a temperature of 100 °C, caused by the loss of residual water and ethanol by 2.94%. Second, at a temperature of 100–200 °C, a weight loss of 1.06% was due to the decomposition of organic matter. Third, at a temperature of 200–450 °C, caused by the formation of an anatase crystalline phase of an amorphous form of TiO2, with a weight reduction of 0.39%. The N-TiO2/rGO material shows a weight loss of 2.25% at a temperature 200 °C due to a loss of water and solvent residue. At a temperature of 200–500 °C, a second stage of decomposition occurred, indicating a decrease in weight by 2.50%. The last stage of decomposition, at a temperature of 780–900 °C with a weight loss of 0.60%, was due to the change of the anatase phase of TiO2 into the rutile phase.

3.5. UV-Vis DRS Characterization

The purpose of UV-Vis DRS characterization is to ascertain the band gap energy of material. The Kubelka–Munk function F(R) equation and the Tauc plot can be used to calculate the band gap energy of photocatalyst as shown in Equation (2), where n is a constant for the optical transition type and has a value of 2 for indirect transitions [37].
(F(R) × hv) 1/n = C (hvEg)
Figure 6 shows that the band gap energy of TiO2 can be reduced by the addition of N dopant, from 3.25 to 2.95 eV, while the incorporation of rGO and N-TiO2 can also reduce the band gap energy to 2.86 eV. It indicates that the modification of TiO2 using N and rGO can successfully reduce the band gap energy of TiO2, which has a significant impact on the performance of photocatalyst.

3.6. Effect of pH

RhB shows the degradation rate at pH range between 2–10 with the most optimum degradation percentage of 61.87% at pH 2 as presented in Figure 7. RhB is more easily de-graded at acidic pH than at alkaline pH; in aqueous solvent, RhB is a negatively charged dye. The positively charged surface of TiO2 in acidic conditions causes more RhB to be absorbed on the surface of N-TiO2/rGO and reacts with free radicals [38].

3.7. Effect of Photocatalyst Mass

The photodegradation of RhB at various photocatalyst masses of 10, 20, and 30 mg is shown in Figure 8. The use of a photocatalyst mass of 20 mg at optimum pH 2 resulted in the highest degradation percentage (53.66%). It is obvious that the photocatalyst concentration must be optimal. The enhanced photocatalytic activity was obtained when the photocatalyst mass was increased from 10 mg to 20 mg by increasing the active sites on the photocatalyst surface. However, a higher dose of photocatalyst will block the active sites and limit the light to entering the N-TiO2/rGO surface, thus causing a decrease in the formation of several hydroxyl radicals that may take part in the actual degradation.

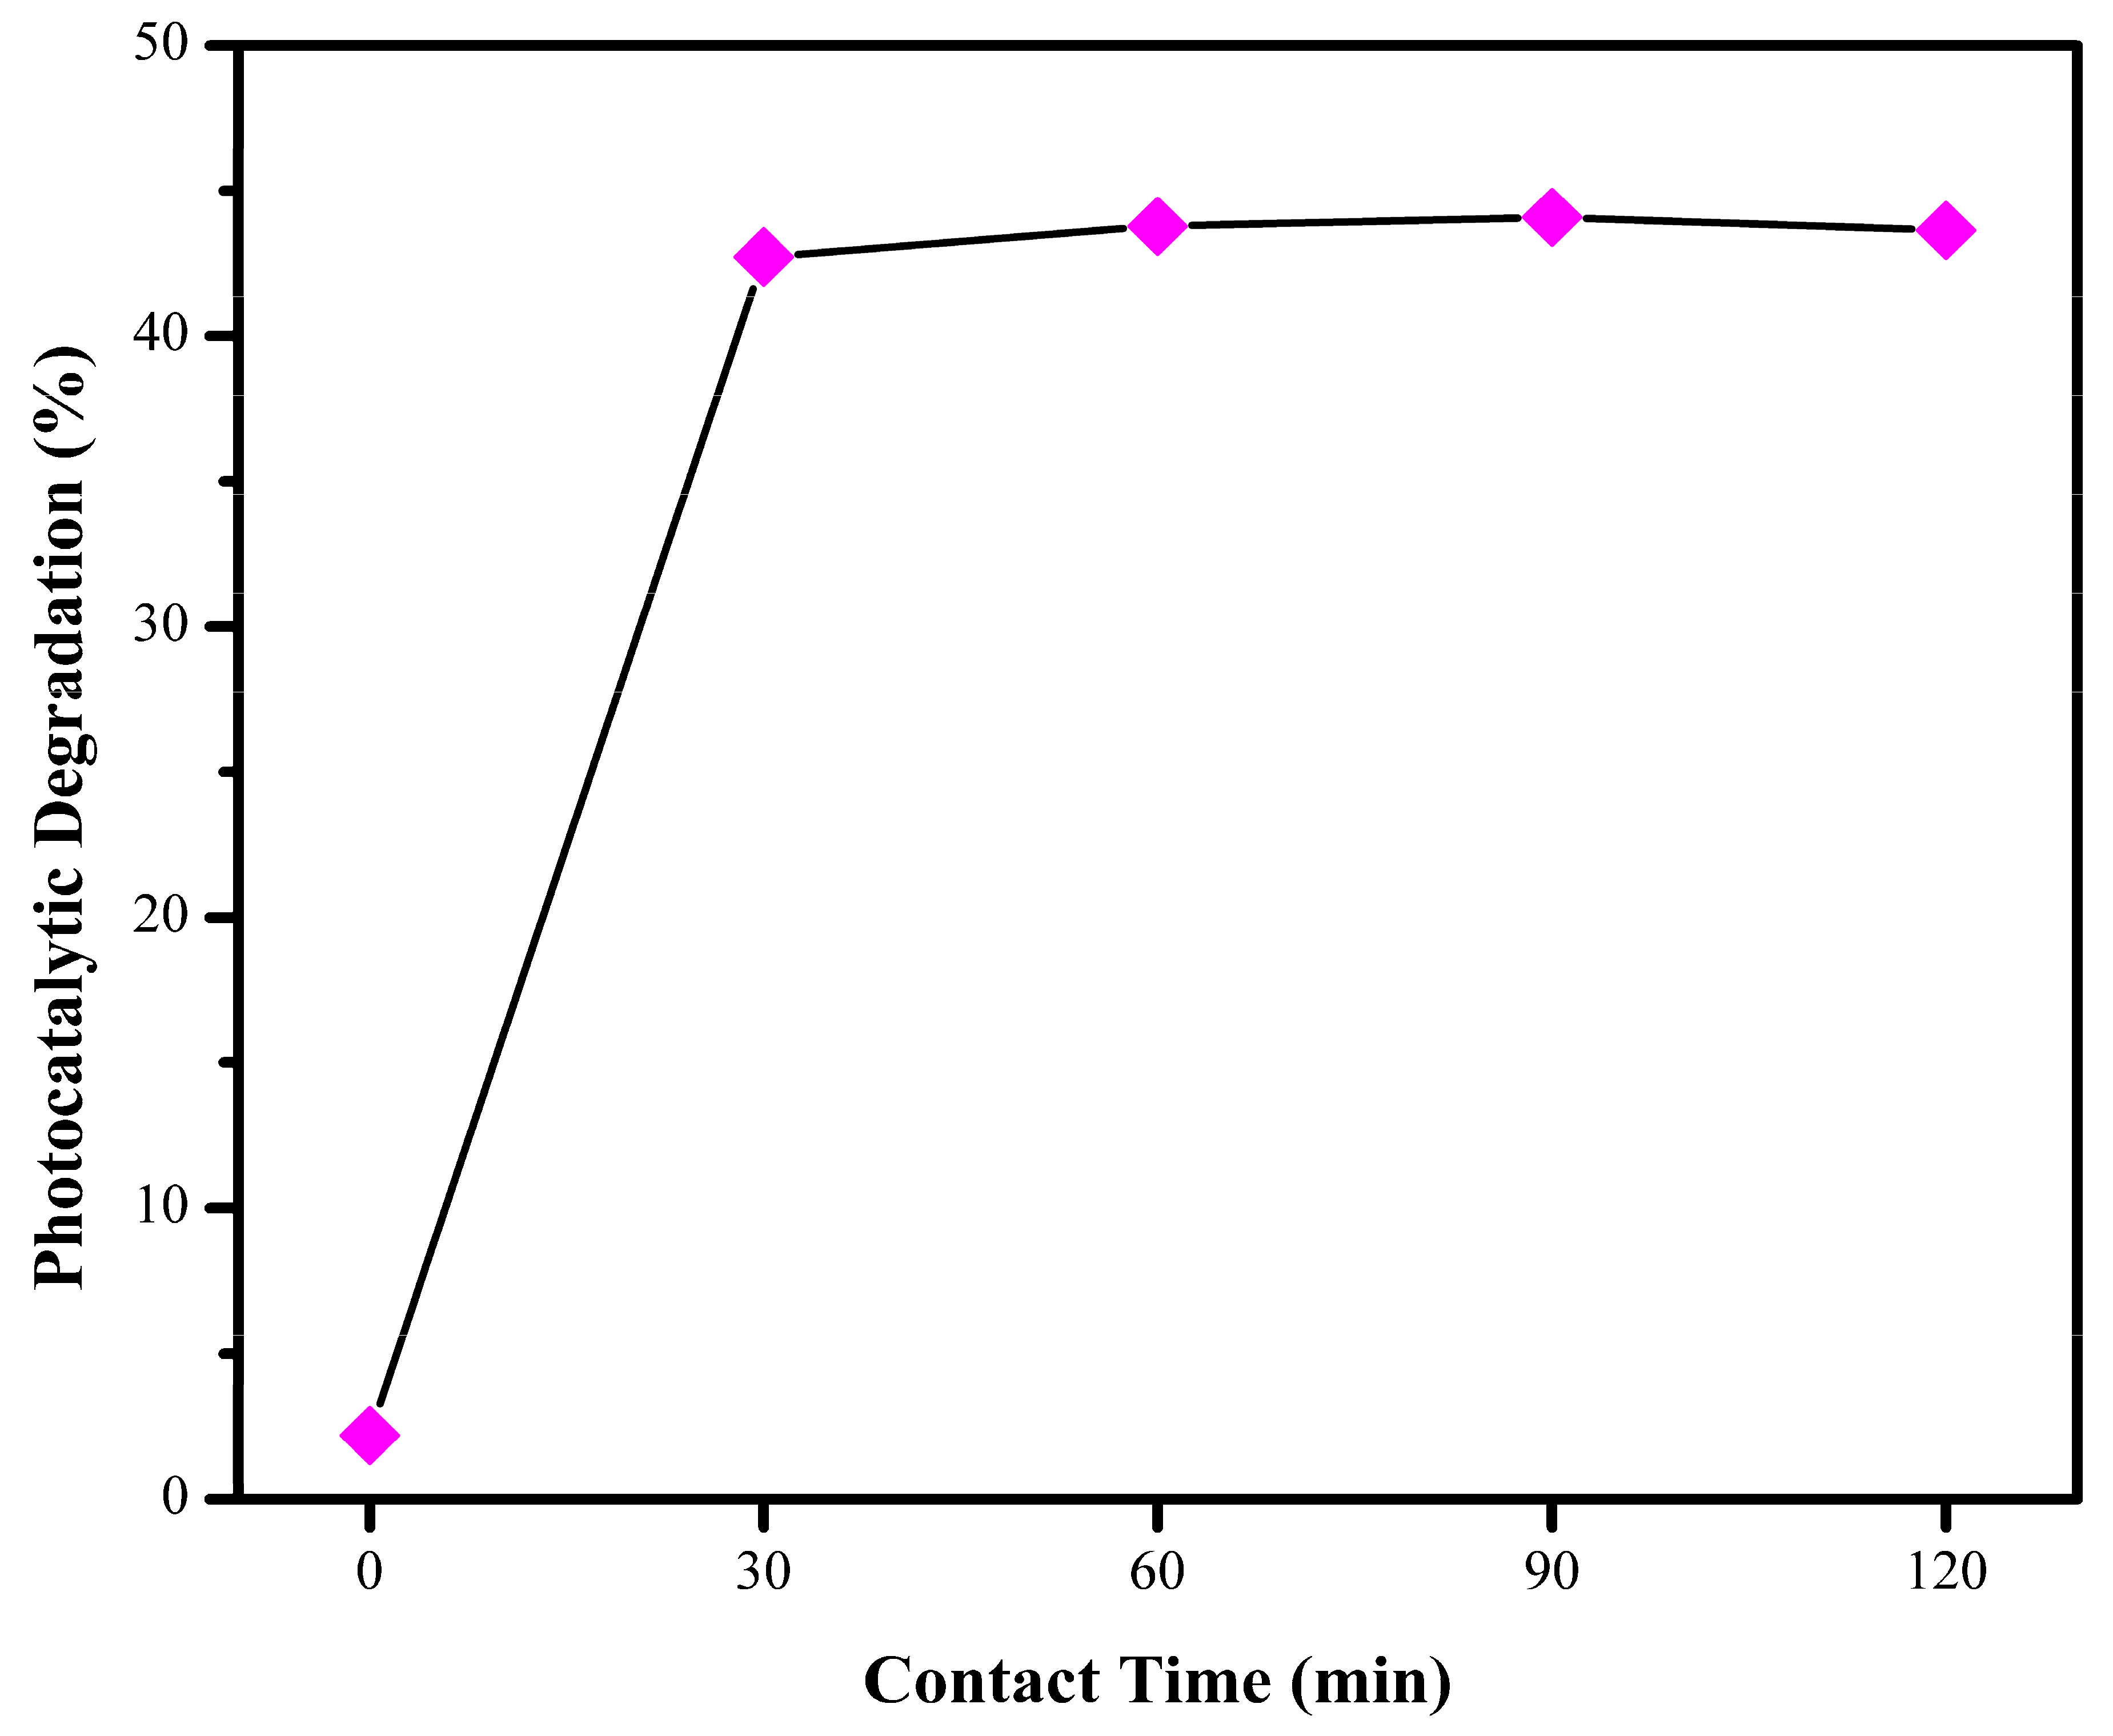
3.8. Effect of Irradiation Time

The photodegradation of RhB at various irradiation times between 0 and 120 min is shown in Figure 9. During the photocatalytic reaction for 90 min, the highest percentage of RhB degradation (44.08%) was obtained at the optimum pH and photocatalyst mass. The irradiation time is an important indicator to determine the interaction between N-TiO2/rGO and light to produce hydroxyl radicals for the photodegradation of RhB [39]. A longer irradiation time increases the photon energy hitting the surface of photocatalyst, causing the generation of more hydroxyl radicals, thus increasing the photocatalytic activity until it reaches optimum condition [40].

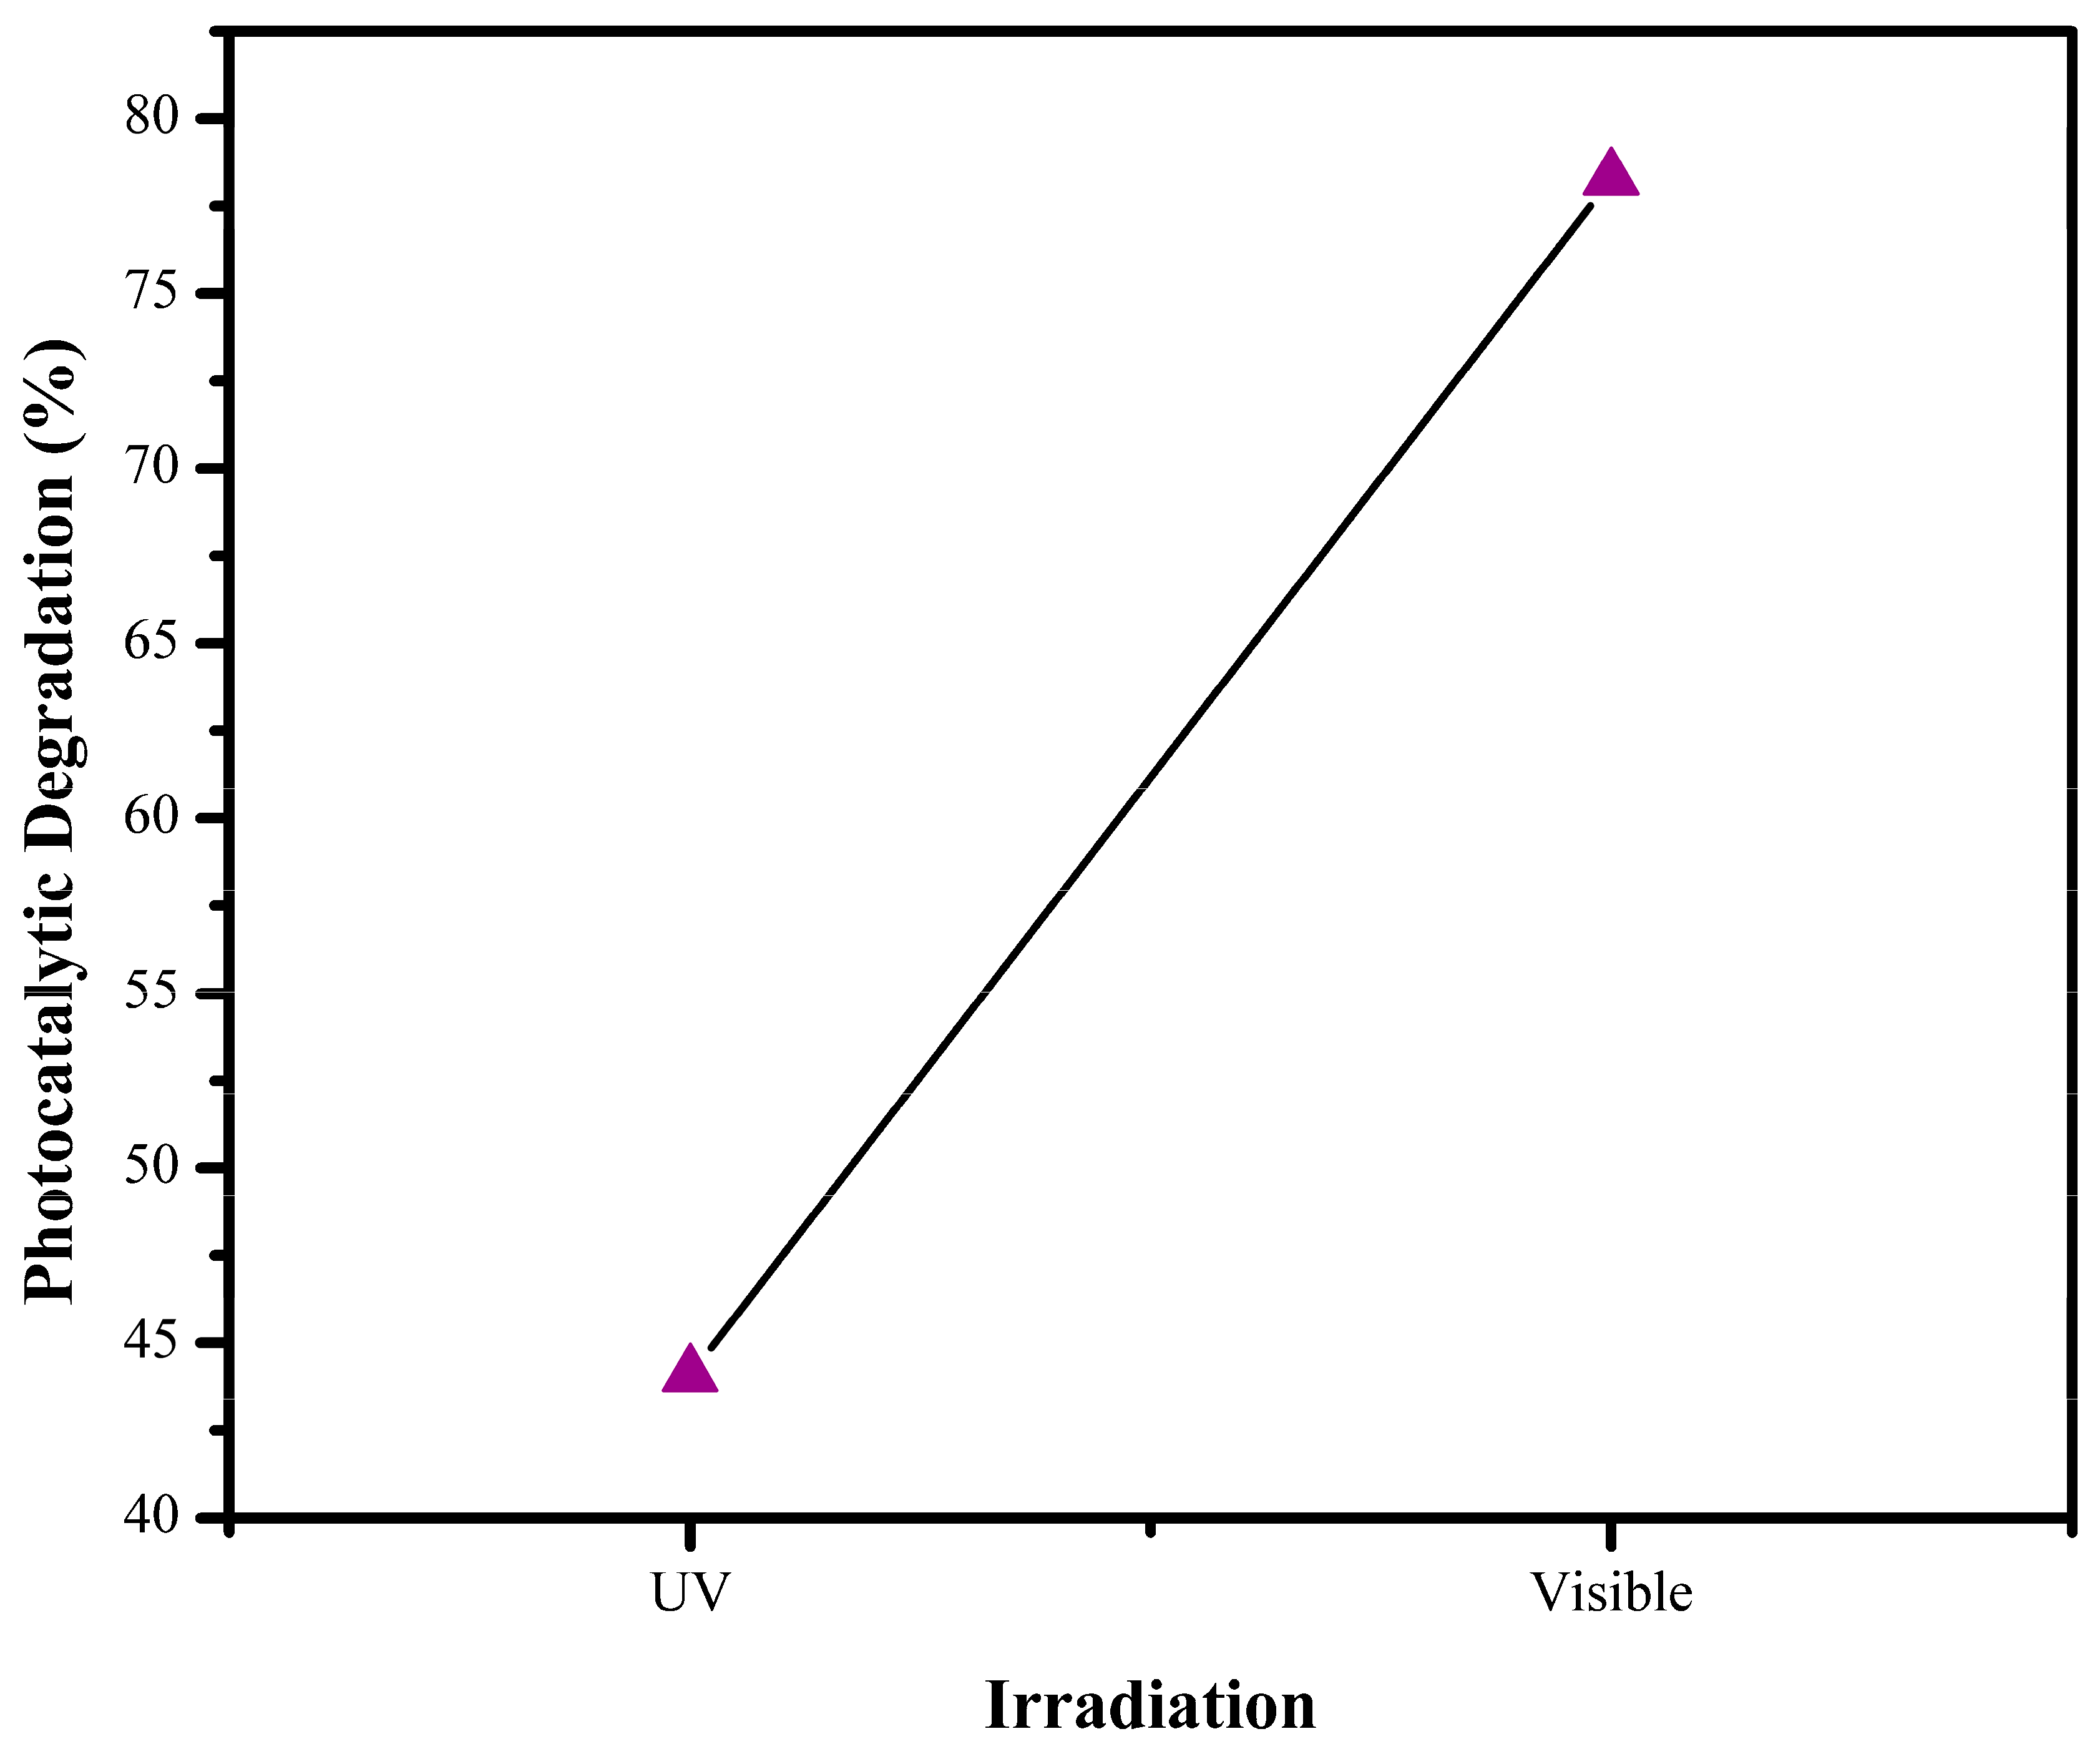
3.9. Effect of Light Irradiation

Figure 10 shows that the photodegradation of RhB using N-TiO2/rGO led to a higher percentage of degradation (78.29%) under visible light, compared to 44.08% under UV light with the same optimum condition (pH of 2, photocatalyst mass of 20 mg, irradiation time of 90 min). It indicates that N-TiO2/rGO can absorb visible light energy more optimally, thus producing more radicals to degrade RhB. The modification of N-TiO2 material with rGO can suppress electron hole recombination during the reaction to increase photodegradation of RhB.
Figure 11 shows the photodegradation mechanism of RhB using N-TiO2/rGO. When N-TiO2/rGO is exposed to light, electrons in the valence band (VB) are transported to the conduction band (CB), thus producing electrons in the CB and holes in the VB. Doping TiO2 with N atoms changes the electronic structure, leading to the formation of new energy gap states. The energy level of N 2p is generated above the O 2p; this causes the band gap of TiO2 to decrease from 3.25 eV to 2.95 eV so that the absorption of light extends to visible light. The CB and VB potentials can be calculated using Equations (3) and (4), where Ee is the free electron energy (4.50 eV), X is the absolute electronegativity, and Eg is the band gap of semiconductor. The X value for TiO2 is 5.81 eV [41,42].
EVB = X − Ee + 0.5 Eg
ECB = EVB − Eg
The VB of N-TiO2 (2.94 eV) shows a lower level than the highest occupied molecular orbital (HOMO) of rGO (1.98 eV), and the CB of N-TiO2 (−0.32 eV) has a lower level than the lowest unoccupied molecular orbital (LUMO) of rGO (−0.6 eV). rGO acts as an electron acceptor to prevent electron-hole recombination, where electrons excited from the VB to the CB will be captured by LUMO of rGO. Under visible light, rGO also acts as a photosensitizer so that electrons excited from the HOMO to the LUMO will be transferred to the CB of N-TiO2 to improve the efficiency of charge separation and photocatalytic activity [43]. The electrons will react with oxygen to generate superoxide radicals, while the holes will react with hydroxyl ions and water to form very reactive hydroxyl radicals. As a result, RhB dyes will react with hydroxyl and superoxide radicals to form CO2 and H2O [44,45,46,47,48,49,50,51,52,53,54,55,56,57]. Photodegradation mechanism of RhB shown in Equations (5)–(10).
N-TiO2/rGO + hv → N-TiO2/rGO (e) + N-TiO2/rGO (h+)
rGO + (e) → rGO (e)
h+ + OH → •OH
h+ + H2O → •OH + H+
e + O2 → •O2
N-TiO2/rGO (•OH or •O2) + RhB → CO2 + H2O
Some synergistic research works for comparison with this study are summarized in Table 4. It is determined that under specific experimental circumstances, the N-TiO2/rGO composite is an excellent photocatalyst for the degradation of RhB because of its low price, high efficiency, and good performance. Under visible light, N-TiO2/rGO has a short irradiation time with a high degradation efficiency when compared to other photocatalysts. Some earlier literature suggests photocatalysts contain metallic charges, such as chromium (Cr), silver (Ag), bismuth (Bi), iron (Fe), and copper (Cu). Apart from the fact that many metals are expensive and toxic, the presence of metals in photocatalysts can result in photo-corrosion during the photocatalytic processes under visible light [58].

3.10. Kinetic Study

The kinetic study of photodegradation of RhB are analyzed using the Lagergren rate equation [59]. Within the pseudo-first-order kinetic model shown in Equation (11), qe1 (mg/g) represents the quantity of degraded RhB according to the unit mass of photocatalysts at equilibrium time and k1 (min−1) represents the Lagergren rate constant. In the pseudo-second-order kinetic model shown in Equation (12), qe2 (mg/g) represents the amounts of RhB degraded at the equilibrium time and k2 (g/mg min) represents the rate constant. In addition, qt represents the amounts of RhB degraded per unit mass of the photocatalyst at time, where t (min) represents contact time.
log ( q e q t ) = log q e kt 2.303   ( Pseudo-first-order     kinetic   equation )
t q t = 1 k q e 2 + t q e   ( Pseudo-second-order   kinetic   equation )
The kinetic study was conducted with 10 mg/L initial concentrations of RhB and 0.02 g amounts of N-TiO2/rGO. The log(qeqt) vs t plot slope is used to calculate the values of qe1 and k1. Table 5 shows the kinetic parameters on the photodegradation of RhB using N-TiO2/rGO. Based on the result, the qe values are not consistent with the experimental data. However, qe2 and k2 values have been calculated from the plots of t/q vs. t. The theoretical qe2 value is in accordance with the experimental data (R2 = 0.9999). It indicates that the photodegradation of RhB using N-TiO2/rGO followed the pseudo-second-order kinetic model.

4. Conclusions

N-TiO2/rGO was successfully synthesized by the hydrothermal method. The characterization data indicated that N-TiO2 was doped and dispersed onto the rGO surface. N-TiO2/rGO was found to be highly crystalline of anatase TiO2. The modification of TiO2 with N and rGO reduced the band gap of the photocatalyst from 3.25 to 2.86 eV. N-TiO2/rGO had surface area, pore volume, and pore size of 53.393 m2/g, 0.096 cc/g, and 3.588 nm, respectively. The anatase phase of TiO2 appeared at 200–500 °C with a weight loss of 2.50%. The photodegradation of RhB using N-TiO2/rGO followed a pseudo-second-order kinetic model with the highest photodegradation percentage of 78.29% under visible light at the optimum condition in pH of 2 with a photocatalyst mass of 20 mg for 90 min.

Author Contributions

Conceptualization, M.U.; methodology, M.U., S.W., S.N.S., T.A.D., M.F.; software, M.U., S.N.S., T.A.D., M.F.; validation, M.U., S.W., F.I.F.; formal analysis, M.U., S.N.S., T.A.D., M.F.; investigation, M.U., S.N.S., T.A.D., M.F.; resources, M.U., S.W., F.I.F., S.N.S., T.A.D., M.F.; data curation, M.U., S.W., F.I.F.; writing—original draft preparation, M.U., S.N.S., T.A.D., M.F.; writing—review and editing, M.U., S.W., F.I.F., S.N.S., T.A.D., M.F.; visualization, M.U., S.N.S., T.A.D., M.F.; supervision, M.U.; project administration, M.U.; funding acquisition, M.U. All authors have read and agreed to the published version of the manuscript.

Funding

The authors would like to acknowledge the financial supports from Directorate of Research and Community Services, Universitas Islam Indonesia for research grant (No. 007/Dir/DPPM/70/Pen.Unggulan/XI/2021) and Ministry of Education, Culture, Research and Technology, and Endowment Funds for Education for publication grant through World Class Professor (WCP) program (No. 3252/E4/DT.04.03/2022).

Data Availability Statement

The datasets used and/or analyzed during the current study are available from the corresponding author upon reasonable request.

Conflicts of Interest

The authors have no conflict of interest.

References

  1. Kumar, P.S.; Saravanan, A. Sustainable wastewater treatments in textile sector. In Sustainable Fibres and Textiles; Muthu, S.S., Ed.; Woodhead Publishing: Cambridge, UK, 2017; pp. 323–346. [Google Scholar] [CrossRef]
  2. Adane, T.; Adugna, A.T.; Alemayehu, E. Textile industry effluent treatment techniques. J. Chem. 2021, 2021, 5314404. [Google Scholar] [CrossRef]
  3. Azanaw, A.; Birlie, B.; Teshome, B.; Jemberie, M. Textile effluent treatment methods and eco-friendly resolution of textile wastewater. Case Stud. Chem. Environ. Eng. 2022, 6, 100230. [Google Scholar] [CrossRef]
  4. Alsantali, R.I.; Raja, Q.A.; Alzahrani, A.Y.A.; Sadiq, A.; Naeem, N.; Mughal, E.U.; Al-Rooqi, M.M.; Guesmi, N.E.; Moussa, Z.; Ahmed, S.A. Miscellaneous azo dyes: A comprehensive review on recent advancements in biological and industrial applications. Dyes Pigments 2022, 199, 110050. [Google Scholar] [CrossRef]
  5. Saigl, Z.M. Various absorbents for removal Rhodamine B dye: A review. Indones. J. Chem. 2021, 21, 1039–1356. [Google Scholar] [CrossRef]
  6. Al-Gheethi, A.A.; Azhar, Q.M.; Kumar, P.S.; Yusuf, A.A.; Al-Buriahi, A.K.; Mohamed, R.M.S.R.; Al-Shaibani, M.M. Sustainable approaches for removing Rhodamine B dye using agricultural waste adsorbents: A review. Chemosphere 2022, 287, 132080. [Google Scholar] [CrossRef] [PubMed]
  7. Nazir, M.A.; Najam, T.; Jabeen, S.; Wattoo, M.A.; Bashir, M.S.; Shah, S.S.A.; Rehman, A. Facile synthesis of Tri-metallic layered double hydroxides (NiZnAl-LDHs): Adsorption of Rhodamine-B and methyl orange from water. Inorg. Chem. Commun. 2022, 145, 110008. [Google Scholar] [CrossRef]
  8. Ren, G.; Han, H.; Wang, Y.; Liu, S.; Zhao, J.; Meng, X.; Li, Z. Recent advances of photocatalytic application in water treatment: A review. Natl. Libr. Med. 2021, 11, 1804. [Google Scholar] [CrossRef]
  9. Sudhaik, A.; Raizada, P.; Rangabhashiyam, S.; Singh, A.; Nguyen, V.H.; Le, Q.V.; Khan, A.A.P.; Hu, C.; Huang, C.W.; Ahamad, T.; et al. Copper sulfides based photocatalysts for degradation of environmental pollution hazards: A review on the recent catalyst design concepts and future perspectives. Surf. Interfaces 2022, 33, 102182. [Google Scholar] [CrossRef]
  10. Chen, X.; Selloni, A. Introduction: Titanium dioxide (TiO2) nanomaterials. Chem. Rev. 2014, 114, 9281–9282. [Google Scholar] [CrossRef]
  11. Li, R.; Li, T.; Zhou, Q. Impact of titanium dioxide (TiO2) modification on its application to pollution treatment: A review. Catalysts 2020, 10, 804. [Google Scholar] [CrossRef]
  12. Wanag, A.; Kusiak-Nejman, E.; Czyżewski, A.; Moszyński, D.; Morawski, A.W. Influence of rGO and preparation method on the physicochemical and photocatalytic properties of TiO2/reduced graphene oxide photocatalysts. Catalysts 2021, 11, 1333. [Google Scholar] [CrossRef]
  13. Bell, N.J.; Ng, Y.H.; Du, A.; Coster, H.; Smith, S.; Amal, R. Understanding the enhancement in photoelectrochemical properties of photocatalytically prepared TiO2-reduced graphene oxide composite. J. Phys. Chem. C 2011, 115, 6004–6009. [Google Scholar] [CrossRef]
  14. Mishra, A.K.; Ramaprabhu, S. Functionalized graphene-based nanocomposites for supercapacitor application. J. Phys. Chem. C. 2011, 115, 14006–14013. [Google Scholar] [CrossRef]
  15. Anjusree, G.S.; Nair, A.S.; Nair, S.V.; Vadukumpully, S. One-pot hydrothermal synthesis of TiO2/graphene nanocomposites for enhanced visible light photocatalysis and photovoltaics. RSC Adv. 2013, 3, 12933–12938. [Google Scholar] [CrossRef]
  16. Yadav, H.M.; Kim, J.S. Solvothermal synthesis of anatase TiO2-graphene oxide nanocomposites and their photocatalytic performance. J. Alloys Compd. 2016, 688, 123–129. [Google Scholar] [CrossRef]
  17. Monteagudo, J.; Durán, A.; Martínez, J.M.M.; Martín, I.S. Effect of reduced graphene oxide load into TiO2 P25 on the generationof reactive oxygen species in a solar photocatalytic reactor. Application to antipyrine degradation. Chem. Eng. J. 2019, 380, 122410. [Google Scholar] [CrossRef]
  18. Balakrishnan, A.; Chinthala, M.; Polagani, R.K.; Vo, D.V.N. Removal of tetracycline from wastewater using g-C3N4 based photocatalysts: A review. Environ. Res. 2023, 216, 114660. [Google Scholar] [CrossRef]
  19. Wu, D.; Guo, J.; Wang, H.; Zhang, X.; Yang, Y.; Yang, C.; Gao, Z.; Wang, Z.; Jiang, K. Green synthesis of boron and nitrogen co-doped TiO2 with rich B-N motifs as lewis acid-base couples for the effective artificial CO2 photoreduction under simulated sunlight. J. Colloid Interface Sci. 2021, 585, 95–107. [Google Scholar] [CrossRef]
  20. Ahmad, M.M.; Mushtaq, S.; Al Qahtani, H.S.; Sedky, A.; Alam, M.W. Investigation of TiO2 nanoparticles synthesized by sol-gel method for effectual photodegradation, Oxidation and Reduction Reaction. Crystals 2021, 11, 1456. [Google Scholar] [CrossRef]
  21. Divyasri, Y.V.; Reddy, N.L.; Lee, K.; Sakar, M.; Rao, V.; Rao, V.N.; Venkatramu, V.; Shankar, M.V.; Reddy, N.C.G. Optimization of N doping in TiO2 nanotubes for the enhanced solar light mediated photocatalytic H2 production and dye degradation. Environ. Pollut. 2021, 269, 116170. [Google Scholar] [CrossRef]
  22. Andrade, Ó.R.; Rodríguez, V.; Camarillo, R.; Martínez, F.; Jiménez, C.; Rincón, J. Photocatalytic reduction of CO2 with N-doped TiO2-based photocatalysts obtained in one-pot supercritical synthesis. Nanomaterials 2022, 12, 1793. [Google Scholar] [CrossRef] [PubMed]
  23. Afza, N.; Shivakumar, M.S.; Alam, M.W.; Kumar, A.N.; Bhatt, A.S.; Murthy, H.A.; Ravikumar, C.R.; Mylarappa, M.; Selvanandan, S. Facile hydrothermal synthesis of cerium oxide/rGO nanocomposite for photocatalytic and supercapacitor applications. Appl. Surf. Sci. Adv. 2022, 11, 100307. [Google Scholar] [CrossRef]
  24. Ikram, M.; Ali, S.; Aqeel, M.; Ul-Hamid, A.; Imran, M.; Haider, J.; Haider, A.; Shahbaz, A.; Ali, S. Reduced graphene oxide nanosheets doped by Cu with highly efficient visible light photocatalytic behavior. J. Alloys Compd. 2020, 837, 155588. [Google Scholar] [CrossRef]
  25. Yuan, J.; Chen, M.; Shi, J.; Shangguan, W. Preparations and photocatalytic hydrogen evolution of N-doped TiO2 from urea and titanium tetrachloride. Int. J. Hydrogen Energy 2006, 31, 1326–1331. [Google Scholar] [CrossRef]
  26. Jakimińska, A.; Pawlicki, M.; Macyk, W. Photocatalytic transformation of Rhodamine B to Rhodamine-110: The mechanism revisited. J. Photochem. Photobiol. A Chem. 2022, 433, 114176. [Google Scholar] [CrossRef]
  27. Sharon, M.; Sharon, M. Graphene: An Introduction to the Fundamentals and Industrial Applications; John Wiley & Sons: Hoboken, NJ, USA, 2015; Volume 55, p. 5122. [Google Scholar] [CrossRef]
  28. Oliveira, A.E.F.; Braga, G.B.; Tarley, C.R.T.; Pereira, A.C. Thermally reduced graphene oxide: Synthesis, studies and characterization. J. Mater. Sci. 2018, 53, 12005–12015. [Google Scholar] [CrossRef]
  29. Zhang, H.; Wang, X.; Li, N.; Xia, J.; Meng, Q.; Ding, J.; Lu, J. Synthesis and characterization of TiO2/graphene oxide nanocomposites for photoreduction of heavy metal ions in reverse osmosis concentrate. RSC Adv. 2018, 8, 34241–34251. [Google Scholar] [CrossRef] [PubMed] [Green Version]
  30. Tjong, S.C. Synthesis and structural-mechanical property characteristics of graphene-polymer nanocomposites. In Nanocrystalline Materials, 2nd ed.; Elsevier: Amsterdam, The Netherlands, 2014; pp. 335–375. [Google Scholar] [CrossRef]
  31. Fu, Z.; Zhang, S.; Fu, Z. Preparation of multicycle GO/TiO2 composite photocatalyst and study on degradation of methylene blue synthetic wastewater. Appl. Sci. 2019, 9, 3282. [Google Scholar] [CrossRef] [Green Version]
  32. Kumar, A.; Sadanandhan, A.M.; Jain, S.L. Silver doped reduced graphene oxide as a promising plasmonic photocatalyst for oxidative coupling of benzylamines under visible light irradiation. New J. Chem. 2019, 43, 9116–9122. [Google Scholar] [CrossRef]
  33. Kim, E.Y.; Kim, D.S.; Ahn, B.T. Synthesis of mesoporous TiO2 and its application to photocatalytic activation of methylene blue and E. coli. Bull. Korean Chem. Soc. 2009, 30, 193–196. [Google Scholar]
  34. Yang, F.; Qu, J.; Zheng, Y.; Cai, Y.; Yang, X.; Li, C.M.; Hu, J. Recent advances of high-crystalline conjugated organic polymeric materials for photocatalytic CO2 conversion. Nanoscale 2022, 14, 15217–15241. [Google Scholar] [CrossRef] [PubMed]
  35. Rajkumari; Nandini, P.; Sangita, D.; Pallabi, G. Plant-Based natural dye-stimulated visible-light reduction of GO and physi-cochemical factors influencing the production of oxidizing species by a synthesized (RGO)/TiO2 nanocomposite for envi-ronmental remediation. ACS Omega 2021, 6, 2686. [Google Scholar] [CrossRef] [PubMed]
  36. Tobon, C.S.; Panžić, I.; Bafti, A.; Matijašić, G.; Ljubas, D.; Ćurković, L. Rapid microwave-assisted synthesis of n/tio2/rgo nanoparticles for the photocatalytic degradation of pharmaceuticals. Nanomaterial 2022, 12, 3975. [Google Scholar] [CrossRef] [PubMed]
  37. Kocijan, M.; Ćurković, L.; Bdikin, I.; Otero-Irurueta, G.; Hortigüela, M.J.; Gonçalves, G.; Radošević, T.; Vengust, D.; Podlogar, M. Immobilised rGO/TiO2 nanocomposite for multi-cycle removal of methylene blue dye from an aqueous medium. Appl. Sci. 2022, 12, 385. [Google Scholar] [CrossRef]
  38. Tong, Z.W.; Yang, D.; Sun, Y.Y.; Jiang, Z.Y. Biomimetic synthesis of C3N4/TiO2/Ag nanosheet composites with high visible-light photocatalytic performance. RSC Adv. 2015, 5, 56913–56922. [Google Scholar] [CrossRef]
  39. Sovizi, M.R.; Eskandarpour, M.; Afshari, M. Synthesis, characterization, and application of magnetic-activated carbon nanocomposite (m-Fe3O4@ACCs) as a new low-cost magnetic adsorbent for removal of Pb(II) from industrial wastewaters. Desalin. Water Treat. 2016, 57, 28887–28899. [Google Scholar] [CrossRef]
  40. Ali, M.H.; Al-Afify, A.D.; Goher, M.E. Preparation and characterization of graphene–TiO2 nanocomposite for enhanced photodegradation of Rhodamine-B dye. Egypt. J. Aquat. Res. 2018, 44, 263–270. [Google Scholar] [CrossRef]
  41. Fang, H.; Cao, X.; Yu, J.; Lv, X.; Yang, N.; Wang, T.; Jiang, W. Preparation of the all-solid-state Z-scheme WO3/Ag/AgCl film on glass accelerating the photodegradation of pollutants under visible light. J. Mater. Sci. 2019, 54, 286–301. [Google Scholar] [CrossRef]
  42. Dong, F.; Sun, Y.; Fu, M. Enhanced visible light photocatalytic activity of cluster modified N-doped for degradation of toluene in air. Int. J. Photoenergy 2012, 2012, 569716. [Google Scholar] [CrossRef] [Green Version]
  43. Yang, G.; Jiang, Z.; Shi, H.; Xiao, T.; Yan, Z. Preparation of highly visible-light active N-doped TiO2 photocatalyst. J. Mater. Chem. 2010, 20, 5301–5309. [Google Scholar] [CrossRef]
  44. Aragaw, B.A. Reduced graphene oxide-intercalated graphene oxide nano-hybrid for enhanced photoelectrochemical water reduction. J. Nanostruct. Chem. 2020, 10, 9–18. [Google Scholar] [CrossRef] [Green Version]
  45. Bai, X.; Wang, L.; Zhu, Y. Visible photocatalytic activity enhancement of ZnWO4 by graphene hybridization. ACS Catal. 2012, 2, 2769–2778. [Google Scholar] [CrossRef]
  46. Garrafa-Gálvez, H.E.; Alvarado-Beltrán, C.G.; Almaral-Sánchez, J.L.; Hurtado-Macías, A.; Garzon-Fontecha, A.M.; Luque, P.A.; Castro-Beltrán, A. Graphene role in improved solar photocatalytic performance of TiO2-RGO nanocomposite. Chem. Phys. 2019, 521, 35–43. [Google Scholar] [CrossRef]
  47. Lubis, S.; Sitompul, D.W. Photocatalytic degradation of indigo carmine dye using α-Fe2O3/bentonite nanocomposite prepared by mechanochemical synthesis. IOP Conf. Ser. Mater. Sci. Eng. 2019, 509, 012142. [Google Scholar] [CrossRef]
  48. Rahimi, R.; Bathaee, H.; Rabbani, M. Degradation of Rhodamine B using Cr-doped TiO2 under visible light irradiation. In Proceedings of the 16th International Electronic Conference on Synthetic Organic Chemistry, Online, 1–30 November 2012; MDPI: Basel, Switzerland, 2012; Volume 16, pp. 1–9. [Google Scholar] [CrossRef]
  49. Abou-Gamra, Z.M.; Ahmed, M.A.; Hamza, M.A. Investigation of commercial PbCrO4/TiO2 for photodegradation of Rhodamine B in aqueous solution by visible light. Nanotechnol. Environ. Eng. 2017, 2, 12. [Google Scholar] [CrossRef]
  50. Zhu, L.; Huang, D.; Ma, J.; Wu, D.; Yang, M.; Komarneni, S. Fabrication of AgBr/Ag2CrO4 composites for enhanced visible-light photocatalytic activity. Ceram. Int. 2015, 41, 12509–12513. [Google Scholar] [CrossRef]
  51. Leong, C.Y.; Teh, H.L.; Chen, M.C.; Lee, S.L. Effect of synthesis methods on properties of copper oxide doped titanium dioxide photocatalyst in dye photodegradation of Rhodamine B. Sci. Technol. Indones. 2022, 7, 91–97. [Google Scholar] [CrossRef]
  52. Fu, H.; Pan, C.; Yao, W.; Zhu, Y. Visible-light-induced degradation of Rhodamine B by nanosized Bi2WO6. J. Phys. Chem. B 2005, 109, 22432–22439. [Google Scholar] [CrossRef]
  53. Yai, H.; Nadu, T. Enhanced visible-light-driven photodegradation of Rhodamine B over Ag2C2O4/Bi2MoO6 nanocomposites. Iran. J. Chem. Chem. Eng. 2020, 39, 29–37. [Google Scholar] [CrossRef]
  54. Chen, Y.; Qian, J.; Wang, N.; Xing, J.; Liu, L. In-situ synthesis of CNT/TiO2 heterojunction nanocomposite and its efficient photocatalytic degradation of Rhodamine B. Inorg. Chem. Commun. 2020, 119, 108071. [Google Scholar] [CrossRef]
  55. Isari, A.A.; Payan, A.; Fattahi, M.; Jorfi, S.; Kakavandi, B. Photocatalytic degradation of rhodamine B and real textile wastewater using Fe-doped TiO2 anchored on reduced graphene oxide (Fe-TiO2/rGO): Characterization and feasibility, mechanism and pathway studies. Appl. Surf. Sci. 2018, 462, 549–564. [Google Scholar] [CrossRef]
  56. Zhang, Y. High photocatalytic activity of hierarchical SiO2@C-doped TiO2 hollow spheres in UV and visible light towards degradation of Rhodamine B. J. Hazard. Mater. 2017, 340, 309–318. [Google Scholar] [CrossRef] [PubMed]
  57. Kavitha, V.; Ramesh, P.S.; Geetha, D. Synthesis of Cu loaded TiO2 nanoparticles for the improved photocatalytic degradation of Rhodamine B. Int. J. Nanosci. 2016, 15, 1660002. [Google Scholar] [CrossRef]
  58. Ansari, S.A.; Khan, M.M.; Ansari, M.O.; Cho, M.H. Nitrogen-doped titanium dioxide (N-doped TiO2) for visible light photocatalysis. New J. Chem. 2016, 40, 3000–3009. [Google Scholar] [CrossRef]
  59. Acemioğlu, B. Removal of a reactive dye using NaOH-activated biochar prepared from peanut shell by pyrolysis process. Int. J. Coal Prep. Util. 2022, 42, 671–693. [Google Scholar] [CrossRef]
Figure 1. The schematic illustration of the synthesis of N-TiO2/rGO.
Crystals 13 00588 g001
Figure 2. SEM images of (a) graphite, (b) GO, (c) rGO, (d) N-TiO2, and (e) N-TiO2/rGO.
Crystals 13 00588 g002aCrystals 13 00588 g002b
Figure 3. XRD diffractogram of graphite, GO, and rGO.
Crystals 13 00588 g003
Figure 4. XRD diffractogram of rGO, N-TiO2, and N-TiO2/rGO.
Crystals 13 00588 g004
Figure 5. TG-DTA graphics of graphite, GO, rGO, N-TiO2, and N-TiO2/rGO.
Crystals 13 00588 g005
Figure 6. UV-Vis DRS curves of TiO2, N-TiO2, and N-TiO2/rGO.
Crystals 13 00588 g006
Figure 7. The effect of pH on photodegradation of RhB.
Crystals 13 00588 g007
Figure 8. The effect of photocatalyst mass on photodegradation of RhB.
Crystals 13 00588 g008
Figure 9. The effect of irradiation time on photodegradation of RhB.
Crystals 13 00588 g009
Figure 10. The effect of light irradiation on photodegradation of RhB.
Crystals 13 00588 g010
Figure 11. The schematic illustration of the photodegradation mechanism of RhB using N-TiO2/rGO.
Crystals 13 00588 g011
Table 1. Elemental composition of materials.
SampleElement Percentage (wt%)
CONTi
Graphite100---
GO60.4239.58--
rGO83.1716.83--
N-TiO25.0148.361.8544.78
N-TiO2/rGO27.8837.940.6133.57
Table 2. Average crystal size of materials.
SampleDistance between Layers (nm)D (nm)Average D (nm)
Graphite0.33415.80115.801
0.8306.999
GO0.3397.4167.208
rGO0.3424.1606.438
0.3489.641
0.2359.261
N-TiO20.1889.29613.215
N-TiO2/rGO0.16910.30412.818
0.16611.792
0.14811.926
0.12613.558
Table 3. GSA analysis results.
SampleSurface Area (m2/g)Pore Volume (cc/g)Pore Size (nm)
Graphite3.9510.0147.144
GO216.3130.5655.225
rGO83.4070.1032.469
N-TiO260.5020.1093.602
N-TiO2/rGO53.3930.0963.588
Table 4. The photodegradation of RhB in this study compared with previous studies.
Photocatalyst MaterialsLightDye ConcentrationPhotocatalyst MassIrradiation TimePhotodegradationRef.
Cr-doped TiO2Hg lamp 500 W10 mg/L0.02 g90 min98%[48]
PbCrO4/TiO2Tungsten 200 W1 × 10−5 M0.5 g600 min70%[49]
Ag2CrO4LED 5 × 24 W10 mg/L0.1 g35 min73%[50]
Cu-TiO2LED 15 W15 mg/L0.05 g360 min65%[51]
Bi2WO6Xenon 500 W1 × 10−5 M0.5 g60 min19%[52]
Ag2C2O4/BiMoO6Xenon1 × 10−5 M0.2 g100 min78.84%[53]
CNT-TiO2UV10 mg/L10 g20 min85%[54]
Fe-TiO2/rGOSolar simulator20 mg/L0.6 g120 min91%[55]
SiO2/C-TiO2UV20 mg/L0.1 g60 min61.7%[56]
Cu-TiO2Natural light10 mg/L0.02 g120 min97%[57]
N-TiO2/rGOXenon10 mg/L0.02 g90 min78.29%This Study
Table 5. Kinetic parameters on the photodegradation of RhB.
Pseudo-First-Order Kinetic ModelPseudo-Second-Order Kinetic Model
qe1k1R2qe2k2R2
1.490992463 mg/g0.000047 min−10.419410.96417229 mg/g0.4287318 g/mg·min0.9999
Disclaimer/Publisher’s Note: The statements, opinions and data contained in all publications are solely those of the individual author(s) and contributor(s) and not of MDPI and/or the editor(s). MDPI and/or the editor(s) disclaim responsibility for any injury to people or property resulting from any ideas, methods, instructions or products referred to in the content.

