Article

Computer Simulations of a Twist Bend Nematic (NTB): A Coarse-Grained Simulation of the Phase Behaviour of the Liquid Crystal Dimer CB7CB

Department of Chemistry, Durham University, Stockton Road, Lower Mountjoy, Durham DH1 3LE, UK
*
Author to whom correspondence should be addressed.
Crystals 2023, 13(3), 502; https://doi.org/10.3390/cryst13030502
Submission received: 16 February 2023 / Revised: 7 March 2023 / Accepted: 9 March 2023 / Published: 15 March 2023
(This article belongs to the Special Issue Nematic Liquid Crystal)

Abstract

:
In recent years, a number of achiral liquid crystal dimer molecules have been shown to exhibit nematic–nematic phase transitions. The lower temperature phase has been identified as the N TB phase, which demonstrates emergent chirality in the spontaneous formation of a heliconical structure. Recent fully atomistic simulations of the molecule CB7CB (1,7-bis-4-(4 -cyanobiphenyl) heptane), a dimer with an odd number of carbon spacers between the mesogenic parts of the molecule, have captured the N TB –N–I phase sequence, providing a picture of the order at a molecular level. In this paper, we use atomistic simulations of CB7CB to develop a coarse-grained model using systematic coarse graining in the N TB phase. We use both force matching (in the form of the MS-CG method) and iterative Boltzmann inversion (IBI) methodologies. Both techniques capture the heliconical order within the N TB phase. Moreover, the model developed via force matching is shown to provide an excellent representation of the atomistic simulation reference model and, remarkably, demonstrates good transferability across temperatures, allowing the N TB –N and N–I phase transitions to be simulated. We also compare results with those of a Martini 3-based coarse-grained model.

1. Introduction

For almost 100 years, the two known nematic liquid crystal phases exhibited by low molecular weight mesogens were the standard uniaxial (apolar) nematic, N, phase and its chiral variant: the chiral nematic (or cholesteric) N * phase [1]. However, theory has suggested the possibility that other nematics can exist, including biaxial nematics [2], polar nematics [3] and nematics in which the direction of the director vector varies spatially [4]. Many of these have now been discovered in low molecular weight nematics [5,6,7,8,9], in addition to polymers [10], lyotropic systems [11] and colloidal liquid crystals [12,13,14].
A particularly interesting member of the “new nematic family” is the twist–bend nematic phase [15], which was independently predicted by Meyer and Dozov [4,16]. This phase exhibits a nanoscale helicoidal structure with a repeat length of just a few nanometres (i.e., a few molecules) [4]. It was first seen in a liquid crystal dimer, 1,7-bis-4-(4 -cyanobiphenyl) heptane, CB7CB [8,15,17,18], where a flexible tail (of odd parity) links two rigid mesogenic moieties, and has been seen in other dimeric mesogens [19,20,21,22,23,24,25,26,27,28], bent-core species [29,30] and supramolecular hydrogen-bonded systems [9,31,32,33]. Possible future applications have been reported in areas such as optical devices [34,35,36,37], gels [38], photoswitchable adhesives [39] and photoalignment technology [40].
Molecular simulation provides a very effective method of studying liquid crystal phases [1,41,42,43,44]. Insights into liquid crystalline structure have arisen from simulation studies at a range of different levels, from all-atom molecular dynamics studies [45,46,47,48,49,50] to a variety of simpler coarse-grained studies in which some of the details of the molecular structure are sacrificed to concentrate on the role played by factors such as anisotropic shape or the anisotropy of attractive interactions [51,52,53,54,55,56,57]. At a molecular level, simulations can provide information about the local structure of a phase, including the role of dipole correlation [58,59] and microphase separation [41] and the importance of molecular shape on molecular packing [42]. Moreover, simulations can provide insights into structural properties of liquid crystals, such as order parameters [60,61], elastic constants [62] and flexoelectric coefficients [63,64], together with dynamical quantities such as diffusion [65] and rotational viscosity [66].
Recently, several particle-based simulation studies have targeted the twist–bend nematic phase. Simulations show that the phase can arise simply from the efficient packing of (crescent-shaped) hard particles [67]. However, within studies that have attempted to reproduce the N TB via atomistic studies [18,68], it becomes clear that the phase itself displays a remarkably subtle ordering of molecules. Essentially, molecular order can be influenced subtly by changes in dipoles, by the preferred angle of bend within an LC dimer (or LC oligomer), by the presence of certain functional groups or by changing molecular flexibility, as borne out by experimental studies of the relationship between transition temperature and N TB stability [69,70,71].
Valuable insight from colloidal simulations reveals that for hard-bent spherocylinders, biaxial, twist–bend and splay–bend nematic phases must all compete with stable smectic phases. However, polydispersity in particle length or curvature can destabilize smectic ordering, allowing these nematic phases to be seen. It is interesting to note that in thermotropic low molecular weight organic molecules, molecular flexibility provides a mechanism to introduce polydispersity of shape with the same role of raising the relative free energy of competing smectic phases, allowing unusual nematics to be seen [68].
In a recent study [68], we carried out extensive all-atom molecular dynamics simulations of the bent dimer CB7CB and characterised its properties as a function of temperature. Despite enormous advances in the availability of computer time and parallel simulation algorithms to exploit this, all-atom models remain extremely computationally expensive and at the boundary of what is currently possible from a simulation point of view. However, in the current paper, we attempt to develop systematic coarse-grained models for CB7CB that capture the molecular ordering and phase behaviour seen in atomistic simulation studies. The aims of such models are to allow the subtle details of molecular order to be captured (i.e., molecular flexibility, dipole-dipole correlation, packing) but in a model that is orders of magnitude faster to simulate than an all-atom simulation.
Models such as the ones developed here open up new possibilities for studies of large systems sizes and long simulation times, far beyond what is currently possible at the all-atom level.

2. Computational

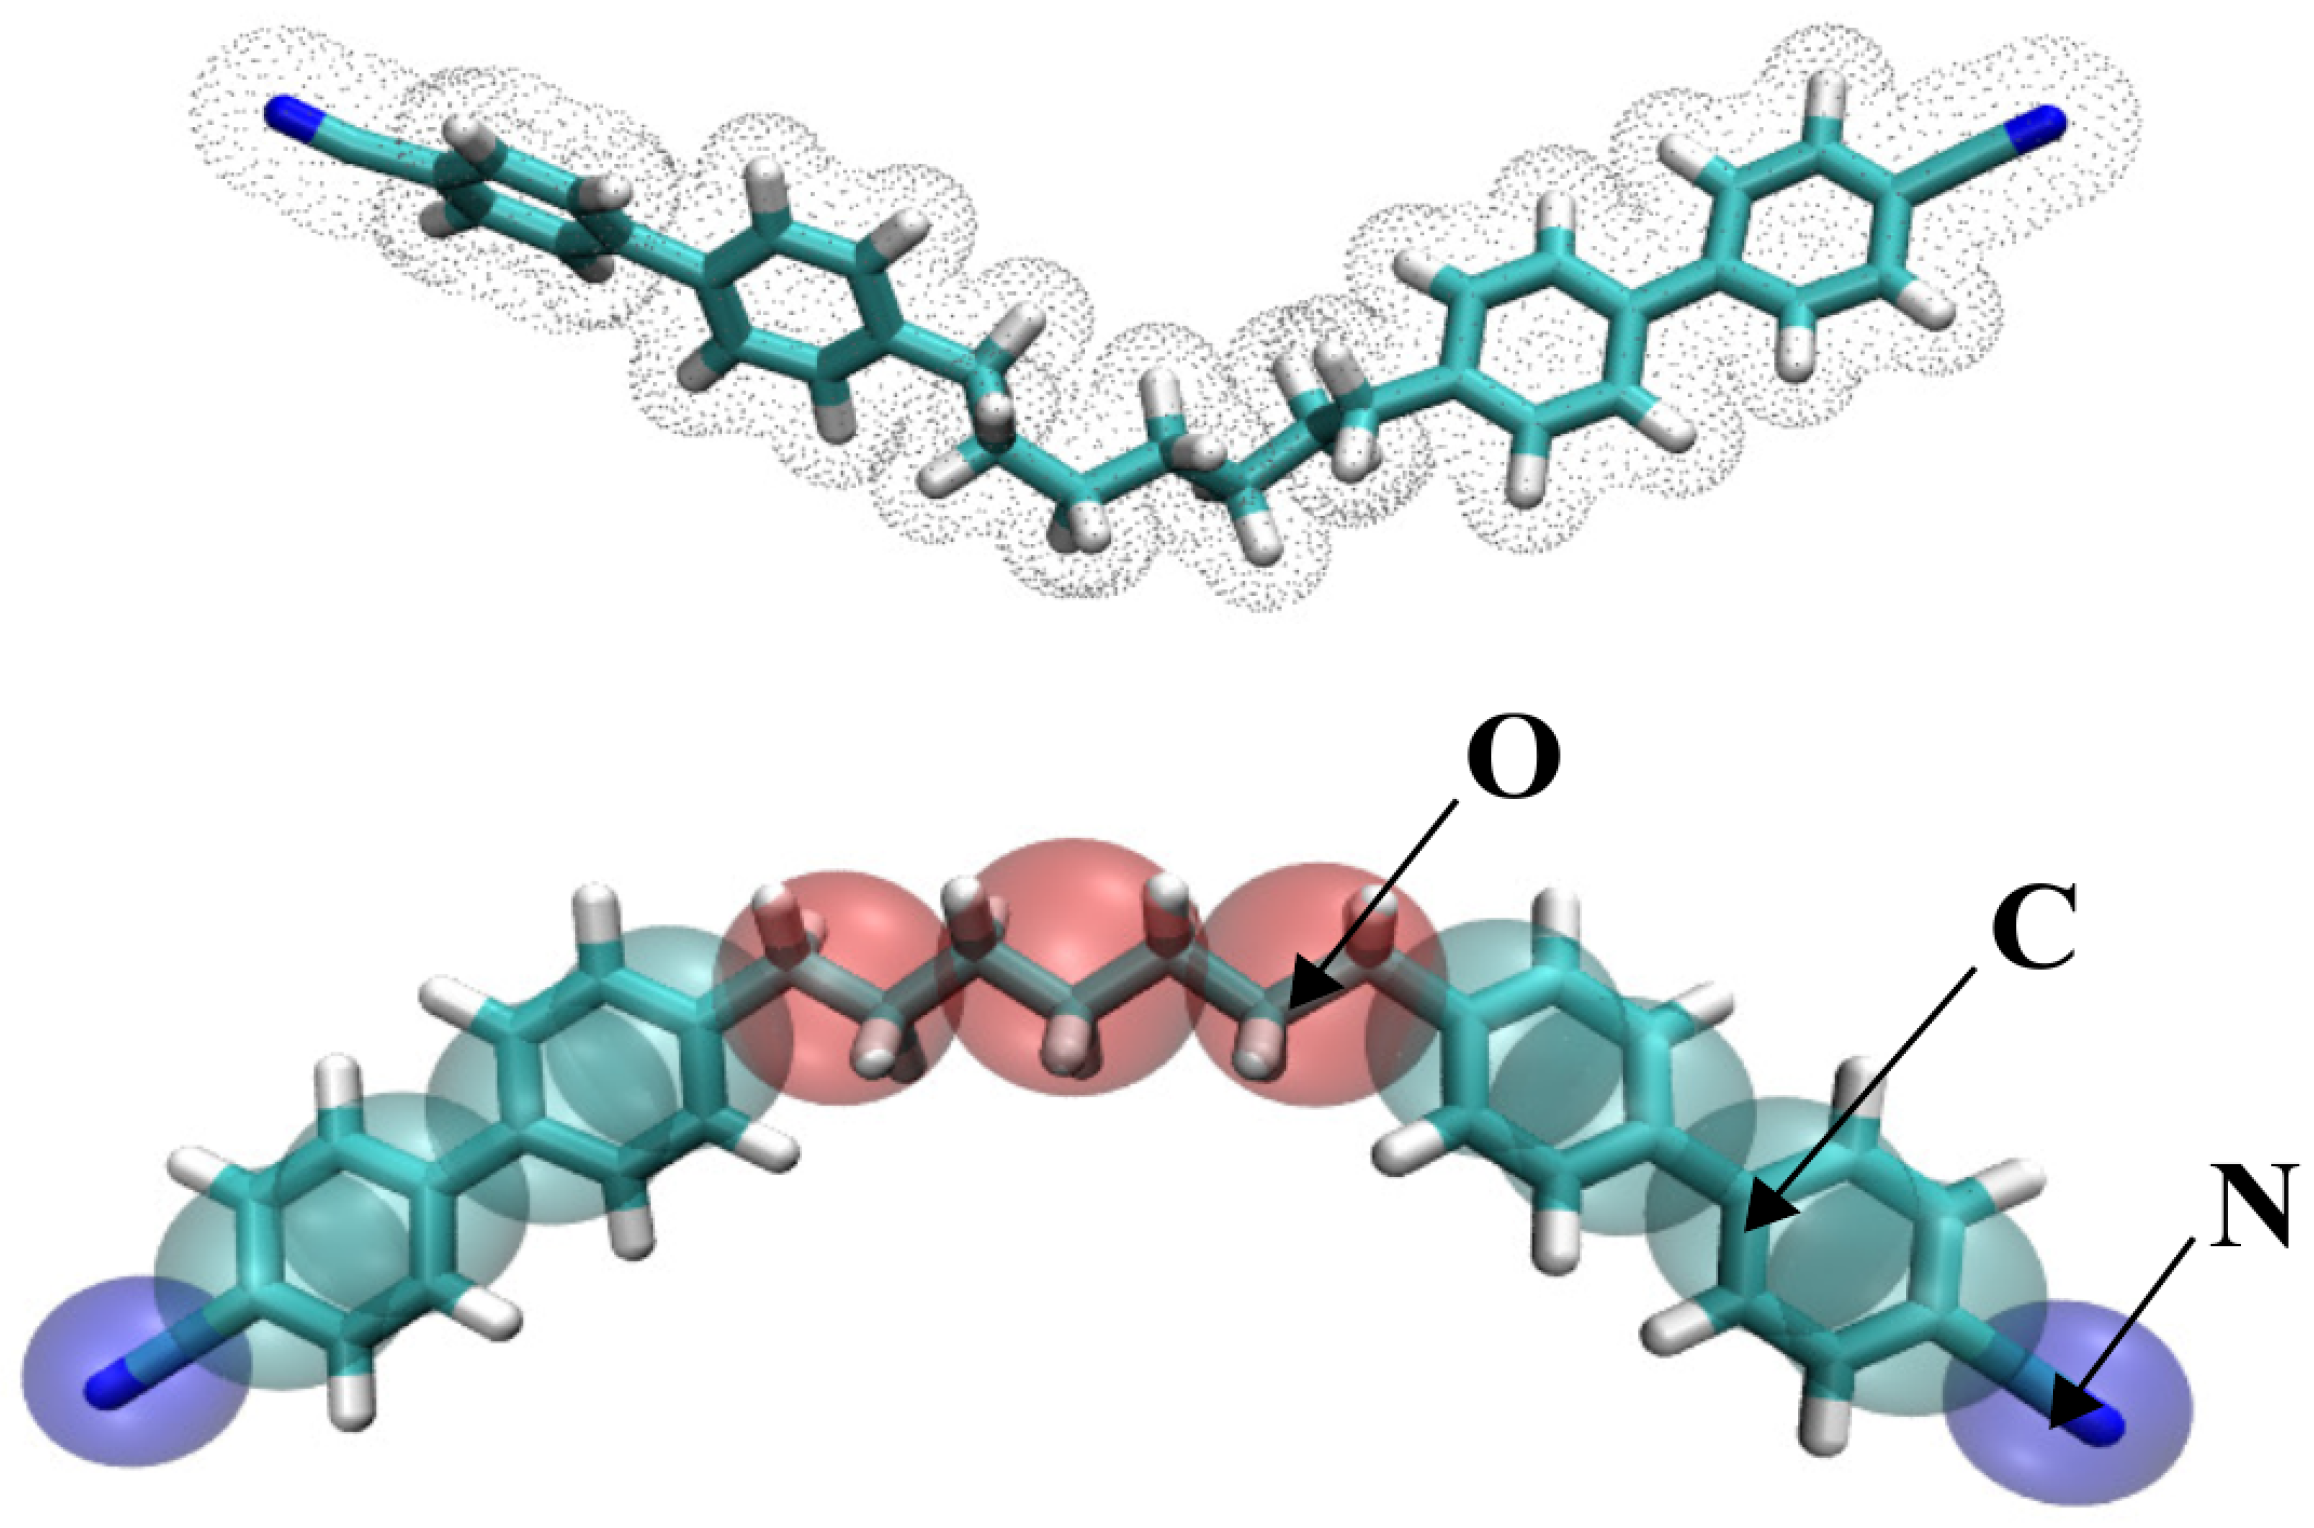
2.1. Choice of Methodology and CG Mapping

The coarse-grained molecular simulation models developed in this work are based on the structure of an underlying all-atom model for CB7CB, provided by our earlier simulation work [68]. In brief, our earlier calculations used a fully atomistic model composed of 512 molecules based on the GAFF force field. Simulations were carried out in the isobaric–isothermal ensemble at a range of temperatures and 1 bar of pressure in a simulation box with an approximate aspect ratio of 1:1:2, which employed anisotropic box scaling. This model demonstrated good agreement with experiment in relation to the structure of the N TB phase of CB7CB, though with transition temperatures that are slightly higher than the experiment (we know from the earlier work of Boyd and co-workers [47,48,72,73] that the GAFF force field provides a good foundation for simulating liquid crystal phases but that this force field leads to molecules that are a little stiff and hence to molecules that are slightly too rigid and therefore phases that exhibit transition temperatures that are slightly too high in comparison with experiment). The atomistic reference phase transitions are ( T N TB N = 435 K and T N I = 460 K) in comparison to experiment ( T N TB N = 376 K and T N I = 389 K). However, the good agreement between experimental and atomistic simulation in terms of pitch and average conical tilt angles provides an excellent starting point for helping to develop a coarse-grained model of CB7CB.
For the current work, we used snapshot configurations from the N TB phase at a simulated temperature of 370 K (1 bar pressure) over a 1 μs simulation run (the longest fully atomistic study of a liquid crystal reported to date) to provide reference data for atomistic radial distribution functions and forces. For our reference system, the heliconical nanostructure of the N TB phase was formed spontaneously on cooling from a nematic phase, and the change in local order of CB7CB was seen reversibly in crossing and recrossing the transition by raising/lowering the temperature.
Figure 1 shows the mapping scheme used for this study. The choice of a 3:1 mapping scheme leads to a 13-site coarse-grained (CG) model and 6 pairwise interactions to fit. Within the 3:1 scheme, the combination of separate N–N, N–C and C–C interactions should be sufficient to capture the local packing structure of mesogenic units. We note that a slightly more fine-grained 2:1 mapping scheme would result in a need for additional bead types. While this may lead to greater accuracy, it would introduce greater complexity in the fitting procedures at a far greater computational cost. In particular, for the iterative Boltzmann integration (IBI) method (discussed below), a scenario with more than 6 types of beads (i.e., >15 interaction pair-types) becomes extremely difficult to fit.

2.2. Coarse-Grained Methods Used: IBI, FM, Martini 3

Coarse-grained models for the IBI scheme were developed using the VOTCA-CSG package, version 1.4.1 [74,75,76] to determine nonbonded parameters. Force matching (FM) was carried out using the MS-CG method within a hybrid force matching (hFM) scheme [75,77]. In this method, force matching is carried out to determine the nonbonded potentials allowing for forces arising from explicit bonded potentials. This method was carried out using the BOCS (bottom-up open-source coarse-graining software) package [78]. For both methods, a linear pressure correction was used. This was done so that a pressure of ∼1 bar could be obtained for simulations at the state point at which coarse-graining was carried out. Potentials were tailored to go smoothly to zero at a cut-off of 1.2 nm. For this work, IBI and FM used the atomistic reference coordinates from the N TB phase at 370 K, employing atomistic trajectories containing 1000 frames. In the calculations, we have followed the general approaches outlined by Potter et al. [79] for simple mixtures, which have been used recently for chromonic liquid crystals [80,81].
CB7CB was coarse-grained using Martini 3 nonbonded potentials. The Martini 3 force field consists of a substantial library of Lennard–Jones bead types. This study was completed before the formal publication of Martini 3 [82], and we used the parameters released in the open beta version of the Martini 3 force field [83]. We use the bead types N = TC6, C = SC4, O = TC1. For Martini 3 simulations, the standard Martini cut-off of 1.1 nm was used for all nonbonded interactions [84].
As an initial test of the Martini parameters, we carried out simulations of cynanobiphenyl and heptane as pure compounds and as a 50:50 mixture and compared these with results from all-atom force field studies using GAFF. Here, we used a standard constant- N p T simulation approach [47,48,85] to calculate Δ vap H from bulk and single molecule simulations and obtained Δ sol G from decoupling the intermolecular interactions of a single molecule from the solvent using the Bennett acceptance ratio (BAR) method [86] following the simulation approach of Yu and co-workers [49,80]. The results (shown in Table 1) indicate that Martini 3 does quite a good job in terms of correctly capturing the thermodynamics of these molecular fragments that control the interactions of CB7CB molecules. However, we note that for bulk liquids, Martini 3 models tend to pack better than real molecules, and this leads to an over-estimate of liquid densities [87]. We note in passing that preliminary work in our laboratory suggests that it may be possible to systematically optimise Martini by fitting the heat of vaporization at 298.15 K together with the density at a range of state points, using the ForceBalance [88] software to carry out systematic optimisation. However, this approach is very computationally intensive as it requires many separate CG simulations for each optimisation step. Alternatively, progress is currently being made using the SAFT- γ equation of state approaches to carry out top-down coarse graining [89,90,91,92], and this method has been applied recently to liquid crystals [93].
All coarse-grained simulations used the GROMACS molecular dynamics package, with simulations carried out in the canonical ensemble. For the initial model development, 512 molecules were used. This was later scaled up to 4096 molecules for larger simulations of the FM model. Simulations used a time step of 2 fs for initial setup and equilibration and 5 fs for production runs and used a stochastic dynamics integrator with a time constant of 2 ps.
The CG interactions potential can be written as
E CG = bonds K r ( r r eq ) 2 + angles K θ ( θ θ eq ) 2 + dihedrals k ϕ 1 + cos n d ϕ ϕ d + i > j N E i j ,
where r eq ,   θ eq are the natural bond lengths and angles, respectively, K r ,   K θ and K ϕ are the bond, angle and torsional force constants, respectively, and ϕ , n d and ϕ d represent a dihedral angle, its periodicity and the phase angle associated with it, respectively. E i j are nonbonded energies for particles i and j, which in the case of the IBI and FM methods are numerical potentials and in the case of Martini 3 are Lennard–Jones 12:6 potentials. In this work, we make the approximation that the influence of partial charges across the atomistic molecule can readily be coarse-grained into E i j .

2.3. Cost of Computational Models

A few comments on the relative computational costs of the three models are appropriate. In terms of setup costs, the Martini 3 model has a significant advantage in being an “off-the-shelf” approach that usually does not require an underlying atomistic reference. However, in the current work, it was still relatively important to do some atomistic work (see below) to ensure that the combination of inter and intramolecular potentials gives a good representation of molecular shape. The IBI and FM approaches both require the significant expense of an underlying reference atomistic model for at least one state point. However, the IBI approach requires significantly more computational work than FM in the coarse-graining procedure (in order to fit the multiple partial radial distribution functions for all pair interactions required in IBI). In terms of production runs, the three models have very similar computational costs as these costs are primarily related to the time step used and the number of coarse-grained sites. Here, the stiffness of the intramolecular potentials places a limit on the length of the time step.

2.4. Bonded Potentials

For systems such as this, it is possible to obtain numerical bonded potentials directly from the atomistic calculations via the Boltzmann inversion of bond, bond angle and dihedral angle distributions for the coarse-grained sites, or to use numerical potentials from IBI. However, in the case of coarse-graining in the N TB phase, these potentials would be likely to inherit a chiral bias from the symmetry of the phase. Hence, we use a simpler approach. In the spirit of the Martini model, we employ simple harmonic potentials for bonded parameters, determining optimum parameters by reference to the bond, angle and dihedral distribution functions, together with further testing on single molecule simulations. For the latter, we wanted to capture a good representation of the overall molecular shape in the absence of surrounding molecules, as represented by the correct bend angle between mesogenic moieties within the molecule and the angle distribution function (which is dependent on the conformational distribution). Simulations at 370 K, using the final parameters in Table 2, Table 3 and Table 4, reproduce the preferred atomistic bend angle of 127° and show no preference for right-handed or left-handed conformations in single molecule calculations. The latter was particularly important as we want chirality in the model to be able to arise without any biasing potentials and for the model to be able to show both achiral (nematic) and chiral (N TB ) phases. However, we note that the coarse-grained model is slightly stiffer than its atomistic counterpart, exhibiting a full width at half maximum (FWHM) for the bend angle distribution of 15° (see ESI Figure S2) in comparison to 40° for the atomistic model. Moreover, in the atomistic model [68], we detected a few highly bent “hairpin” conformations arising from multiple gauche conformations in the chain. These rare conformations are not captured in the coarse-grained model.

3. Results and Discussion

3.1. CG Potentials

Figure 2 shows the numerical coarse-grained potentials generated through the IBI and FM methodologies at 370 K. The six nonbonded potentials are very similar to those typically found through bottom-up coarse-graining techniques and in some cases include more than one well, reflecting the different correlations seen between coarse-grained sites in the N TB phase. Both methods capture the structure of the phase (see below) but interestingly do so by a completely different combination of pair potentials. For example, the N–N potential for FM is totally repulsive, but the N–N for IBI gives a deep attractive well. However, here it is a combination of pair potentials that lead to the structure of the fluid, and we expect different combinations of potentials to be able to generate very similar pair statistics in this complex case [96].

3.2. Phase Behaviour of the Coarse-Grained Models at 370 K

The simulation snapshots for the three models are shown in Figure 3. In the top part of the figure, we colour molecules blue, purple or red. Here, colour-coding picks out variations in the azimuth angles ( ϕ ) calculated from the molecular long axes (i.e., the unit vector a ^ ) in the range: −180°  ϕ <  −60°, −60°  ϕ <  60° and 60°  ϕ <  180°. From visual inspection, we find both the IBI and FM models exhibit a N TB phase, where the mesogens form a heliconical structure. As with the reference atomistic structure, the helix found here is left-handed. However, we note that, experimentally, there are equal domains of opposite handedness. We might expect to be able to see either-handedness forming within a relatively small simulation box; however, the periodic boundary conditions and the relatively small size of the system (in comparison to experimental domains) guarantee the presence of only one chiral domain.
The Martini 3 simulations however form a crystalline smectic structure where there is a far stronger positional correlation between molecules than seen in either the IBI or FM models. This leads to the loss of smooth helicoidal ordering at 370 K, though interestingly, we still see a molecular tilt and a precession of the molecular tilt angle along the long axis of the simulation box.
The molecular order at 370 K can be characterised by the order parameters S 2 a and S 2 b for the long axis vector a ^ and a second short-axis vector b ^ . b ^ is defined as the unit vector which bisects the two vectors between the terminal N sites and the centre of mass (COM) of the molecule. Values of S 2 for a chosen axis vector can be determined from the diagonalisation of the order tensor
Q α β = 1 N i = 1 N 1 2 ( 3 u i α u i β δ α β ) ,
where N is the number of molecules, δ α β is the Kronecker delta and u i is the axis vector a ^ or b ^ for molecule i. The largest eigenvalue provides the value of S 2 and its associated eigenvector is the director, n ^ . While S 2 a is traditionally used to measure the degree of order in a normal nematic phase, S 2 b can measure the polar correlations or smectic-like ordering normal to the long axes.
Values of S 2 a and S 2 b are given in Table 5. The degree of order is slightly larger in the coarse-grained models than that seen atomistically. Most likely, this is due to a slightly lower degree of flexibility in the CG models. The FM model performs best, and b ^ for this model is very close to the value obtained in the all-atom model. The values of the pitch obtained in the simulation are also given in Table 5. The coarse-grained results are very close to all-atom results, which in turn are in good agreement with the experimentally measured pitch for CB7CB of ∼8 nm [8,18]. One should note that for the FM and IBI models, the pitch is pre-programmed insomuch as the underlying structure of the phase is captured by the coarse-graining procedure at 370 K.
The average values of the conical tilt angle, θ , are given in the final column of Table 5. θ is calculated as the angle between the unit vector a ^ and the helical axis. The values we obtain are in good agreement with the atomistic values. Both atomistic and coarse-grained simulation results are slightly higher than the experimental value of ∼25° [18,97,98].
Although not capturing the N TB phase, the Martini 3 model is interesting in the sense that it shows a molecular tilt, the direction of which precesses through the system despite the formation of smectic layers. From the Martini 3 snapshot structure in Figure 3, we note the similarity of this model to previous models of hard-bent spherocylinders. Chiappini et al. [99] have shown that, for the latter, the N TB phase must compete with an array of smectic phases unless the smectics are destabilized by polydispersity in the particle length or by curvature. While the Martini 3 model contains attractive interactions in addition to repulsions, the molecular packing is still dominated by shape. When attractive interactions between molecules overcome some of the polydispersity of shape (arising from conformational flexibility), the system readily forms a smectic in preference to the N TB phase. We note also that the local ordering in this phase has similarities to systems that show the segregation of mesogens into ferroelectric domains [45,100,101,102,103]. Moreover, the phase organisation observed here is similar to the twist–bend smectic phase reported in dimers with a terminal alkyl chain [104,105,106].
A key difference between the Martini 3 model and the two bottom-up models arises from the coarse-grained potentials themselves. Within Martini 3, the strongest like–like interactions are highly favourable, but cross-interactions are generally less favourable. This tends to promote microphase separation between similar regions of a molecule. However, stronger cross-interactions are able to destabilise smectic ordering and this, in turn, leads to greater stability of nematic phases. As discussed above, the destabilisation of a smectic phase can also be achieved via polydispersity of particle/molecule size, shape or curvature. For CB7CB molecules, conformational disorder provides this polydispersity, but for the Martini 3 model, some of this is lost in the formation of crystalline smectic structures.
Finally, it is interesting to discuss the role of the N–N interactions (corresponding to the cyano-group self-interaction) within the bottom-up models. In the FM model, this interaction is completely repulsive, and the N–C interaction is stronger than the C–C interaction. In adjacent molecules, this leads to either a preference for anti-parallel correlations of cyano groups or parallel shifted correlations (i.e., these potentials encode the local effects of dipole-dipole interactions seen in the atomistic model). These interactions promote nematic ordering at the expense of smectics. While the IBI achieves a similar effect with different potentials, the stronger IBI N–N interaction leads to an overall stronger correlation between adjacent molecules and an orientational order that is slightly higher than seen in the FM model.

3.3. Further Simulation of the FM Model

From the results in Section 3.2, the FM model is judged to be the most representative CG model of the three studied for CB7CB. This model was selected for a heating sequence to produce a full phase diagram. Here, we test the transferability of the model to different temperatures to see whether it can capture the N or I phases and the phase transition temperatures. Starting from a configuration at 370 K, the system was heated at intervals of 10 K for 200 ns at each temperature within canonical ensemble simulation runs. The phase diagram produced is shown in Figure 4, in which the stability of the N TB , N and I phases are indicated. The N TB –N transition was defined as the temperature at which the helical order is lost and S 2 b 0 . Remarkably (given the limited temperature transferability often seen for such models), the FM CG model successfully captures the phase transitions in the N and I phases. The transition temperatures seen are T N TB N 445 K, which is about 10 K higher than the all-atom model and T N I 465 K. Such good transferability to the N and I phases was not expected, particularly considering that the potentials were parametrised in the N TB phase. However, this probably indicates that the local interactions between molecules within the two nematics phases are not dramatically different, and the CG potentials are sufficiently detailed to represent that structure well (see above). We note additionally that the similar probability distribution functions for the molecular bend angle measured from atomistic simulations in the two phases [68] might also be a contributing factor.
Within the N TB phase itself, the value of S 2 a does not increase with temperature, contrary to the results from atomistic simulation [68]. For the FM model, this is almost certainly down to coarse-graining at just one temperature and therefore does not capture the temperature dependence of the conformations seen in the all-atom chains. In the latter, conformations change subtly with temperature, and this leads to subtle changes of molecular tilt and a decrease in S 2 a as the N TB is cooled.
On cooling from the isotropic phase with the FM model (using 200 ns simulations and 20 K temperature intervals and a longer 400 ns in cooling from 450 K to 430 K), we are able to spontaneously recover the N and N TB phases. The same transition temperatures are obtained on cooling as those seen on heating (see ESI Figure S1 for the phase diagram and simulation snapshots).
One motivation for coarse-graining is to facilitate the simulation of systems beyond the length and time scales accessible to all-atom molecular dynamics. This is particularly important for complex phases, such as the N TB phase, where larger systems move the simulation away from a regime where small system sizes could induce system size effects or (worse) introduce artificial order into a system. Accordingly, we set up larger simulations of 4096 molecules for the FM model at 470 K by replicating our 512 molecules system in each direction and then carrying out long runs to ensure molecular order within the system was fully equilibrated for this large system size. Figure 5 shows the results from a 200 ns simulation of this system. The calculated values of S 2 a = 0.44 and S 2 b = 0.18 are in full agreement with the smaller system, and the helicoidal ordering, within a phase of flexible molecules showing translational disorder, is fully evident from the snapshot pictures in Figure 5a,b. For this system, we have calculated the orientational correlation function, S b b (Figure 5c), as a function of intermolecular distance along the helical axis, r [107]. S b b ( r ) describes the polar correlations through the system,
S b b ( r ) = i N j i N c i j ( b ^ i · b ^ j ) ,
where
c i j = δ ( | z i j | r ) / i N j i N δ ( | z i j | r ) ,
where z i j is the distance with respect to the z components for the COMs of molecules i and j, and N is the number of molecules. The results show a beautiful precession of b ^ vectors about the helical axis through the system, as expected in the NTB phase [67,108]. For this large system, we are able to capture four pitch lengths within the simulation box. Figure 5d shows the distribution of the conical tilt angle θ averaged over all molecules. It shows quite clearly that there is a range of tilt angles for molecules, i.e., considerable disorder, as one might expect for a fluid phase. However, the average tilt of 29°, in combination with the helicoidal twist clearly demonstrates how the structure changes dramatically in comparison to a normal nematic phase.

4. Conclusions

We have developed coarse-grained models for the mesogen CB7CB using bottom-up (FM and IBI) and top-down (Martini 3) models.
Using 13 CG sites and three CG bead types, both FM and IBI deliver good CG models of the N TB phase. In both cases, the results are in good agreement with the reference all-atom model for CB7CB. Of these two techniques, FM gives a slightly better representation of the key structural quantities such as orientational order parameters. Further simulations of the FM model show that it demonstrates remarkably good transferability across temperatures, exhibiting reversible phase transitions to a normal nematic, N, and an isotropic phase on heating. Cooling runs spontaneously recapture the original N TB phase. Large simulations of 4096 FM molecules in the N TB phase show very similar results to a smaller system of 512 molecules but exhibit helicoidal ordering over 4 pitch lengths. In this phase, the molecules show a wide spread of conical tilt angles, demonstrating that considerable disorder occurs within the microstructure of a molecular N TB phase.
The FM model shows quite good agreement with experimentally measured quantities for CB7CB. The helical pitch seen (8.35 nm) is very similar to the experimental value (∼8 nm), and we see an average conical tilt of molecules within the simulated N TB phase (∼32°), similar to that seen experimentally (∼25°). We note that the simulated transition temperatures predictions are a little high ( T N TB N 440 K and T N I 465 K) in comparison to experiment ( T N TB N = 376 K and T N I = 389 K). Here, the discrepancy is due to the underlying atomistic model ( T N TB N = 435 K and T N I = 460 K), which predicts slightly too stiff molecules, resulting in slightly higher density for liquid crystal phases. However, capturing the spontaneous formation of a heliconical twist on cooling from the nematic represents a significant success for this coarse-grained model. The simulations show the significance of the average bent molecular shape in allowing the molecules to adopt a twisted superstructure, without significant changes in conformational distribution in comparison to the nematic phase. As we discussed above, the molecular flexibility is playing a significant role in destabilizing smectic phase formation and allowing the twist bend nematic structure to arise.
With the Martini 3 model, we were unable to capture the N TB phase. Here, the system loses the disorder seen in the bottom-up models and forms crystalline smectic ordering while retaining the molecular tilt and the precession of the tilt angle. However, models of this type may well be valuable in studying a range of new smectic phases, such as the heliconical tilted smectic C ( SmC TB ) phase [104].
In future work, it would be interesting to explore further the intermolecular forces that give rise to N TB behaviour. In many systems, subtle changes in phase behaviour are seen with small changes in chemical structure. A careful comparison study of the influence of intermolecular forces arising from different functional groups may well be informative in the molecular engineering of future compounds to either include (or exclude) the N TB phase in a sequence of liquid crystal phases.

Supplementary Materials

The following supporting information can be downloaded at: https://www.mdpi.com/article/10.3390/cryst13030502/s1, Figure S1: Simulation snapshots for 512 molecules of the FM CG model, obtained via cooling from an isotropic liquid. Results show: (a) the initial I phase at 470 K, (b) the N phase at 450 K, (c) the N TB phase at 370 K, (d) the average orientational order parameter, S 2 , for unit vectors a ^ and b ^ obtained from a cooling run starting in the I phase between the temperatures 470–370 K., Figure S2: Bend angle distribution function calculated from the angle between rigid mesogenic units. Simulations taken from the bulk phase simulation of the FM CG model at 370 K.

Author Contributions

Conceptualization, M.R.W.; methodology, G.Y. and M.R.W.; software, G.Y.; validation, G.Y. and M.R.W.; formal analysis, G.Y.; investigation, G.Y. and M.R.W.; resources, M.R.W.; data curation, G.Y. and M.R.W.; writing—original draft preparation, G.Y.; writing—review and editing, M.R.W.; visualization, G.Y.; supervision, M.R.W.; project administration, M.R.W.; funding acquisition, M.R.W. All authors have read and agreed to the published version of the manuscript.

Funding

This research was part-funded by EPSRC in the UK: EPSRC grant EP/R513039/1 funding a studentship for Gary Yu. This work made use of the facilities of the N8 Centre of Excellence in Computationally Intensive Research (N8 CIR) provided and funded by the N8 research partnership and EPSRC (Grant No. EP/T022167/1). The Centre is co-ordinated by the Universities of Durham, Manchester and York.

Data Availability Statement

ESI is included covering order parameter data from cooling runs of the FM model, snapshots of the FM N TB , N and I phases and the bend angle distribution function.

Conflicts of Interest

The authors declare no conflict of interest. The funders had no role in the design of the study; in the collection, analyses, or interpretation of data; in the writing of the manuscript, or in the decision to publish the results.

References

  1. Zannoni, C. Liquid Crystals and Their Computer Simulations; Cambridge University Press: Cambridge, UK, 2022. [Google Scholar]
  2. Freiser, M. Ordered states of a nematic liquid. Phys. Rev. Lett. 1970, 24, 1041. [Google Scholar] [CrossRef]
  3. Brochard, F.; De Gennes, P. Theory of magnetic suspensions in liquid crystals. J. Phys. 1970, 31, 691–708. [Google Scholar] [CrossRef] [Green Version]
  4. Dozov, I. On the spontaneous symmetry breaking in the mesophases of achiral banana-shaped molecules. Europhys. Lett. 2001, 56, 247–253. [Google Scholar] [CrossRef]
  5. Mandle, R.J.; Cowling, S.J.; Goodby, J.W. A nematic to nematic transformation exhibited by a rod-like liquid crystal. Phys. Chem. Chem. Phys. 2017, 19, 11429–11435. [Google Scholar] [CrossRef] [Green Version]
  6. Nishikawa, H.; Shiroshita, K.; Higuchi, H.; Okumura, Y.; Haseba, Y.; Yamamoto, S.i.; Sago, K.; Kikuchi, H. A fluid liquid-crystal material with highly polar order. Adv. Mater. 2017, 29, 1702354. [Google Scholar] [CrossRef] [PubMed]
  7. Mertelj, A.; Cmok, L.; Sebastián, N.; Mandle, R.J.; Parker, R.R.; Whitwood, A.C.; Goodby, J.W.; Čopič, M. Splay nematic phase. Phys. Rev. X 2018, 8, 041025. [Google Scholar] [CrossRef] [Green Version]
  8. Borshch, V.; Kim, Y.K.; Xiang, J.; Gao, M.; Jákli, A.; Panov, V.P.; Vij, J.K.; Imrie, C.T.; Tamba, M.G.; Mehl, G.H.; et al. Nematic twist-bend phase with nanoscale modulation of molecular orientation. Nat. Comuun. 2013, 4, 2635. [Google Scholar] [CrossRef] [Green Version]
  9. Walker, R.; Pociecha, D.; Martinez-Felipe, A.; Storey, J.M.D.; Gorecka, E.; Imrie, C.T. Twist-Bend Nematogenic Supramolecular Dimers and Trimers Formed by Hydrogen Bonding. Crystals 2020, 10, 175. [Google Scholar] [CrossRef] [Green Version]
  10. Severing, K.; Saalwächter, K. Biaxial nematic phase in a thermotropic liquid-crystalline side-chain polymer. Phys. Rev. Lett. 2004, 92, 125501. [Google Scholar] [CrossRef]
  11. Yu, L.; Saupe, A. Observation of a biaxial nematic phase in potassium laurate-1-decanol-water mixtures. Phys. Rev. Lett. 1980, 45, 1000. [Google Scholar] [CrossRef] [Green Version]
  12. Mertelj, A.; Lisjak, D.; Drofenik, M.; Čopič, M. Ferromagnetism in suspensions of magnetic platelets in liquid crystal. Nature 2013, 504, 237–241. [Google Scholar] [CrossRef]
  13. Kotni, R.; Grau-Carbonell, A.; Chiappini, M.; Dijkstra, M.; van Blaaderen, A. Splay-bend nematic phases of bent colloidal silica rods induced by polydispersity. Nat. Commun. 2022, 13, 7264. [Google Scholar] [CrossRef] [PubMed]
  14. Fernández-Rico, C.; Chiappini, M.; Yanagishima, T.; de Sousa, H.; Aarts, D.G.; Dijkstra, M.; Dullens, R.P. Shaping colloidal bananas to reveal biaxial, splay-bend nematic, and smectic phases. Science 2020, 369, 950–955. [Google Scholar] [CrossRef] [PubMed]
  15. Cestari, M.; Diez-Berart, S.; Dunmur, D.; Ferrarini, A.; de La Fuente, M.; Jackson, D.; Lopez, D.; Luckhurst, G.; Perez-Jubindo, M.; Richardson, R.; et al. Phase behavior and properties of the liquid-crystal dimer 1″, 7″-bis (4-cyanobiphenyl-4′-yl) heptane: A twist-bend nematic liquid crystal. Phys. Rev. E 2011, 84, 031704. [Google Scholar] [CrossRef] [PubMed] [Green Version]
  16. Meyer, R.B. Les Houches Summer School in Theoretical Physics; Gordon and Breach: New York, NY, USA, 1976; pp. 273–373. [Google Scholar]
  17. Meyer, C.; Luckhurst, G.R.; Dozov, I. Flexoelectrically Driven Electroclinic Effect in the Twist-Bend Nematic Phase of Achiral Molecules with Bent Shapes. Phys. Rev. Lett. 2013, 111, 067801. [Google Scholar] [CrossRef]
  18. Chen, D.; Porada, J.H.; Hooper, J.B.; Klittnick, A.; Shen, Y.; Tuchband, M.R.; Korblova, E.; Bedrov, D.; Walba, D.M.; Glaser, M.A.; et al. Chiral heliconical ground state of nanoscale pitch in a nematic liquid crystal of achiral molecular dimers. Proc. Natl. Acad. Sci. USA 2013, 110, 15931–15936. [Google Scholar] [CrossRef] [Green Version]
  19. Sepelj, M.; Lesac, A.; Baumeister, U.; Diele, S.; Nguyen, H.L.; Bruce, D.W. Intercalated liquid-crystalline phases formed by symmetric dimers with an α,ω-diiminoalkylene spacer. J. Mater. Chem. 2007, 17, 1154–1165. [Google Scholar] [CrossRef]
  20. Panov, V.P.; Nagaraj, M.; Vij, J.K.; Panarin, Y.P.; Kohlmeier, A.; Tamba, M.G.; Lewis, R.A.; Mehl, G.H. Spontaneous Periodic Deformations in Nonchiral Planar-Aligned Bimesogens with a Nematic-Nematic Transition and a Negative Elastic Constant. Phys. Rev. Lett. 2010, 105, 167801. [Google Scholar] [CrossRef] [Green Version]
  21. Henderson, P.A.; Imrie, C.T. Methylene-linked liquid crystal dimers and the twist-bend nematic phase. Liq. Cryst. 2011, 38, 1407–1414. [Google Scholar] [CrossRef]
  22. Adlem, K.; Čopič, M.; Luckhurst, G.R.; Mertelj, A.; Parri, O.; Richardson, R.M.; Snow, B.D.; Timimi, B.A.; Tuffin, R.P.; Wilkes, D. Chemically induced twist-bend nematic liquid crystals, liquid crystal dimers, and negative elastic constants. Phys. Rev. E 2013, 88, 022503. [Google Scholar] [CrossRef]
  23. Mandle, R.J.; Davis, E.J.; Lobato, S.A.; Vol, C.C.A.; Cowling, S.J.; Goodby, J.W. Synthesis and characterisation of an unsymmetrical, ether-linked, fluorinated bimesogen exhibiting a new polymorphism containing the NTB or ‘twist-bend’ phase. Phys. Chem. Chem. Phys. 2014, 16, 6907–6915. [Google Scholar] [CrossRef] [PubMed]
  24. Mandle, R.J.; Davis, E.J.; Archbold, C.T.; Cowling, S.J.; Goodby, J.W. Microscopy studies of the nematic NTB phase of 1,11-di-(1″-cyanobiphenyl-4-yl)undecane. J. Mater. Chem. C 2014, 2, 556–566. [Google Scholar] [CrossRef]
  25. Mandle, R.J.; Davis, E.J.; Archbold, C.T.; Voll, C.C.A.; Andrews, J.L.; Cowling, S.J.; Goodby, J.W. Apolar Bimesogens and the Incidence of the Twist–Bend Nematic Phase. Chem.—Eur. J. 2015, 21, 8158–8167. [Google Scholar] [CrossRef]
  26. Gorecka, E.; Vaupotic, N.; Zep, A.; Pociecha, D.; Yoshioka, J.; Yamamoto, J.; Takezoe, H. A Twist-Bend Nematic (NTB) Phase of Chiral Materials. Angew. Chem. Int. Ed. 2015, 54, 10155–10159. [Google Scholar] [CrossRef] [PubMed]
  27. Paterson, D.A.; Gao, M.; Kim, Y.K.; Jamali, A.; Finley, K.L.; Robles-Hernández, B.; Diez-Berart, S.; Salud, J.; de la Fuente, M.R.; Timimi, B.A.; et al. Understanding the twist-bend nematic phase: The characterisation of 1-(4-cyanobiphenyl-4′-yloxy)-6-(4-cyanobiphenyl-4′-yl)hexane (CB6OCB) and comparison with CB7CB. Soft Matter 2016, 12, 6827–6840. [Google Scholar] [CrossRef] [PubMed] [Green Version]
  28. Paterson, D.A.; Abberley, J.P.; Harrison, W.T.A.; Storey, J.M.D.; Imrie, C.T. Cyanobiphenyl-based liquid crystal dimers and the twist-bend nematic phase. Liq. Cryst. 2017, 44, 127–146. [Google Scholar] [CrossRef]
  29. Chen, D.; Nakata, M.; Shao, R.; Tuchband, M.R.; Shuai, M.; Baumeister, U.; Weissflog, W.; Walba, D.M.; Glaser, M.A.; Maclennan, J.E.; et al. Twist-bend heliconical chiral nematic liquid crystal phase of an achiral rigid bent-core mesogen. Phys. Rev. E 2014, 89, 022506. [Google Scholar] [CrossRef] [Green Version]
  30. Sreenilayam, S.P.; Panov, V.P.; Vij, J.K.; Shanker, G. The NTB phase in an achiral asymmetrical bent-core liquid crystal terminated with symmetric alkyl chains. Liq. Cryst. 2017, 44, 244–253. [Google Scholar] [CrossRef]
  31. Jansze, S.M.; Martínez-Felipe, A.; Storey, J.M.D.; Marcelis, A.T.M.; Imrie, C.T. A Twist-Bend Nematic Phase Driven by Hydrogen Bonding. Angew. Chem. Int. Ed. 2015, 54, 643–646. [Google Scholar] [CrossRef]
  32. Walker, R.; Pociecha, D.; Abberley, J.P.; Martinez-Felipe, A.; Paterson, D.A.; Forsyth, E.; Lawrence, G.B.; Henderson, P.A.; Storey, J.M.D.; Gorecka, E.; et al. Spontaneous chirality through mixing achiral components: A twist-bend nematic phase driven by hydrogen-bonding between unlike components. Chem. Commun. 2018, 54, 3383–3386. [Google Scholar] [CrossRef]
  33. Walker, R.; Pociecha, D.; Salamończyk, M.; Storey, J.M.D.; Gorecka, E.; Imrie, C.T. Supramolecular liquid crystals exhibiting a chiral twist-bend nematic phase. Mater. Adv. 2020, 1, 1622–1630. [Google Scholar] [CrossRef]
  34. Xiang, J.; Li, Y.; Li, Q.; Paterson, D.A.; Storey, J.M.D.; Imrie, C.T.; Lavrentovich, O.D. Electrically Tunable Selective Reflection of Light from Ultraviolet to Visible and Infrared by Heliconical Cholesterics. Adv. Mater. 2015, 27, 3014–3018. [Google Scholar] [CrossRef] [PubMed] [Green Version]
  35. Xiang, J.; Varanytsia, A.; Minkowski, F.; Paterson, D.A.; Storey, J.M.D.; Imrie, C.T.; Lavrentovich, O.D.; Palffy-Muhoray, P. Electrically tunable laser based on oblique heliconical cholesteric liquid crystal. Proc. Natl. Acad. Sci. USA 2016, 113, 12925–12928. [Google Scholar] [CrossRef] [PubMed] [Green Version]
  36. Mrukiewicz, M.; Iadlovska, O.S.; Babakhanova, G.; Siemianowski, S.; Shiyanovskii, S.V.; Lavrentovich, O.D. Wide temperature range of an electrically tunable selective reflection of light by oblique helicoidal cholesteric. Liq. Cryst. 2019, 46, 1544–1550. [Google Scholar] [CrossRef]
  37. Prasad, S.K.; Madhuri, P.L.; Satapathy, P.; Yelamaggad, C.V. A soft-bent dimer composite exhibiting twist-bend nematic phase: Photo-driven effects and an optical memory device. Appl. Phys. Lett. 2018, 112, 253701. [Google Scholar] [CrossRef]
  38. Sridurai, V.; Kanakala, M.B.; Yelamaggad, C.V.; Nair, G.G. Effect of gelation on the Frank elastic constants in a liquid crystalline mixture exhibiting a twist bend nematic phase. Soft Matter 2019, 15, 9982–9990. [Google Scholar] [CrossRef]
  39. Aya, S.; Salamon, P.; Paterson, D.A.; Storey, J.M.; Imrie, C.T.; Araoka, F.; Jákli, A.; Buka, Á. Fast-and-giant photorheological effect in a liquid crystal dimer. Adv. Mater. Interfaces 2019, 6, 1802032. [Google Scholar] [CrossRef] [Green Version]
  40. Feng, C.; Feng, J.; Saha, R.; Arakawa, Y.; Gleeson, J.; Sprunt, S.; Zhu, C.; Jákli, A. Manipulation of the nanoscale heliconical structure of a twist-bend nematic material with polarized light. Phys. Rev. Res. 2020, 2, 032004. [Google Scholar] [CrossRef]
  41. Wilson, M.R.; Yu, G.; Potter, T.D.; Walker, M.; Gray, S.J.; Li, J.; Boyd, N.J. Molecular Simulation Approaches to the Study of Thermotropic and Lyotropic Liquid Crystals. Crystals 2022, 12, 685. [Google Scholar] [CrossRef]
  42. Allen, M.P. Molecular simulation of liquid crystals. Mol. Phys. 2019, 117, 2391–2417. [Google Scholar] [CrossRef] [Green Version]
  43. Wilson, M.R. Progress in computer simulations of liquid crystals. Int. Rev. Phys. Chem. 2005, 24, 421–455. [Google Scholar] [CrossRef]
  44. Wilson, M.R. Molecular simulation of liquid crystals: Progress towards a better understanding of bulk structure and the prediction of material properties. Chem. Soc. Rev. 2007, 36, 1881–1888. [Google Scholar] [CrossRef] [PubMed] [Green Version]
  45. Peláez, J.; Wilson, M.R. Atomistic Simulations of a Thermotropic Biaxial Liquid Crystal. Phys. Rev. Lett. 2006, 97, 267801. [Google Scholar] [CrossRef] [PubMed] [Green Version]
  46. Chami, F.; Wilson, M.R. Molecular order in a chromonic liquid crystal: A molecular simulation study of the anionic azo dye sunset yellow. J. Am. Chem. Soc. 2010, 132, 7794–7802. [Google Scholar] [CrossRef] [PubMed]
  47. Boyd, N.J.; Wilson, M.R. Optimization of the GAFF force field to describe liquid crystal molecules: The path to a dramatic improvement in transition temperature predictions. Phys. Chem. Chem. Phys. 2015, 17, 24851–24865. [Google Scholar] [CrossRef] [Green Version]
  48. Boyd, N.J.; Wilson, M.R. Validating an optimized GAFF force field for liquid crystals: TNI predictions for bent-core mesogens and the first atomistic predictions of a dark conglomerate phase. Phys. Chem. Chem. Phys. 2018, 20, 1485–1496. [Google Scholar] [CrossRef] [Green Version]
  49. Yu, G.; Walker, M.; Wilson, M.R. Atomistic simulation studies of ionic cyanine dyes: Self-assembly and aggregate formation in aqueous solution. Phys. Chem. Chem. Phys. 2021, 23, 6408–6421. [Google Scholar] [CrossRef]
  50. Chami, F.; Wilson, M.; Oganesyan, V. Molecular dynamics and EPR spectroscopic studies of 8CB liquid crystal. Soft Matter 2012, 8, 6823–6833. [Google Scholar] [CrossRef]
  51. Zannoni, C. From idealised to predictive models of liquid crystals. Liq. Cryst. 2018, 45, 1880–1893. [Google Scholar] [CrossRef]
  52. McGrother, S.C.; Williamson, D.C.; Jackson, G. A re-examination of the phase diagram of hard spherocylinders. J. Chem. Phys. 1996, 104, 6755–6771. [Google Scholar] [CrossRef]
  53. Allen, M.P.; Warren, M.A.; Wilson, M.R. Molecular-dynamics simulation of the smectic-A* twist grain-boundary phase. Phys. Rev. E 1998, 57, 5585. [Google Scholar] [CrossRef] [Green Version]
  54. Duncan, P.D.; Dennison, M.; Masters, A.J.; Wilson, M.R. Theory and computer simulation for the cubatic phase of cut spheres. Phys. Rev. E 2009, 79, 031702. [Google Scholar] [CrossRef] [Green Version]
  55. Wilson, M.R.; Duncan, P.D.; Dennison, M.; Masters, A.J. Molecular dynamics simulation studies of platelets with square cross-sectional area: Formation of a stable cubatic phase. Soft Matter 2012, 8, 3348–3356. [Google Scholar] [CrossRef]
  56. Wilson, M.; Allen, M. Computer simulation study of liquid crystal formation in a semi-flexible system of linked hard spheres. Mol. Phys. 1993, 80, 277–295. [Google Scholar] [CrossRef]
  57. Lintuvuori, J.S.; Yu, G.; Walker, M.; Wilson, M.R. Emergent chirality in achiral liquid crystals: Insights from molecular simulation models of the behaviour of bent-core mesogens. Liq. Cryst. 2018, 45, 1996–2009. [Google Scholar] [CrossRef]
  58. Cook, M.J.; Wilson, M.R. Simulation studies of dipole correlation in the isotropic liquid phase. Liq. Cryst. 2000, 27, 1573–1583. [Google Scholar] [CrossRef]
  59. Cook, M.J.; Wilson, M.R. The First Thousand-Molecule Simulation of a Mesogen at the Fully Atomistic Level. Mol. Cryst. Liq. Cryst. 2001, 363, 181–193. [Google Scholar] [CrossRef]
  60. Fegan, S.K.; Kirsch, P.; Müller-Plathe, F. The alignment of dichroic dyes in a nematic liquid crystal: A molecular dynamics investigation. Liq. Cryst. 2018, 45, 1377–1384. [Google Scholar] [CrossRef]
  61. Sims, M.T.; Mandle, R.J.; Goodby, J.W.; Moore, J.N. Guest–host systems containing anthraquinone dyes with multiple visible transitions giving positive and negative dichroic order parameters: An assessment of principal molecular axes and computational methods. Liq. Cryst. 2017, 44, 2029–2045. [Google Scholar] [CrossRef] [Green Version]
  62. Humpert, A.; Allen, M.P. Elastic constants and dynamics in nematic liquid crystals. Mol. Phys. 2015, 113, 2680–2692. [Google Scholar] [CrossRef]
  63. Stelzer, J.; Berardi, R.; Zannoni, C. Flexoelectric coefficients for model pear shaped molecules from monte carlo simulations. Mol. Cryst. Liq. Cryst. 2000, 352, 187–194. [Google Scholar] [CrossRef]
  64. Cheung, D.L.; Clark, S.J.; Wilson, M.R. Calculation of flexoelectric coefficients for a nematic liquid crystal by atomistic simulation. J. Chem. Phys. 2004, 121, 9131–9139. [Google Scholar] [CrossRef] [PubMed] [Green Version]
  65. Allen, M.P. Diffusion coefficient increases with density in hard ellipsoid liquid crystals. Phys. Rev. Lett. 1990, 65, 2881. [Google Scholar] [CrossRef] [PubMed]
  66. Cheung, D.L.; Clark, S.J.; Wilson, M.R. Calculation of the rotational viscosity of a nematic liquid crystal. Chem. Phys. Lett. 2002, 356, 140–146. [Google Scholar] [CrossRef]
  67. Greco, C.; Ferrarini, A. Entropy-Driven Chiral Order in a System of Achiral Bent Particles. Phys. Rev. Lett. 2015, 115, 147801. [Google Scholar] [CrossRef]
  68. Yu, G.; Wilson, M.R. All-atom simulations of bent liquid crystal dimers: The twist-bend nematic phase and insights into conformational chirality. Soft Matter 2022, 18, 3087–3096. [Google Scholar] [CrossRef]
  69. Mandle, R.J. A Ten-Year Perspective on Twist-Bend Nematic Materials. Molecules 2022, 27, 2689. [Google Scholar] [CrossRef]
  70. Mandle, R.J.; Archbold, C.T.; Sarju, J.P.; Andrews, J.L.; Goodby, J.W. The dependency of nematic and twist-bend mesophase formation on bend angle. Sci. Rep. 2016, 6, 36682. [Google Scholar] [CrossRef] [Green Version]
  71. Panov, V.P.; Vij, J.K.; Mehl, G.H. Twist-bend nematic phase in cyanobiphenyls and difluoroterphenyls bimesogens. Liq. Cryst. 2017, 44, 147–159. [Google Scholar]
  72. Shadpour, S.; Nemati, A.; Boyd, N.J.; Li, L.; Prévôt, M.E.; Wakerlin, S.L.; Vanegas, J.P.; Salamończyk, M.; Hegmann, E.; Zhu, C.; et al. Heliconical-layered nanocylinders (HLNCs)—Hierarchical self-assembly in a unique B4 phase liquid crystal morphology. Mater. Horiz. 2019, 6, 959–968. [Google Scholar] [CrossRef] [Green Version]
  73. Shadpour, S.; Nemati, A.; Salamończyk, M.; Prévôt, M.E.; Liu, J.; Boyd, N.J.; Wilson, M.R.; Zhu, C.; Hegmann, E.; Jákli, A.I.; et al. Missing Link between Helical Nano- and Microfilaments in B4 Phase Bent-Core Liquid Crystals, and Deciphering which Chiral Center Controls the Filament Handedness. Small 2020, 16, 1905591. [Google Scholar] [CrossRef]
  74. Ruhle, V.; Junghans, C.; Lukyanov, A.; Kremer, K.; Andrienko, D. Versatile object-oriented toolkit for coarse-graining applications. J. Chem. Theory Comput. 2009, 5, 3211–3223. [Google Scholar] [CrossRef]
  75. Rühle, V.; Junghans, C. Hybrid Approaches to Coarse-Graining using the VOTCA Package: Liquid Hexane. Macromol. Theory Simul. 2011, 20, 472–477. [Google Scholar] [CrossRef]
  76. Mashayak, S.; Jochum, M.N.; Koschke, K.; Aluru, N.; Rühle, V.; Junghans, C. Relative entropy and optimization-driven coarse-graining methods in VOTCA. PLoS ONE 2015, 10, e0131754. [Google Scholar] [CrossRef]
  77. Liu, P.; Izvekov, S.; Voth, G.A. Multiscale coarse-graining of monosaccharides. J. Phys. Chem. B 2007, 111, 11566–11575. [Google Scholar] [CrossRef] [PubMed]
  78. Dunn, N.J.; Lebold, K.M.; DeLyser, M.R.; Rudzinski, J.F.; Noid, W. BOCS: Bottom-up open-source coarse-graining software. J. Phys. Chem. B 2017, 122, 3363–3377. [Google Scholar] [CrossRef] [PubMed]
  79. Potter, T.D.; Tasche, J.; Wilson, M.R. Assessing the transferability of common top-down and bottom-up coarse-grained molecular models for molecular mixtures. Phys. Chem. Chem. Phys. 2019, 21, 1912–1927. [Google Scholar] [CrossRef] [Green Version]
  80. Yu, G.; Wilson, M.R. Molecular simulation studies of self-assembly for a chromonic perylene dye: All-atom studies and new approaches to coarse-graining. J. Mol. Liq. 2022, 345, 118210. [Google Scholar] [CrossRef]
  81. Potter, T.D.; Walker, M.; Wilson, M.R. Self-assembly and mesophase formation in a non-ionic chromonic liquid crystal: Insights from bottom-up and top-down coarse-grained simulation models. Soft Matter 2020, 16, 9488–9498. [Google Scholar] [CrossRef] [PubMed]
  82. Souza, P.C.; Alessandri, R.; Barnoud, J.; Thallmair, S.; Faustino, I.; Grünewald, F.; Patmanidis, I.; Abdizadeh, H.; Bruininks, B.M.; Wassenaar, T.A.; et al. Martini 3: A general purpose force field for coarse-grained molecular dynamics. Nat. Methods 2021, 18, 382–388. [Google Scholar] [CrossRef]
  83. Martini Open Beta. Available online: http://cgmartini.nl/index.php/martini3beta (accessed on 13 February 2023).
  84. De Jong, D.H.; Baoukina, S.; Ingólfsson, H.I.; Marrink, S.J. Martini straight: Boosting performance using a shorter cutoff and GPUs. Comput. Phys. Commun. 2016, 199, 1–7. [Google Scholar] [CrossRef]
  85. Cheung, D.; Clark, S.; Wilson, M.R. Parametrization and validation of a force field for liquid-crystal forming molecules. Phys. Rev. E 2002, 65, 051709. [Google Scholar] [CrossRef] [Green Version]
  86. Bennett, C.H. Efficient estimation of free energy differences from Monte Carlo data. J. Comput. Phys. 1976, 22, 245–268. [Google Scholar] [CrossRef]
  87. Yu, G. Multiscale Modelling of Self-Assembly in Soft Matter. Ph.D. Thesis, Durham University, Durham, UK, 2022. [Google Scholar]
  88. Wang, L.P.; Martinez, T.J.; Pande, V.S. Building force fields: An automatic, systematic, and reproducible approach. J. Phys. Chem. Lett. 2014, 5, 1885–1891. [Google Scholar] [CrossRef] [PubMed]
  89. Avendaño, C.; Lafitte, T.; Galindo, A.; Adjiman, C.S.; Jackson, G.; Müller, E.A. SAFT-γ Force Field for the Simulation of Molecular Fluids. 1. A Single-Site Coarse Grained Model of Carbon Dioxide. J. Phys. Chem. B 2011, 115, 11154–11169. [Google Scholar] [CrossRef]
  90. Lafitte, T.; Avendaño, C.; Papaioannou, V.; Galindo, A.; Adjiman, C.S.; Jackson, G.; Müller, E.A. SAFT-γ force field for the simulation of molecular fluids: 3. Coarse-grained models of benzene and hetero-group models of n-decylbenzene. Mol. Phys. 2012, 110, 1189–1203. [Google Scholar] [CrossRef]
  91. Avendaño, C.; Lafitte, T.; Adjiman, C.S.; Galindo, A.; Müller, E.A.; Jackson, G. SAFT-γ Force Field for the Simulation of Molecular Fluids: 2. Coarse-Grained Models of Greenhouse Gases, Refrigerants, and Long Alkanes. J. Phys. Chem. B 2013, 117, 2717–2733. [Google Scholar] [CrossRef]
  92. Tasche, J.; Sabattié, E.F.; Thompson, R.L.; Campana, M.; Wilson, M.R. Oligomer/polymer blend phase diagram and surface concentration profiles for squalane/polybutadiene: Experimental measurements and predictions from SAFT-γ Mie and molecular dynamics simulations. Macromolecules 2020, 53, 2299–2309. [Google Scholar] [CrossRef]
  93. Potter, T.D.; Tasche, J.; Barrett, E.L.; Walker, M.; Wilson, M.R. Development of new coarse-grained models for chromonic liquid crystals: Insights from top-down approaches. Liq. Cryst. 2017, 44, 1979–1989. [Google Scholar]
  94. Evans, F.; Skinner, H. The heats of combustion of organic compounds of nitrogen. Part 2.—n-Propyl, iso propyl and phenyl cyanides. Trans. Faraday Soc. 1959, 55, 255–259. [Google Scholar] [CrossRef]
  95. Van Ness, H.C.; Soczek, C.; Peloquin, G.; Machado, R. Thermodynamic excess properties of three alcohol-hydrocarbon systems. J. Chem. Eng. Data 1967, 12, 217–224. [Google Scholar] [CrossRef]
  96. Wang, H.; Stillinger, F.H.; Torquato, S. Sensitivity of pair statistics on pair potentials in many-body systems. J. Chem. Phys. 2020, 153, 124106. [Google Scholar] [CrossRef]
  97. Meyer, C.; Luckhurst, G.R.; Dozov, I. The temperature dependence of the heliconical tilt angle in the twist-bend nematic phase of the odd dimer CB7CB. J. Mater. Chem. C 2015, 3, 318–328. [Google Scholar] [CrossRef]
  98. Singh, G.; Fu, J.; Agra-Kooijman, D.M.; Song, J.K.; Vengatesan, M.R.; Srinivasarao, M.; Fisch, M.R.; Kumar, S. X-ray and Raman scattering study of orientational order in nematic and heliconical nematic liquid crystals. Phys. Rev. E 2016, 94, 060701. [Google Scholar] [CrossRef] [Green Version]
  99. Chiappini, M.; Drwenski, T.; van Roij, R.; Dijkstra, M. Biaxial, Twist-bend, and Splay-bend Nematic Phases of Banana-shaped Particles Revealed by Lifting the “Smectic Blanket”. Phys. Rev. Lett. 2019, 123, 068001. [Google Scholar] [CrossRef] [PubMed]
  100. Reddy, R.A.; Zhu, C.; Shao, R.; Korblova, E.; Gong, T.; Shen, Y.; Garcia, E.; Glaser, M.A.; Maclennan, J.E.; Walba, D.M.; et al. Spontaneous ferroelectric order in a bent-core smectic liquid crystal of fluid orthorhombic layers. Science 2011, 332, 72–77. [Google Scholar] [CrossRef]
  101. Osipov, M.A.; Pajak, G. Molecular theory of proper ferroelectricity in bent-core liquid crystals. Eur. Phys. J. E 2014, 37, 1–7. [Google Scholar] [CrossRef] [Green Version]
  102. Lavrentovich, O.D. Ferroelectric nematic liquid crystal, a century in waiting. Proc. Natl. Acad. Sci. USA 2020, 117, 14629–14631. [Google Scholar] [CrossRef]
  103. Mandle, R.J.; Sebastián, N.; Martinez-Perdiguero, J.; Mertelj, A. On the molecular origins of the ferroelectric splay nematic phase. Nat. Commun. 2021, 12, 4962. [Google Scholar] [CrossRef]
  104. Abberley, J.P.; Killah, R.; Walker, R.; Storey, J.M.D.; Imrie, C.T.; Salamończyk, M.; Zhu, C.; Gorecka, E.; Pociecha, D. Heliconical smectic phases formed by achiral molecules. Nat. Commun. 2018, 9, 228. [Google Scholar] [CrossRef] [Green Version]
  105. Walker, R.; Pociecha, D.; Strachan, G.J.; Storey, J.M.D.; Gorecka, E.; Imrie, C.T. Molecular curvature, specific intermolecular interactions and the twist-bend nematic phase: The synthesis and characterisation of the 1-(4-cyanobiphenyl-4′-yl)-6-(4-alkylanilinebenzylidene-4′-oxy)hexanes (CB6O.m). Soft Matter 2019, 15, 3188–3197. [Google Scholar] [CrossRef] [PubMed] [Green Version]
  106. Salamończyk, M.; Vaupotič, N.; Pociecha, D.; Walker, R.; Storey, J.M.D.; Imrie, C.T.; Wang, C.; Zhu, C.; Gorecka, E. Multi-level chirality in liquid crystals formed by achiral molecules. Nat. Commun. 2019, 10, 1922. [Google Scholar] [CrossRef] [PubMed] [Green Version]
  107. Stone, A.J. The description of bimolecular potentials, forces and torques: The S and V function expansions. Mol. Phys. 1978, 36, 241–256. [Google Scholar] [CrossRef]
  108. Vanakaras, A.G.; Photinos, D.J. Molecular dynamics simulations of nematic phases formed by cyano-biphenyl dimers. Liq. Cryst. 2018, 45, 2184–2196. [Google Scholar] [CrossRef] [Green Version]
Figure 1. (Top): Snapshot conformation of a single CB7CB molecule showing the 3D atomistic structure. (Bottom): Coarse-grained mapping scheme showing the three types of coarse-grained beads used in this work (termed N, C, O). Each bead incorporates heavy atoms and attached hydrogens.
Crystals 13 00502 g001
Figure 2. Coarse−grained nonbonded potentials obtained from IBI and FM for CB7CB at 370 K.
Crystals 13 00502 g002
Figure 3. Simulation snapshots of coarse-grained models of CB7CB at 370 K for the FM, IBI and Martini 3 CG models. (Top): Colouring by molecular orientation. (Bottom): Colouring according to bead type.
Crystals 13 00502 g003
Figure 4. Temperature dependence of the orientational order parameter, S 2 , for unit vectors a ^ and b ^ for the FM CG model.
Crystals 13 00502 g004
Figure 5. Simulation snapshots from a 4096−molecule system of the FM CG model, with (a) orientational and (b) bead-type colourings. (c) Orientational correlation ( S b b ) as a function of the helical axis, r , and the (d) distribution of the conical tilt angle, θ .
Crystals 13 00502 g005
Table 1. Enthalpies of vaporization ( Δ vap H /kJ mol 1 ) and free energies of solvation Δ sol G /kJ mol 1 ) for all-atom GAFF (AA) and Martini 3 CG models of cyanobiphenyl/heptane mixtures.
PropertyExperimentAA ModelMartini 3
Δ vap H (cyanobiphenyl)55.5 [94] 52.3 ± 0.4 47.5 ± 0.4
Δ vap H (heptane)36.4 [95] 38.5 ± 0.5 38.7 ± 0.4
Δ sol G (cyanobiphenyl, x CB = 1 ) 38.4 ± 0.10 31.91 ± 0.06
Δ sol G (heptane, x heptane = 1 19.81 ± 0.14 27.4 ± 0.2
Δ sol G (cyanobiphenyl, x CB = 0.5 ) 32.9 ± 0.3 30.49 ± 0.07
Δ sol G (heptane, x CB = 0.5 ) 22.5 ± 0.2 26.91 ± 0.08
Table 2. Bond parameters for CG models of CB7CB.
AtomsLength/nm K r /kJ mol 1  nm 2
N–O0.2515,000
C–C0.2215,000
C–O0.2410,000
O–O0.3210,000
Table 3. Angle parameters for CG models of CB7CB.
AtomsAngle/deg K θ /kJ mol 1 deg 2
N–C–C1805000
C–C–C1805000
C–C–O170750
C–O–O170750
O–O–O170750
Table 4. Dihedral angle parameters for the CG models of CB7CB.
AtomsDihedral/deg K ϕ /kJ mol 1
C–C–O–O18025
C–O–O–O18025
Table 5. The order parameters ( S 2 a and S 2 b ), helical pitch (p) and conical tilt angle ( θ ) for the AA and 3 CG models of CB7CB at 370 K.
Model S 2 a S 2 b p/nmθ
AA0.360.168.3529
FM0.440.188.3532
IBI0.510.288.4231
Martini 30.490.30 8.532
Disclaimer/Publisher’s Note: The statements, opinions and data contained in all publications are solely those of the individual author(s) and contributor(s) and not of MDPI and/or the editor(s). MDPI and/or the editor(s) disclaim responsibility for any injury to people or property resulting from any ideas, methods, instructions or products referred to in the content.

