Article

Temperature Dependence of the Electroclinic Effect in the Twist-Bend Nematic Phase

1
Physique des systèmes complexes, Université de Picardie Jules Verne, 80039 Amiens, France
2
Laboratoire de Physique des Solides, Université Paris-Saclay, CNRS, 91405 Orsay, France
3
School of Chemistry, Faculty of Engineering and Physical Sciences, University of Southampton, Southampton SO17 1BJ, UK
4
Rudjer Boskovic Institute, Bijenicka 54, 10000 Zagreb, Croatia
5
School of Natural and Computing Sciences, Department of Chemistry, University of Aberdeen, Meston Building, Aberdeen AB24 3UE, UK
*
Author to whom correspondence should be addressed.
Crystals 2023, 13(3), 465; https://doi.org/10.3390/cryst13030465
Submission received: 12 February 2023 / Revised: 1 March 2023 / Accepted: 2 March 2023 / Published: 8 March 2023
(This article belongs to the Special Issue Nematic Liquid Crystal)

Abstract

:
The twist-bend nematic (NTB) phase of bent-shaped molecules has recently attracted much attention due to the spontaneous bend of its director field and the doubly-degenerate chirality of its heliconical structure. Despite intensive experimental and theoretical investigation worldwide, the main structural characteristics (pitch and conical angle) and elastic properties of the phase are still barely understood. This is mainly due to the difficulty in growing large single domains of the NTB phase, which prevents the application of the powerful electro-optical techniques developed for the nematic (N) phase. Moreover, the twist and bend distortions of the optic axis are forbidden by the pseudo-layered structure of the NTB phase, which makes its response to the field smectic-like instead of nematic-like. Therefore, the only macroscopic electric effect that can be observed deep in the NTB phase is the smectic-like “electroclinic” effect (ECENTB). Here, we achieve large monochiral NTB domains which remain uniform over a wide temperature range (20–60 °C) in thin (1.5 µm) planar cells, thus avoiding the so-called stripe- and rope-like textural instabilities. This allowed us to experimentally determine, using electro-optical measurements, the temperature dependence of the ECENTB response in four different NTB materials: namely the dimers CB7CB, CB9CB, CB6OCB, and BNA76. For all compounds, the thermal dependences of conical angle and pitch in the vicinity of the N-NTB transition follow the theoretically predicted power law behaviour. However, the agreement between the measured and predicted power law exponents remains only qualitative, which calls for improvement of the theoretical models.

1. Introduction

The most common liquid–crystalline phase, the nematic phase, is characterized by the orientational order of its anisotropic molecules and the absence of positional order. When the molecules are rod-like and achiral, they form the conventional nematic phase (N) in which the molecules orient with their long axes approximately oriented parallel to a common direction called the nematic director, n. In the ground state, the director is uniform but, under external constraints, it can be distorted, which gives rise to elastic distortion energy [1]:
f n = 1 2 { K 11 [ n ( n ) ] 2 + K 22 [ n ( × n ) ] 2 + K 33 [ n × ( × n ) ] 2 }
where K11, K22, and K33 are the elastic moduli for the three eigenmodes of the director distortion: splay n ( n ) , twist n ( × n ) , and bend n × ( × n ) , respectively.
When the molecules are chiral, they form chiral modifications of the nematic phase. In the most common one, the chiral nematic (or cholesteric), N*, the director is spontaneously twisted and the molecules are arranged on a right-angle helix with axis h, such that hn.
Yet other nematic phases are expected for molecules with shapes different from rod-like, e.g., biaxial molecules were predicted [2] to form a thermotropic biaxial nematic phase, Nb. Another long-standing theoretical prediction [3,4,5,6] was that bent-shaped molecules can form nematic phases with a spontaneously bent director, namely the splay-bend nematic, NSB, and twist-bend nematic, NTB, phases. Two distinct origins of the spontaneous bend have been proposed: either the coupling of a flexoelectric polarization with a transverse ferroelectric polarization of the nematic [3,4] or an elastic instability of the phase due to the natural tendency of the bent-shaped molecules to orient parallel to a curved director [5,6]. For a long time, neither of these arguments attracted much attention, until the NTB phase was experimentally identified in the bent-shaped mesogenic dimer CB7CB [7]. As predicted, the molecules in the NTB phase form a conical helix, with helix axis h, pitch p, and long molecular axis L parallel to the local director n, that is tilted at an angle θ, with respect, to h (see Figure 1). Moreover, the structure is locally biaxial, the curvature of the bent-shaped molecule matching the curvature of the director field and thus, the bend vector, b = n × ( × n ) (bn), is a secondary director of the nematic order tensor. Due to its heliconical structure, the NTB phase is chiral, even when it is formed by achiral molecules. The chiral symmetry of the phase is spontaneously broken [5] and two different structures are possible, with left or right-handedness of the conical helix. These chiral structures can coexist in the sample forming large monochiral domains suitable for optical and electro-optical observations [8,9,10].
The discovery of the NTB phase generated great interest and stimulated further chemical and physical studies. Hundreds of new bent-shaped mesogenic dimers presenting this phase have been synthesized (see [11,12] for recent reviews) and the NTB heliconical structure was confirmed [7,9,13,14,15,16,17,18,19,20] using a large number of techniques. X-ray scattering studies confirmed that the phase is indeed nematic, with no long-range positional order [7,14,21,22,23,24]. The early indirect prediction [9,25] of the extremely small pitch of the helix, p < 10 nm, was then quickly confirmed by direct freeze-fracture transmission electron microscopy studies [13,14] and later by resonant X-ray scattering experiments [18,19,26]. The values of p reported for different NTB-forming compounds are always of the order of 10 nm and slowly decrease with decreasing temperature.
The second important structural parameter of the phase, the conical tilt angle θ, has also been measured for a few compounds [10,13,17,27]. It is small at the N-NTB transition, θ < 10° for CB7CB, and even close to zero when the phase transition is very weak first order. As theoretically expected, θ increases up to 30–40° far below the transition temperature.
Despite its lack of long-range positional order, due to its layered structure, the NTB phase behaves in several aspects as a smectic (Sm) phase. It shows typical smectic textures, such as focal-conics, fan-shaped textures, and stripe- and rope-textures [7], both in sandwich cells and as free drops. In biphasic coexistence with the conventional nematic phase, the NTB phase forms structures almost identical to the “bâtonnets” observed during the growth of the smectic A (SmA) phase from an isotropic melt [28]. The macroscopic elastic properties of the NTB phase and its response to external fields are also smectic-like [7,9,29,30,31]. This prevents applying to it the efficient and accurate electric and electro-optical techniques developed for the conventional nematic phase, thus limiting the choice of tools available to investigate its physical properties.
This smectic-like behaviour has been shown to result from the pseudo-layered structure of the NTB phase [29,31]. The periodic mass-density wave of the smectic phase, which gives rise to the smectic layers, is absent in the NTB phase, but instead, a periodic distortion wave takes place because the planes perpendicular to the helix axis, which correspond to the same azimuthal orientation of the director, form a set of equidistant “pseudo-layers”. This pseudo-layered structure, which is quite similar to the well-known pseudo-layered structure of the cholesteric phase [29], is responsible for the smectic-like elastic properties at a large length scale (>>p).
Macroscopically, a monochiral domain of the NTB phase is periodic in one dimension (due to the pseudo-layering), uniaxial (due to the D global symmetry of the helix axis), and chiral (due to the helix handedness). This symmetry is the same as that of the chiral smectic A (SmA*) phase, which allowed for the coarse-grained (CG) description of the N-NTB phase transition [31,32], by analogy with the de Gennes theory [33] of the N-SmA phase transition. This CG approach provides the description of all the macroscopic properties of the twist-bend nematic [31,32], for example, the smectic-like elasticity, response to external fields, and surface anchoring. Moreover, after choosing one of the available microscopic models [5,34] of the N-NTB phase transition, the CG model allows one to calculate all the macroscopically relevant parameters and their temperature dependences in the NTB phase from the microscopic properties of the N-phase.
Based on the NTB-SmA* analogy, some of the electro-optic effects of the SmA*, such as the electro-clinic effect (ECE) [35], can be expected to have NTB analogues, such as the ECENTB in the NTB phase [9]. Although the physical origin differs in the two cases, (ferroelectricity in SmA* instead of flexoelectricity in NTB), the result is the same: under a strong field, the distortion of the periodic structure results in a fast rotation of the optical axis, with respect to the normal (pseudo) layers. Despite the small amplitude of the effect, it can be measured precisely over a large temperature range [9] in the NTB phase, giving valuable (although semi-quantitative) information about the phase structure. However, due to some experimental issues (mainly the difficulty of obtaining large monochiral domains and to keep them uniform, deep in the NTB phase), a precise study of the ECENTB has only been reported so far for CB7CB, even though it has qualitatively been described for a few other compounds [22,36,37].
Here, we study experimentally the temperature dependence of the ECENTB response in four different NTB materials, the dimers CB7CB [7,20,38], CB9CB [15], CB6OCB [16], and BNA76 [39]. In thin planar cells, we achieve large monochiral domains which remain uniform over a wide temperature range. We measure the temperature dependencies of the amplitude and the characteristic time of the ECENTB response in all four compounds and compare them with their theoretically predicted behaviour. The agreement of the experimental results with the theory remains only qualitative, suggesting the need to further improve the theoretical models.

2. Theoretical Background

In this section, we recall a few key points of the theory of the ECENTB and its coarse-grained description that have been reported in detail elsewhere [5,31,34,37,40].

2.1. NTB-SmA* Analogy and CG Description of the NTB Phase

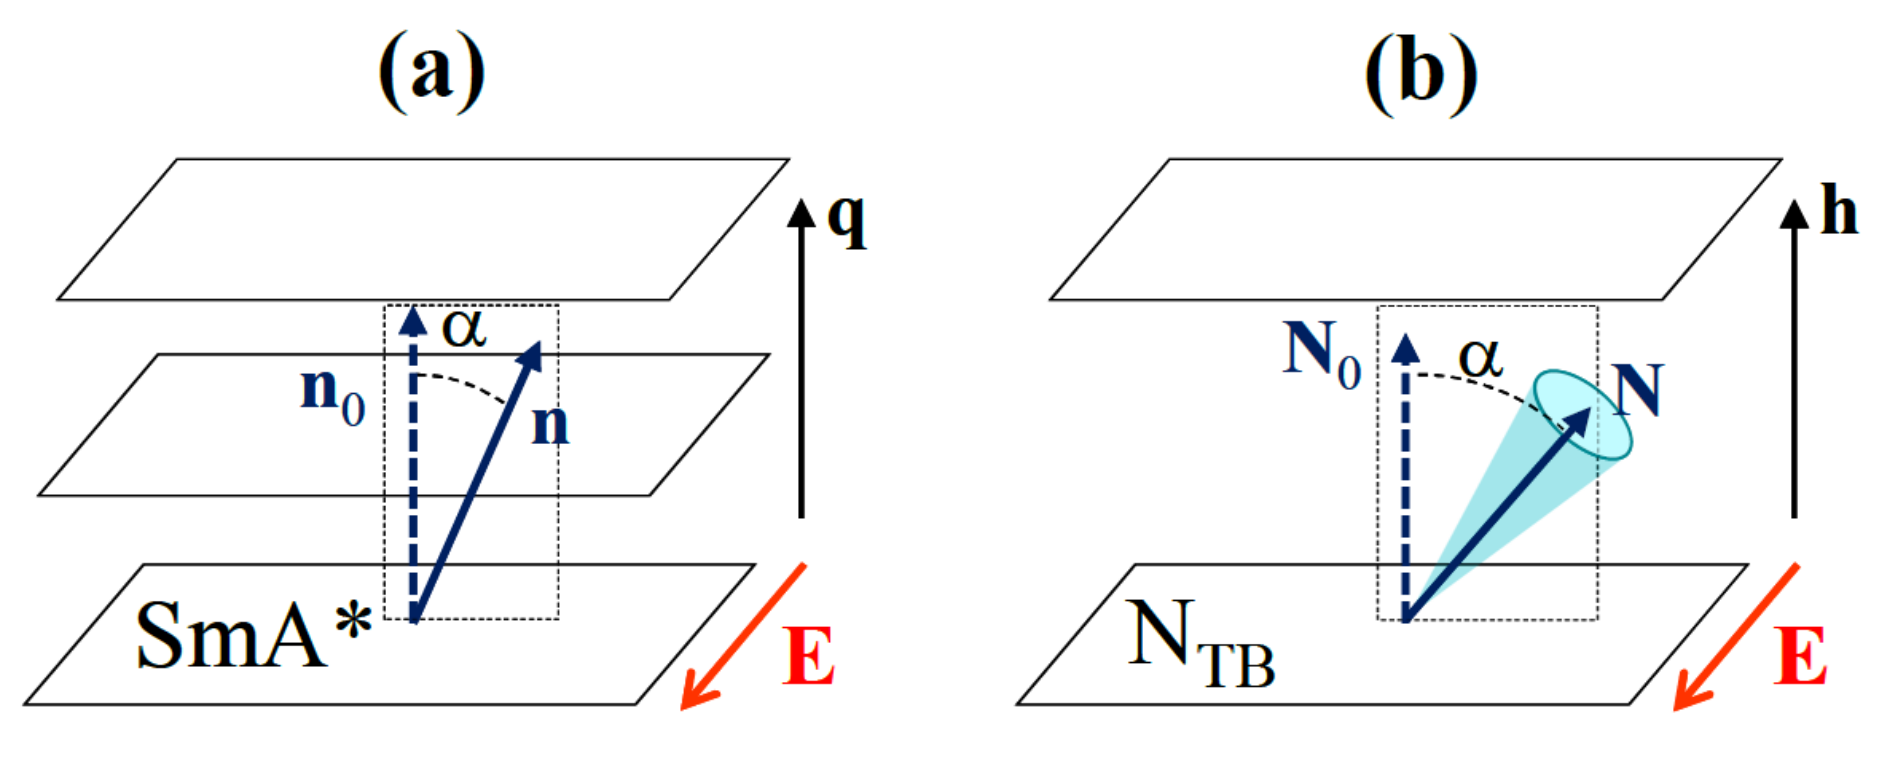
On a large scale, due to its periodicity, the structure of the NTB phase is similar to that of the SmA*. The unperturbed SmA* state is uniaxial, with D symmetry axis along the director n0, which is also the optic axis of the phase, and the mass density ρ is modulated along n 0 , with wave vector q 0 = q 0 n 0 , where q 0 = 2 π / d and d is the layer thickness (see Figure 2a). When the SmA* phase is distorted, the director n(r) and the positions of the layers vary slowly in space, and this distortion costs some elastic energy. To describe the structure of the SmA phase and its elastic properties, de Gennes [33] introduced a complex order parameter ψ = | ψ | exp ( i ϕ ) , where | ψ | is the amplitude of the mass-density wave and ϕ is the phase which describes the local layer displacement, u = d ϕ / 2 π , and varies slowly in space.
The distortion wave of the local director n along the helix axis h in the NTB phase is analogous to the density wave in the smectic. Accordingly, the NTB phase can be considered as a stack of pseudo-layers, perpendicular to h, with a very small period, p ~10 nm. At a much larger, macroscopic, scale, the phase is uniaxial with a symmetry axis defined by the optic axis N – a unit vector pointing along the average orientation of the director n over one heliconical period, i.e., along the axis of the helical cone (see Figure 2b). By analogy with the SmA* phase, the structure of the NTB and its elastic properties can be described by a complex order parameter, σ ( r ) = sin θ ( r ) exp ( i φ ( r ) ) [31]. When θ ( r ) and q ( r ) = φ ( r ) are close to their equilibrium values and vary slowly with r, the macroscopic elastic energy of the NTB is formally the same [31] as that of the SmA* [33]. It contains smectic-like terms, e.g., the pseudo-layer compression term, 1 2 B ( 1 p / p 0 ) 2 which also takes into account the increase in the energy density when the pitch, p, deviates from its equilibrium value, p0. Another important smectic-like term, 1 2 K δ N sin 2 α , includes the energy cost for the tilt of the optic axis N by a small angle α, with respect to the helix axis, h (N is parallel to h in the ground state but can deviate from h under external constraints). Additionally, the energy contains three nematic-like terms,
f N = 1 2 { K N 11 [ N ( N ) ] 2 + K N 22 [ N ( × N ) ] 2 + K N 33 [ N × ( × N ) ] 2 }
which are related to the splay, twist, and bend of the optic axis, where K N i i are the respective elastic moduli. As in the SmA phase, the twist and the bend of N are forbidden because they are incompatible with the pseudo-layered structure of the phase. Moreover, the splay distortion of N is coupled with a splay of the helix axis, which requires a reorganization of the layers and is strongly hindered in confined samples.
The NTB–SmA* analogy provides the general expression for the macroscopic elastic energy of the distorted NTB phase but not the values of the elastic moduli. However, these moduli can be obtained by coarse-graining a microscopic model of the N–NTB phase transition [5,34]. For this purpose, one should consider a large-wavelength distortion of the phase having a small amplitude. The energy cost of the distortion is calculated using the microscopic model and the result is averaged over one pitch length, thus removing all of the periodic terms. The comparison of this microscopic result with the macroscopic elastic energy then provides the values of the elastic moduli.
This CG approach has been applied in [31], starting from the “elastic instability” model of the N–NTB phase transition [5]. The basic assumption of this model is that the elastic constant K33 of the nematic formed by bent-shaped molecules decreases with decreasing temperature T and becomes negative at some T = T*. Therefore, for T < T*, the ground state of the nematic is no longer uniform but it is spontaneously bent. However, as explained earlier, the bend distortion must be coupled to another distortion mode which is the twist mode in the case of the NTB phase. Introducing a fourth-order bend elastic modulus, C > 0, and assuming that K33 varies linearly with temperature in the vicinity of T*, K 33 = a ( T T * ) , with a > 0 , and that all of the other nematic moduli remain approximately constant, one obtains [5], after minimization of the energy, that the ground-state structure of the phase is heliconical, with n ( z ) = ( sin θ 0 cos q 0 z , sin θ 0 sin q 0 z , cos θ 0 ) , where zh. Under these assumptions, the system undergoes a second-order phase transition at T = T* and, close to T*, the equilibrium tilt angle and wave vector of the helix are given by:
sin 2 θ 0 = K 33 3 K 22 = a 3 K 22 ( T * T ) ;   q 0 2 = K 33 3 C = a 3 C ( T * T )  
Therefore, sin θ 0 ( T ) and q 0 ( T ) are expected to follow power laws, ( T * T ) β with the same critical exponent, β θ = β q = 1/2.
An alternative microscopic model for the N-NTB phase transition was proposed by Shamid et al. [34]. In that model, the transition is driven by the strong flexoelectric polarization expected in a nematic formed by bent-shaped molecules. Due to the strong flexoelectric fluctuations in the pretransitional nematic range, the effective bend modulus, K 33 e f f , renormalized by the flexoelectric effect, decreases with decreasing temperature and changes sign at the N-NTB transition. Therefore, despite the different physical origins of the transition, that model also predicts a second-order phase transition at T = T* and, close to T*, the behaviour of the tilt angle and wave vector follow power laws:
sin 2 θ 0 = C θ ( T * T ) ;   q 0 2 = C q ( T * T )  
where C θ and C q depend on the nematic parameters, whose temperature dependence can be neglected close to the N-NTB transition.
A more refined version of the same theoretical model has been used to build a CG theory of the NTB phase [40]. It again predicts a second-order N-NTB transition at some temperature T*, but with a more complex temperature dependence of θ 0 and q 0 . This dependence shows a crossover of the power law exponents for θ 0 and q 0 at some temperature T* − δT, where δT was found to be very small for the NTB-forming mixture studied in [40]. Indeed, for T* > T > T* − δT, the exponents are the same as in Equation (4), β θ = β q = 1/2, while for T < T* − δT they become β θ = β q = 1/4.

2.2. Behaviour under External Fields

The response of the NTB phase to strong external fields, e.g., when an electric field, E, is applied, is expected to be different on the microscopic (<p) and macroscopic (>>p) scale. Microscopically, the response is nematic-like, with a local director, n, reorientation inside the heliconical period, resulting in variation of the pitch and tilt angle [9,30,41], distortion of the helix from circular to elliptic [9,30], or field-induced transition to the nematic [30,41] or splay-bend nematic [42] phases. Due to the small pitch, the NTB phase is expected to be very stiff and these effects are very small for realistically strong fields. Indeed, no experimental evidence has been provided so far for this microscopic effect of the field, except for the NTB to NSB transition under a strong topological constraint [10] or strong electric field [42], E ~8 V/µm.
In addition to this local response of n, the torque integrated over a large volume of the NTB phase acts on the optic axis N and can drive its reorientation. This macroscopic response may (or may not) be coupled with a reorientation of the helix axis. Indeed, the pseudo-layered structure of the phase forbids the bend and twist of N in a defect-free NTB domain. The splay of N under a field, although not forbidden, is also hindered in most sample geometries because it requires the reorientation and displacement of the pseudo-layers (large splay distortion leads also to layer dilation, which is energetically prohibitively costly). Consequently, smooth, continuous, and defect-less textural changes similar to the Fréedericksz transition in nematics are impossible in the NTB phase. Instead, in sufficiently strong fields, a large macroscopic NTB domain can reorient by coupled rotation of N and h, giving rise to the nucleation of many defects, located either in the bulk or at the grain boundaries separating the reoriented domain from the adjacent regions. This kind of irreversible, defect-mediated, effect was reported experimentally under moderate electric fields [7,43].
Because it has the same macroscopic symmetry as that of the SmA* phase, the twist-bend nematic phase should present some specific SmA*-like effects, for example, the electroclinic effect (ECE) [35]: under an electric field E, applied parallel to the SmA* layers, the director n tilts at an angle α, with respect to the normal k to the layers, in a plane perpendicular to E (see Figure 3a). This effect can be understood as a field-induced SmA*-SmC* phase transition: in the SmC*, under field, the director n is tilted, with respect to k and the phase is ferroelectric, with the polarization P f e r proportional to n × k . In the SmA*, due to n k , P f e r vanishes, but when the field is applied, it induces a director tilt and a ferroelectric polarization, P f e r 0 , with resulting energy gain E P f e r (i.e., ECE is an inverse ferroelectric effect). The smectic elasticity, however, disfavors the tilt, and the energy minimization giving sin α = c α E , where c α is the electroclinic coefficient. Typically, due to the stiff SmA elasticity, α is very small (α << 1°) even in strong fields, but much higher amplitudes have been reported in the vicinity of a SmA*-SmC* phase transition. For symmetry reasons, the smectic C ferroelectricity and the ECE are forbidden in an achiral medium. Indeed, the polarization P f e r is a true vector, while n × k is a pseudo-vector, so their proportionality coefficient should be a pseudo-scalar, which cannot exist in an achiral system. Moreover, because the ECE response is linear in the field, the sign of α should change with the sign of E, as well as with the chirality handedness.
Just after the discovery of the NTB phase, a fast linear electro-optic effect was observed in it [36] and has been reported as an analogue of the flexo-electric effect seen for cholesterics [44]. A detailed theoretical analysis [9] later showed that this effect is the NTB counterpart, ECENTB, of the ECE in the SmA* phase. As in the SmA*, when a dc electric field E is applied parallel to the pseudo-layers of an NTB monochiral domain (see Figure 3b), the optic axis N tilts away from the helix axis h at an angle α proportional to the field amplitude. Although ECENTB and ECE have the same geometry, their physical origins differ in that the former is due to flexoelectricity whereas the latter is due to ferroelectricity. Indeed, as in usual nematics, the director distortion in the NTB phase results in a flexoelectric polarization, P f l = e 1 n ( n ) e 3 n × ( × n ) , where e 1 and e 3 are Meyer’s splay and bend flexoelectric coefficients [45]. In the ground state of the NTB phase, the splay is negligible but the bend is strong, giving rise to a large polarization perpendicular to both h and n, and forming an orthogonal helix. Due to this heli-electric organization, the total flexo-polarization of the phase averages zero. However, it has been shown that a uniform tilt of the optic axis leads to excess average flexoelectric polarization, P f l N × h , which results, under an applied field E, in an energy density gain f f l = P f l E . The straightforward CG calculation and minimization of the energy give the amplitude of the ECENTB tilt angle [9]:
α tan α = c α E = e 1 e 3 q 0 ( K 11 + K 22 ) E
where q 0 = ± 2 π / p is the equilibrium value of the NTB wavenumber (with its sign depending on the handedness of the domain). The values and the temperature dependences of the constants e 1 e 3 , K 11 , and K 22 in the NTB phase are unknown, but as a reasonable approximation, it may be assumed that they are continuous at the N-NTB transition and that their thermal variation is negligible compared to the fast variation of K 33 and q 0 . Therefore, the electroclinic coefficient c α is expected theoretically to vary as c α ( T * T ) β α , where the critical exponent is either β α = 1/2 [9,31] or shows a cross-over from 1/2 to 1/4 at T = T * δ T [40].
The CG approach also gives a simple result for the time dependence of the ECE tilt angle, α ( t ) , when the field is switched on or off [9]. In the off-case, α ( t ) follows an exponential law, α off ( t ) = α 0 exp ( t / τ o f f ) , with the initial value α 0 given by Equation (5). Similarly, in the on-case, the dependence is given by α o n ( t ) = α 0 [ 1 exp ( t / τ o n ) ] and the two characteristic times are the same [9]:
τ = τ off = τ o n = 2 γ 1 ( K 11 + K 22 ) q 0 2 sin 2 θ 0
where γ 1 is the rotational viscosity of the nematic, which is expected to be continuous at the N-NTB transition and to follow an Arrhenius law on cooling. In the vicinity of the transition, for both microscopic models of the N-NTB transition, a power law behaviour of the response time is expected, τ ( T * T ) β τ , where the critical exponent is either β τ = 2 [9,31] or shows a cross-over from 2 to 1 at T = T * δ T [40].
To date, precise ECENTB measurements have been reported only for CB7CB, showing a very fast effect ( τ < 1 µs), with a small amplitude ( α < 1° for E = 10 V/µm) [9]. Qualitatively, these results confirmed several important features predicted by Equations (5) and (6): the tilt angle increases linearly with E and changes sign with that of the field and with the handedness of the studied monochiral domain; the time-dependence of the tilt angle is exponential and shows the same response time for both the rise and fall. Estimating the values of e 1 e 3 , K 11 , K 22 , and γ 1 from their usual nematic values, it was inferred that, close to the N-NTB transition, the pitch is extremely small, p 7 nm [9,25], a value that was later confirmed by more direct techniques [13,14,19].
The electroclinic effect in the NTB phase is interesting for two main reasons. On one side, its fast, sub-microsecond, response times are very attractive for practical applications, despite the disappointingly small tilt angle. Therefore, it is important to study a larger number of compounds showing the NTB phase to check whether these values are typical and whether they can be optimized. From a more fundamental point of view, the ECE technique is one of the few that can be applied, without hysteresis and reversibility issues, to test some basic structural parameters of the NTB phase over a large temperature range, thus providing an opportunity to discriminate between the available theoretical models. Moreover, we demonstrate here that the experimental difficulties (related to the small values of α and τ , especially, to the realization of the required large, uniform, monochiral domains) that have so far hampered the investigation of the ECE, can be easily overcome to gather useful information about the NTB phase.

3. Materials and Methods

3.1. NTB-Forming Mesogenic Dimers

We studied four different compounds, showing both the N and NTB phases, that were chosen according to three criteria: (i) a wide temperature range of the NTB phase to avoid crystallization of the samples during the experiments; (ii) the ability to obtain uniform monochiral domains sufficiently large for the ECE measurements; (iii) selection of different dielectric anisotropy (positive or negative) and different strength of the weakly first order N-NTB phase transition (to test the influence of these parameters on the ECE amplitude and the temperature dependences of α and τ ).
The chemical structures of the compounds are presented in Table 1. All of them are mesogenic dimers of two identical monomers connected by an alkyl or alkoxy spacer consisting of odd-number groups. For all of them, the dimer is strongly bent in an all-trans conformation of the spacer. Due to the flexibility of the spacer, a large number of conformers are possible, but most of them are also bent. Therefore, on average, the dimer molecule is typically bent by a 120–130° angle between the monomers. This strongly bent shape of the mesogenic molecule has been predicted [5,6] and experimentally confirmed [7,15] to be an essential condition for the formation of the NTB phase. Table 1 also presents the phase transition temperatures observed in our electro-optical experiments upon cooling for each compound. Note that they differ in some cases by as much as 2 °C from those measured by DSC. This difference is mainly due to two factors: (i) the very different cooling rates in the two cases (≥5 °C/min for DSC and ≤0.1 °C/min in our experiments); (ii) the different surface/volume ratios in the two experiments. This ratio is much larger in our thin sandwich cells, leading to some diffusion in the sample of impurities from the alignment layers and sealing walls of the cell (this contamination leads to a shift in the transition temperatures but does not significantly influence our ECE experiments).

3.1.1. CB7CB

The liquid crystal dimer CB7CB, the systematic name of which is 1″,7″-bis(4-cyanobiphenyl-4′-yl)heptane, is the most famous NTB-forming compound. Indeed, the NTB phase was discovered with this material [7]. It was also the first compound (or at least one of the first) for which the structural and physical properties of the NTB phase were characterized, e.g., pitch [9,13,14], conical tilt angle [9,10,14], and dielectric constant [7]. CB7CB was also the compound used in the first detailed ECE study [9] (note that we repeat here the ECE experiment with CB7CB over a larger temperature range and with a significantly improved time resolution).
CB7CB was prepared following methods described previously in detail [7,20,38]. The transition temperatures obtained by DSC, are T (NTB-N) = 376 K and T (N-I) = 389 K, respectively. These phase transitions were found to be first order [46]; the entropies of transition, ΔS/R, are 0.34 and 0.31, respectively [38].
CB7CB has a positive dielectric anisotropy, ∆ε ~+2 in the NTB phase close to the transition [7]. As for the other materials presenting ∆ε > 0, in the ECE experiments, we limit the duration of the applied high-field electric pulses to < 100 µs to avoid textural changes under the strong dielectric torque.

3.1.2. CB9CB

The dimer 1,9-bis(4-cyanobiphenyl-4′-yl) nonane (CB9CB) differs from CB7CB only by the length of the spacer linking the two cyanobiphenyl mesogenic units. The synthesis and characterisation of CB9CB have been described in detail elsewhere [15]. In contrast to CB7CB, CB9CB shows an enantiotropic NTB phase over a large (>20 °C) temperature range. However, due to the similar chemical structures of these homologues, their physical properties are also similar, and in particular, ∆ε~2 in the vicinity of the N-NTB transition. The entropies of the I-N and N-NTB transitions, ΔS/R, are 0.33 and 0.08, respectively [15], indicating that the N-NTB transition is much more weakly first-order in character than seen for CB7CB.

3.1.3. CB6OCB

The dimer 1-(4-cyanobiphenyl-4′-yloxy)-6-(4-cyanobiphenyl-4′-yl)hexane (CB6OCB) also contains two cyanobiphenyl mesogenic units but linked by an alkoxy (CH2)6O spacer. The synthesis and characterisation of this dimer have been described in detail elsewhere [15,16]. Due to the ether link on one side of the spacer, which results in a smaller bend-angle of the molecule, both nematic phases of CB6OCB, N and NTB, are enantiotropic and show significantly wider temperature ranges than for CB7CB. The entropy of the N-NTB transition is extremely small, ΔS/R = 0.01 [15], which indicates that the transition is much more weakly first-order in character than seen for CB7CB. Due to the similar chemical structures of these dimers, their physical properties are similar, in particular, ∆ε ~ 2 in the vicinity of the N-NTB transition.

3.1.4. BNA76

The bent-shaped dimer 1,7-bis[6-(4-hexyloxybenzoyloxy) naphthalene-2-yl]heptane (BNA76) was prepared following a synthetic route described earlier [39]. The molecular structure of BNA76 is quite different from those of the other three compounds studied here. Instead of cyanobiphenyls, the mesogenic units of BNA76 are benzoyloxy-naphthyl esters with relatively long alkyl terminal chains. The phase sequence of BNA76 is richer than that of the cyanobiphenyl-based dimers as it presents three mesomorphic states–nematic, twist-bend nematic, and intercalated biaxial smectic A (SmAb). The entropy of the N-NTB transition is small [39], ΔS/R = 0.05, which indicates a weak first-order transition, as expected [16,46] because of the wide temperature range of the N-phase. Due to the absence of large longitudinal dipoles in the mesogenic units, BNA76 shows a negative dielectric anisotropy, ∆ε < 0, and therefore no textural changes are observed in the N and NTB phases in our planar cells, even under strong fields (E ~ 20 V/µm). This allows us to apply arbitrarily long dc voltage pulses (or ac voltage bursts) in our ECE experiments without textural change issues. (Note that the cell behaviour is different in the SmAb phase: because of the phase biaxiality, textural transitions [8] are observed in voltages of under ~4 V. However, the SmAb phase is achiral and, therefore, as expected, it does not show any electroclinic response.)

3.2. Measurement Technique

For the ECE measurements, the compounds were filled into optical cells with a small gap, d = 1.5 µm, (kindly provided by Nemoptic, France) by capillarity action. This cell thickness was required to obtain optical retardation, ∆L = d.∆n, of the transmitted polarized light of wavelength λ, in the optimal range for the ECE measurements (λ/4 < ∆L < 3λ/4). Rubbed polyimide layers deposited on the cell surfaces provided a uniform planar alignment with a small pretilt (1–2°) in the nematic phase. The field was applied to the cell by transparent ITO electrodes with a small resistivity (4 Ohms per square).
In the nematic phase, all of the dimers showed good planar alignment allowing, if necessary, for the measurement of their physical and optical properties. On slow cooling through the N-NTB phase transition, we observed the growth of uniform monochiral NTB domains separated by domain walls. The typical size of these domains varied from tens to hundreds of micrometers, depending on the compound and cooling rate. On further NTB-N-NTB cycling, the domain pattern changed randomly without visible memory of the domain handedness.
After a few NTB-N-NTB cycles, the domains were sufficiently large to allow for ECE measurements in monochiral regions of at least 50 × 50 µm2 in size. Usually, a few tenths of a degree below the transition, the domains were reasonably uniform but, upon further cooling, in most cases, the well-known stripe- and (at a lower temperature) rope instabilities [7] were observed. To avoid these instabilities, which can disturb the electro-optical response to the field, the temperature of the NTB phase was slowly decreased while superposing weak temperature oscillations (with typical amplitude~1 °C and frequency ~0.01 Hz). During this process, an ac voltage (f = 10 kHz, U < 6 V) was switched on- and off- at about 0.1 Hz. This treatment progressively weakened the instabilities and was repeated until they no longer significantly disturbed the ECE measurements, or until they completely vanished (in the best case). The best results of this treatment were obtained for CB7CB which showed a uniform texture of the monodomains over a temperature range of more than 50 °C below the N-NTB transition, and the worst results were for CB6OCB, with only a 20 °C range.
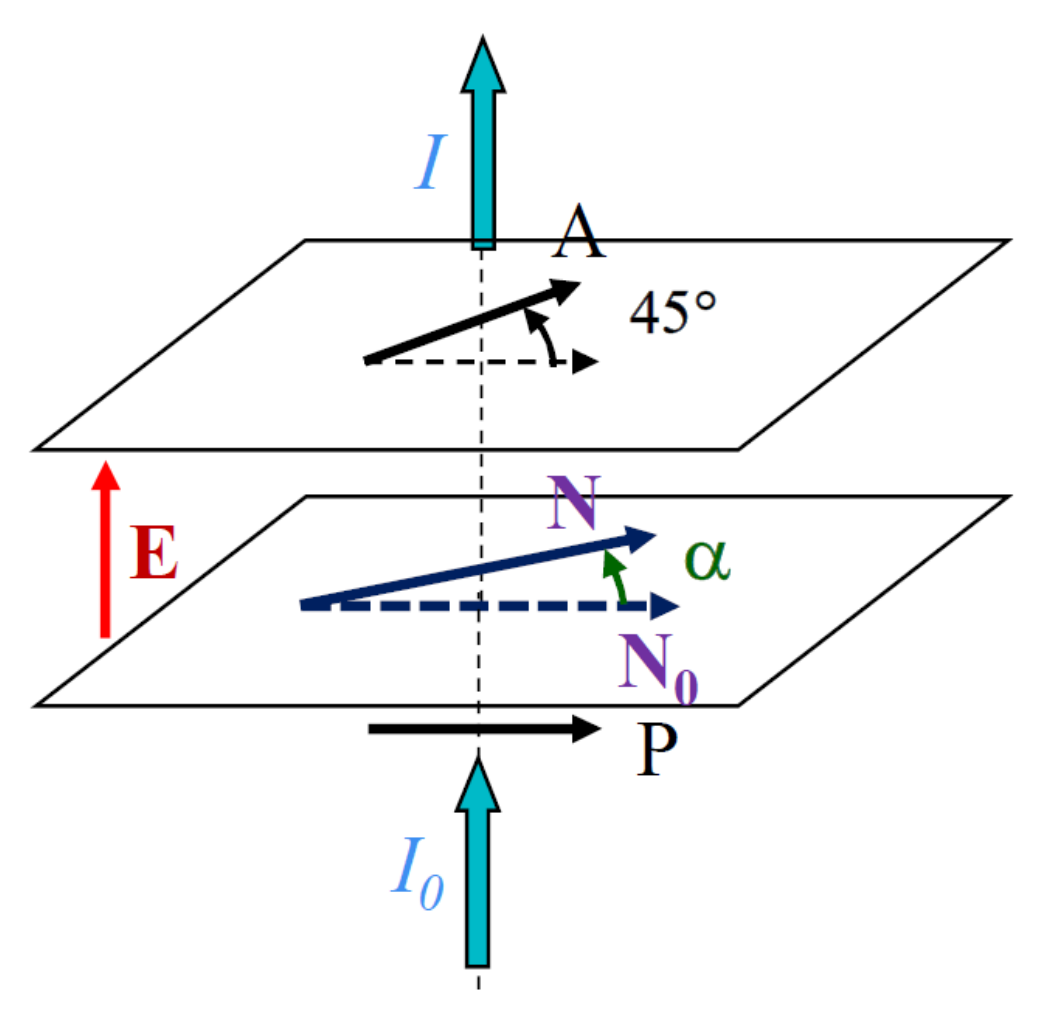
A simple technique, previously described in more detail, was applied to measure the ECE response [9]. In the absence of the field, the NTB optical axis, N0, is parallel to the polarizer P (Figure 4). When the field E is applied, the optical axis rotates in the plane of the cell by a small angle α to a new orientation, N. With the analyzer, A, set at 45°, with respect to P, the transmitted light intensity, I, is approximately a linear function of α [9]:
I 1 2 I 0 [ 1 4     α sin 2 ( π Δ L λ ) ]
where I0 is the intensity of the incident light. The sensitivity of the measurement is optimal for Δ L ( m + 1 / 2 ) λ with m an integer. For our cell gap, d = 1.5 µm, Δ L varies with temperature in the 150–250 nm range, resulting in a reasonably large slope for I(α). To calibrate the measurements of α, without additional birefringence measurements, we measured directly, at each temperature, the slope of I(α) by rotating the cell to a known fixed angle α0 = ± 4° (at fixed I0 and U = 0).
The cell is placed on a polarizing microscope (Leitz Ortholux) stage equipped with a light source with a stabilized dc voltage supply. The temperature of the sample is controlled with a precision of 0.01 °C using a Mettler HS82 hot-stage and a home-built PID temperature controller. The transmitted intensity is measured using a microphotometer (Leitz) mounted on the microscope and equipped with a photomultiplier tube (PMT). The measurement is local and limited to a small selected rectangular area (typically 40 × 40 µm2) in the image plane. To minimize the response time of the detection system, the current signal from the PMT is sent directly to a small resistive load, RL = 1 kΩ. The voltage drop on the charge is sent to a digital oscilloscope (DSO-X 2004A, Agilent), where it is accumulated up to 64,000 times to improve the signal-to-noise ratio. The typical error in α is estimated to be less than 0.01° and the response time, τexp, of the experimental setup, measured with a LED light source driven by short rectangular pulses, is about 160 ns. The main effect of the instrumental response time on the measured signal is an additional delay (~τexp) of the ECE response without a change in the slope of the ECE curve. Using a suitable fitting procedure, taking into account this effect, the error in the measured ECE response times can be reduced to only around 30 ns.
During the experiments, short voltage pulses (typically 10–40 µs) were applied to the ITO electrodes, resulting in a d.c. electric field directed along the cell normal, which is also the observation direction. The pulses were generated by an arbitrary wavefunction generator (TGA1241, TTi) and amplified by a fast high-voltage amplifier (Krohn-Hite 7602M) up to amplitudes in the range 15–120 V. The short duration of the pulses was required, in the case of ∆ε > 0 materials, to avoid the reorientation of the NTB helix under the strong dielectric torque. For BNA76, however, ∆ε < 0, the dielectric torque stabilized the planar alignment of the helix in our cells, and arbitrarily long pulses could be applied without destroying the uniform NTB texture.

4. Results

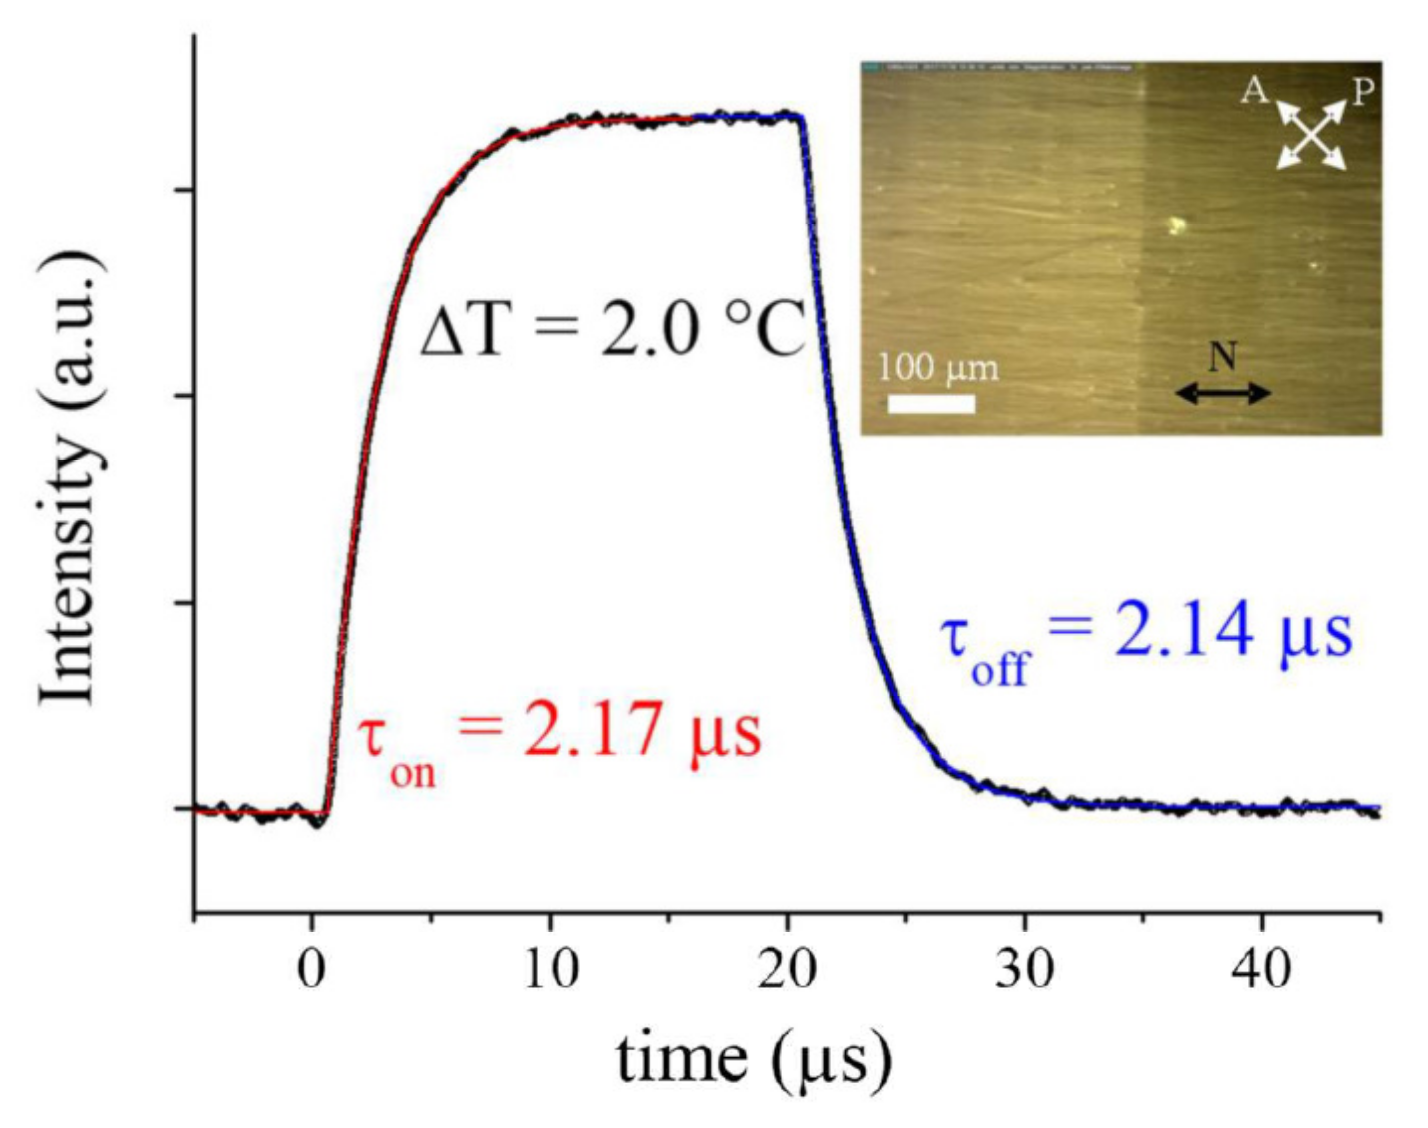
For all four compounds, the experimental results are in good qualitative agreement with the theoretically expected behaviour. Subject to square pulses, the ECE response shows a best fit to exponential law, with approximately the same on- and off- response times (Figure 5). Moreover, as expected, the sign of the response is reversed when the measurement window is displaced from one monochiral domain to the next, which has opposite handedness. This feature, as noted before [9,10], is direct evidence of the doubly-degenerate chiral structure of the NTB phase.
As expected from Equation (5), the variation of α with the field is linear. This is best demonstrated by applying bipolar triangular pulses, as shown in Figure 6. The ECE response is proportional to the field, with only a small delay and distortion at the peaks of the signal (due to the finite response time of the ECENTB effect). The change of the response sign with the sign of the field is also direct evidence that the macroscopic structure of the phase is chiral.
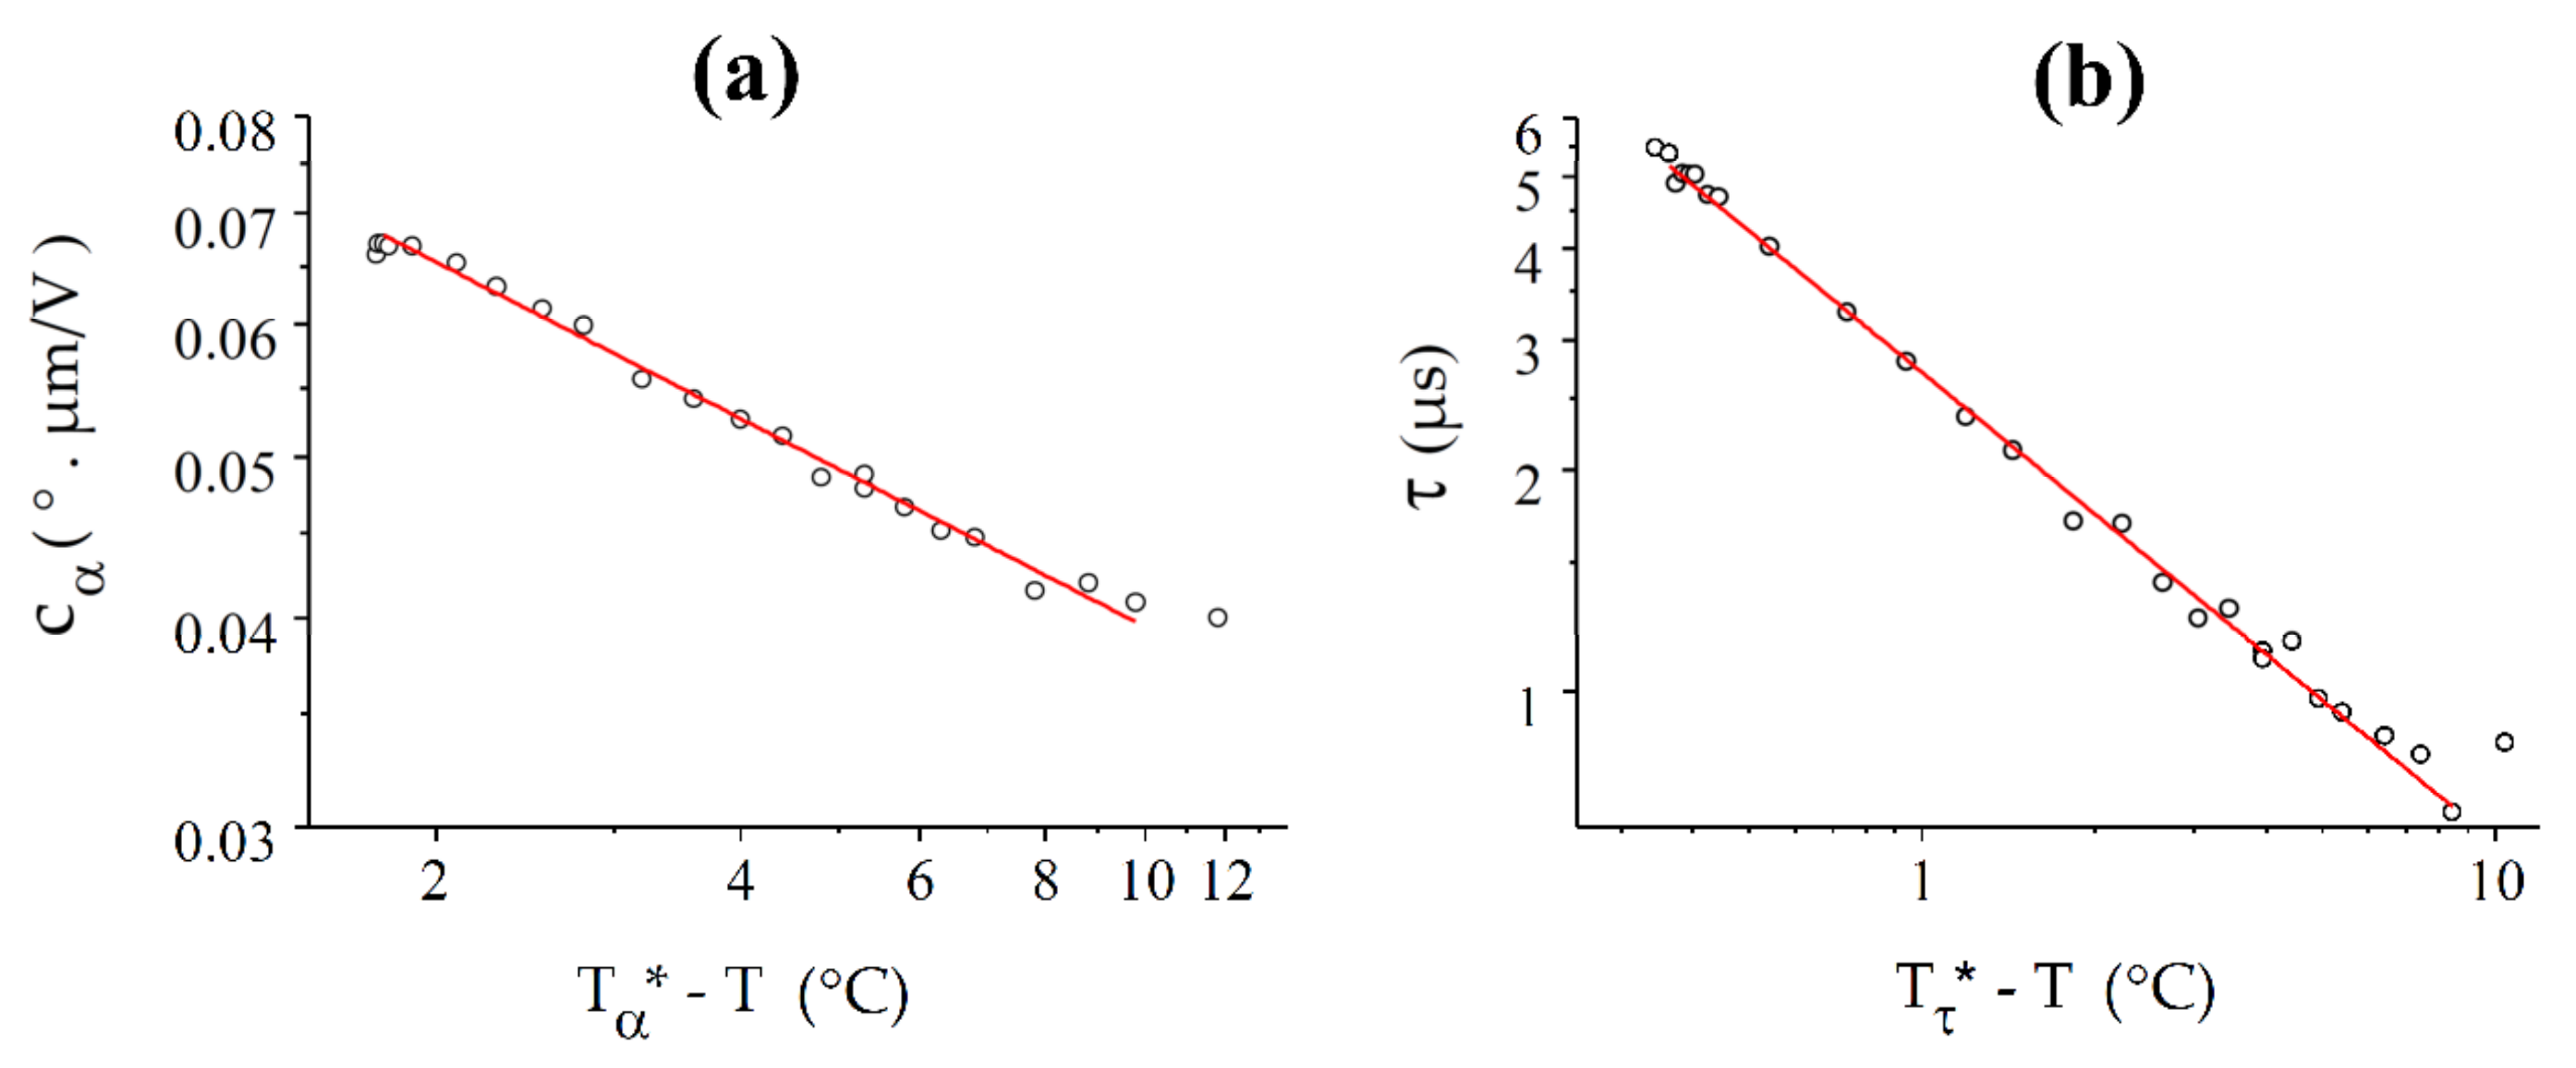
To compare the temperature dependences of the ECE response of the four compounds, we later present the results for each in terms of c α ( T ) and τ ( T ) . In addition, for each of them, we also present the best fit with a power law, c α ( T ) ( T α * T ) β α and τ ( T ) T τ * T ) β τ , respectively. Note that, for the theoretical models, the critical temperature T* should be the same for α and τ. This is, however, not confirmed experimentally. The best fit parameters for all the compounds under study are presented in Table 2.

4.1. CB7CB

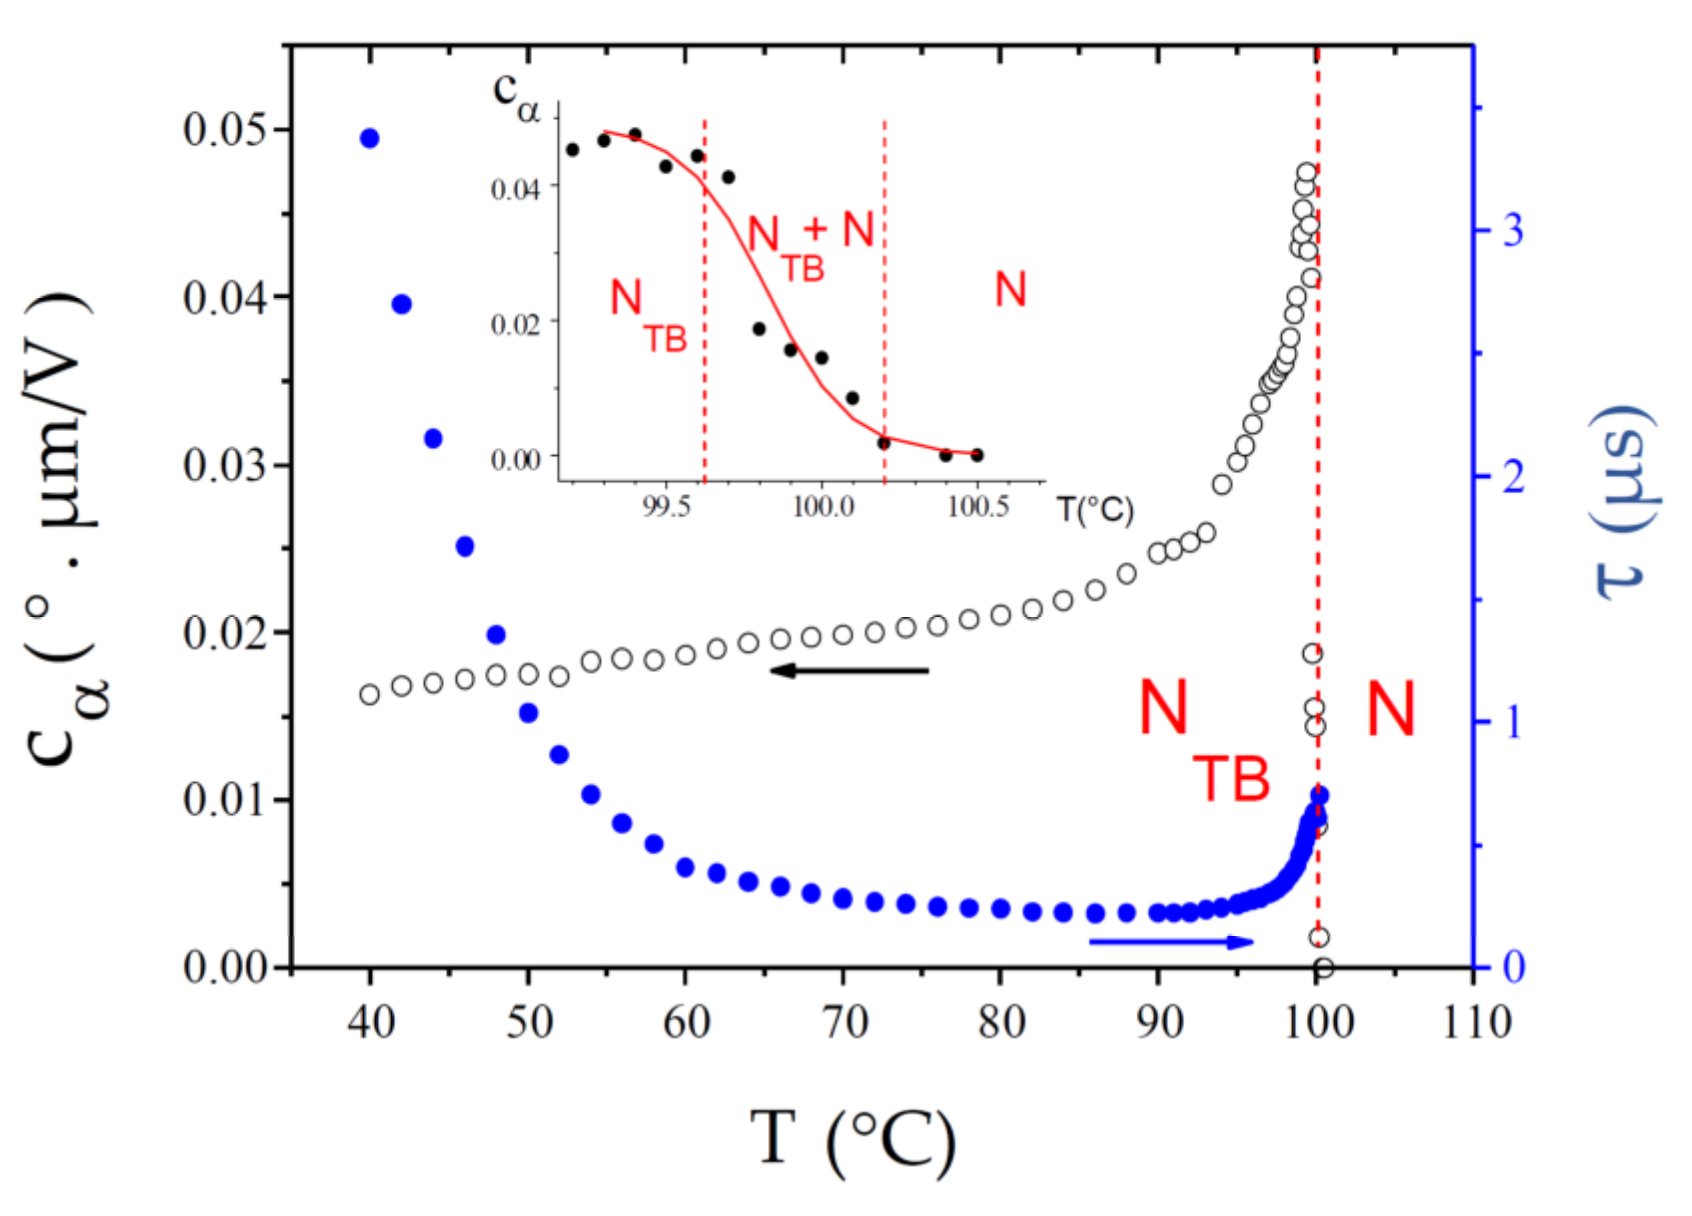
CB7CB, for which the NTB phase was first confirmed experimentally [7], remains the most studied NTB compound to date. In particular, it was the dimer for which the first detailed ECE experiment was reported [9]. However, this study presents a more recent experiment with better time resolution, a wider temperature range, and a larger number of temperature data points. Although the present data are in excellent agreement with previous results, they provide better precision on the values of the fit parameters. The experimental results for c α ( T ) and τ ( T ) , over the whole temperature range of the NTB phase, are shown in Figure 7. The value c α ( T ) is already small at the transition and it decreases further throughout the NTB phase. At low temperature, it approaches a limiting value. Magnifying the c α ( T ) curve in the vicinity of the N-NTB phase transition (see inset) reveals a relatively large temperature range (99.5–100.2 °C) of biphasic coexistence, in good agreement with previous reports [7,9,10]. In the following discussion, we define the median temperature of this biphasic range, Tc = 99.85 °C, as the experimentally observed N-NTB transition temperature (the same approach is used for the other compounds). The ECE response time is very short at the transition, τ ≈ 0.7 µs. Upon cooling, it decreases even further over a few °C and then levels off at a value of about 0.23 µs over the next 20 °C. Upon further cooling, τ ( T ) grows exponentially, due to the Arrhenius temperature dependence of the rotational viscosity to which it is proportional (see Equation (6) and the discussion section).
As expected theoretically, c α ( T ) and τ ( T ) follow power law dependences over a range of several °C below the N-NTB transition (Figure 8), where the slow temperature variation of all the nematic parameters, except K33, can be neglected. Moreover, c α ( T ) follows a power law dependence over the entire available temperature range whereas τ ( T ) deviates from this, but only far from the transition. However, the critical temperatures T* derived from these two fits are not the same and, in disagreement with the theoretical models, they differ from the experimental value of Tc by small but significant values, Δ T α = T α * T c = 0.20 °C and Δ T τ = T τ * T c = 0.35 °C.

4.2. CB9CB

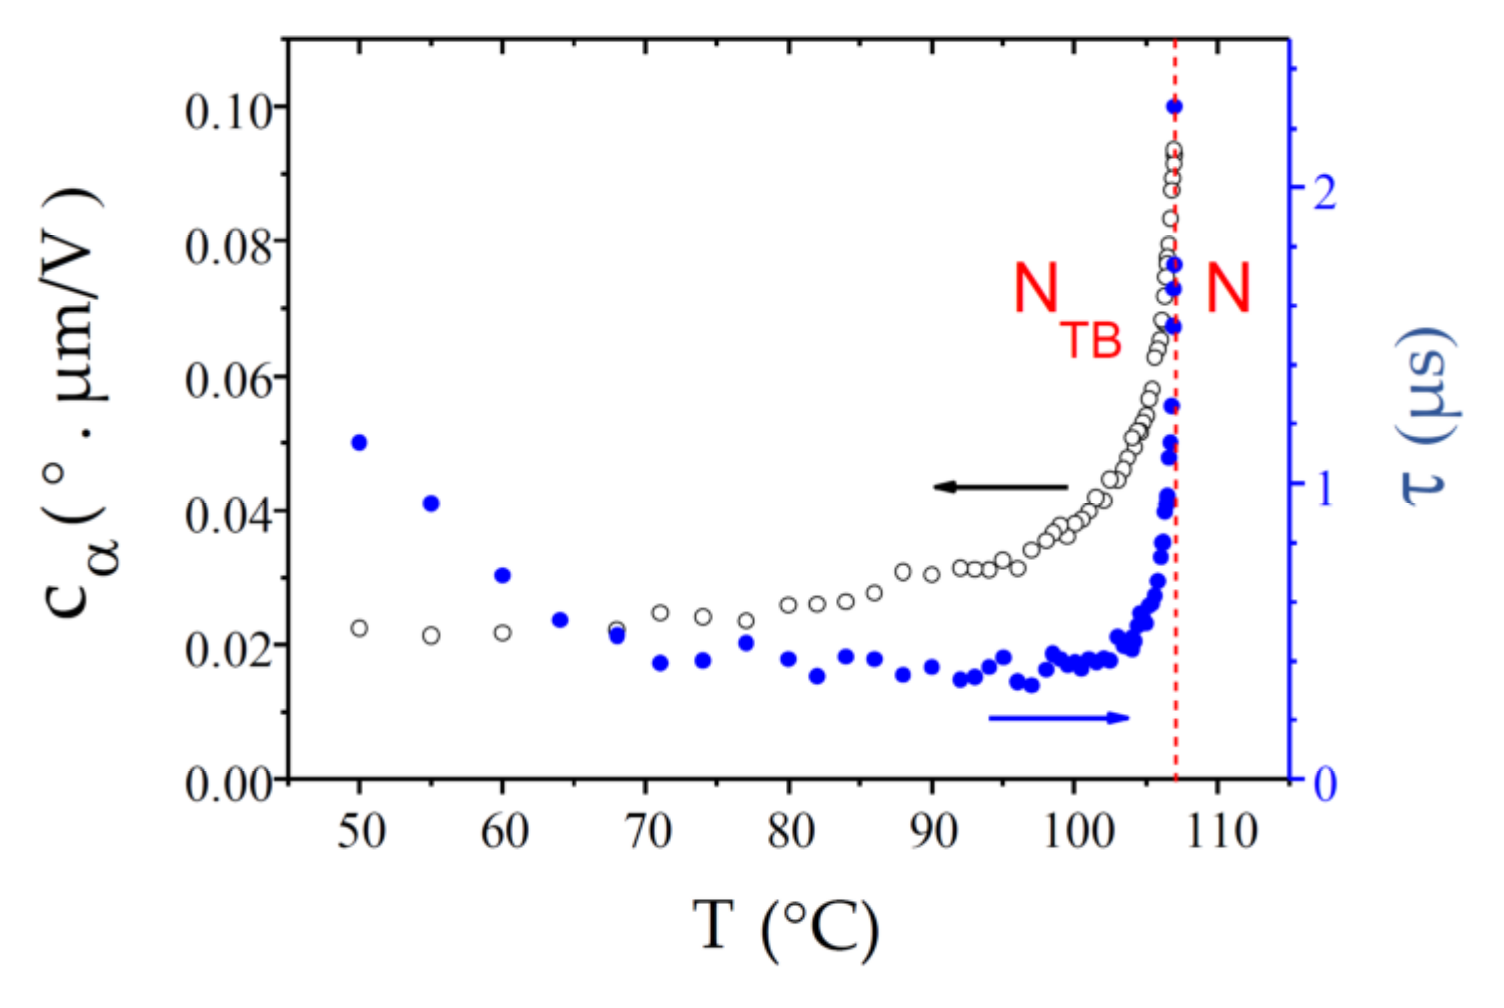
The dimer CB9CB is a homologue of CB7CB and differs from it only by the spacer length. The experimental results for c α ( T ) and τ ( T ) are very similar to those of CB7CB (Figure 9). Indeed, c α ( T ) is small at the transition, it decreases throughout the NTB phase, and approaches a limiting value at low temperature. The N-NTB phase transition is very sharp, almost without any biphasic coexistence, and takes place at Tc = 107.00 °C. At the transition, the ECE response time, τ ≈ 2.2 µs, is slower than in CB7CB but it remains of the same order of magnitude. Upon cooling, it decreases further over a few °C, then levels off at about 0.36 µs and grows exponentially upon further cooling. However, even at T = 50 °C, the response time remains rather fast, τ ≈ 1.1 µs.
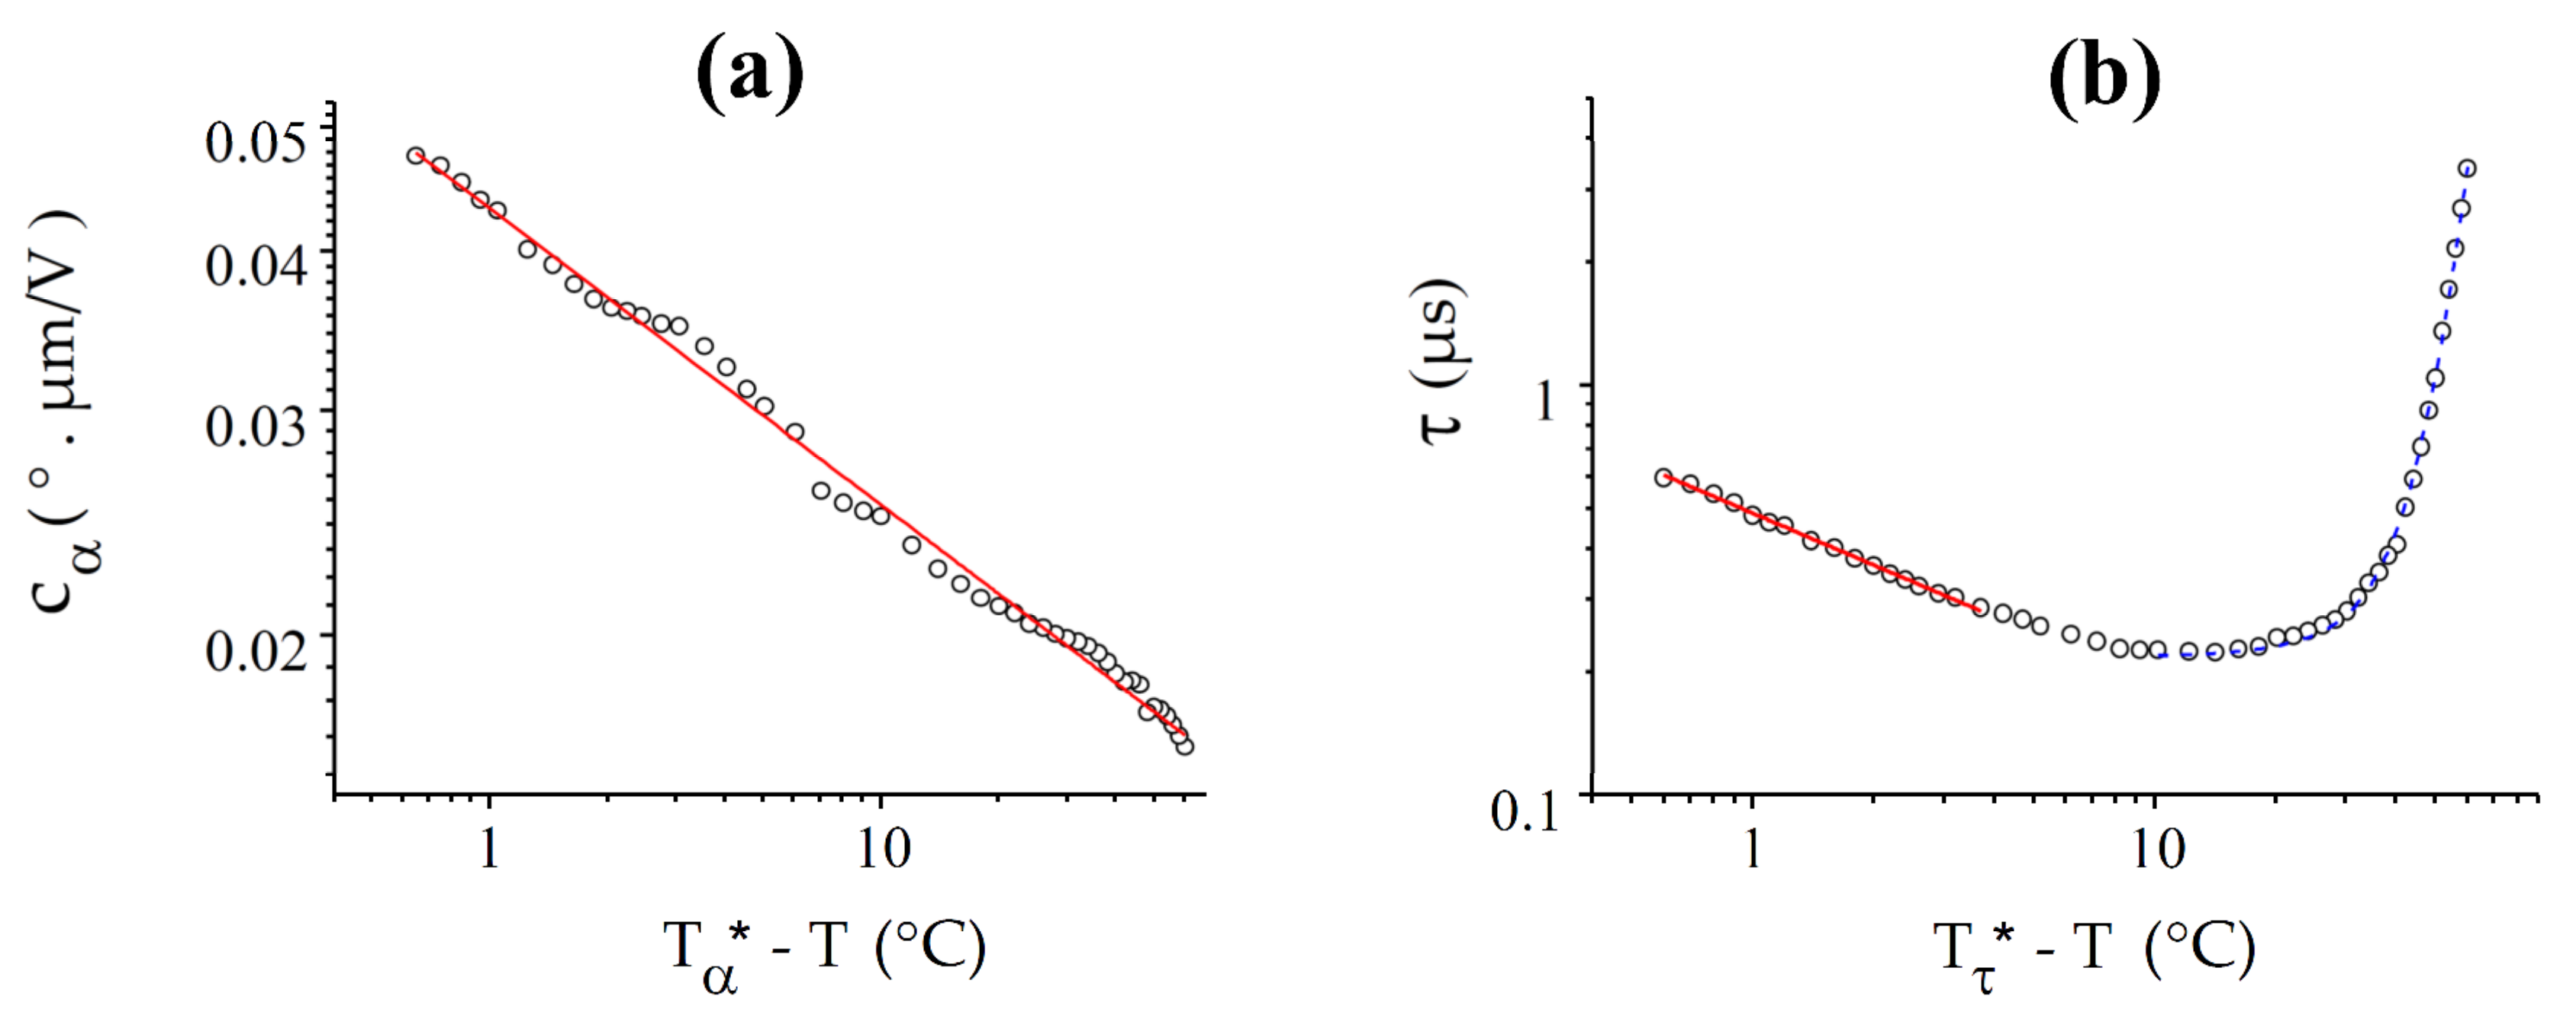
As expected, c α ( T ) and τ ( T ) follow power law dependences in the vicinity of the N-NTB transition (Figure 10). As for CB7CB, the c α ( T ) curve is fitted well by the power law over the entire available temperature range whereas τ ( T ) deviates from this far from the transition. The critical temperatures T*, derived from the two fits, are again different and also differ from the experimental value of Tc, with Δ T α = T α * T c = 0.45 °C and Δ T τ = T τ * T c = 0.14 °C.

4.3. CB6OCB

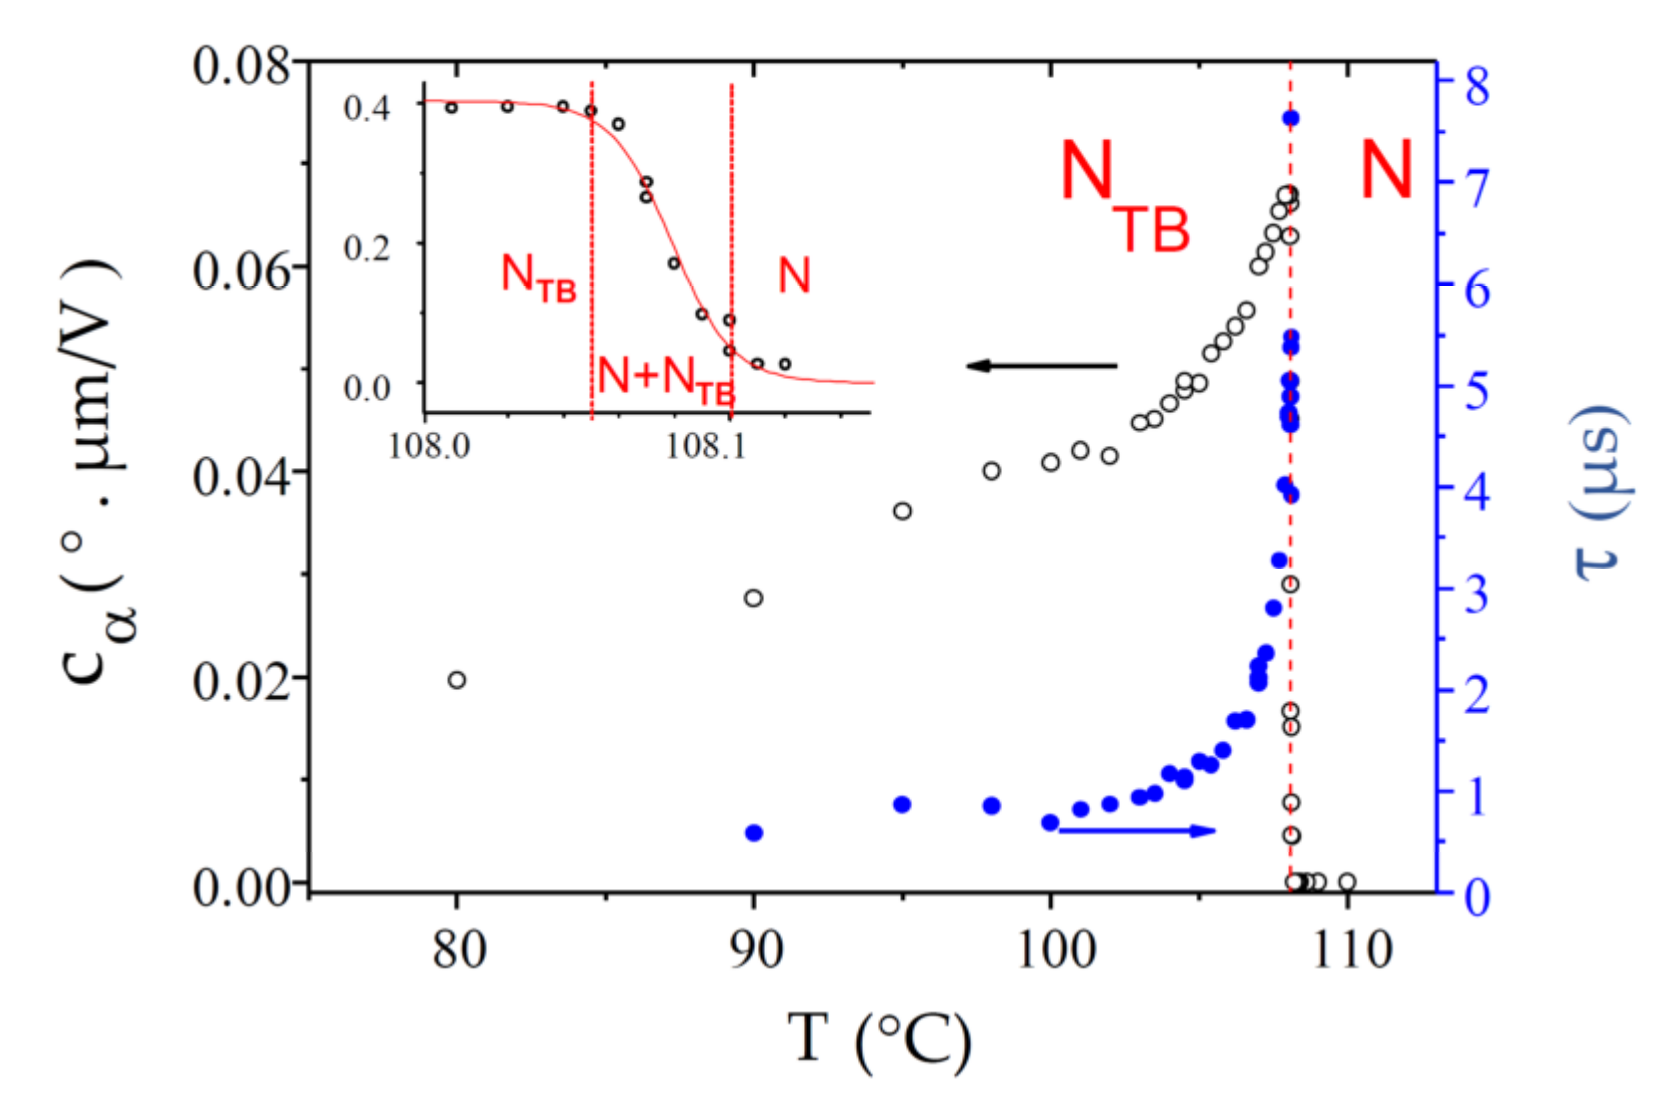
The dimer CB6OCB is approximately the same length as CB7CB but the spacer has a different chemical structure. Consequently, these two compounds differ in some of the physical properties of their nematic phases. For example, the nematic temperature range of CB6OCB (48 °C) is significantly larger than that of CB7CB (15 °C) and the N-NTB phase transition is almost second-order, whereas that of CB7CB is weakly first-order. The experimental results for c α ( T ) and τ ( T ) in the whole temperature range of the NTB phase are shown in Figure 11. Note that, for this compound, the texture instabilities could not be completely suppressed below 95 °C, which reduced the quality of the data. The value c α ( T ) is small at the transition, decreases throughout the NTB phase, and approaches a limiting value at low temperature. The N-NTB phase transition is sharp and takes place at Tc = 108.08 °C, with a small biphasic coexistence range (108.05–108.10 °C). At the transition, the ECE response time, τ ≈ 7 µs, is about one order of magnitude slower than in CB7CB. Upon cooling, it decreases sharply over a few °C and levels off to about 0.8 µs.
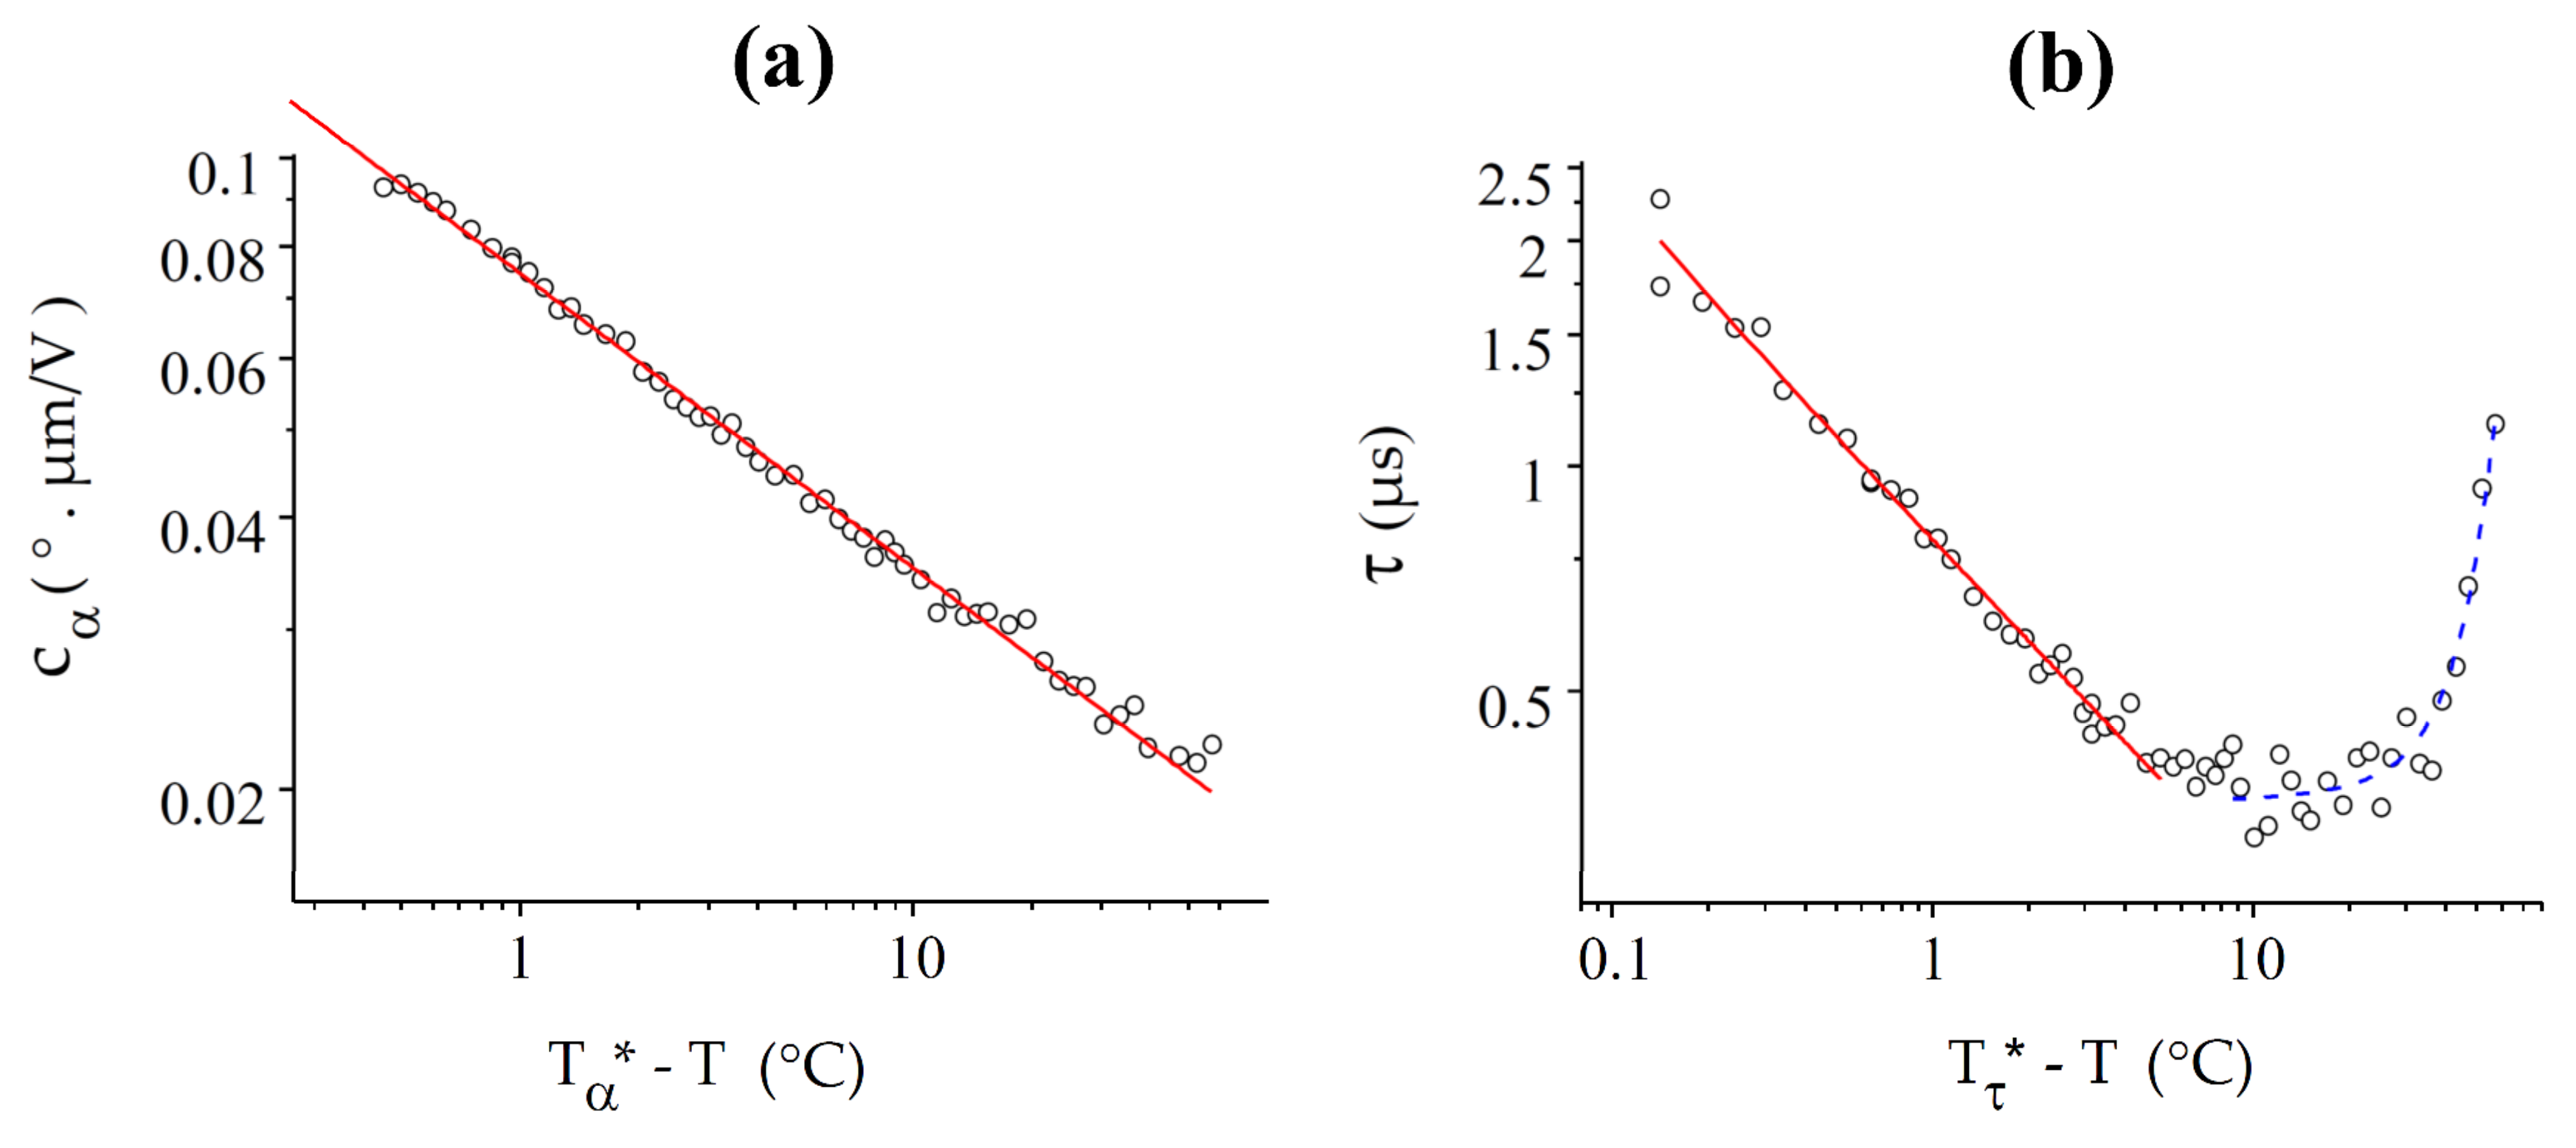
In the vicinity of the N-NTB transition, c α ( T ) and τ ( T ) follow power laws, like the previous compounds (Figure 12). Both curves fit well by power laws over 10 °C below the phase transition. The critical temperatures T* determined from the two fits are quite different and also differ from the experimental value of T c , with Δ T α = T α * T c = 1.70 °C and Δ T τ = T τ * T c = 0.36 °C.

4.4. BNA76

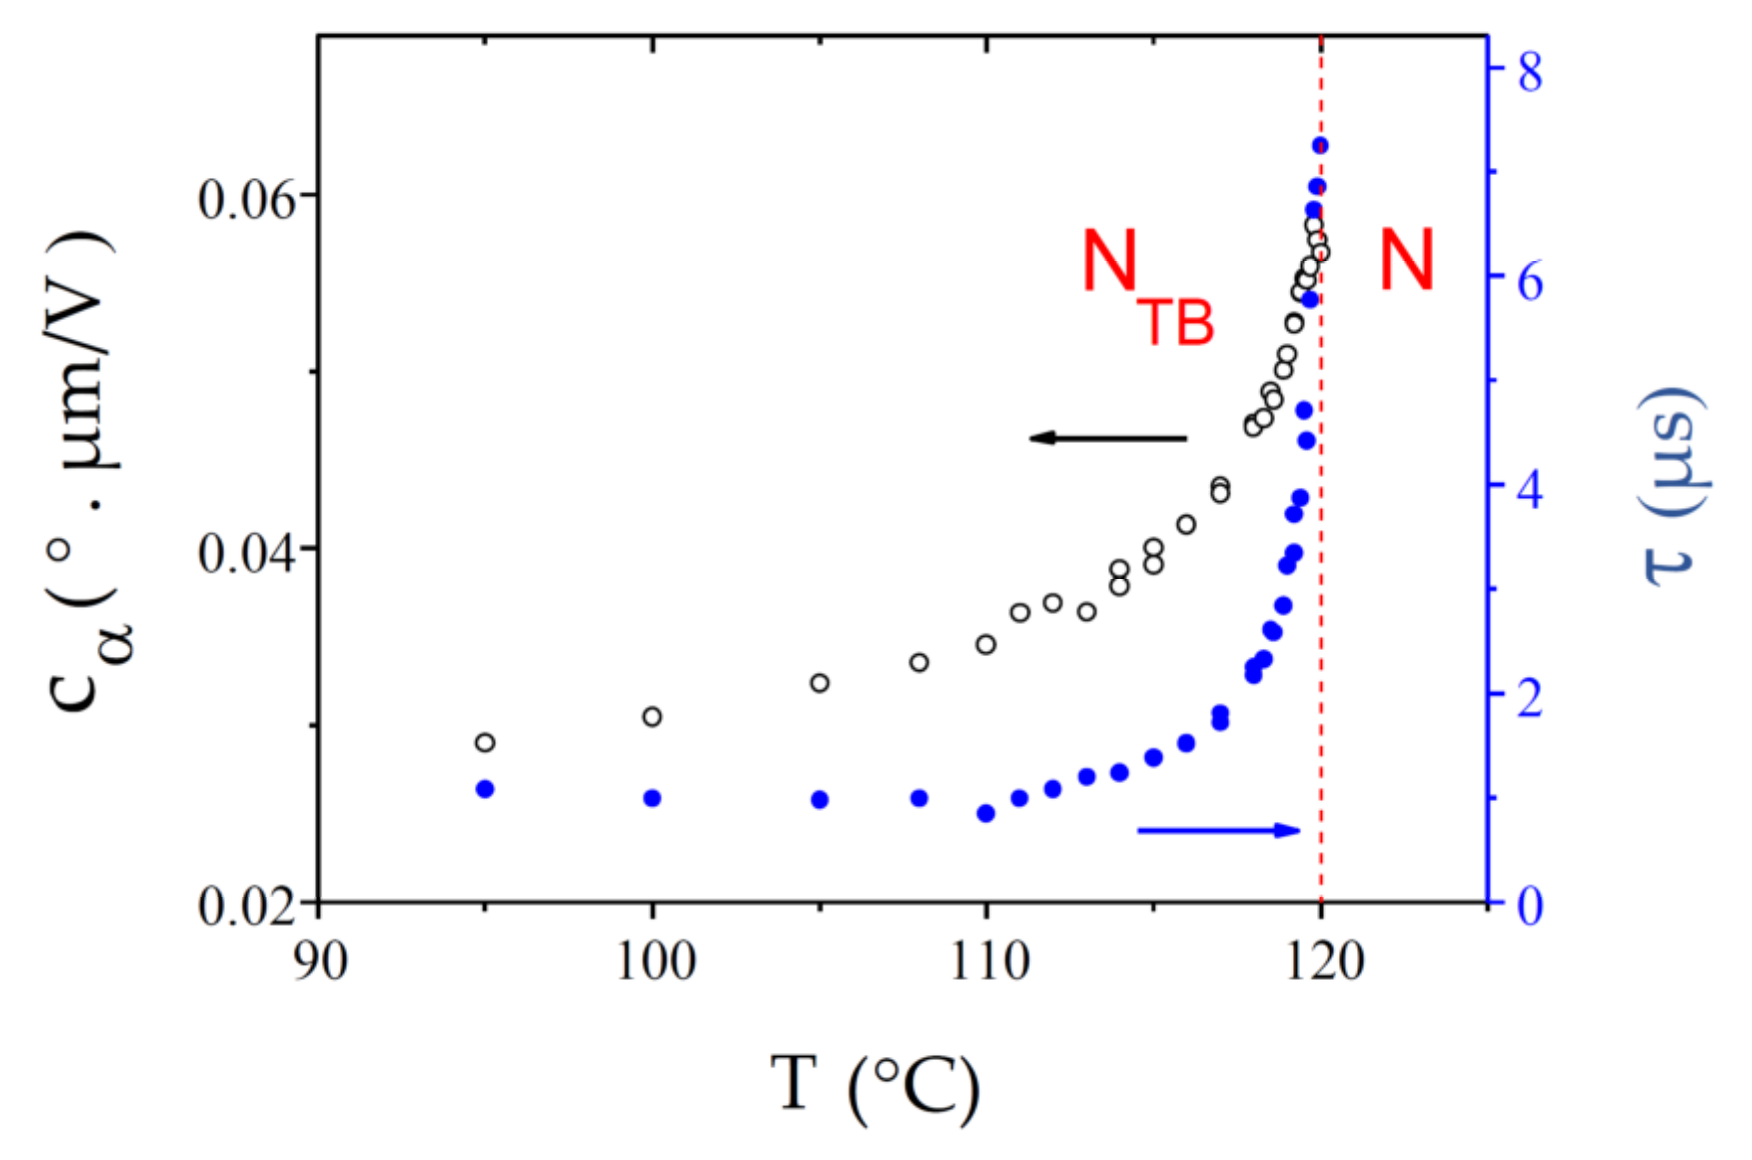
Like CB9CB, BNA76 presents a very sharp N-NTB phase transition that takes place at Tc = 120.00 °C. As for the other compounds, c α ( T ) is small at the transition and decrease throughout the NTB phase (Figure 13). The ECE response time is similar to that of CB9CB; decreasing from τ ≈ 7.2 µs at the transition to τ ≈ 1.0 µs at 95 °C.
Like the other cases, the c α ( T ) curve fits well to a power law over the entire available temperature range (Figure 14), while τ ( T ) follows a power law only close to the transition. The critical temperatures T* derived from the two fits are again different and differ from the experimental value Tc, with Δ T α = T α * T c = 1.17 °C and Δ T τ = T τ * T c = 0.50 °C.

5. Discussion

The main ECENTB features that are expected theoretically are based on the macroscopic symmetry of the NTB phase and its analogy with the chiral smectic A phase. Indeed, the geometry of the effect, with a torque, applied to the optic axis N and proportional to the pseudo-vector h × E , is only possible in a chiral system. Therefore, the mere existence of the electroclinic effect is direct proof of the chiral structure of the NTB phase and its layered or pseudo-layered organization. Similarly, the alternation of the sign of the ECENTB response from one monochiral domain to the next is direct evidence of the doubly-degenerate chirality of the phase. Moreover, the fact that the response is linear in the field reveals that the effect is not dielectric but flexo- or ferroelectric.
All of these expected features have already been observed in the first ECENTB experiments using CB7CB [9], giving an early confirmation of the heliconical (and helielectric) structure of the NTB phase. Here, we show that this behaviour is typical for twist-bend nematics as is observed for all of the four compounds under study. Indeed, for all compounds, close to the N-NTB transition temperature, we find that the amplitude of the electroclinic tilt of N is small of the order of 0.5–1° for 10 V/µm (or c α < 0.1 °V/µm). On cooling, c α decreases further, by a factor of 2 to 5, depending on the compound. The CG theory of the NTB phase relates the value c α close to the transition with the material constants in the nematic phase to the pitch p of the NTB phase (see Equation (5)). With the typical values of the constants available for the nematics, it has been deduced previously [9,25], from the small value of c α for CB7CB, that the pitch is about 7 nm. This surprisingly small value was later confirmed by direct measurements [13,14,19] and is now accepted to be typical.
Our study confirms this conclusion for the other three dimers. Moreover, assuming the nematic constants ( e 1 e 3 ) and ( K 11 + K 22 ) vary slowly in the vicinity of T c , we conclude that the temperature dependence c α is largely due to the variation of the pitch, i.e., the pitch decreases with decreasing temperature. This behaviour of p ( T ) , which is theoretically predicted [5,34], agrees qualitatively with the resonant X-ray scattering experiments on CB7CB [19], which report a moderate decrease of p ( T ) below T c . Our results for the other compounds (see Figure 9, Figure 11, Figure 13) suggest that the decrease of p ( T ) on cooling is a typical feature for the bent-shaped dimers that form an NTB phase. However, the agreement between the decrease (≈50%) of p ( T ) in the 10 °C range below Tc, deduced from Figure 7 and that reported in [19] (<20 %), is not quantitative. This disagreement may be due to the assumptions of the theoretical model, for example: neglecting the temperature dependence of the nematic constants in the vicinity of Tc, and the approximation that the nematic order tensor is continuous at the N-NTB transition remaining uniaxial in the NTB phase [5,31], despite the biaxial local symmetry of the phase. The resonant X-ray scattering experiments provide a direct measurement of p ( T ) , but their temperature dependence shows some hysteresis, which is due to the polydomain structure of the samples, and the defect pinning that hinders the relaxation of the pitch to its equilibrium value after a temperature variation. Our ECENTB measurements do not suffer from this problem as no hysteresis of c α ( T ) is observed with our thin and well-aligned monodomain samples. Moreover, the smooth variation of c α ( T ) , observed on heating/cooling at a rate of 1 °C/min, indicates that the pitch follows the temperature variation adiabatically.
The ECENTB response times of the four dimers show the same behaviour as that reported in previous experiments using CB7CB. The on- and off- response times are the same, as expected from Equation (6), and they are very close to the N-NTB phase transition for all the compounds ( τ < 10 µs). However, the initial value was found to vary by one order of magnitude, from ~0.7 µs for CB7CB up to ~7 µs for BNA76. We attribute this variation to the different material constants in Equation (6) for the different dimers, in particular to the rotational viscosity γ 1 , which varies significantly between the different nematogenic compounds. Indeed, γ 1 is relatively small for the nematic compound 5CB [47], which is very close to the monomer unit of CB7CB and CB9CB. This correlates well with the faster ECE responses that we report for these compounds.
The temperature dependence of the response time is also similar for the different dimers. On cooling below Tc, τ decreases rapidly in the first 5–10 °C; then, it saturates to a ~20 °C wide plateau, for which the ECE response is the fastest ( τ < 1 µs); finally, on further cooling, τ ( T ) grows exponentially, clearly due to the usual Arrhenius-law increase of the rotational viscosity.
Qualitatively, assuming typical values of the nematic constants (see the detailed discussion for CB7CB in [9]), the initial values of c α and τ are consistent with those predicted theoretically in Equations (5) and (6). Similarly, the temperature dependences c α ( T ) and τ ( T ) agree qualitatively with Equations (5) and (6): with the nematic constants assumed to vary only weakly. The initial fast decrease of the curves would largely be explained by the expected increase of the heliconical wavenumber and tilt angle; the plateau would be explained by the saturation of the NTB heliconical parameters; and the final increase of τ ( T ) , which is absent for c α ( T ) , would be explained by the exponential growth of γ 1 at low temperature. Moreover, as expected theoretically, c α ( T ) and τ ( T ) follow a power law for at least 5 °C below the N-NTB transition. In fact, the power law fit is excellent for c α ( T ) over a much larger temperature range, see for example, Figs. 8 and 10, which confirms that the nematic constants, apart from γ 1 , vary only weakly with the temperature.
Despite this qualitative, or even semi-quantitative, agreement of our results with the CG theory, there are serious disagreements with the Landau models of the N-NTB phase transition. The main parameters derived from the power law fit of c α ( T ) and τ ( T ) are compared to the predictions of the theoretical models [31,40] in Table 2. Both models predict a second-order N-NTB transition and, therefore, that the critical temperature, T*, of the power laws should be identical to the measured transition temperature, Tc [31,40]. Theoretically, for a 2nd order transition, there is no biphasic coexistence, but it is observed experimentally for CB7CB and, although quite small, ~0.05 °C, for CB6OCB, indicates that the transition for these compounds is in fact first-order. For the other two compounds, the biphasic coexistence is essentially zero, which shows that the transition is much closer to being second-order, as indicated by the DSC data [15,38,39]. Nevertheless, for each compound, the critical temperature T* obtained from the power law fits of our data, differs from the transition temperature Tc. This result disagrees with the two Landau-like theoretical models of the N-NTB transition considered here [31,40], and with the second-order transition predicted by other theoretical models, based on a Landau-like [48] or a generalized Maier-Saupe [49] description of the NTB phase. Moreover, according to the models described in [31,40], the critical temperatures obtained from the fits of c α ( T ) and τ ( T ) should be identical for each compound, which again disagrees with our measurements. Indeed, different critical temperatures were systematically obtained from the two fits, T α * T α * > T c , which can be up to ~2 °C higher than T c (see Table 2). Quite surprisingly, at least for the case of T α * , the difference with T c is larger for the compounds CB6OCB and BNA76 that present an N-NTB transition almost second-order in nature and are therefore expected to be a better match to the theoretical prediction T α * = T τ * = T c .
Another significant discrepancy with the predictions of the theoretical models is revealed by the critical exponents obtained from the power law fits. Close to T * , both models [31,40] predict β α = 0.5 for the c α exponent, which is largely governed by only the p ( T ) dependency. However, the experimental values are not universal and instead are spread around a value, β α 0.25 , which is half the predicted value. Therefore, the experimental results for β α are in reasonable agreement with the prediction of the model described in Ref. [40], but below the cross-over temperature, T * δ T . Similarly, β τ varies significantly for the different dimers and is spread around the value β τ = 0.5, and is also far lower than the theoretically expected value of 2, (Ref. [31] and Ref. [40] above T * δ T . Even the lower value, β τ = 1, predicted by the model of Ref. [40] below the cross-over temperature, is significantly higher than the experimental values. Here also, there is no clear correlation between the strength of the first-order N-NTB transition and the corresponding results for β τ .
To understand the origin of the discrepancy between experiments and theory, we need to consider in more detail the approximations used in the models. The main features of the ECENTB effect (linear response to the field, opposite signs of the electroclinic tilt in monochiral domains with opposite handedness, geometry of the effect with deviation of the optic axis under field δ N E × N ) are in the CG approach, only based, on the macroscopic symmetry of the NTB phase and its analogy with the symmetry of the SmA* phase [31]. These main features are indeed observed for all the compounds studied, confirming once more the now well-established heliconical structure of the phase. Moreover, the small amplitude of the electroclinic tilt (α < 1°) and its extremely fast response time (τ < 10 µs) reveal qualitatively that the heliconical pitch is very small, in the order of 10 nm. (This conclusion follows directly from the analogy with the flexoelectric effect in the cholesteric phase [44] and the order of magnitude of the nematic constants involved.)
To reach a more quantitative description and to calculate the values of the ECE parameters, and their temperature dependences, c α ( T ) and τ ( T ) , the CG approach must rely on a microscopic theoretical model of the N-NTB transition. Any one of the two analytical Landau-like models considered here [31,40] leads to the simple expressions in Equations (5) and (6), which involve the nematic constants e 1 e 3 , K 11 + K 22 , and γ 1 . Unfortunately, most of these constants have not been measured for any NTB-forming compound, even in its nematic phase, and their behaviour in the NTB phase and across the N-NTB transition remains unknown. Therefore, to compare our measurements with theory, additional approximations must be made, namely that the nematic constants remain continuous at the transition, and vary slowly with temperature in the NTB phase (compared to the fast temperature dependency on the pitch and heliconical angle in the vicinity of the transition). However, this approximation, which is inspired by the prediction of the Landau-like models that the N-NTB transition is second-order, is questionable and its failure may explain to some extent the disagreement between the experimental results and the theoretical predictions.
The two analytical Landau-like models assume, explicitly [31] or implicitly [40], that the nematic order parameter S is continuous at the N-NTB transition. This assumption, leading to a second-order phase transition, denies the experimentally reported weakly first-order character of the transition [15,38,39], and the observed jump of the scalar order parameter S for CB7CB [10]. Further development of the models, taking into account the coupling between S and the structural NTB parameters, θ 0 and p , may lead to a first-order transition and, therefore, to finite values of θ 0 and p at the transition. This should also alter the power laws expected for these parameters and, consequently, for c α ( T ) and τ ( T ) , leading hopefully to better agreement with the experiments.
Lopez et al. [46] have already proposed a Landau-like model of the N-NTB phase transition that also takes account of the jump of the nematic order parameter tensor, Q, at the N-NTB transition, and the coupling of Q with the NTB order parameter sin θ 0 . This model predicts a first-order N-NTB transition, with strength decreasing with the thermal range of stability of the nematic phase above the NTB phase. This prediction is in excellent agreement with the experimental observations for a large number of NTB-forming compounds and with the calorimetric data for several mesogenic dimers and mixtures [46], including CB6OCB [16]. We expect that a future CG theory of the ECENTB, based on this improved Landau model, will provide a better agreement with our present experimental results.
Another possible improvement of the theoretical models might be to explicitly take into account the biaxiality of the nematic order parameter tensor, Q, in the NTB phase. Indeed, even in the N phase, the bend distortion breaks the revolution symmetry of the nematic phase and Q becomes slightly biaxial. Due to the strong spontaneous bend of the NTB phase, the resulting biaxiality of Q (which is again the primary order parameter of the phase) might become important, as it was recently reported to lead to important changes in the phase behaviour under an applied field [42]. Because the bend distortion, and therefore the biaxiality of the order tensor Q, depends strongly on the temperature, taking this dependence into account could lead to significant changes in the theoretically predicted behaviour for c α ( T ) and τ ( T ) , in better agreement with the experimental results.

6. Conclusions

We report here an extensive study of the electroclinic effect in the NTB phase of four mesogenic dimers. The ECENTB response is observed over the whole NTB temperature range of the compounds (more than 60 °C wide for CB9CB). The amplitude of the effect is very small at the phase transition (α~1° for E = 10 V/µm) and decreases further on cooling. As reported previously for CB7CB [9], the on- and off- ECE response times are equal and very short, typically in the microsecond range. This feature is very attractive for fast applications but has not yet been exploited because of the small amplitude of the electroclinic tilt. Qualitatively, our results are similar for all four compounds, despite their different physical properties including, for example, different signs of the dielectric anisotropy, and different strengths of the weakly first-order phase transition. The amplitude and the response time are largely related to the value of the heliconical pitch. Therefore, any practical application of the ECENTB might only be expected if compounds with larger NTB pitches (~30–50 nm) are discovered.
The measured temperature dependencies of the ECE parameters, c α ( T ) and τ ( T ) , follow power laws in the vicinity of the phase transition, as expected. However, as summarized in Table 2, the best fit parameters of this data differ substantially from the theoretically expected ones. We attribute this discrepancy to the assumptions made in the data interpretation process and in the theoretical models [31,40] themselves. In particular, we point out that better agreement might be expected from improved models taking into account two factors so far neglected: the coupling of the nematic order parameter with the parameters defining the NTB heliconical structure and the biaxiality of the nematic order parameter tensor in the NTB phase.

Author Contributions

Conceptualization, C.M. and I.D. (Ivan Dozov); investigation, P.D., G.R.L., I.D. (Irena Dokli), A.K., A.L., D.A.P., R.W., J.M.D.S. and C.T.I.; methodology, C.M., G.R.L. and I.D. (Ivan Dozov); writing—original draft, I.D. (Ivan Dozov); writing—review & editing, P.D., G.R.L., A.L. and C.T.I. All authors have read and agreed to the published version of the manuscript.

Funding

This research was funded by the Croatian Science Foundation (Grant No. IP-2019-04-7978); by the Agence Nationale pour la Recherche ANR (France) through Grant BESTNEMATICS, No. ANR-15-CE24-0012; by the French-Croatian bilateral program COGITO; by the Université de Picardie Jules Verne, Amiens, France.

Data Availability Statement

Data is contained within the article.

Conflicts of Interest

The authors declare no conflict of interest.

References

  1. Frank, F.C. On the theory of liquid crystals. Disc. Farad. Soc. 1958, 25, 19–28. [Google Scholar] [CrossRef]
  2. Freiser, M.J. Ordered states of a nematic liquid. Phys. Rev. Lett. 1970, 24, 1041. [Google Scholar] [CrossRef]
  3. Meyer, R.B. Molecular Fluids; Les Houches Summer School in Theoretical, Physics; Balian, R., Weill, G., Balian, R., Weill, G., Eds.; Gordon and Breach: New York, NY, USA, 1976; Volume XXV-1973, pp. 273–373. [Google Scholar]
  4. Lorman, V.L.; Mettout, B. Unconventional mesophases formed by condensed vector waves in a medium of achiral molecules. Phys. Rev. Lett. 1999, 82, 940–943. [Google Scholar] [CrossRef]
  5. Dozov, I. On the spontaneous symmetry breaking in the mesophases of achiral banana-shaped molecules. Europhys. Lett. 2001, 56, 247. [Google Scholar] [CrossRef]
  6. Memmer, R. Liquid crystal phases of achiral banana-shaped molecules: A computer simulation study. Liq. Cryst. 2002, 29, 483–496. [Google Scholar] [CrossRef]
  7. Cestari, M.; Diez-Berart, S.; Dunmur, D.A.; Ferrarini, A.; de la Fuente, M.R.; Jackson, D.J.B.; Lopez, D.O.; Luckhurst, G.R.; Perez-Jubindo, M.A.; Richardson, R.M.; et al. Phase behavior and properties of the liquid-crystal dimer 1″,7″-bis(4-cyanobiphenyl-4′-yl) heptane: A twist-bend nematic liquid crystal. Phys. Rev. E 2011, 84, 031704. [Google Scholar] [CrossRef] [Green Version]
  8. Meyer, C.; Davidson, P.; Constantin, D.; Sergan, V.; Stoenescu, D.; Knezevic, A.; Dokli, I.; Lesac, A.; Dozov, I. Freedericksz-Like Transition in a Biaxial Smectic-A Phase. Phys. Rev. X 2021, 11, 031012. [Google Scholar] [CrossRef]
  9. Meyer, C.; Luckhurst, G.R.; Dozov, I. Flexoelectrically Driven Electroclinic Effect in the Twist-Bend Nematic Phase of Achiral Molecules with Bent Shapes. Phys. Rev. Lett. 2013, 111, 067801. [Google Scholar] [CrossRef]
  10. Meyer, C.; Luckhurst, G.R.; Dozov, I. The temperature dependence of the heliconical tilt angle in the twist-bend nematic phase of the odd dimer CB7CB. J. Mater. Chem. 2015, 3, 318–328. [Google Scholar] [CrossRef]
  11. Imrie, C.T.; Walker, R.; Storey, J.M.D.; Gorecka, E.; Pociecha, D. Liquid Crystal Dimers and Smectic Phases from the Intercalated to the Twist-Bend. Crystals 2022, 12, 1245. [Google Scholar] [CrossRef]
  12. Mandle, R.J. A Ten-Year Perspective on Twist-Bend Nematic Materials. Molecules 2022, 27, 2689. [Google Scholar] [CrossRef]
  13. Borshch, V.; Kim, Y.K.; Xiang, J.; Gao, M.; Jakli, A.; Panov, V.P.; Vij, J.K.; Imrie, C.T.; Tamba, M.G.; Mehl, G.H.; et al. Nematic twist-bend phase with nanoscale modulation of molecular orientation. Nat. Commun. 2013, 4, 2635. [Google Scholar] [CrossRef] [Green Version]
  14. Chen, D.; Porada, J.H.; Hooper, J.B.; Klittnick, A.; Shen, Y.; Tuchband, M.R.; Korblova, E.; Bedrov, D.; Walba, D.M.; Glaser, M.A.; et al. Chiral heliconical ground state of nanoscale pitch in a nematic liquid crystal of achiral molecular dimers. Proc. Natl. Acad. Sci. USA 2013, 110, 15931–15936. [Google Scholar] [CrossRef] [Green Version]
  15. Paterson, D.A.; Abberley, J.P.; Harrison, W.T.; Storey, J.M.; Imrie, C.T. Cyanobiphenyl-based liquid crystal dimers and the twist-bend nematic phase. Liq. Cryst. 2017, 44, 127–146. [Google Scholar] [CrossRef]
  16. Paterson, D.A.; Gao, M.; Kim, Y.K.; Jamali, A.; Finley, K.L.; Robles-Hernandez, B.; Diez-Berart, S.; Salud, J.; de la Fuente, M.R.; Timimi, B.A.; et al. Understanding the twist-bend nematic phase: The characterisation of 1-(4-cyanobiphenyl-4′-yloxy)-6-(4-cyanobiphenyl-4′-yl)hexane (CB6OCB) and comparison with CB7CB. Soft Matter 2016, 12, 6827–6840. [Google Scholar] [CrossRef] [Green Version]
  17. Robles-Hernandez, B.; Sebastian, N.; Rosario de la Fuente, M.; Lopez, D.O.; Diez-Berart, S.; Salud, J.; Ros, M.B.; Dunmur, D.A.; Luckhurst, G.R.; Timimi, B.A. Twist, tilt, and orientational order at the nematic to twist-bend nematic phase transition of 1″,9″-bis(4-cyanobiphenyl-4′-yl) nonane: A dielectric, 2H NMR, and calorimetric study. Phys. Rev. E 2015, 92, 062505. [Google Scholar] [CrossRef] [Green Version]
  18. Salamonczyk, M.; Vaupotic, N.; Pociecha, D.; Wang, C.; Zhu, C.; Gorecka, E. Structure of nanoscale-pitch helical phases: Blue phase and twist-bend nematic phase resolved by resonant soft X-ray scattering. Soft Matter 2017, 13, 6694–6699. [Google Scholar] [CrossRef] [Green Version]
  19. Zhu, C.; Tuchband, M.R.; Young, A.; Shuai, M.; Scarbrough, A.; Walba, D.M.; Maclennan, J.E.; Wang, C.; Hexemer, A.; Clark, N.A. Resonant Carbon K-Edge Soft X-ray Scattering from Lattice-Free Heliconical Molecular Ordering: Soft Dilative Elasticity of the Twist-Bend Liquid Crystal Phase. Phys. Rev. Lett. 2016, 116, 147803. [Google Scholar] [CrossRef] [Green Version]
  20. Jokisaari, J.P.; Luckhurst, G.R.; Timimi, B.A.; Zhu, J.F.; Zimmermann, H. Twist-bend nematic phase of the liquid crystal dimer CB7CB: Orientational order and conical angle determined by Xe-129 and H-2 NMR spectroscopy. Liq. Cryst. 2015, 42, 708–721. [Google Scholar] [CrossRef]
  21. Adlem, K.; Copic, M.; Luckhurst, G.R.; Mertelj, A.; Parri, O.; Richardson, R.M.; Snow, B.D.; Timimi, B.A.; Tuffin, R.P.; Wilkes, D. Chemically induced twist-bend nematic liquid crystals, liquid crystal dimers, and negative elastic constants. Phys. Rev. E 2013, 88, 022503. [Google Scholar] [CrossRef]
  22. Panov, V.P.; Vij, J.K.; Balachandran, R.; Borshch, V.; Lavrentovich, O.D.; Tamba, M.G.; Mehl, G.H. Properties of the self-deforming Ntb phase in mesogenic dimers. In Liquid Crystals Xvii; Khoo, I.C., Ed.; SPIE: Bellingham, WA, USA, 2013; Volume 8828. [Google Scholar]
  23. Dawood, A.A.; Grossel, M.C.; Luckhurst, G.R.; Richardson, R.M.; Timimi, B.A.; Wells, N.J.; Yousif, Y.Z. Twist-bend nematics, liquid crystal dimers, structure-property relations. Liq. Cryst. 2017, 44, 106–126. [Google Scholar] [CrossRef]
  24. Mandle, R.J.; Cowling, S.J.; Goodby, J.W. Combined Microscopy, Calorimetry and X-ray Scattering Study of Fluorinated Dimesogens. Sci. Rep. 2017, 7, 13323. [Google Scholar] [CrossRef] [Green Version]
  25. Meyer, C.; Luckhurst, G.R.; Dozov, I. Broken-symmetry nematic banana phases: Predictions and reality. In Proceedings of the 24th International Liquid Crystal Conference, Mainz, Germany, 19–24 August 2012. [Google Scholar]
  26. Lewandowski, W.; Vaupotic, N.; Pociecha, D.; Gorecka, E.; Liz-Marzan, L.M. Chirality of Liquid Crystals Formed from Achiral Molecules Revealed by Resonant X-ray Scattering. Adv. Mater. 2020, 32, 1905591. [Google Scholar] [CrossRef]
  27. Mandle, R.J.; Goodby, J.W. Order parameters, orientational distribution functions and heliconical tilt angles of oligomeric liquid crystals. Phys. Chem. Chem. Phys. 2019, 21, 6839–6843. [Google Scholar] [CrossRef]
  28. Meyer, C.; Stoenescu, D.; Luckhurst, G.R.; Davidson, P.; Dozov, I. Smectic-like batonnets in nematic/twist-bend nematic biphasic samples. Liq. Cryst. 2017, 44, 232–243. [Google Scholar] [CrossRef]
  29. Salili, S.M.; Kim, C.; Sprunt, S.; Gleeson, J.T.; Parri, O.; Jákli, A. Flow properties of a twist-bend nematic liquid crystal. RSC Adv. 2014, 4, 57419–57423. [Google Scholar] [CrossRef]
  30. Meyer, C. Nematic twist-bend phase under external constraints. Liq. Cryst. 2016, 43, 2144–2162. [Google Scholar] [CrossRef]
  31. Meyer, C.; Dozov, I. Local distortion energy and coarse-grained elasticity of the twist-bend nematic phase. Soft Matter 2016, 12, 574–580. [Google Scholar] [CrossRef]
  32. Dozov, I.; Meyer, C. Analogy between the twist-bend nematic and the smectic A phases and coarse-grained description of the macroscopic N-TB properties. Liq. Cryst. 2017, 44, 4–23. [Google Scholar] [CrossRef]
  33. de Gennes, P.G. An analogy between superconductors and smectics A. Solid State Commun. 1972, 10, 753–756. [Google Scholar] [CrossRef]
  34. Shamid, S.M.; Dhakal, S.; Selinger, J.V. Statistical mechanics of bend flexoelectricity and the twist-bend phase in bent-core liquid crystals. Phys. Rev. E 2013, 87, 052503. [Google Scholar] [CrossRef] [Green Version]
  35. Garoff, S.; Meyer, R.B. Electro-clinic effect at AC phase-change in a chiral smectic liquid-crystal. Phys. Rev. Lett. 1977, 38, 848–851. [Google Scholar] [CrossRef]
  36. Panov, V.P.; Balachandran, R.; Nagaraj, M.; Vij, J.K.; Tamba, M.G.; Kohlmeier, A.; Mehl, G.H. Microsecond linear optical response in the unusual nematic phase of achiral bimesogens. Appl. Phys. Lett. 2011, 99, 261903. [Google Scholar] [CrossRef] [Green Version]
  37. Meyer, C.; Dozov, I.; Davidson, P.; Luckhurst, G.R.; Dokli, I.; Knezevic, A.; Lesac, A. Electric-field effects in the twist-bend nematic phase. In Emerging Liquid Crystal Technologies Xiii; Chien, L.C., Broer, D.J., Musevic, I., Chigrinov, V.G., Eds.; SPIE: Bellingham, WA, USA, 2018; Volume 10555. [Google Scholar]
  38. Barnes, P.J.; Douglass, A.G.; Heeks, S.K.; Luckhurst, G.R. An enhanced odd even effect of liquid-crystal dimers orientational order in the alpha, omega-bis(4′-cyanobiphenyl-4-yl)alkanes. Liq. Cryst. 1993, 13, 603–613. [Google Scholar] [CrossRef]
  39. Knežević, A.; Sapunar, M.; Buljan, A.; Dokli, I.; Hameršak, Z.; Kontrec, D.; Lesac, A. Fine-tuning the effect of π–π interactions on the stability of the NTB phase. Soft Matter 2018, 14, 8466–8474. [Google Scholar] [CrossRef]
  40. Parsouzi, Z.; Shamid, S.M.; Borshch, V.; Challa, P.K.; Baldwin, A.R.; Tamba, M.G.; Welch, C.; Mehl, G.H.; Gleeson, J.T.; Jakli, A.; et al. Fluctuation Modes of a Twist-Bend Nematic Liquid Crystal. Phys. Rev. X 2016, 6, 021041. [Google Scholar] [CrossRef] [Green Version]
  41. Pajak, G.; Longa, L.; Chrzanowska, A. Nematic twist-bend phase in an external field. Proc. Natl. Acad. Sci. USA 2018, 115, E10303–E10312. [Google Scholar] [CrossRef] [Green Version]
  42. Meyer, C.; Blanc, C.; Luckhurst, G.R.; Davidson, P.; Dozov, I. Biaxiality-driven twist-bend to splay-bend nematic phase transition induced by an electric field. Sci. Adv. 2020, 6, eabb8212. [Google Scholar] [CrossRef]
  43. Panov, V.P.; Song, J.K.; Mehl, G.H.; Vij, J.K. The Beauty of Twist-Bend Nematic Phase: Fast Switching Domains, First Order Freedericksz Transition and a Hierarchy of Structures. Crystals 2021, 11, 060621. [Google Scholar] [CrossRef]
  44. Patel, J.S.; Meyer, R.B. Flexoelectric electrooptics of a cholesteric liquid-crystal. Phys. Rev. Lett. 1987, 58, 1538–1540. [Google Scholar] [CrossRef]
  45. Meyer, R.B. Piezoelectric effects in liquid crystals. Phys. Rev. Lett. 1969, 22, 918. [Google Scholar] [CrossRef]
  46. López, D.O.; Robles-Hernandez, B.; Salud, J.; de la Fuente, M.R.; Sebastian, N.; Diez-Berart, S.; Jaen, X.; Dunmur, D.A.; Luckhurst, G.R. Miscibility studies of two twist-bend nematic liquid crystal dimers with different average molecular curvatures. A comparison between experimental data and predictions of a Landau mean-field theory for the NTB–N phase transition. Phys. Chem. Chem. Phys. 2016, 18, 4394–4404. [Google Scholar] [CrossRef] [Green Version]
  47. Wu, S.-T.; Wu, C.-S. Experimental confirmation of the Osipov-Terentjev theory on the viscosity of nematic liquid crystals. Phys. Rev. A 1990, 42, 2219–2227. [Google Scholar] [CrossRef]
  48. Kats, E.I.; Lebedev, V.V. Landau theory for helical nematic phases. JETP Lett. 2014, 100, 110–113. [Google Scholar] [CrossRef] [Green Version]
  49. Greco, C.; Luckhurst, G.R.; Ferrarini, A. Molecular geometry, twist-bend nematic phase and unconventional elasticity: A generalised Maier-Saupe theory. Soft Matter 2014, 10, 9318–9323. [Google Scholar] [CrossRef]
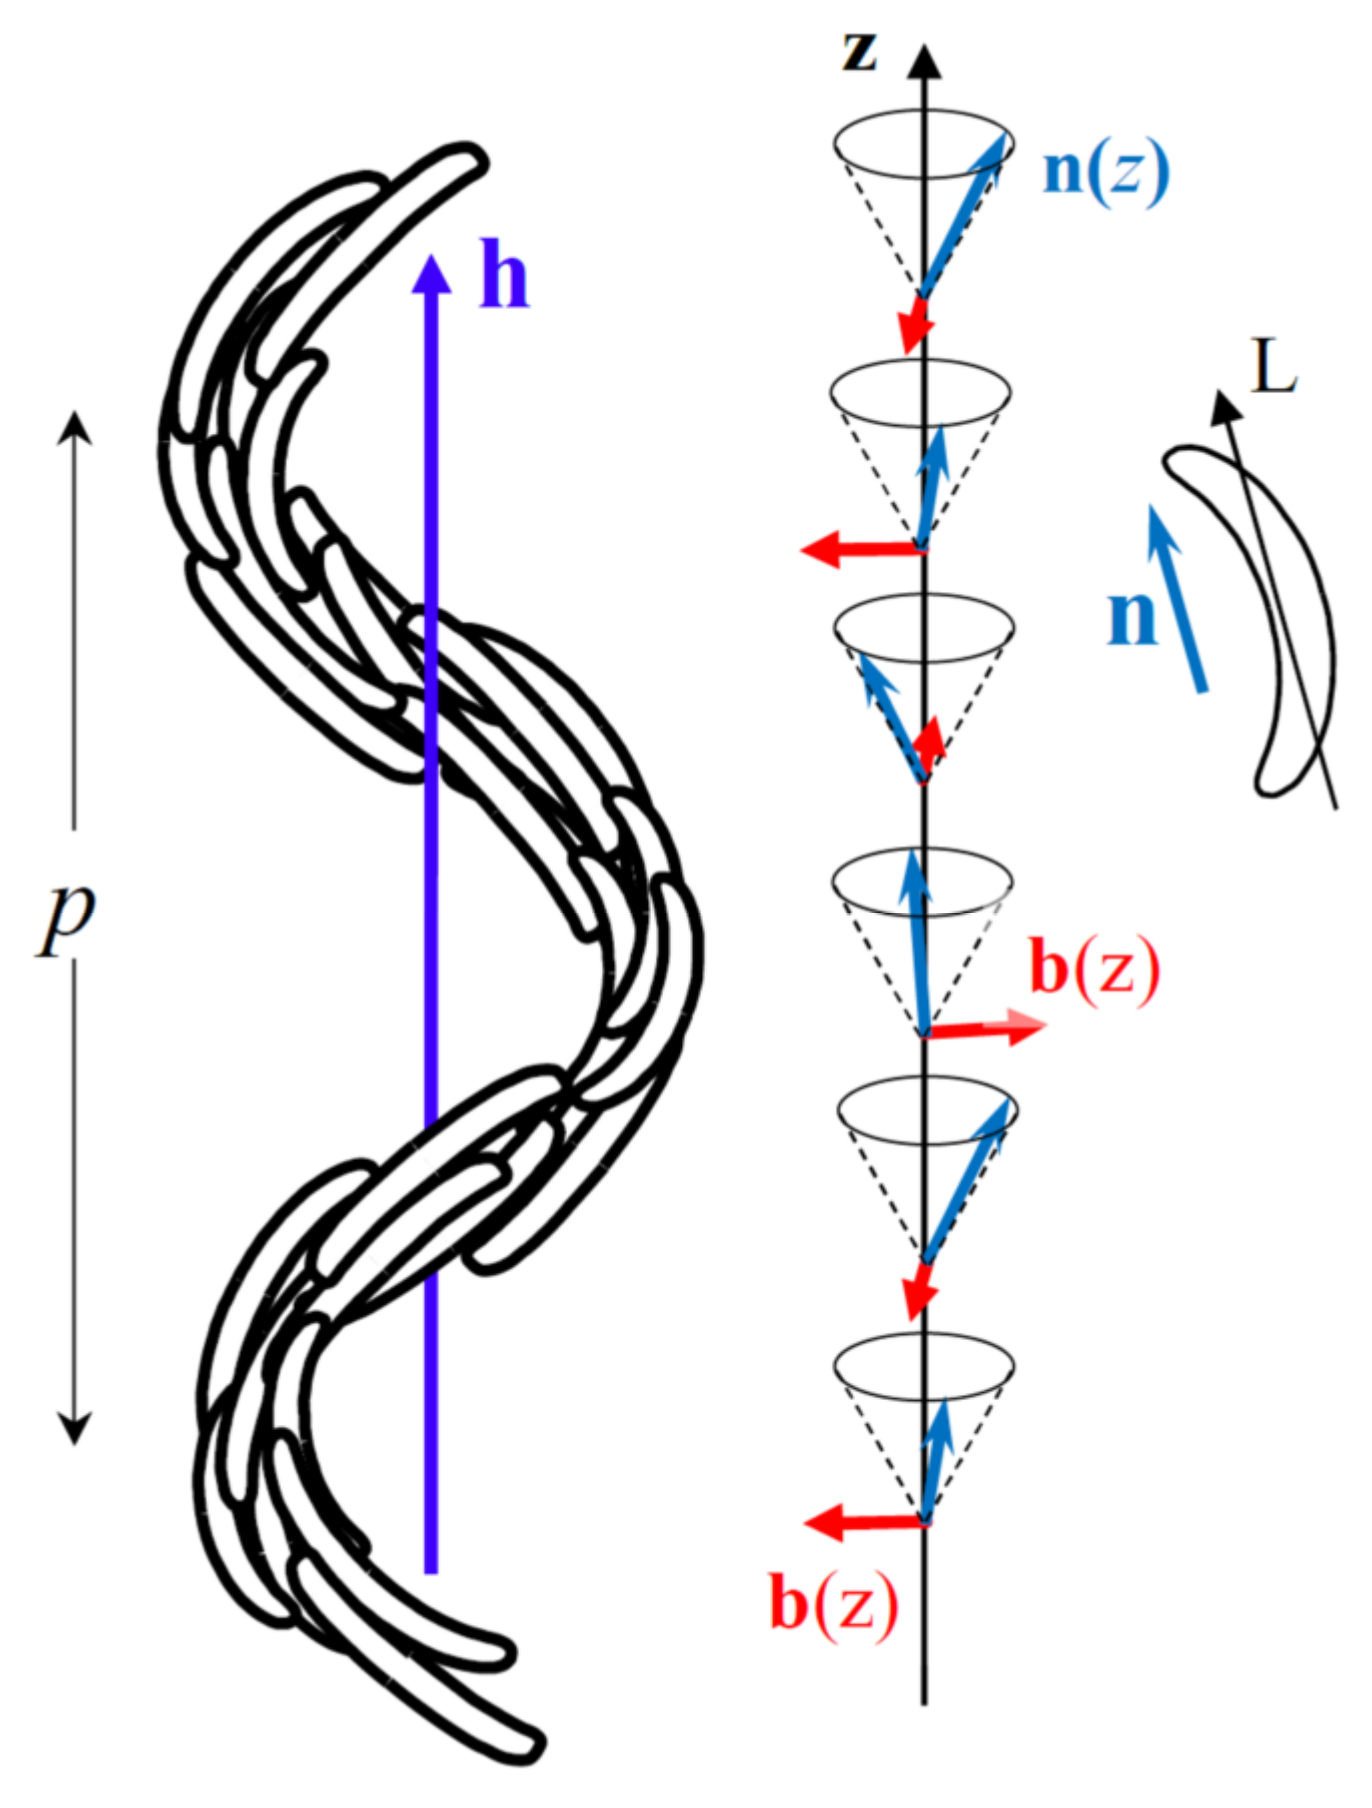
Figure 1. Heliconical structure of the NTB phase. The long axes, L, of the bent-shaped molecules are on average oriented parallel to the nematic director, n. Along the helix axis, h, the director rotates and follows a conical helix with pitch p. The bend vector, b, is organized on a right-angle helix. (The heliconical structure is doubly degenerate but only the right-handedness is shown here for simplicity.).
Crystals 13 00465 g001
Figure 2. The analogy between the layered structure of the SmA* phase (a) and the pseudo-layered structure of the NTB phase (b).
Crystals 13 00465 g002
Figure 3. Electroclinic effect in the SmA* (a) and NTB (b) phases. When the field is applied in the plane of the SmA* layers, the director n rotates in a plane perpendicular to E and tilts at an angle α with respect to the normal layers. Similarly, when an electric field is applied in a direction parallel to the NTB pseudo-layers, the optic axis, N, tilts away at an angle α from the helix axis, h, in a plane perpendicular to E. The whole director cone (the shaded region) tilts by the same angle α, without much distortion.
Crystals 13 00465 g003
Figure 4. The optical geometry used for the ECENTB measurements.
Crystals 13 00465 g004
Figure 5. ECENTB response (black open symbols) to a square dc pulse (15 V/µm, 20 µs) measured in a BNA76 monochiral domain. The solid lines are the best fit of the data with an exponential law for the rise (red) and the fall (blue) of the response. The inset shows two large monochiral uniform domains of opposite chirality observed with slightly uncrossed polarizers.
Crystals 13 00465 g005
Figure 6. CB6OCB at T = 108.05 °C: Time-evolution of the electroclinic tilt angle α (blue open symbols, right axis) subject to a triangular voltage pulse (black line, left axis).
Crystals 13 00465 g006
Figure 7. Temperature dependence of the ECE parameters, c α ( T ) and τ ( T ) , measured in the NTB phase of the dimer CB7CB. The inset shows a magnification of the relatively large N-NTB biphasic coexistence range.
Crystals 13 00465 g007
Figure 8. Best fits (red solid lines) of c α ( T ) and τ ( T ) with power laws for CB7CB: (a) For c α ( T ) , the fit c α ( T ) ( T α * T ) β α is good over the entire (60 °C) range under study, with T α * = 100.05 °C and β α = 0.23; (b) For the response time, the law τ ( T ) ( T τ * T ) β τ , with T τ * = 100.20 °C and β τ = 0.42 fits the curve well only in a range of about 6 °C. At low temperature, the curve is well-fitted by an exponential growth law (blue dashed curve).
Crystals 13 00465 g008
Figure 9. Temperature dependence of the ECE parameters, c α ( T ) and τ ( T ) , measured in the NTB phase of the bent-shaped dimer CB9CB. For this compound, the N-NTB biphasic coexistence temperature range is very narrow and almost undetectable.
Crystals 13 00465 g009
Figure 10. Best fits (red solid lines) of c α ( T ) and τ ( T ) with power laws for CB9CB: (a) For c α ( T ) , the fit c α ( T ) ( T α * T ) β α is good over the entire (>60 °C) range under study, with T α * = 107.45 °C and β α = 0.33; (b) The power law τ ( T ) ( T τ * T ) β τ , with T τ * = 100.14 °C and β τ = 0.45 fits the curve well only in a range of about 5 °C. As for CB7CB, at low temperature, the curve is well-fitted by an exponential growth law (blue dashed curve).
Crystals 13 00465 g010
Figure 11. Temperature dependences of the ECE parameters, c α ( T ) and τ ( T ) , measured in the NTB phase of the bent-shaped dimer CB6OCB. The inset shows a magnification of the N-NTB biphasic coexistence range.
Crystals 13 00465 g011
Figure 12. Best fits (solid red lines) of c α ( T ) and τ ( T ) with power laws for CB6OCB: (a) For c α ( T ) , the fit c α ( T ) ( T α * T ) β α provides T α * = 109.78 °C and β α = 0.31; (b) The power law for the response time, τ ( T ) ( T τ * T ) β τ , gives T τ * = 108.44 °C and β τ = 0.64.
Crystals 13 00465 g012
Figure 13. Temperature dependences of the ECE parameters, c α ( T ) and τ ( T ) , measured in the NTB phase of the dimer BNA76. The N-NTB phase transition takes place at Tc = 120.00 °C and the N-NTB biphasic coexistence temperature range is very narrow, almost undetectable.
Crystals 13 00465 g013
Figure 14. Best fits (solid red lines) of c α ( T ) and τ ( T ) with power laws for BNA76: (a) For c α ( T ) , the fit c α ( T ) ( T α * T ) β α is very good over the entire 25 °C range under study, with T α * = 121.17 °C and β α = 0.23; (b) The power law τ ( T ) ( T τ * T ) β τ , with T τ * = 120.50 °C and β τ = 0.78, fits the curve well only in a range of about 6 °C.
Crystals 13 00465 g014
Table 1. Molecular structure and phase transition temperatures of the mesogenic dimers. The temperatures are measured on cooling in our thin sandwich cells. The biphasic coexistence range and its median temperature, Tc, are shown for the N-NTB phase transition. Also shown, in brackets, are the melting points of the crystal/solid which gives the NTB phase for the three cyanobiphenyl dimers [15] and that containing two naphthalene groups [39]. These are included to show that thermodynamically the twist-bend nematic range can be extremely short; however this range can be significantly extended as early studies, especially for CB7CB, have shown [7].
CompoundMolecular Structure and Phase Transition Temperatures
CB7CBCrystals 13 00465 i001
Iso—114.8 °C-N—99.85 ± 0.35 °C-NTB—37 °C-Cr (Cr—102 °C-NTB)
CB9CBCrystals 13 00465 i002
Iso—124.1 °C-N—107.00 ± 0.0 °C-NTB—41 °C-Cr (Cr—86 °C-NTB)
CB6OCBCrystals 13 00465 i003
Iso—156.6 °C-N—108.08 ± 0.03 °C-NTB—80 °C-Cr (Cr—99 °C-NTB)
BNA76Crystals 13 00465 i004
Iso—153.1 °C-N—120.00 ± 0.0 °C-NTB—89 °C-SmAb (Cr—121 °C-NTB)
Table 2. Comparison of the ECENTB parameters obtained from the power law fits of the experimental results with the predictions of the theoretical models.
CompoundECE ExperimentTheory [9,31]Theory [40]
Δ T α
(°C)
Δ T τ
(°C)
β α β τ Δ T
(°C)
β α β τ Δ T
(°C)
T > T * δ T T < T * δ T
β α β τ β α β τ
CB7CB0.200.350.230.4200.52.000.52.00.251.0
CB9CB0.450.140.330.4500.52.000.52.00.251.0
CB6OCB1.700.360.310.6400.52.000.52.00.251.0
BNA761.170.500.230.7800.52.000.52.00.251.0
Disclaimer/Publisher’s Note: The statements, opinions and data contained in all publications are solely those of the individual author(s) and contributor(s) and not of MDPI and/or the editor(s). MDPI and/or the editor(s) disclaim responsibility for any injury to people or property resulting from any ideas, methods, instructions or products referred to in the content.