Article

Synthesis and Luminescence Properties of Green-to-Red Color-Tunable Upconverting K2Gd(PO4)(WO4):Yb3+,Tb3+,Eu3+ Phosphors

by
Julija Grigorjevaite
* and
Arturas Katelnikovas
*
Institute of Chemistry, Faculty of Chemistry and Geosciences, Vilnius University, Naugarduko 24, LT-03225 Vilnius, Lithuania
*
Authors to whom correspondence should be addressed.
Crystals 2023, 13(3), 479; https://doi.org/10.3390/cryst13030479
Submission received: 15 February 2023 / Revised: 3 March 2023 / Accepted: 8 March 2023 / Published: 10 March 2023
(This article belongs to the Special Issue Luminescence Properties of Crystalline Materials)

Abstract

:
Scientists are increasingly interested in new inorganic luminescence materials that could be excited with near-infrared (NIR) radiation. These materials can be used as luminescent thermometers, bio-imaging agents, anti-counterfeiting pigments, etc. In this manuscript, we report the synthesis and investigation of optical properties of two series of K2Gd(PO4)(WO4):20%Tb3+ (KGPW): the first, KGPW:20%Tb3+ doped with 1–20% Eu3+, and the second, KGPW:10%Yb3+,20%Tb3+ doped with 1–20% Eu3+. The phase-pure specimens were prepared using a solid-state synthesis method. Down-shifting and upconversion luminescence studies have been performed using 340 and 980 nm excitation, respectively. For upconversion emission luminescence, Yb3+ ions were used as sensitizers in the KGPW phosphors. In these phosphors, Yb3+ ions absorb the 980 nm radiation and transfer the energy to Tb3+ ions. At his point, Tb3+ ions either emit themselves or transfer part or all of their energy to Eu3+ ions. It was observed that the emission color of the synthesized phosphors could be successfully tuned from the green to red by varying the Tb/Eu concentration ratio regardless of the 340 or 980 nm excitation. Such color change proves that one luminescent material (KGPW) can provide three colors (i.e., green, orange, and red). Herein, the optical properties, such as reflection, down-shifting excitation and emission spectra, upconversion emission spectra, fluorescence lifetime, thermal quenching, color coordinates, and quantum efficiency, were studied using steady-state and kinetic spectroscopy.

Graphical Abstract

1. Introduction

In modern times, luminescent materials are still engaging due to their range of applications and wide variety of fields to potentially be applied to. Inorganic luminescent materials doped with trivalent lanthanide ions (RE3+) are applied in solar cells [1], scintillators [2], light-emitting diodes [3], lasers [4], upconverting materials [5], security pigments [6], nanoscale optical writing [7], nanoscopy [8], etc. When RE3+ ions are introduced into suitable host matrices, partly forbidden f-f transitions become weakly allowed, and doped materials show photoluminescence properties. Thus, photoluminescence could be observed in two ways: down-shifting (DS) and upconversion (UC). When materials are excited with UV radiation, DS is observed. UC is a process wherein materials are excited with low-energy photons, commonly from laser excitation, and emit photons with higher-energy. Upconverting materials consist of a host doped with sensitizer and activator ions [9]. The well-known, widely used and reviewed sensitizer/activator pairs are Yb/Ho, Yb/Er, and Yb/Tm. The Yb3+ energy level structure is rather simple. It consists of only two energy levels: 2F7/2 (ground state) and 2F5/2 (excited state). The energy of the excited level matches well with the f-f energy levels of other RE3+ ions. The Yb/Tb sensitizer/activator pair is not widely studied, giving an opportunity to find novel UC phosphors. The excited state of Yb3+ (2F5/2) overlaps with Tb3+ excited states (5D2 and 5D4), allowing energy transfer from Yb3+ to Tb3+.
Up until now, the most efficient UC lattice is still NaYF4 [10]; this particular host is broadly discussed [11,12,13,14]. This host lattice has already been known for five decades, even though the synthesis of phase-pure NaYF4 is still challenging. Usually, NaYF4 synthesis yields two phases (hexagonal β–phase and cubic α–phase), and the synthesis of such nanoparticles requires a large amount of organic solvents [15,16]. For this reason, novel inorganic UC materials have received more attention.
The Yb/Tb/Eu system is the new alternative for the red-emitting Yb/Er sensitizer/activator pair and could possess a longer luminescence lifetime [17]. The upconverting materials possessing Tb3+ and Eu3+ allow the green/red emission ratio to change in the same matrix. Energy levels of Yb3+ do not overlap with Eu3+ energy levels. Due to this mismatch in energy levels, energy cannot be transferred from Yb3+ to Eu3+ directly. On the other hand, Tb3+ and Eu3+ energy levels overlap perfectly, and energy is transferred by a Yb3+ → Tb3+ → Eu3+ mechanism [18,19,20]. The excited state of Tb3+ (5D4) has a similar energy to the 5D0 level of Eu3+ ions. In this system, Tb3+ plays the role of the bridge between Yb3+ and Eu3+ ions. Thus, this mechanism allows the achievement of a color-tunable emission by changing the Eu3+ concentration in the samples.
There are many reasons why Eu3+ upconversion is worth analyzing [21,22]. The main reason is that Yb3+/Tb3+/Eu3+ has not been widely studied yet and that gives us an opportunity to find new information about this system and the upconversion mechanism. Furthermore, the long luminescence lifetime of Eu3+ ions could be interesting for bio-imaging processes, using the Yb → Tb → Eu energy transfer mechanism [17]. Thus, the synthesized materials could be used as a red solid-state laser based on upconversion luminescence [23].
Tb3+ and Eu3+ ions are well known for their high emission efficiency related to the largest energy gap between emitting states and lower lying 7FJ (J = 0, 1, 2, 3, 4, 5, 6, and 7) within lanthanides. Therefore, it is very interesting to study this UC system. For a better understanding, excitation and emission lines together with energy transfer are represented in fragments of Tb3+, Eu3+, and Yb3+ in Dieke’s diagram (see Figure 1). Tb3+ is directly excited with a 340 nm excitation wavelength, and the 7F6 energy level is excited to 5D2 and then transferred two ways: (1) the energy relaxes to 5D3, 5G6, or 5D4 and emits radiatively; and (2) the energy from 5D2 or 5D4 is transferred to Eu3+ and emits from 5D0 to 7F4;2;1 energy levels. For the upconversion optical property investigation, ions should be excited with a laser. For this reason, Yb3+ ions were incorporated in the matrix. The Yb3+ absorbs the laser radiation via the 2F7/22F5/2 transition and transfers it to Tb3+ which emits itself and transfers the energy further to Eu3+. The energy from Yb3+ could not be transferred directly to Eu3+ ions as was confirmed by the emission spectra of the KGPW:10%Yb3+,20%Eu3+ sample when the sample was exposed to 980 nm laser radiation (please refer to Figure S1 see Supplementary Materials).
The KGPW host was extensively studied in our previous work. We have shown that the KGPW host is suitable for traditional upconversion pairs such as Yb/Er [24], Yb/Ho [25], and Yb/Tm [26]. The obtained upconverting materials showed emission in red, green/red, and blue/deep-red spectral areas, respectively. Herein, we investigate a more difficult system in the same host where three ions are involved in the upconversion process. The main aim of this work was to obtain new inorganic materials with tunable emission from the green-to-red spectral range under 340 and 980 nm excitation. For this reason, the KGPW:20%Tb3+ and KGPW:10%Yb3+,20%Tb3+ doped with 1–20% Eu3+ were synthesized using the solid-state reaction method at a fairly low temperature (873 K). The KGPW doped with all three rare-earth elements has not been synthesized before. This novel investigation could be interesting for understanding the Yb-Tb-Eu upconversion mechanism. The morphological and optical properties were investigated. The given data will include XRD, SEM, reflection, excitation, and emission spectra at room temperature and a 77–500 K interval, photoluminescence lifetimes, quantum efficiencies, and CIE 1931 color coordinates. Green (Tb3+) and red (Eu3+) luminescence can be obtained within the same compound at the same excitation wavelength by exciting Tb3+ directly and Eu3+ indirectly. The ration of green/red luminescence can be changed by varying the Eu3+ concentration. Herein, we will initially discuss the interaction between Tb3+ and Eu3+ ions when both are introduced into KGPW and KGPW:10%Yb3+ host matrices.

2. Materials and Methods

The samples were synthesized by the conventional solid-state reaction method according to our previous work [3,6]. The stoichiometric amounts of raw materials Gd2O3 (99.99% Tailorlux, Münster, Germany), K2CO3 (99+% Acros Organics, Geel, Belgium), NH4H2PO4 (99% Reachem, Bratislava, Slovakia), WO3 (99+% Acros Organics, Geel, Belgium), Eu2O3 (99.99% Tailorlux, Münster, Germany), Tb4O7 (99.99% Tailorlux, Münster, Germany), and Yb2O3 (99.99% Alfa Aesar, Haverhill, MA, USA) were weighed and mixed in an agate mortar using a few milliliters of acetone to ease the homogenization. The starting materials were ground with an agate pestle until all acetone evaporated. Subsequently, the blended materials were placed into the porcelain crucible and annealed three times at 873 K for 10 h in air. The powders were reground after each annealing step. The Eu3+ concentration in the KGPW:20%Tb3+ and KGPW:10%Yb3+,20%Tb3+ compounds were 1%, 2.5%, 5%, 10%, and 20%. The phase purity of the synthesized samples was checked using a Rigaku MiniFlexII (Rigaku, Tokyo, Japan) X-ray diffractometer working in a Bragg–Brentano focusing geometry. SEM images were taken using a FE-SEM Hitachi SU-70 (Hitachi, Tokyo, Japan) scanning electron microscope. Reflection, excitation, and emission spectra were recorded using modular a Edinburgh Instruments FLS980 spectrometer (Edinburgh Instruments, Livingston, UK) equipped with a 450 W Xe lamp and 980 nm emitting laser (MDL-III-980-1W) (Changchun New Industries Optoelectronics Tech. Co., Ltd., Changchun, P.R. China) as the excitation sources. The temperature-dependent measurements were performed on the same spectrometer equipped with a cryostat “MicrostatN” (77–500 K temperature range) from Oxford Instruments (Oxford Instruments, Abingdon, UK). The detailed measurement settings are reported in the supporting information file (please refer to Tables S1–S4).

3. Results and Discussion

3.1. Structural Analysis

The XRD patterns of the prepared samples are given in Figure S2. The patterns of the samples match well with the reference pattern of K2Bi(PO4)(WO4) (PDF4+ (ICDD) 04-013-4256). As expected, KGPW adopts the same orthorhombic crystal structure with the Ibca (#73) space group as K2Bi(PO4)(WO4) does. Due to the similar ionic radii, Gd3+ (1.053 Å) successfully replaces Bi3+ (1.17 Å) in the host matrix [27]. Ionic radii of Yb3+ (0.985 Å), Eu3+ (1.066 Å), and Tb3+ (1.04 Å) are very similar to the Gd3+ ionic radius; therefore, the single-phase KGPW compounds formed regardless the concentration of the dopant ions.
To calculate the unit cell parameters of the synthesized compounds, Rietveld refinement of the XRD patterns was performed using FullProf Suite software. K2Ho(PO4)(WO4) was used as a reference (PDF4+ (ICDD) 04-015-9304) [28]. The refinement results for KGPW, KGPW:20%Tb3+, KGPW:20%Eu3+, and KGPW:10%Yb3+,20%Tb3+,20%Eu3+ samples are shown in Figure 2. The obtained unit cell parameters are given in Table S5. As anticipated, the lattice parameters decreased if samples were doped with Yb3+ and Eu3+ due to the smaller ionic radii when compared to Gd3+.
The morphological features of KGPW powders doped with Yb3+, Tb3+, and Eu3+ were evaluated by taking SEM images, which are shown in Figures S3 and S4 under different magnifications. The powder particles consist of irregularly shaped small crystallites which are heavily agglomerated. No significant difference in crystallite shape and size was observed between the samples doped with different concentrations of lanthanide ions.

3.2. Photoluminescence Studies

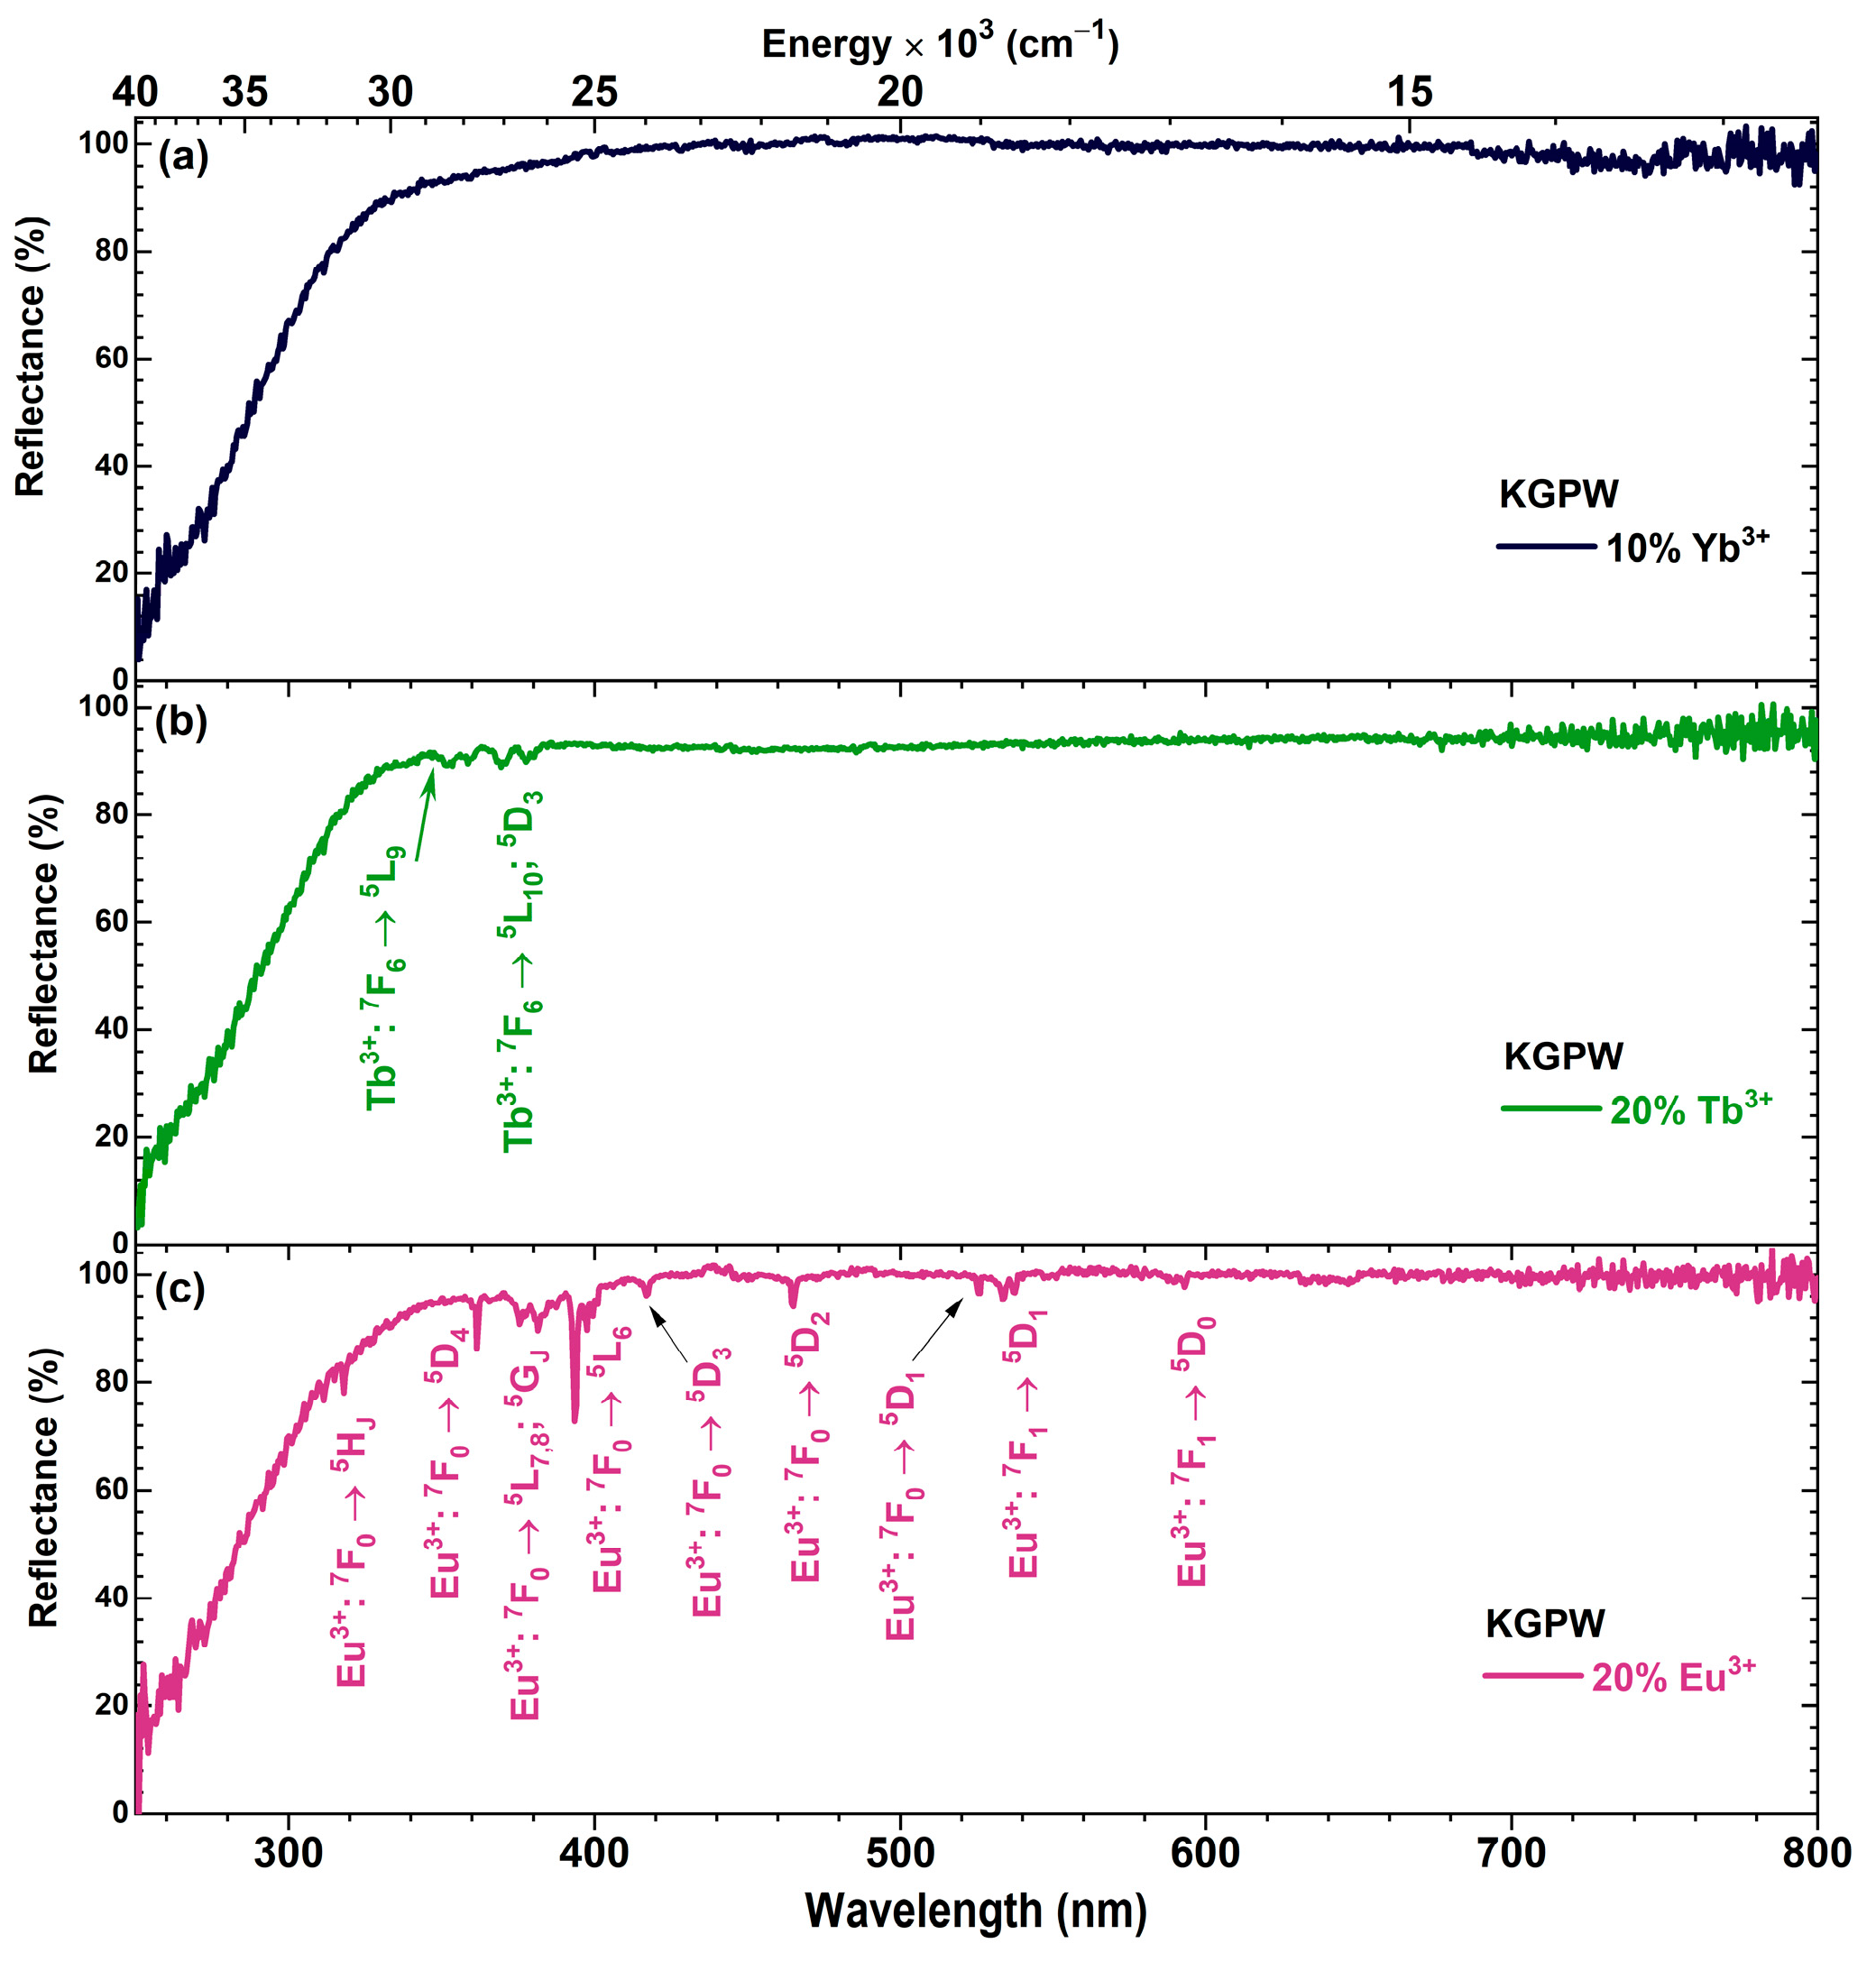
The reflection spectra of KGPW:10%Yb3+ (black line), KGPW:20%Tb3+ (green line), and KGPW:20%Eu3+ (red line) samples are given in Figure 3a–c, respectively. The reflection spectra were measured in the range from 250 to 800 nm. The sample doped with Eu3+ possesses typical Eu3+ absorption lines originating from the 7F0 and 7F1 energy levels. The observed Eu3+ absorption lines are assigned to 7F05HJ (ca. 318 nm), 7F05D4 (ca. 360 nm), 7F05L7,8; 5GJ (ca. 374–390 nm), 7F05L6 (ca. 390–402 nm), 7F05D3 (ca. 418 nm), 7F05D2 (ca. 465 nm), 7F05D1 (ca. 526 nm), 7F15D1 (ca. 530–539 nm), and 7F15D0 (ca. 594 nm). The sample doped with Tb3+ shows two sets of absorption lines, which are attributed to the Tb3+ 7F65L9 (ca. 346–361 nm) and 7F65L10; 5D3 (ca. 361–384 nm) transitions [29]. The body color of the sample doped with Tb3+ was brownish; therefore, the reflectance values at longer wavelengths were lower when compared to the sample containing no Tb3+. The brownish color is likely caused by traces of Tb4+ present in the samples due to the incomplete reduction in terbium to the trivalent state. In this case, the charge transfer between Tb3+ and Tb4+ occurs after absorption of photons in the entire visible range (Tb4O7 (Tb2O3·2TbO2), used in synthesis, for instance, is dark brown). The broad absorption band observed in all three samples in the range of 250–340 nm could be attributed to the host lattice absorption. The reflection spectra of co-doped samples are depicted in Figure S5. All the co-doped samples show typical sets of absorption lines of the dopant ions. The reflectance values at longer wavelengths decrease to 90–95% if the samples are co-doped with Tb3+. The absorption lines are the same as in the singly doped samples and are attributed to Eu3+ or Tb3+ ions.
The reflection spectrum of undoped KGPW was used to determine the bandgap of the host material. Firstly, the reflection spectrum was converted to a Tauc plot. The subsequent linear approximation of the obtained spectrum showed that the bandgap of KGPW was 3.8 eV.
The excitation (λem = 614 nm) spectra of undoped KGPW, KGPW:20%Tb3+, KGPW:20%Eu3+, and KGPW:20%Tb3+,20%Eu3+ are depicted in Figure 4. The excitation spectrum (please refer to Figure 4a) of the undoped KGPW host matrix contains three sets of Gd3+ excitation lines: 8S → 6IJ (ca. 270–279 nm), 8S → 6P5/2 (ca. 305 nm), and 8S → 6P7/2 (ca. 311 nm) [30]. Since Gd3+ ions do not emit at 614 nm, there should be no excitation lines at all; therefore, it is likely that this sample contains traces of Eu3+ coming either from transport reactions in the furnace or impurities in the starting materials. This assumption is supported by a weak excitation line at ca. 394 nm, which is typical for the 7F05L6 transition of Eu3+. The same weak excitation line was also observed for the KGPW:10%Yb3+ sample (please refer to Figure S6b). The excitation spectrum of the KGPW:20%Tb3+ (please refer to Figure 4b) sample possesses typical Tb3+ excitation lines originating from 7F6 ground state level transitions to 5H7 (ca. 316–323 nm), 5D1 (ca. 324–332 nm), 5L7;8 (ca. 335–346 nm), 5D2; 5L9 (ca. 347–356 nm), 5G5 (ca. 359 nm), 5L10 (ca. 365–373 nm), 5D3; 5G6 (ca. 375–384 nm), and 5D4 (ca. 486 nm) excited state levels [29]. The excitation spectrum of the KGPW:20%Eu3+ (please refer to Figure 4c) sample possesses the same sets of excitation lines, which were also detected in the reflection spectrum. The excitation spectrum of the KGPW:20%Tb3+,20%Eu3+ sample shows transitions of all three ions (Gd3+, Tb3+, and Eu3+) (please refer to Figure 4d). As predicted, the most intense transition line is attributed to Eu3+ 7F05L6 (ca. 394 nm) because emission was monitored at a 614 nm wavelength. Excitation spectra of KGPW:10%Yb3+,20%Tb3+,20%Eu3+ and KGPW:10%Yb3+em = 614 nm) are depicted in Figure S6a and Figure S6b, respectively. The excitation spectra of the KGPW:10%Yb3+ sample also showed three typical Gd3+ excitation lines as well as a vanishingly small Eu3+ excitation line at ca. 394 nm, indicating that a small amount of Eu3+ ions is present in the sample.
The emission spectra (λex = 340 nm) of KGPW:20%Tb3+,Eu3+ and KGPW:10%Yb3+,20%Tb3+,Eu3+ doped with 0% and 20% of Eu3+ are depicted in Figure 5 and Figure S7, respectively. Since Yb3+ cannot be excited with 340 nm wavelength radiation, the introduction of Yb3+ into the crystal lattice has no significant effect on the emission spectra of Tb3+ and Eu3+. The KGPW:20%Tb3+ sample shows typical Tb3+ emission lines originating from 5D47F6 (ca. 480–500 nm), 5D47F5 (ca. 535–560 nm), 5D47F4 (ca. 577–592 nm), and 5D47F3 (ca. 613–627 nm) optical transitions. No emission lines that could be attributed to Eu3+ were observed in solely Tb3+-doped samples. Completely different spectra were observed when Eu3+ ions were included in the samples. The Eu3+-concentration-dependent emission spectra of KGPW:20%Tb3+ under 340 nm excitation are shown in Figure S8. The integrated intensity of the samples increases with increasing Eu3+, although the intensity of Tb3+ transitions such as 5D47F6 and 5D47F5 drastically decrease with increasing Eu3+ concentration. Thus, as it was expected, the emission intensity of the Eu3+ 5D07F2 transition coherently increases with increasing Eu3+ concentration and reaches the highest intensity in the 20%Eu3+-doped sample. A similar tendency was observed with KGPW:10%Yb3+,20%Tb3+,Eu3+ as a function of Eu3+ concentration (please refer to Figure S9). However, contrary to the tendency discussed earlier, the integrated intensity of samples increases up to 5% Eu3+ and then slightly decreases. As we can see from the emission spectra (λex = 340 nm), the energy from Tb3+ is transferred to Eu3+; therefore, we see the emission lines attributed to both Tb3+ and Eu3+ optical transitions. Emission spectra of the samples doped with Eu3+ and Tb3+ show typical Eu3+ emission lines, whereas the Tb3+ emission intensity drastically decreases with increasing Eu3+ concentration in the material and almost vanishes when Eu3+ concentration reaches 20%. Both samples, KGPW:20%Tb3+,20%Eu3+ and KGPW:10%Yb3+,20%Tb3+,20%Eu3+, show typical Eu3+ emission lines in the ranges 583–600 nm (5D07F1), 605–630 nm (5D07F2), 645–655 nm (5D07F3), and 688–708 nm (5D07F4) [31].
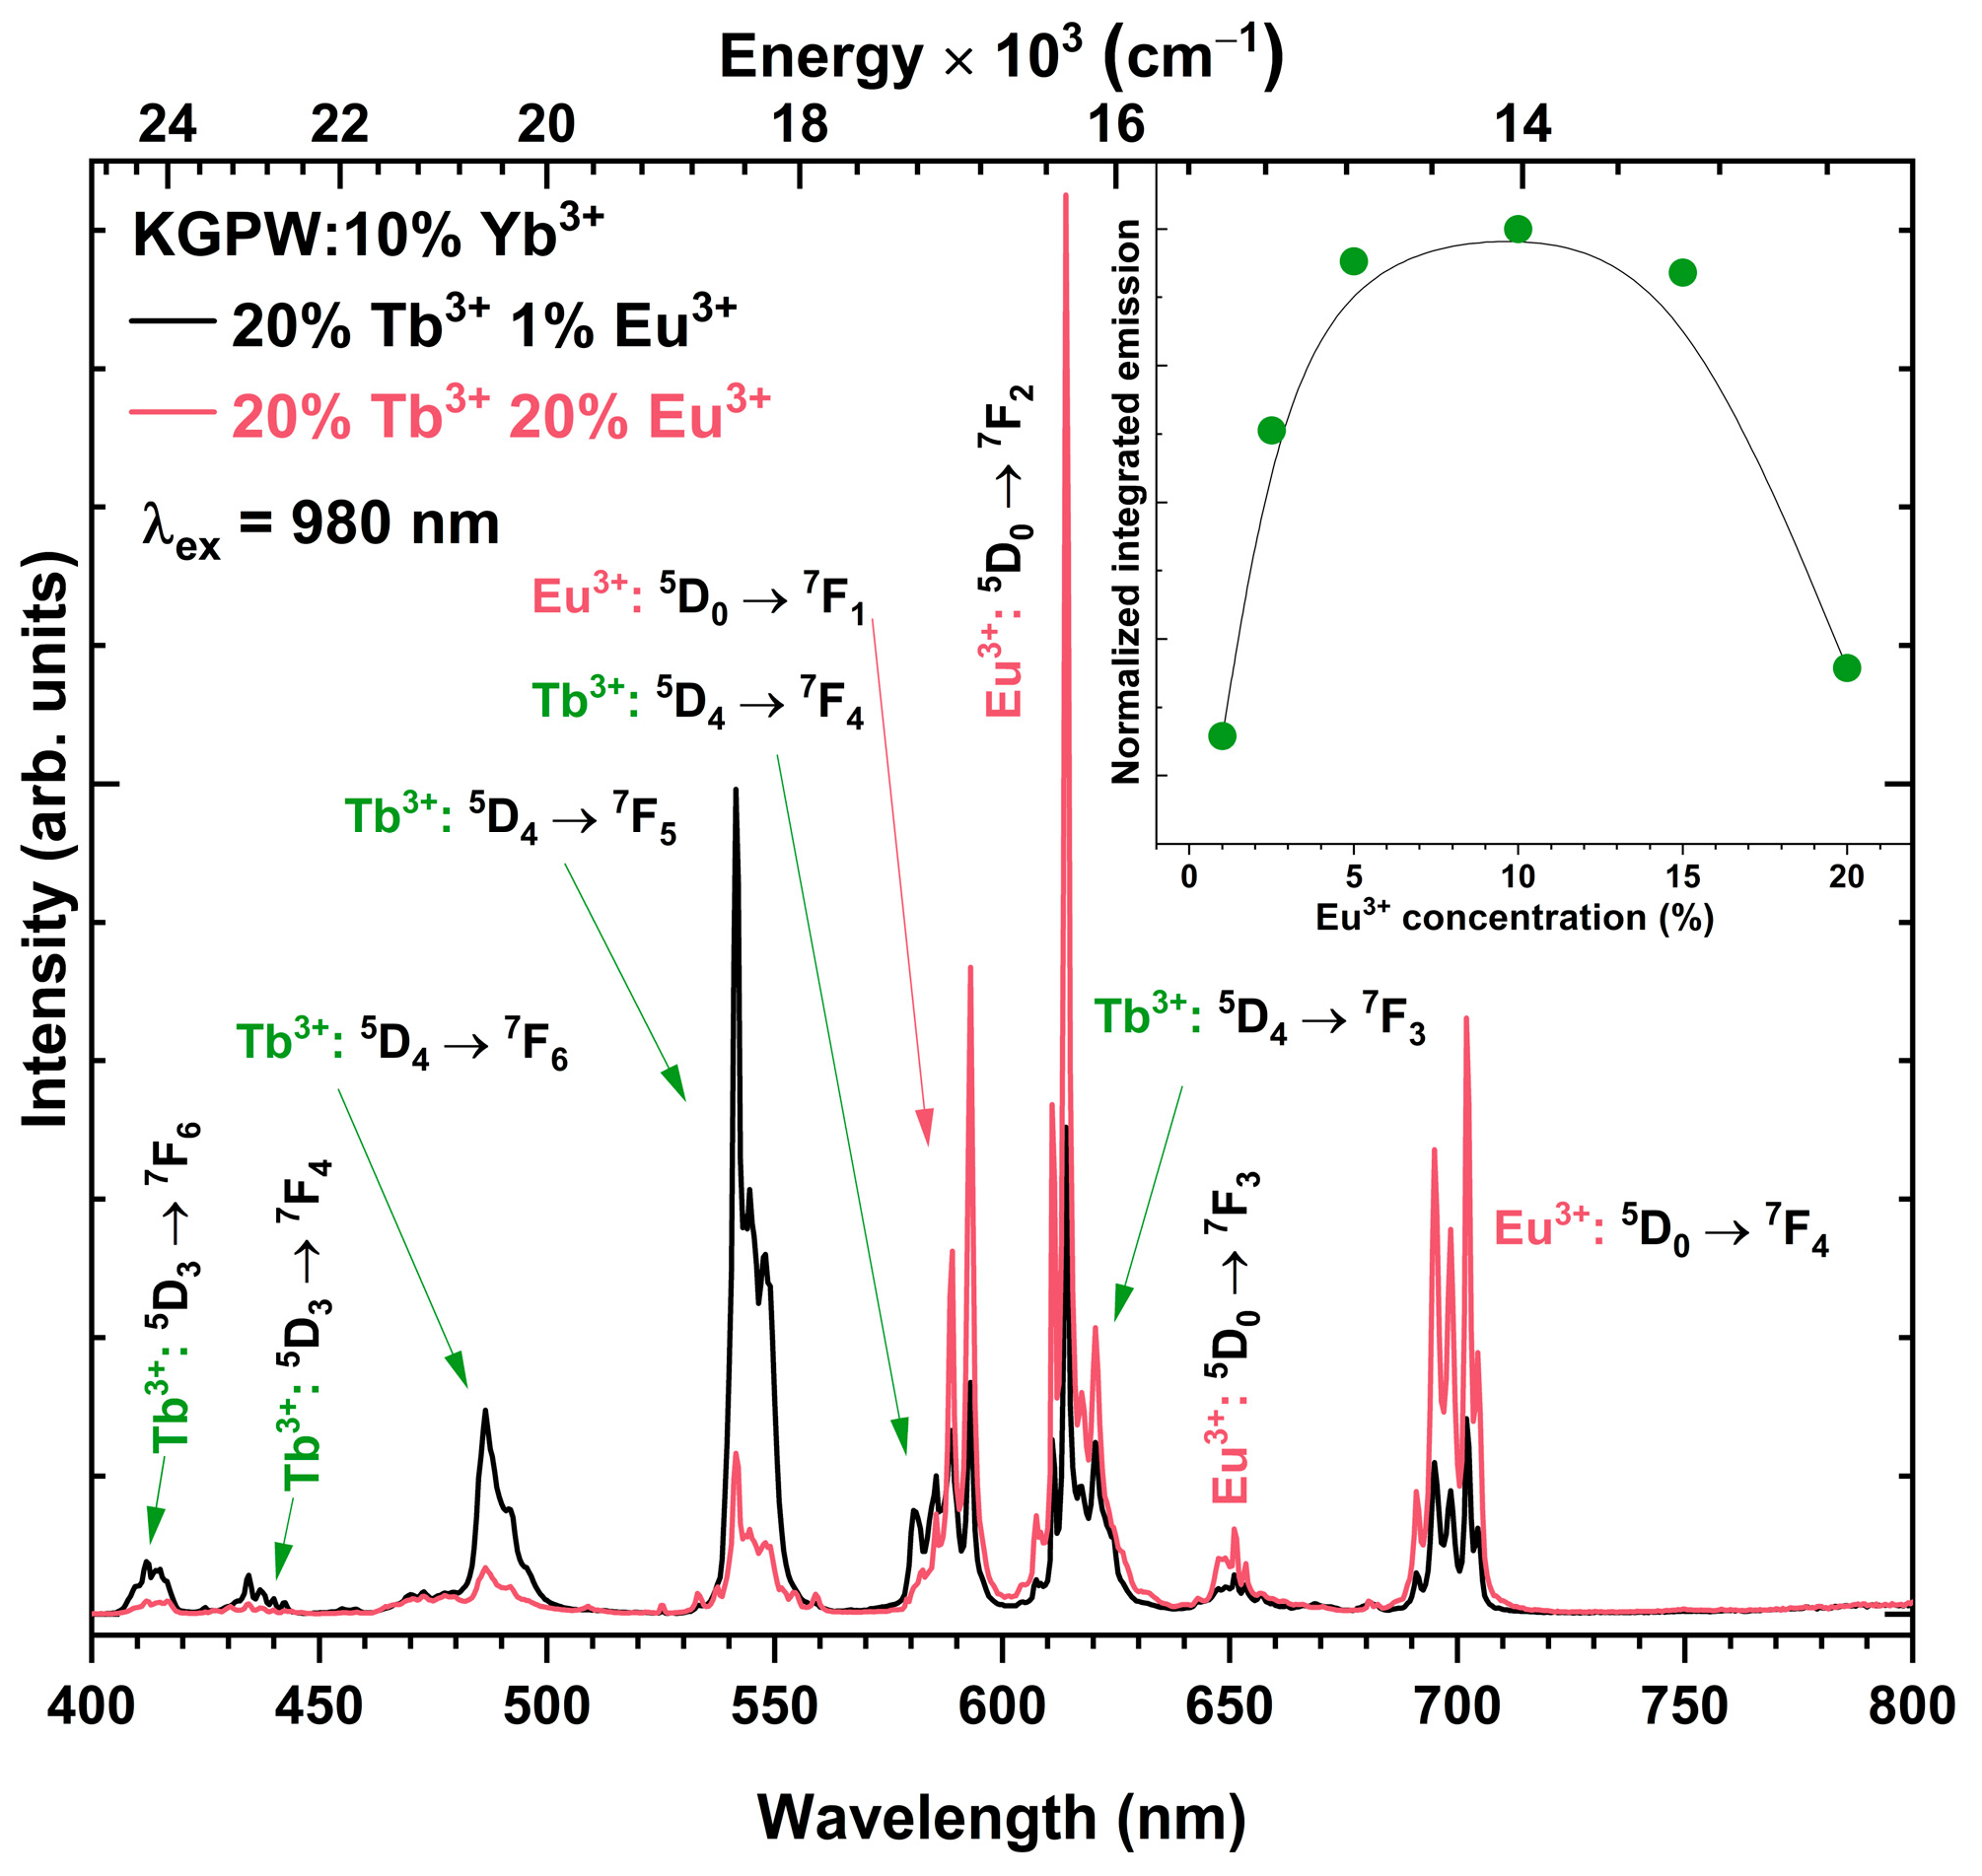
The Eu3+ concentration-dependent UC emission spectra of KGPW:10%Yb3+,20%Tb3+,Eu3+ samples were measured under 980 nm wavelength laser excitation. The UC emission spectra of 1% and 20% Eu3+-doped specimens are depicted in Figure 6. The inset graph shows normalized integrated emission intensity as a function of Eu3+ concentration. The overall UC emission intensity of the samples increases until Eu3+ concentration reaches 10%. Increasing the Eu3+ concentration further resulted in a decrease in overall UC emission which is likely caused by concentration quenching due to increased probability of cross-relaxation between adjacent Eu3+ [32]. Both UC emission spectra of KGPW:10%Yb3+,20%Tb3+ doped with 1% and 20% Eu3+ show typical Tb3+ and Eu3+ emission lines. The most intense emission line in the sample doped with 20% Tb3+ and 1% Eu3+ ions is attributed to Tb3+ 5D47F5 (λ = 542 nm); for the sample doped with 20% Tb3+ and 20% Eu3+, as predicted, the most intense emission line is attributed to Eu3+ 5D07F2 (λ = 614 nm).
The normalized UC emission spectra (λex = 980 nm) of KGPW:10%Yb3+,20%Tb3+, KGPW:10%Yb3+,20%Tb3+,2.5%Eu3+, and KGPW:10%Yb3+,20%Tb3+,20%Eu3+ are shown in Figure S10. The spectra were normalized to the most intense Tb3+ transition (5D47F5 ca. 541.5 nm) in order to better evaluate the change between Tb3+ and Eu3+ emission intensity upon increasing Eu3+ concentration. It is evident that Eu3+ emission intensity increases with increasing Eu3+ concentration. This indicates that Tb3+ → Eu3+ energy transfer becomes more efficient at higher Eu3+ concentrations.
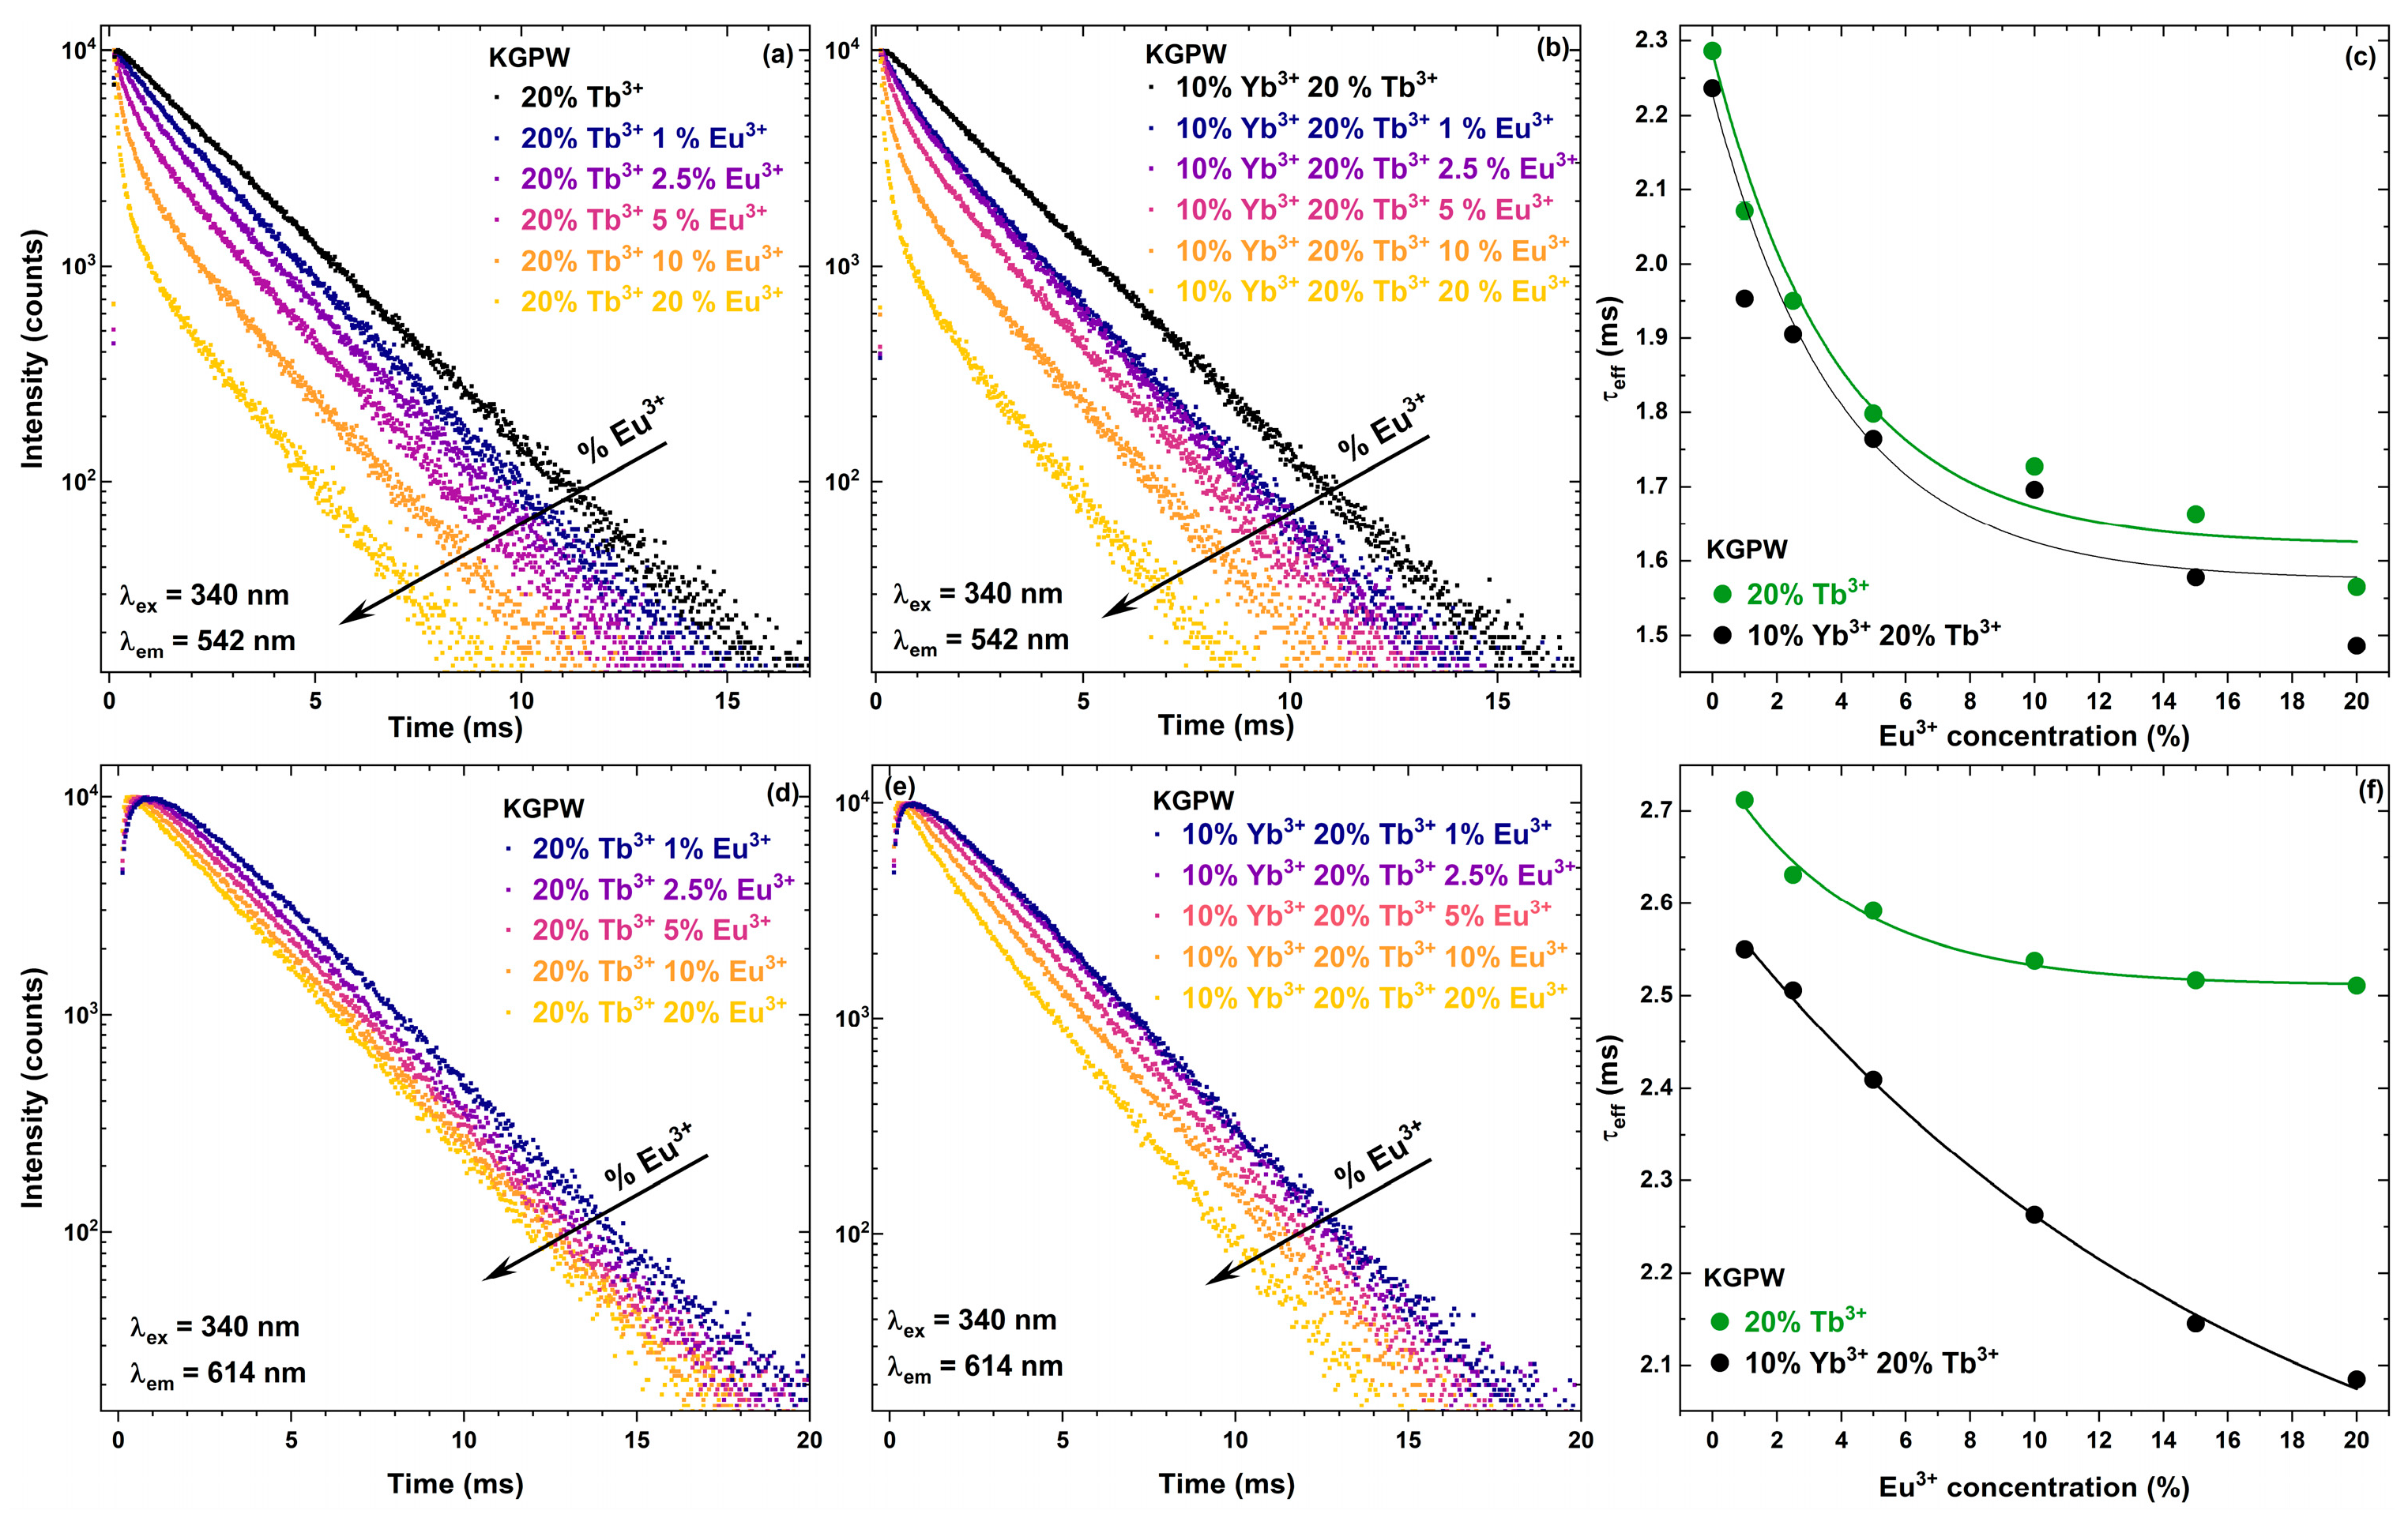
For a further understanding of down-shifting emission, the photoluminescence (PL) decay curves were recorded and analyzed. Samples were excited with 340 nm radiation (7F65L7;8 transitions of Tb3+), and the emission was monitored at 542 nm (5D47F5 transition of Tb3+) and 614 nm (5D47F3 transition of Tb3+ and 5D07F2 transition of Eu3+) (please refer to Figure 7). The effective PL lifetime values were calculated using the following equation [33]:
τ e f f = 0 I ( t ) t   d t 0 I ( t )   d t
Here, I(t) is PL intensity at a given time t. The PL decay curves of all synthesized samples as a function of Eu3+ concentration are shown in Figure 7. Figure 7a,b show the PL decay curves (λex = 340 nm; λem = 542 nm) of KGPW:20%Tb3+,Eu3+ and KGPW:10%Yb3+,20%Tb3+,Eu3+ specimens as a function of Eu3+ concentration. With increasing Eu3+ concentration, the PL decay curves become steeper, suggesting that PL lifetime values decrease. The calculated effective PL lifetime values for the given samples are presented in Figure 7c. The effective PL lifetime values for KGPW:20%Tb3+,Eu3+ samples decrease from 2286 ± 2 μs to 1486 ± 7 μs if Eu3+ concentration increases from 0% to 20%. A similar trend was also observed for the KGPW:10%Yb3+,20%Tb3+,Eu3+ samples where the effective PL lifetime values decreased from 2236 ± 2 μs to 1565 ± 6 μs with increasing Eu3+ concentration from 0% to 20%, respectively. The effective PL lifetime values for the samples doped with other Eu3+ concentrations are tabulated in Table S6. Figure 7d,e show the PL decay curves (λex = 340 nm, λem = 614 nm) of KGPW:20%Tb3+,Eu3+ and KGPW:10%Yb3+,20%Tb3+,Eu3+ samples as a function of Eu3+ concentration, respectively. The PL decay curves become steeper with increasing Eu3+ concentration. The calculated effective PL lifetime values slightly decrease from 2712 ± 3 μs to 2511 ± 2 μs for KGPW:20%Tb3+,Eu3+ samples with increasing Eu3+ concentration from 1% to 20%. The effective PL lifetime values of KGPW:10%Yb3+,20%Tb3+,Eu3+ samples, in turn, decrease from 2550 ± 3 μs to 2085 ± 4 μs for 1% and 20% Eu3+-doped specimens, respectively. The trend of effective PL lifetime values decreasing with increasing Eu3+ concentration is depicted in Figure 7f, and the exact calculated PL lifetime values are tabulated in Table S7.
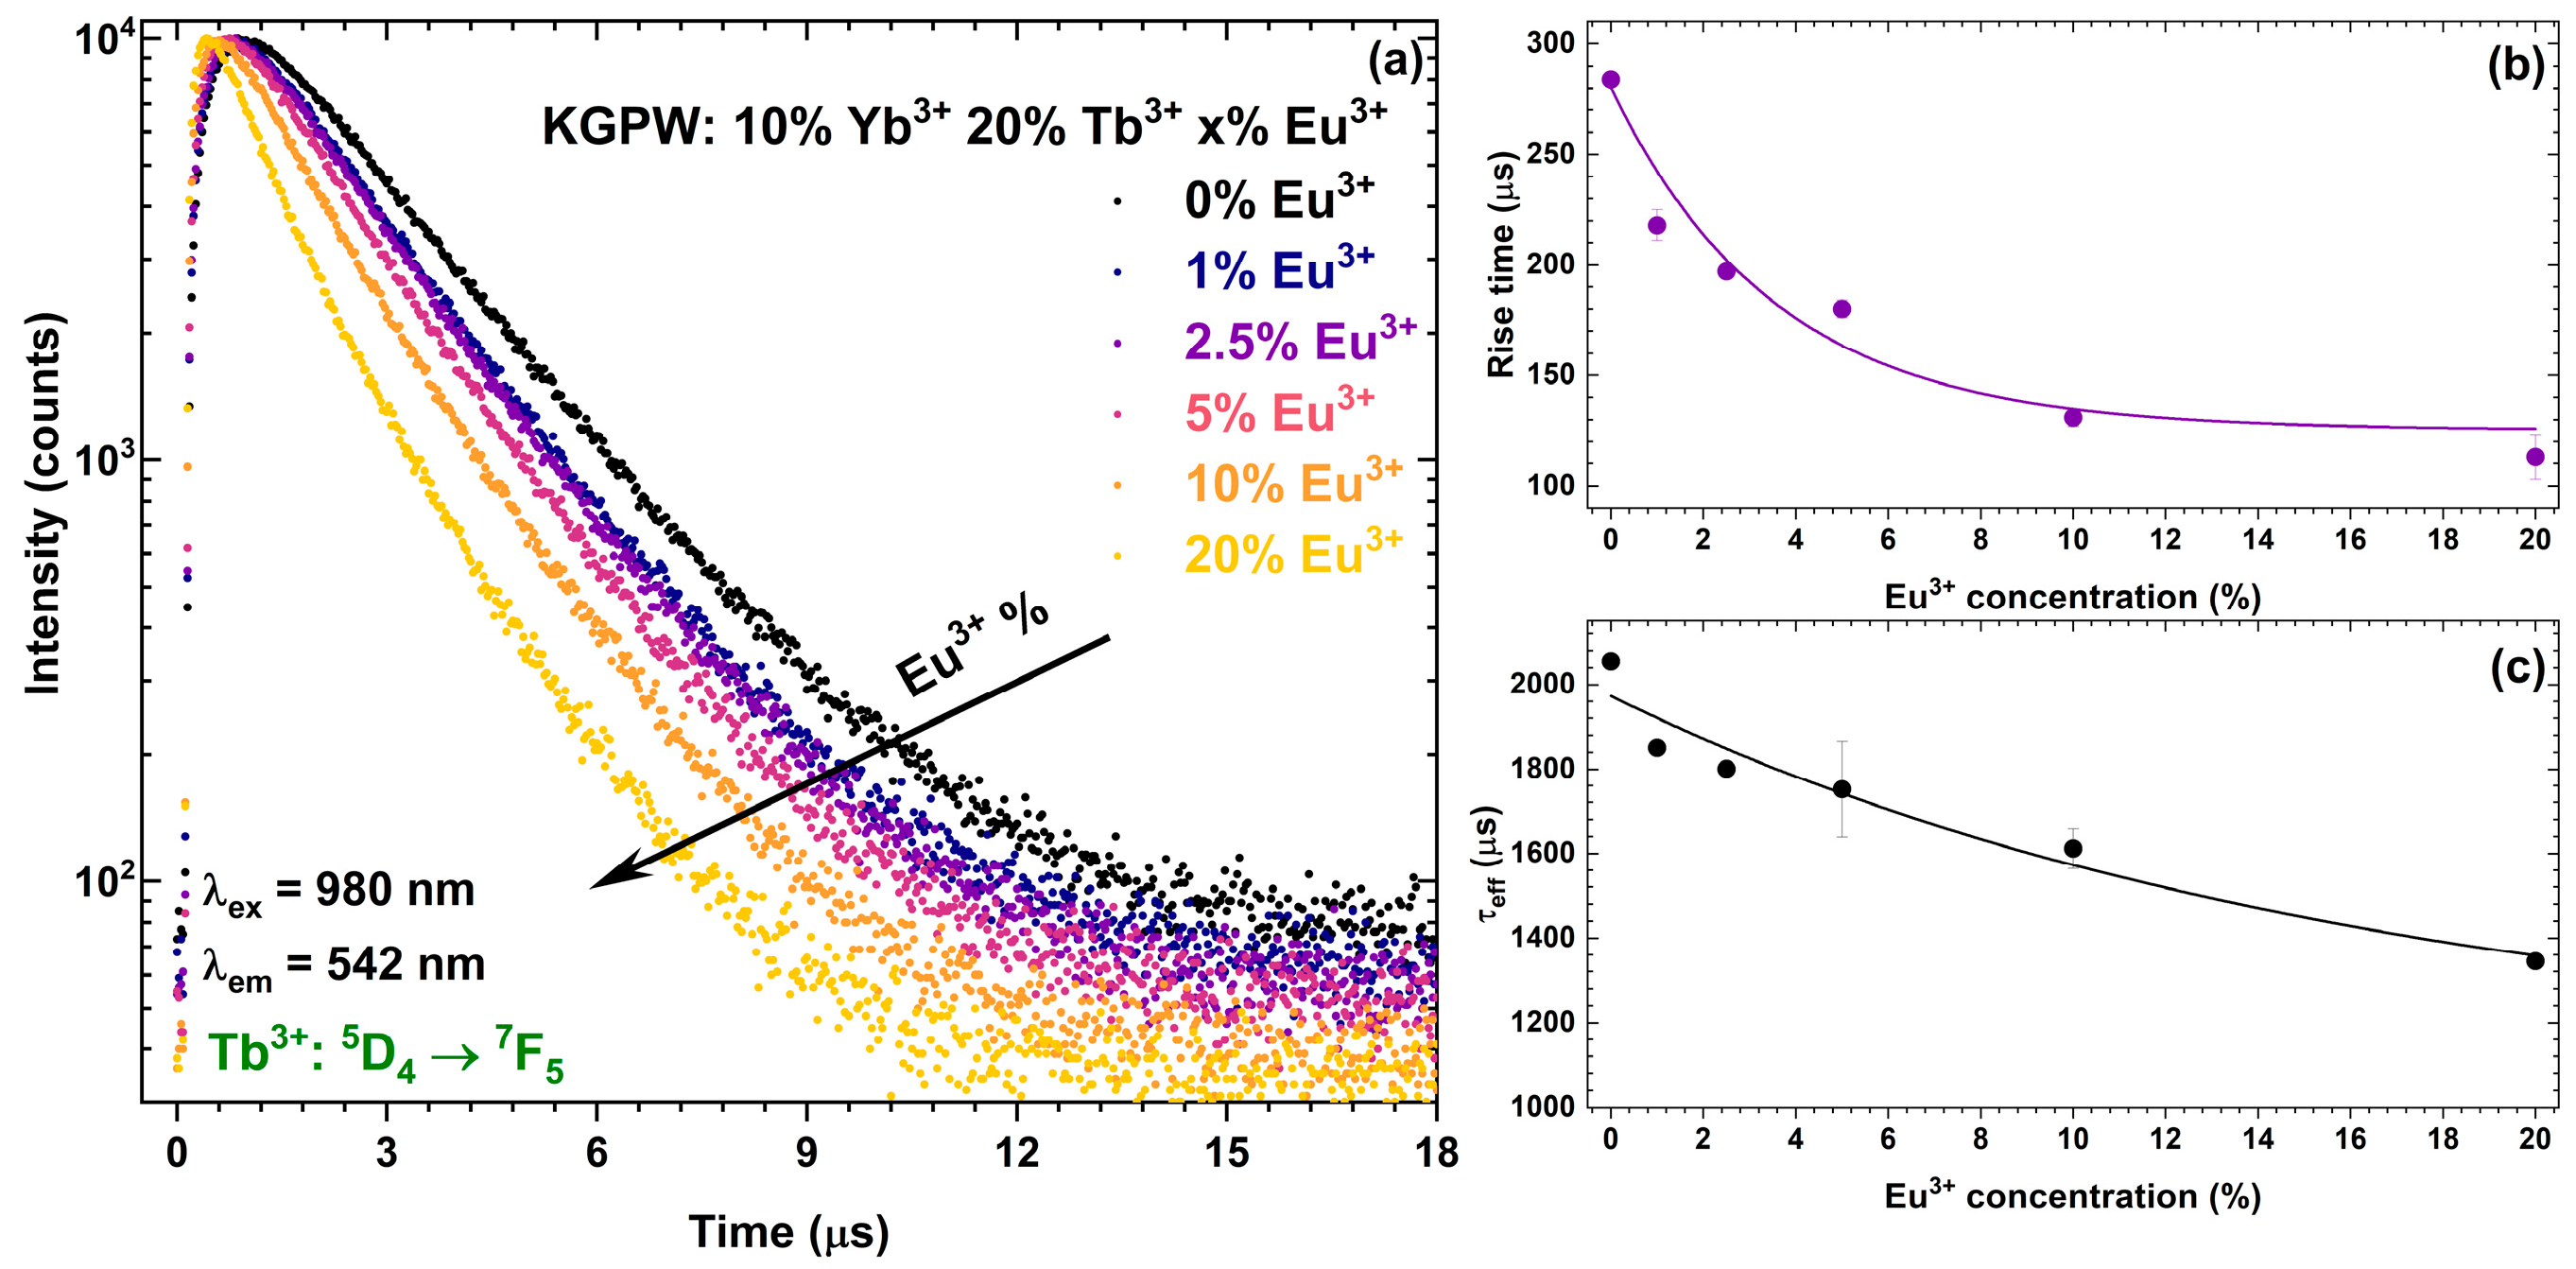
In order to understand the UC process of the prepared materials, the PL decay curves under 980 nm laser excitation were measured, monitoring emission at 542 nm (Tb3+), 704 nm (Eu3+), and 1050 nm (Yb3+). The effective UC PL lifetime and rise time values were calculated and tabulated in Tables S8–S10. The UC PL decay curves of the KGPW:10%Yb3+,20%Tb3+,Eu3+ samples as a function of Eu3+ concentration for the Tb3+ 5D47F5em = 542 nm) transition are depicted in Figure 8a. It is evident that the UC PL decay curves of Tb3+ become steeper with increasing Eu3+ concentration. Figure 8b,c show the UC PL rise time and UC PL lifetime values of the same samples as a function of Eu3+ concentration. Both figures indicate that the UC PL rise time and UC PL lifetime values decrease with increasing Eu3+ concentration. The UC PL rise time values decrease from 284 ± 7 μs to 113 ± 10 μs if Eu3+ concentration increases from 0% to 20%, whereas the UC PL lifetime values decrease from 2055 ±3 μs to 1345 ±15 μs, respectively. The decreasing Tb3+ UC PL lifetime values show that Tb3+ → Eu3+ energy transfer efficiency increases with increasing Eu3+ concentration.
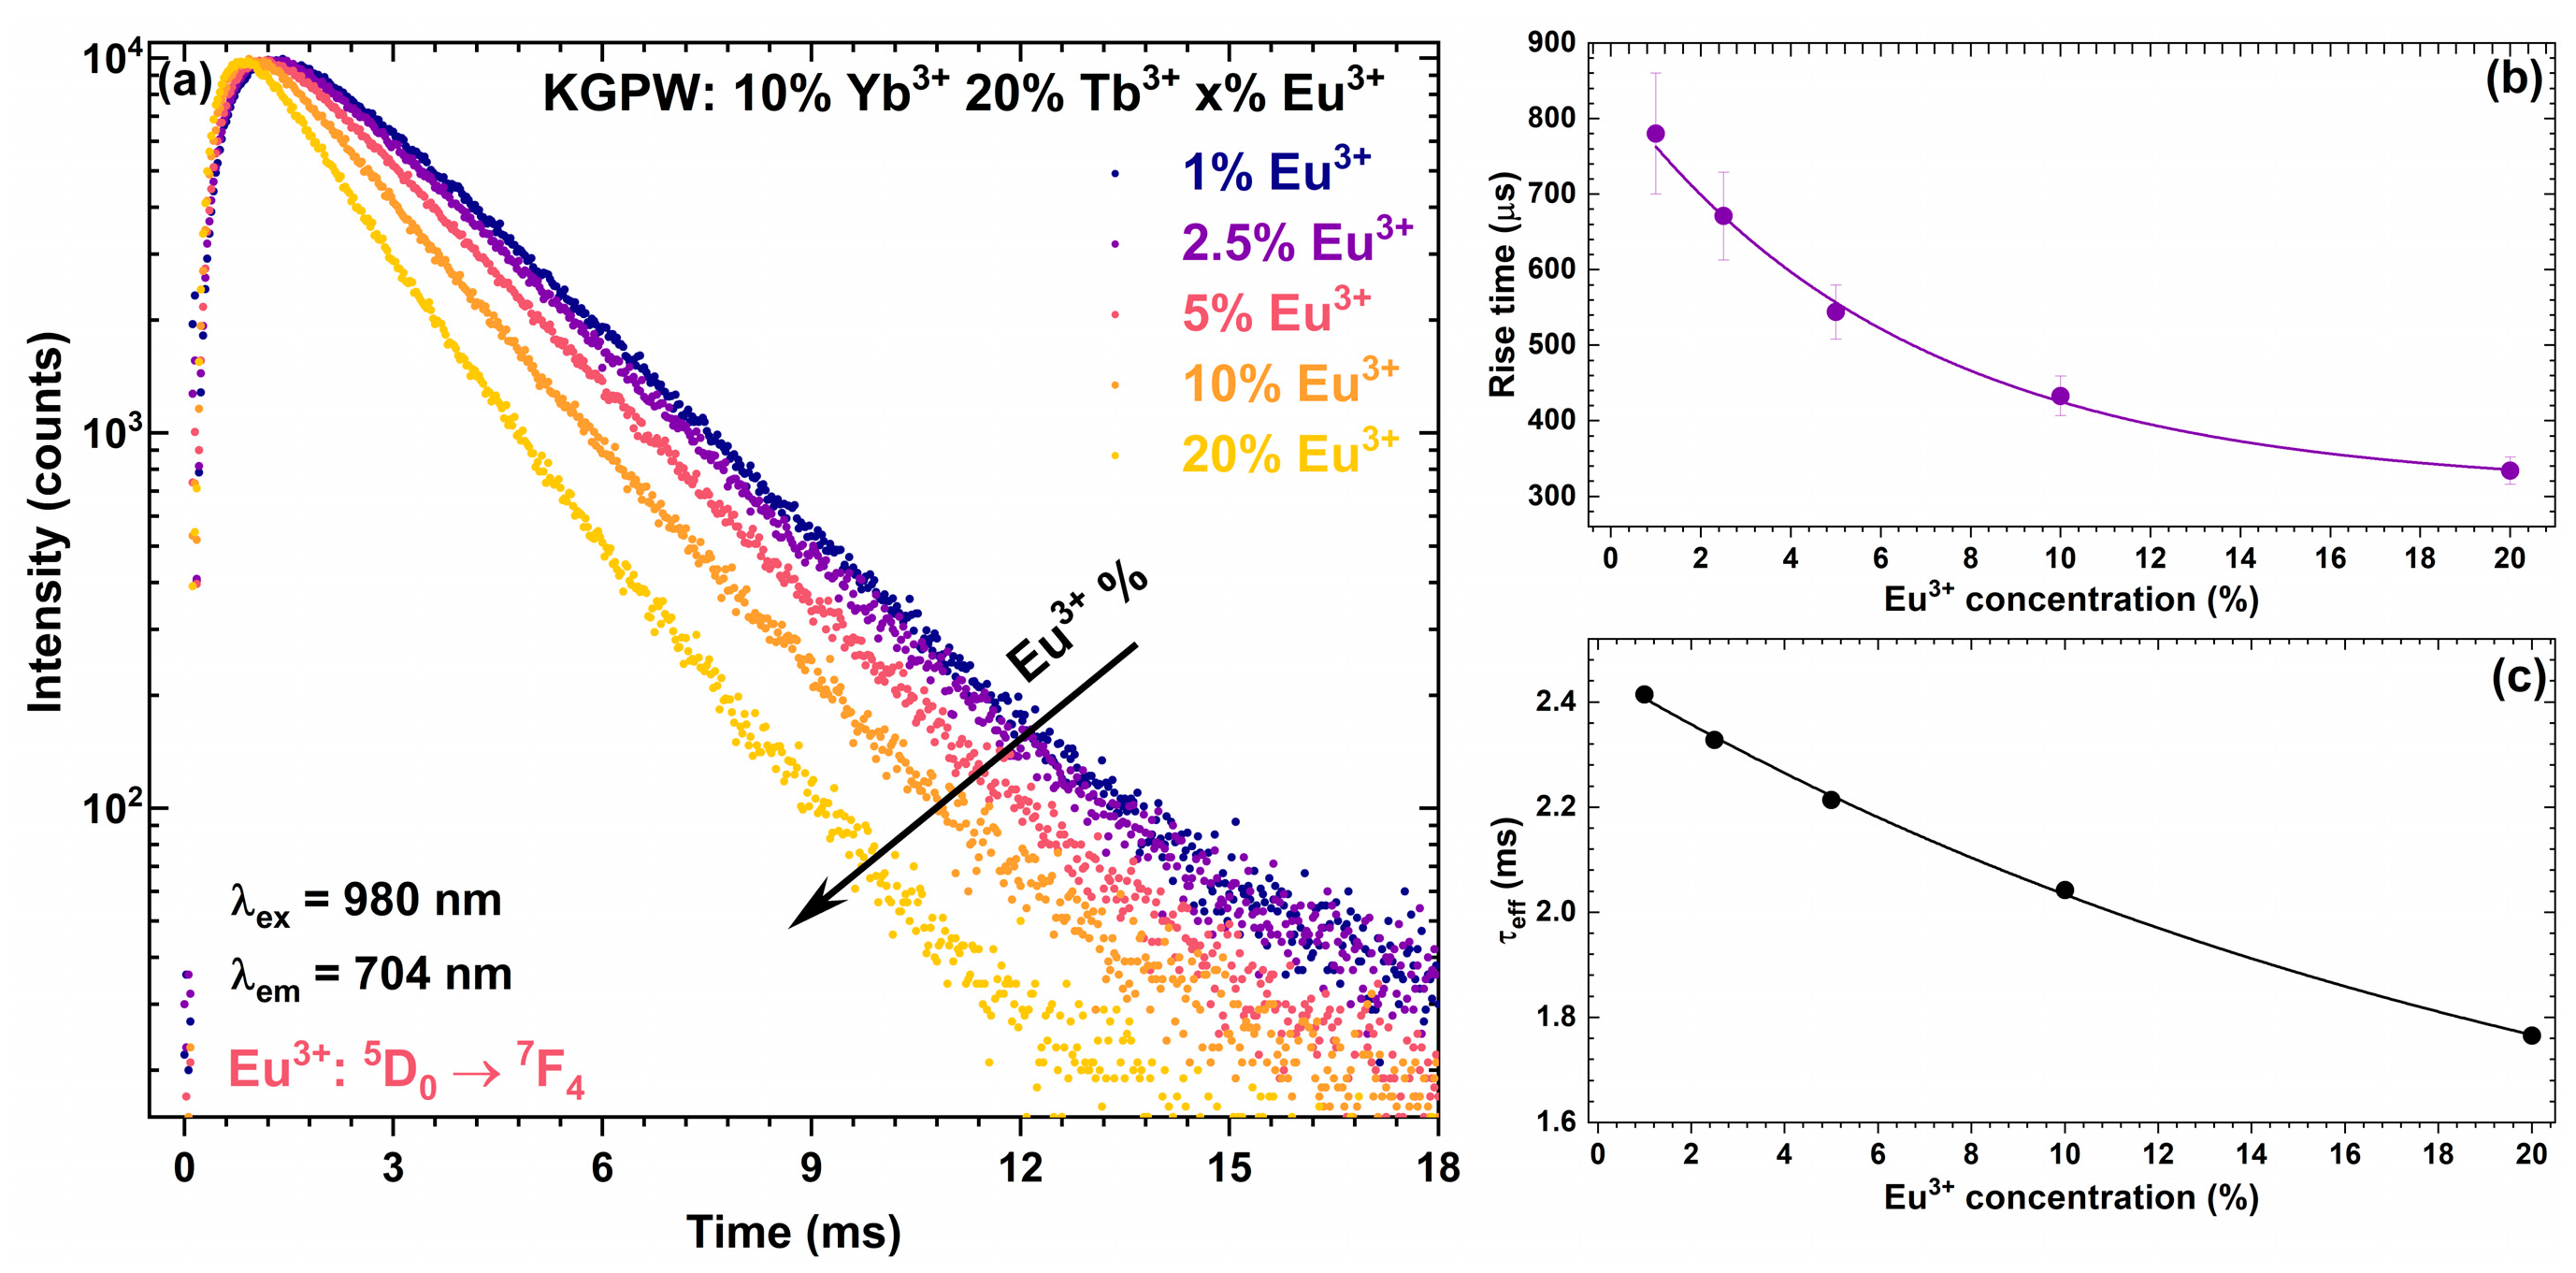
Decay curves of Eu3+ 5D07F4 transition (λex = 980 nm, λem = 704 nm) for the KGPW:10%Yb3+20%Tb3+ sample as a function of Eu3+ concentration were recorded and depicted in Figure 9a. The calculated PL rise time and lifetime values of the samples are shown in Figure 9b and Figure 9c, respectively. The UC PL decay curves become steeper with increasing Eu3+ concentration due to the increasing probability of cross-relaxation processes between Eu3+ ions. Thus, the PL rise time and lifetime values decrease in samples with higher Eu3+ concentration. The UC PL rise time values decrease from 780 ±80 μs to 334 ±18 μs, whereas the UC PL lifetime values decrease from 2414 ± 3 μs to 1765 ± 3 μs.
The Tb3+ → Eu3+ energy transfer efficiency (ηtr) can be estimated using the given equation [34]:
η t r = 1 τ S τ S 0
Here, τS and τS0 are PL lifetime values of Tb3+ in the presence and absence of Eu3+, respectively. The calculated energy transfer efficiency values as a function of Eu3+ concentration are depicted in Figure S11. The ηtr values gradually increase with increasing Eu3+ concentration. For instance, ηtr values increase from 10.0% to 34.6% if Eu3+ concentration increases from 1% to 20% in the KGPW:10%Yb3+,20%Tb3+,Eu3+ samples (λex = 980 nm, λem = 542 nm). A similar tendency was also observed for KGPW:20%Tb3+,Eu3+ and KGPW:10%Yb3+,20%Tb3+,Eu3+ samples (λex = 340 nm, λem = 542 nm) where ηtr values increase from 9.4% to 31.5% and from 12.7% to 33.5%, respectively.
To evaluate the PL lifetime values of Yb3+, the PL decay curves (λex = 980 nm, λem = 1050 nm) for Yb3+ 2F5/22F7/2 transition were recorded (please refer to Figure S12). The PL decay curves become slightly steeper with increasing Eu3+ concentration, although PL lifetime values of the samples are almost the same: 1048 ± 2 μs for the sample with 0% Eu3+ and 924 ± 1 μs for the sample with 20% Eu3+. Whereas the PL lifetime of the KGPW:10%Yb3+ sample is 1066 ± 2 μs. This feature indicates that the percentage of Eu3+ doping has an insignificant impact on PL lifetime values of Yb3+ ions.
The UC PL decay curves (λex = 980 nm, λem = 542 nm) and UC emission spectra (λex = 980 nm) of the KGPW:10%Yb3+,20%Tb3+,5%Eu3+ sample as a function of temperature are shown in Figure 10. It is interesting to note that the overall UC emission intensity increases with increasing temperature up to 200 K. The UC emission intensity decreases if the temperature is increased further. It was also observed that the PL decay curves of the same sample change insignificantly with increasing temperature indicating that Tb3+ PL lifetime values are relatively stable within a 77–350 K temperature range. Such observation indicates that Tb3+ → Eu3+ energy transfer does not change in the same temperature range (i.e., 77 to 350 K). Moreover, the intensity ratio between Tb3+ 5D47F5 (ca. 550 nm) and Eu3+ 5D07F2 (ca. 620 nm) transitions is virtually the same regardless of the temperature.

3.3. Photometric

In order to demonstrate the emission color dependency of the Eu3+ concentration of the synthesized phosphors, the chromaticity coordinates in 1931 color space diagrams were calculated and depicted in Figure 11. The color coordinates of the KGPW:10%Yb3+,20%Tb3+,Eu3+ shifted linearly from the green area (sample with 0% Eu3+) to the red area (sample with 20% Eu3+). The color coordinates of the synthesized samples indicate that the emission color of the sample could be varied by changing the Eu3+ concentration. This was also confirmed by taking digital images of the phosphors in daylight and under 365 nm excitation (please refer to Figure S13). The temperature-dependent color coordinates of KGPW:10%Yb3+,20%Tb3+,5%Eu3+ are located in the green area and do not shift to the red area when raising the temperature from 77 to 500 K. The exact calculated Eu3+ and temperature-dependent color coordinates are summarized in Table S11 and Table S12, respectively.

3.4. Quantum Yield

In order to evaluate the possible practical value of the synthesized compounds, the external quantum efficiency was calculated. The obtained external quantum efficiencies of KGPW:20%Tb3+,Eu3+ and KGPW:10%Yb3+,20%Tb3+,Eu3+ samples upon 340 nm excitation are given in Figure S14. The external quantum efficiency was calculated using this formula [35]:
Q E = I e m ,   s a m p l e I e m ,   B a S O 4 I r e f ,   B a S O 4 I r e f ,   s a m p l e × 100 % = N e m N a b s × 100 %
Here,   I e m ,   s a m p l e and   I e m ,     B a S O 4 are integrated emission intensities of the phosphor sample and BaSO4, respectively.   I r e f ,   s a m p l e and   I r e f ,   B a S O 4 are the integrated reflectance of the phosphor sample and BaSO4, respectively. N e m is the number of emitted photons and N a b s is the absorbed photons. A further increase in Eu3+ concentration shows a slight decrease in quantum efficiency in KGPW:20%Tb3+ samples (the QE varies in the 10–13.5% range). The highest QE value was 13.75% and was obtained for the KGPW:20%Tb3+,1%Eu3+ sample. However, the KGPW:10%Yb3+,20%Tb3+,Eu3+ samples show lower QE values compared to their KGPW:20%Tb3+,Eu3+ counterparts. The QE values vary from 5% to 9%, and the highest quantum efficiency of 9.21% was achieved with the KGPW:10%Yb3+,20%Tb3+,2.5%Eu3+ sample. The relatively low QE could be explained due to cross-relaxation processes in the samples.

4. Conclusions

All in all, we have successfully prepared phase-pure KGPW:20%Tb3+,Eu3+ and KGPW:10%Yb3+,20%Tb3+,Eu3+ where Eu3+ concentrations varied from 1% to 20% Eu3+. All the prepared samples, depending on the Tb3+/Eu3+ concentration ratio, emit in a green-to-red spectral range under 340 and 980 nm excitation. Emission spectra of the samples doped with Eu3+ and Tb3+ under 340 nm excitation show typical Eu3+ and Tb3+ emission lines, whereas the Tb3+ emission intensity drastically decreases with increasing Eu3+ concentration. The strongest down conversion emission intensity was obtained for KGPW:20%Tb3+,20%Eu3+ and KGPW:10%Yb3+,20%Tb3+,5%Eu3+ samples. The UC emission spectra of the KGPW:10%Yb3+,20%Tb3+,5%Eu3+ sample under 980 nm excitation showed an interesting feature, namely, that the overall UC emission intensity increases when increasing the temperature up to 200 K and then slightly decreases. The strongest upconversion emission in the visible range was achieved with KGPW:10%Yb3+,20%Tb3+,10%Eu3+ under 980 nm excitation. The color coordinates of the phosphor samples can be varied from a green-to-red spectral range by adjusting the Eu/Tb ratio.

Supplementary Materials

The following supporting information can be downloaded at: https://www.mdpi.com/article/10.3390/cryst13030479/s1, Table S1. Spectrometer settings for measuring reflection spectra of KGPW:20%Tb3+,Eu3+ and KGPW:10%Yb3+,20%Tb3+,Eu3+ phosphors. Table S2. Spectrometer settings for measuring excitation spectra of KGPW:10% Yb3+ 20% Tb3+ x% Eu3+ phosphors. Table S3. Spectrometer settings for measuring down-shifting emission spectra of KGPW:20%Tb3+, Eu3+ and KGPW:10%Yb3+,20%Tb3+, Eu3+ phosphors. Table S4. Spectrometer settings for measuring UC emission spectra of KGPW:10%Yb3+,20%Tb3+, Eu3+ phosphors. Table S5. Lattice parameters of KGPW, KGPW:10%Yb3+, KGPW:20%Tb3+, KGPW:20%Eu3+, and KGPW:10%Yb3+20%Tb3+20%Eu3+ samples derived from Rietveld refinement analysis. Table S6. The calculated effective PL lifetime values of KGPW:20%Tb3+, Eu3+ and KGPW:10%Yb3+,20%Tb3+,Eu3+ phosphors as a function of Eu3+ concentration (λex = 340 nm, λem = 542 nm). Table S7. The calculated effective PL lifetime values of KGPW:20%Tb3+, Eu3+ and KGPW:10%Yb3+,20%Tb3+, Eu3+ phosphors as a function of Eu3+ concentration (λex = 340 nm, λem = 614 nm). Table S8. The UC PL rise time and UC PL lifetime values of Tb3+ in KGPW:10%Yb3+,20%Tb3+, Eu3+ phosphors as a function of Eu3+ concentration (λex = 980 nm, λem = 542 nm). Table S9. The UC PL rise time and UC PL lifetime values of Eu3+ in KGPW:10%Yb3+,20%Tb3+, Eu3+ phosphors as a function of Eu3+ concentration (λex = 980 nm, λem = 614 nm). Table S10. The PL lifetime values of Yb3+ in KGPW (λex = 980 nm, λem = 1050 nm). Table S11. Color coordinates (CIE 1931 color space) of the synthesized phosphors as a function of Eu3+ concentration under 340 nm and 980 nm excitation. Table S12. Color coordinates (CIE 1931 color space) of KGPW:10%Yb3+,20%Tb3+,5%Eu3+ sample as a function of temperature (λex = 980 nm). Figure S1. Emission spectra of KGPW:10%Yb3+,20%Tb3+,20%Eu3+ and KGPW:10%Yb3+,20%Eu3+ under 980 nm laser excitation. Figure S2. XRD patterns of KGPW doped with 20% Tb3+ (a), 20% Eu3+ (b), 10% Yb3+ (c), co-doped with 10% Yb3+ and 20% Tb3+ (d), 20% Tb3+ and 20% Eu3+ (e), and 10% Yb3+, 20% Tb3+, 20% Eu3+ (f). The reference pattern of K2Bi(PO4)(WO4) is given for comparison (PDF4+ 04-013-4256). Figure S3. SEM images of KGPW:20%Tb3+,20%Eu3+ (a) and (d), KGPW:10%Yb3+,20%Eu3+ (b) and (e), and KGPW:10%Yb3+,20% Tb3+,20%Eu3+ (c) and (f) under different magnification. Figure S4. SEM images of KGPW:10%Yb3+ (a) and (d), KGPW:20%Tb3+ (b) and (e), and KGPW:20%Eu3+ (c) and (f). Figure S5. Reflection spectra of KGPW:20%Tb3+,20%Eu3+ (black line), KGPW:10%Yb3+,20%Tb3+,20%Eu3+ (blue line), and KGPW:20%Eu3+ (red line) (a). KGPW:10%Yb3+,20%Tb3+ (black line), KGPW:20%Tb3+ (red line), and KGPW:10%Yb3+ (blue line) (b). Figure S6. Excitation spectra (λem = 614 nm) of KGPW doped with (a) 10%Yb3+,20% Tb3+,20%Eu3+, and (b) doped with 10% Yb3+. Figure S7. Emission (λex = 340 nm) spectra of KGPW:10%Yb3+,20%Tb3+,Eu3+ as a function of Eu3+ concentration. Figure S8. Emission spectra of KGPW:20%Tb3+, Eu3+ as a function of Eu3+ concentration (λex = 340 nm). The inset graph shows integrated emission intensity as a function of Eu3+ concentration. Figure S9. Emission spectra of KGPW:10%Yb3+,20%Tb3+, Eu3+ as a function of Eu3+ concentration (λex = 340 nm). The inset graph shows integrated emission intensity as a function of Eu3+ concentration. Figure S10. UC emission spectra (normalized to 541.5 nm) of KGPW:10%Yb3+,20%Tb3+, KGPW:10%Yb3+,20%Tb3+,2.5%Eu3+, and KGPW:10%Yb3+,20%Tb3+,20%Eu3+ex = 980 nm). Figure S11. Tb3+ → Eu3+ energy transfer efficiency as a function of Eu3+ concentration. Figure S12. Yb3+ PL decay curves (λex = 980 nm, λem = 1050 nm) in KGPW:10%Yb3+ and KGPW:10%Yb3+,20%Tb3+ samples as a function of Eu3+ concentration. Figure S13. Digital images of the synthesized samples in daylight (a) and under 365 nm excitation (b). Figure S14. The external quantum efficiency of all synthesized samples as a function of Eu3+ concentration (λex = 340 nm).

Author Contributions

Conceptualization, A.K.; investigation, J.G.; writing—original draft preparation, J.G.; writing—review and editing, A.K.; visualization J.G. and A.K.; funding acquisition, A.K. All authors have read and agreed to the published version of the manuscript.

Funding

This research was funded by a grant (No. D-2018-0703 “Controlling the up-conversion emission by tuning band gap of the host matrix”) from the Research Council of Lithuania.

Institutional Review Board Statement

Not applicable.

Informed Consent Statement

Not applicable.

Data Availability Statement

The data presented in this study are available on request from the corresponding author.

Acknowledgments

The authors gratefully thank Andrius Pakalniskis (Vilnius University) for taking SEM images.

Conflicts of Interest

The authors declare no conflict of interest.

References

  1. Kataria, V.; Mehta, D.S. Multispectral harvesting rare-earth oxysulphide based highly efficient transparent luminescent solar concentrator. J. Rare Earth 2022, 40, 41–48. [Google Scholar] [CrossRef]
  2. Alekhin, M.S.; Renger, J.; Kasperczyk, M.; Douissard, P.-A.; Martin, T.; Zorenko, Y.; Vasil’ev, D.A.; Stiefel, M.; Novotny, L.; Stampanoni, M. STED properties of Ce3+, Tb3+, and Eu3+ doped inorganic scintillators. Opt. Express 2017, 25, 1251–1261. [Google Scholar] [CrossRef] [Green Version]
  3. Grigorjevaite, J.; Ezerskyte, E.; Paterek, J.; Saitzek, S.; Zabiliute-Karaliune, A.; Vitta, P.; Enseling, D.; Justel, T.; Katelnikovas, A. Luminescence and luminescence quenching of K2Bi(PO4)(MoO4):Sm3+ phosphors for horticultural and general lighting applications. Mater. Adv. 2020, 1, 1427–1438. [Google Scholar] [CrossRef]
  4. Sujecki, S. Modelling and Design of Lanthanide Ion-Doped Chalcogenide Fiber Lasers: Progress towards the Practical Realization of the First MIR Chalcogenide Fiber Laser. Fibers 2018, 6, 25. [Google Scholar] [CrossRef] [Green Version]
  5. Cheng, F.R.; Xia, Z.G.; Jing, X.P.; Wang, Z.Y. Li/Ag ratio dependent structure and upconversion photoluminescence of LixAg1-xYb0.99(MoO4)2:0.01Er3+ phosphors. Phys. Chem. Chem. Phys. 2015, 17, 3689–3696. [Google Scholar] [CrossRef]
  6. Grigorjevaite, J.; Katelnikovas, A. Synthesis and optical properties investigation of blue-excitable red-emitting K2Bi(PO4)(MoO4):Pr3+ powders. J. Mater. Res. Technol. 2020, 9, 15779–15787. [Google Scholar] [CrossRef]
  7. Lamon, S.; Wu, Y.; Zhang, Q.; Liu, X.; Gu, M. Nanoscale optical writing through upconversion resonance energy transfer. Sci. Adv. 2021, 7, eabe2209. [Google Scholar] [CrossRef]
  8. Liu, Y.J.; Lu, Y.Q.; Yang, X.S.; Zheng, X.L.; Wen, S.H.; Wang, F.; Vidal, X.; Zhao, J.B.; Liu, D.M.; Zhou, Z.G.; et al. Amplified stimulated emission in upconversion nanoparticles for super-resolution nanoscopy. Nature 2017, 543, 229–233. [Google Scholar] [CrossRef] [PubMed]
  9. Mahata, M.K.; Hofsass, H.C.; Vetter, U. Photon-Upconverting Materials: Advances and Prospects for Various Emerging Applications. In Luminescence-An Outlook on the Phenomena and Their Applications; InTech: Rijeka, Croatia, 2016; pp. 109–131. [Google Scholar] [CrossRef] [Green Version]
  10. Suyver, J.F.; Aebischer, A.; Biner, D.; Gerner, P.; Grimm, J.; Heer, S.; Kramer, K.W.; Reinhard, C.; Gudel, H.U. Novel materials doped with trivalent lanthanides and transition metal ions showing near-infrared to visible photon upconversion. Opt. Mater. 2005, 27, 1111–1130. [Google Scholar] [CrossRef]
  11. Giang, L.T.K.; Trejgis, K.; Marciniak, L.; Vu, N.; Minh, L.Q. Fabrication and characterization of up-converting beta-NaYF4:Er3+,Yb3+@NaYF4 core-shell nanoparticles for temperature sensing applications. Sci. Rep. 2020, 10, 14672. [Google Scholar] [CrossRef]
  12. Mikalauskaite, I.; Pleckaityte, G.; Skapas, M.; Zarkov, A.; Katelnikovas, A.; Beganskiene, A. Emission spectra tuning of upconverting NaGdF4:20% Yb, 2% Er nanoparticles by Cr3+ co-doping for optical temperature sensing. J. Lumin. 2019, 213, 210–217. [Google Scholar] [CrossRef]
  13. Gunaseelan, M.; Yamini, S.; Kumar, G.A.; Senthilselvan, J. Highly efficient upconversion luminescence in hexagonal NaYF4:Yb3+, Er3+ nanocrystals synthesized by a novel reverse microemulsion method. Opt. Mater. 2018, 75, 174–186. [Google Scholar] [CrossRef]
  14. Ma, Y.R.; Qiu, P.S.; Xu, D.F.; Lin, J.R.; Tang, Y.X.; Wang, F.F.; He, X.Y.; Zhou, Z.Y.; Sun, N.X.; Zhang, X.Y.; et al. Controllable synthesis and upconversion luminescence of NaYF4:Yb3+, Er3+ nanocrystals. Ceram Int. 2015, 41, S713–S718. [Google Scholar] [CrossRef] [Green Version]
  15. Li, H.; Xu, L.; Chen, G.Y. Controlled Synthesis of Monodisperse Hexagonal NaYF4:Yb/Er Nanocrystals with Ultrasmall Size and Enhanced Upconversion Luminescence. Molecules 2017, 22, 2113. [Google Scholar] [CrossRef] [PubMed] [Green Version]
  16. Kaminski, P.; Przybylska, D.; Klima, G.; Grzyb, T. Improvement in Luminescence Intensity of beta-NaYF4: 18%Yb3+, 2%Er3+@β-NaYF4 Nanoparticles as a Result of Synthesis in the Presence of Stearic Acid. Nanomaterials 2022, 12, 319. [Google Scholar] [CrossRef] [PubMed]
  17. Grzyb, T. Bright and tunable up-conversion luminescence through cooperative energy transfer in Yb3+, Tb3+ and Eu3+ co-doped LaPO4 nanocrystals. Rsc. Adv. 2014, 4, 2590–2595. [Google Scholar] [CrossRef]
  18. Neto, A.N.C.; Jr, R.T.M.; Shyichuk, A.; Paterlini, V.; Piccinelli, F.; Bettinelli, M.; Malta, O.L. Theoretical and Experimental Investigation of the Tb3+ → Eu3+ Energy Transfer Mechanisms in Cubic A3Tb0.90Eu0.10(PO4)3 (A = Sr, Ba) Materials. J. Phys. Chem. C 2020, 124, 10105–10116. [Google Scholar] [CrossRef]
  19. Mi, R.Y.; Chen, J.; Liu, Y.G.; Fang, M.H.; Mei, L.F.; Huang, Z.H.; Wang, B.C.; Zhaob, C.L. Luminescence and energy transfer of a color tunable phosphor: Tb3+ and Eu3+ co-doped ScPO4. Rsc. Adv. 2016, 6, 28887–28894. [Google Scholar] [CrossRef]
  20. Wang, B.X.; Ren, Q.; Hai, O.; Wu, X.L. Luminescence properties and energy transfer in Tb3+ and Eu3+ co-doped Ba2P2O7 phosphors. Rsc. Adv. 2017, 7, 15222–15227. [Google Scholar] [CrossRef] [Green Version]
  21. Wang, L.L.; Liu, Z.Y.; Chen, Z.; Zhao, D.; Qin, G.S.; Qin, W.P. Upconversion emissions from high-energy states of Eu3+ sensitized by Yb3+ and Ho3+ in β-NaYF4 microcrystals under 980 nm excitation. Opt Express 2011, 19, 25471–25478. [Google Scholar] [CrossRef]
  22. Suo, H.; Zhu, Q.; Zhang, X.; Chen, B.; Chen, J.K.; Wang, F. High-security anti-counterfeiting through upconversion luminescence. Mater. Today Phys. 2021, 21, 100520. [Google Scholar] [CrossRef]
  23. Maciel, G.S.; Biswas, A.; Prasad, P.N. Infrared-to-visible Eu3+ energy upconversion due to cooperative energy transfer from an Yb3+ ion pair in a sol-gel processed multi-component silica glass. Opt. Commun. 2000, 178, 65–69. [Google Scholar] [CrossRef]
  24. Grigorjevaite, J.; Katelnikovas, A. Optical spectroscopy studies of K2Bi(PO4)(MoO4):20%Yb3+,Er3+ phosphors for upconversion applications. J. Lumin. 2022, 252, 119384. [Google Scholar] [CrossRef]
  25. Grigorjevaite, J.; Katelnikovas, A. Up-Converting K2Gd(PO4)(WO4):20%Yb3+,Ho3+ Phosphors for Temperature Sensing. Materials 2023, 16, 917. [Google Scholar] [CrossRef] [PubMed]
  26. Grigorjevaite, J.; Katelnikovas, A. Optical Properties Investigation of Upconverting K2Gd(PO4)(WO4):20%Yb3+,Tm3+ Phosphors. Materials 2023, 16, 1305. [Google Scholar] [CrossRef] [PubMed]
  27. Shannon, R.D. Revised Effective Ionic Radii and Systematic Studies of Interatomic Distances in Halides and Chalcogenides. Acta Crystallogr. 1976, A32, 751–767. [Google Scholar] [CrossRef]
  28. Terebilenko, K.V.; Zatovsky, I.V.; Baumer, V.N.; Slobodyanik, N.S.; Shishkin, O.V. K2Ho(PO4)(WO4). Acta Crystallogr. Sect. E Struct. Rep. Online 2008, 64, i75. [Google Scholar] [CrossRef] [PubMed] [Green Version]
  29. Demesh, M.; Gorbachenya, K.; Kisel, V.; Volkova, E.; Maltsev, V.; Koporulina, E.; Dunina, E.; Kornienko, A.; Fomicheva, L.; Kuleshov, N. Transitions intensities and cross-sections of Tb3+ ions in YAI3(BO3)4 crystal. Osa Contin. 2021, 4, 822–830. [Google Scholar] [CrossRef]
  30. Li, Y.C.; Chang, Y.H.; Chang, Y.S.; Lin, Y.J.; Laing, C.H. Luminescence and energy transfer properties of Gd3+ and Tb3+ in LaAlGe2O7. J. Phys. Chem. C 2007, 111, 10682–10688. [Google Scholar] [CrossRef]
  31. Huang, X.Y.; Li, B.; Guo, H. Highly efficient Eu3+-activated K2Gd(WO4)(PO4) red-emitting phosphors with superior thermal stability for solid-state lighting. Ceram Int. 2017, 43, 10566–10571. [Google Scholar] [CrossRef]
  32. Lakshminarayana, G.; Wagh, A.; Kamath, S.D.; Dahshan, A.; Hegazy, H.H.; Marzec, M.; Kityk, I.V.; Lee, D.E.; Yoon, J.; Park, T. Eu3+-doped fluoro-telluroborate glasses as red-emitting components for W-LEDs application. Opt. Mater. 2020, 99, 109555. [Google Scholar] [CrossRef]
  33. Lahoz, F.; Martin, I.R.; Mendez-Ramos, J.; Nunez, P. Dopant distribution in a Tm3+-Yb3+ codoped silica based glass ceramic: An infrared-laser induced upconversion study. J. Chem. Phys. 2004, 120, 6180–6190. [Google Scholar] [CrossRef] [PubMed]
  34. Paulose, P.I.; Jose, G.; Thomas, V.; Unnikrishnan, N.V.; Warrier, M.K.R. Sensitized fluorescence of Ce3+/Mn2+ system in phosphate glass. J. Phys. Chem. Solids 2003, 64, 841–846. [Google Scholar] [CrossRef]
  35. Grigorjevaite, J.; Katelnikovas, A. Luminescence and Luminescence Quenching of K2Bi(PO4)(MoO4):Eu3+ Phosphors with Efficiencies Close to Unity. Acs. Appl. Mater. Inter. 2016, 8, 31772–31782. [Google Scholar] [CrossRef] [PubMed]
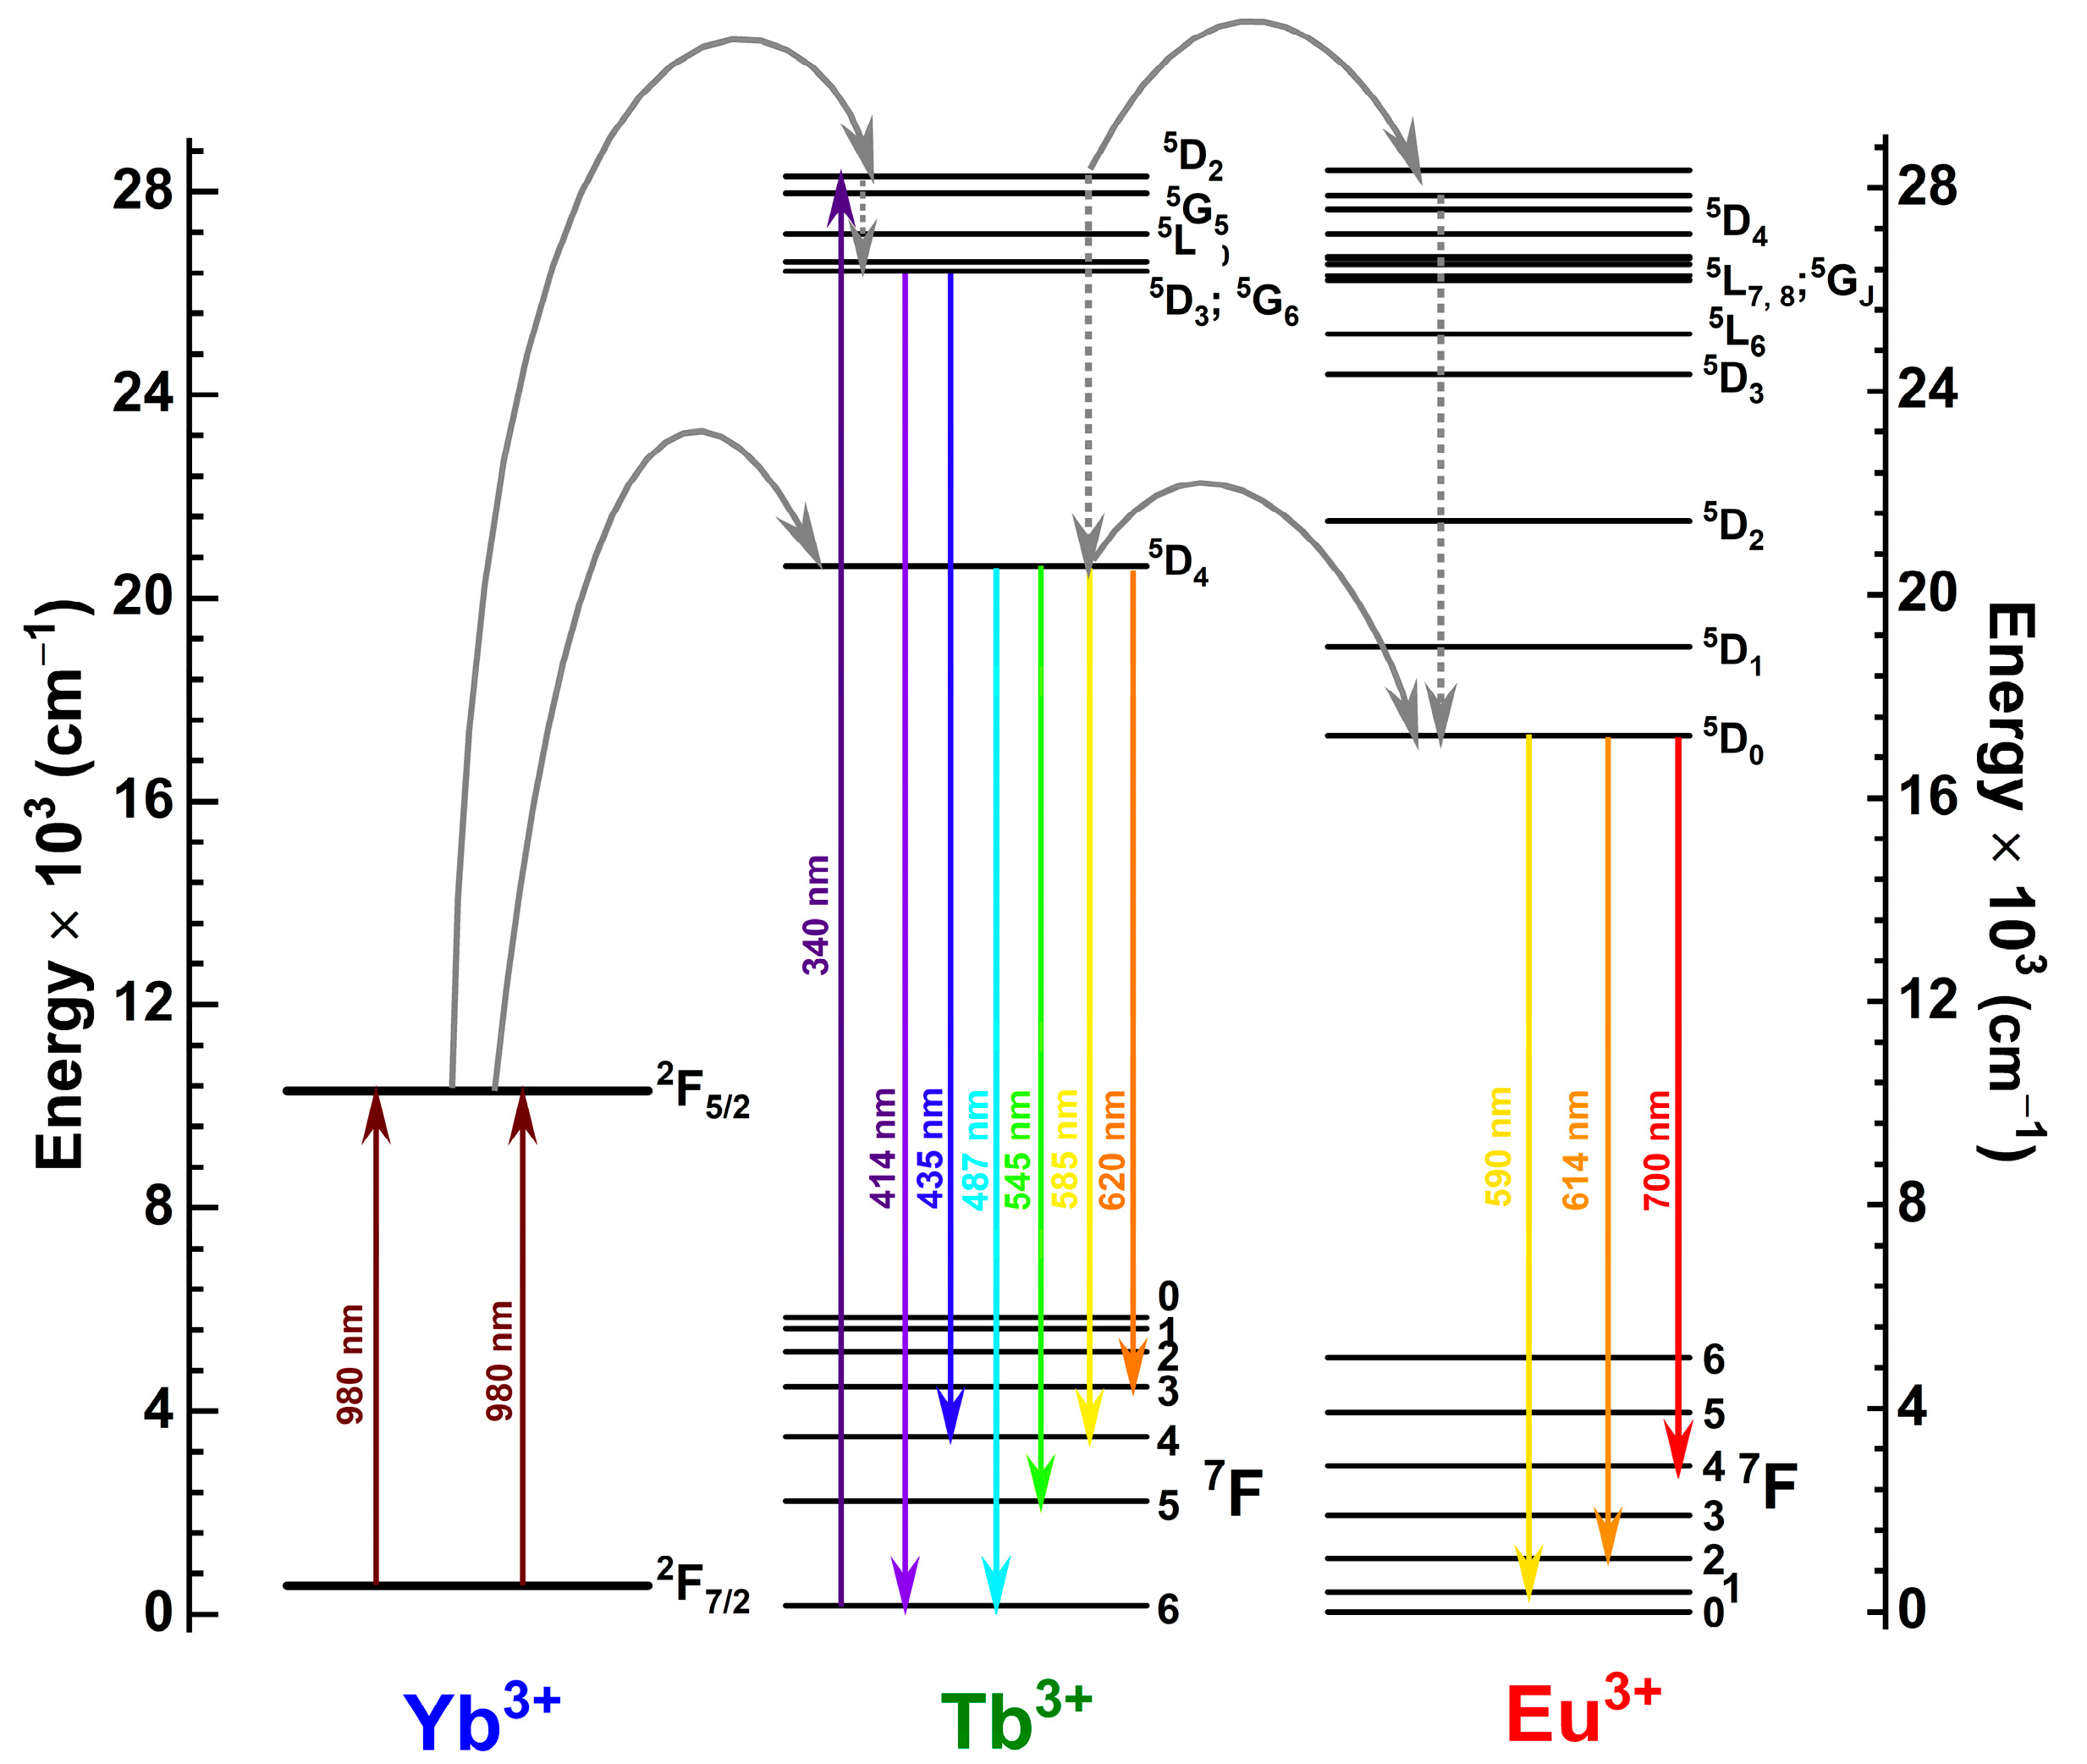
Figure 1. Schematic energy level diagram of energy transitions in Yb3+, Tb3+, and Eu3+ ions.
Crystals 13 00479 g001
Figure 2. Rietveld refinement data for undoped KGPW (a), KGPW:20%Tb3+ (b), KGPW:20%Eu3+ (c), and KGPW:10%Yb3+, 20%Tb3+, 20%Eu3+ (d).
Crystals 13 00479 g002
Figure 3. Reflection spectra of (a) KGPW:10%Yb3+ (black line), (b) KGPW:20%Tb3+ (green line), and (c) KGPW:20%Eu3+ (red line).
Crystals 13 00479 g003
Figure 4. Excitation (λem = 614 nm) spectra of (a) undoped KGPW, (b) KGPW:20%Tb3+, (c) KGPW:20%Eu3+, and (d) KGPW:20%Tb3+,20%Eu3+.
Crystals 13 00479 g004
Figure 5. Emission (λex = 340 nm) spectra of KGPW:20%Tb3+,Eu3+ as a function of Eu3+ concentration.
Crystals 13 00479 g005
Figure 6. UC emission spectra of KGPW:10%Yb3+,20%Tb3+,Eu3+ as a function of Eu3+ concentration under 980 nm laser excitation. The inset shows normalized integrated UC emission intensity as a function of Eu3+ concentration.
Crystals 13 00479 g006
Figure 7. PL decay curves of KGPW:20%Tb3+,Eu3+ (a) and KGPW:10%Yb3+,20%Tb3+,Eu3+ (b), and PL lifetime values (c) as a function of Eu3+ concentration (λex = 340 nm, λem = 542 nm). PL decay curves of KGPW:20%Tb3+,Eu3+ (d) and KGPW:10%Yb3+,20%Tb3+,Eu3+ (e), and PL lifetime values (f) as a function of Eu3+ concentration (λex = 340 nm, λem = 614 nm).
Crystals 13 00479 g007
Figure 8. Eu3+ concentration-dependent UC PL decay curves (λex = 980 nm, λem = 542 nm) (a), UC PL rise time (b), and UC PL lifetime values (c) of KGPW:10%Yb3+,20%Tb3+,Eu3+ samples.
Crystals 13 00479 g008
Figure 9. Eu3+ concentration-dependent UC PL decay curves (λex = 980 nm, λem = 704 nm) (a), UC PL rise time (b), and UC PL lifetime values (c) of KGPW:10%Yb3+,20%Tb3+,Eu3+ samples.
Crystals 13 00479 g009
Figure 10. Temperature-dependent UC PL decay and emission spectra of KGPW:10%Yb3+,20%Tb3+,5%Eu3+ sample: (a) UC PL decay curves (λex = 980 nm, λem = 542 nm), (b) UC emission spectra (λex = 980 nm) (inset shows integrated emission intensity), (c) normalized emission spectra.
Crystals 13 00479 g010
Figure 11. CIE 1931 color space diagrams with color coordinates of (a) KGPW:10%Yb3+,20%Tb3+,Eu3+ex = 980 nm), and (b) KGPW doped with 20% Tb3+ and co-doped with 10%Yb3+ and 20%Tb3+ as a function of Eu3+ concentration (λex = 340 nm).
Crystals 13 00479 g011
Disclaimer/Publisher’s Note: The statements, opinions and data contained in all publications are solely those of the individual author(s) and contributor(s) and not of MDPI and/or the editor(s). MDPI and/or the editor(s) disclaim responsibility for any injury to people or property resulting from any ideas, methods, instructions or products referred to in the content.