Article

Gemological and Chemical Characterization of Varicolored Gem-Grade Spinel from Mogok, Myanmar

1
State Key Laboratory of Geological Processes and Mineral Resources, China University of Geosciences, Beijing 100083, China
2
School of Gemology, China University of Geosciences, Beijing 100083, China
3
The Beijing SHRIMP Center, Chinese Academy of Geological Sciences, Beijing 100037, China
*
Author to whom correspondence should be addressed.
Crystals 2023, 13(3), 447; https://doi.org/10.3390/cryst13030447
Submission received: 7 February 2023 / Revised: 27 February 2023 / Accepted: 28 February 2023 / Published: 4 March 2023
(This article belongs to the Topic In-Situ Study of Mineralogy, Gemology and Progress in Gemology)
(This article belongs to the Section Mineralogical Crystallography and Biomineralization)

Abstract

:
Spinel is a precious gem with a long history, but people are far less familiar with it. Previous studies on Mogok spinel from Myanmar focused on inclusion analysis, chromogenic mechanism with a single-color gemstone and heat treatment, whereas systematic studies on varicolored gem-grade spinel are lacking. In this study, the gemological and geochemical analysis of four colors of spinel samples from Mogok were carried out for basic gemology, inclusion morphology and identification, spectroscopy and geochemistry. The aim was to explore the occupation of elements of spinels in the crystal structure, as well as the chromogenic mechanism of varicolored spinels and the geological and geodynamic conditions of the formation. Mogok spinel samples are characterized by octahedral negative crystals filled with calcite and chondrodite inclusions, indicating that they are derived from a marble metamorphic-type deposit. The spinel samples of four colors are magnesia–alumina spinel (MgAl2O4). The contents of V and Cr in Mogok spinel are generally high, with a significant high content of Zn being the most characteristic, and trace elements vary greatly. The infrared spectra of spinel samples in different colors are basically similar. According to the UV–Vis spectrum, pink and red samples are mainly colored by Cr and/or V, whereas orange samples are mainly colored by V. Two wide absorption bands in the range 300~600 nm are mainly attributed to the spin-allowed transition and spin-forbidden transition of Cr3+ and/or V3+. The purple samples are mainly colored by Fe and the UV–Vis spectrum is mainly attributed to the spin-forbidden transition of TFe2+. This study is a favorable supplement to the research on Mogok spinels of various colors from multiple perspectives.

1. Introduction

In recent decades, with the gradual acceptance and recognition of spinel, domestic and foreign scholars have carried out a lot of research on spinel. The research involves occurrence and origin of spinel, crystal structure and chemical composition, gemological, inclusion and spectral characteristics, chromogenic mechanism, artificial synthesis and heat treatment identification, quality evaluation and trade, and many other aspects [1,2,3,4,5,6,7,8,9,10,11,12,13,14].
At present, more than 1000 occurrences of spinel have been found in the world because spinel is often associated with corundum minerals and is distributed in all the places where rubies and sapphires are produced. However, the origin of gem-grade spinel is relatively rare. Gem-grade spinel is mainly produced in Myanmar, Vietnam, Thailand, Tanzania, Tajikistan, Sri Lanka, Pakistan, Afghanistan, Kenya, Madagascar, Australia, the United States, Brazil and other places (Figure 1) [2,8,15,16,17,18,19]. The most famous ones are red spinel and blue spinel in Myanmar, Thailand and Sri Lanka [20,21,22]. Afghanistan produces oversized red spinel [23]. Black spinel is mainly from Thailand [24]. Light-colored spinel is located near the Hunza mountains in northern Pakistan and Ilakaka (Madagascar) [25,26]. The spinel in Tunduru (Tanzania) and the Mahenge region are loved by collectors because of their bright colors [27]. Red, pink and orange spinel is produced in the Mogok area of Myanmar [28]. The most beautiful blue and purple spinel is produced in Sri Lanka and Vietnam [29]. In recent years, spinel has also been found in Yunnan, Xinjiang and other places in China [2,3,13].
Spinel is often associated with corundum minerals, due to its similar composition and origin to ruby and sapphire. Gem-grade spinel deposits can be divided into primary and secondary deposits according to their occurrence. Primary deposits can be divided into metamorphic-type and magmatic-type deposits. Metamorphic-type deposits are mainly formed in contact metamorphic zones, which formed by magma intrusion into limestone or dolomite. Spinel is often associated with forsterite and diopside. Magmatic-type spinel deposits mainly occur in aluminum-rich basic magmatic rocks, often associated with pyroxene, olivine, magnetite, chromite and platinum group minerals. In addition to the primary deposits, most gem-grade spinels are found in secondary deposits and are often co-produced with rubies, sapphires and other minerals [3,30].
This study intends to analyze the gemological characteristics, internal inclusions and chemical compositions of red, pink, orange and purple spinel samples in Mogok, Myanmar. So as to explore the relationship between the composition and genesis of inclusions, the chromogenic mechanism of different colors of spinel provides more information for the study of gem-grade spinel.

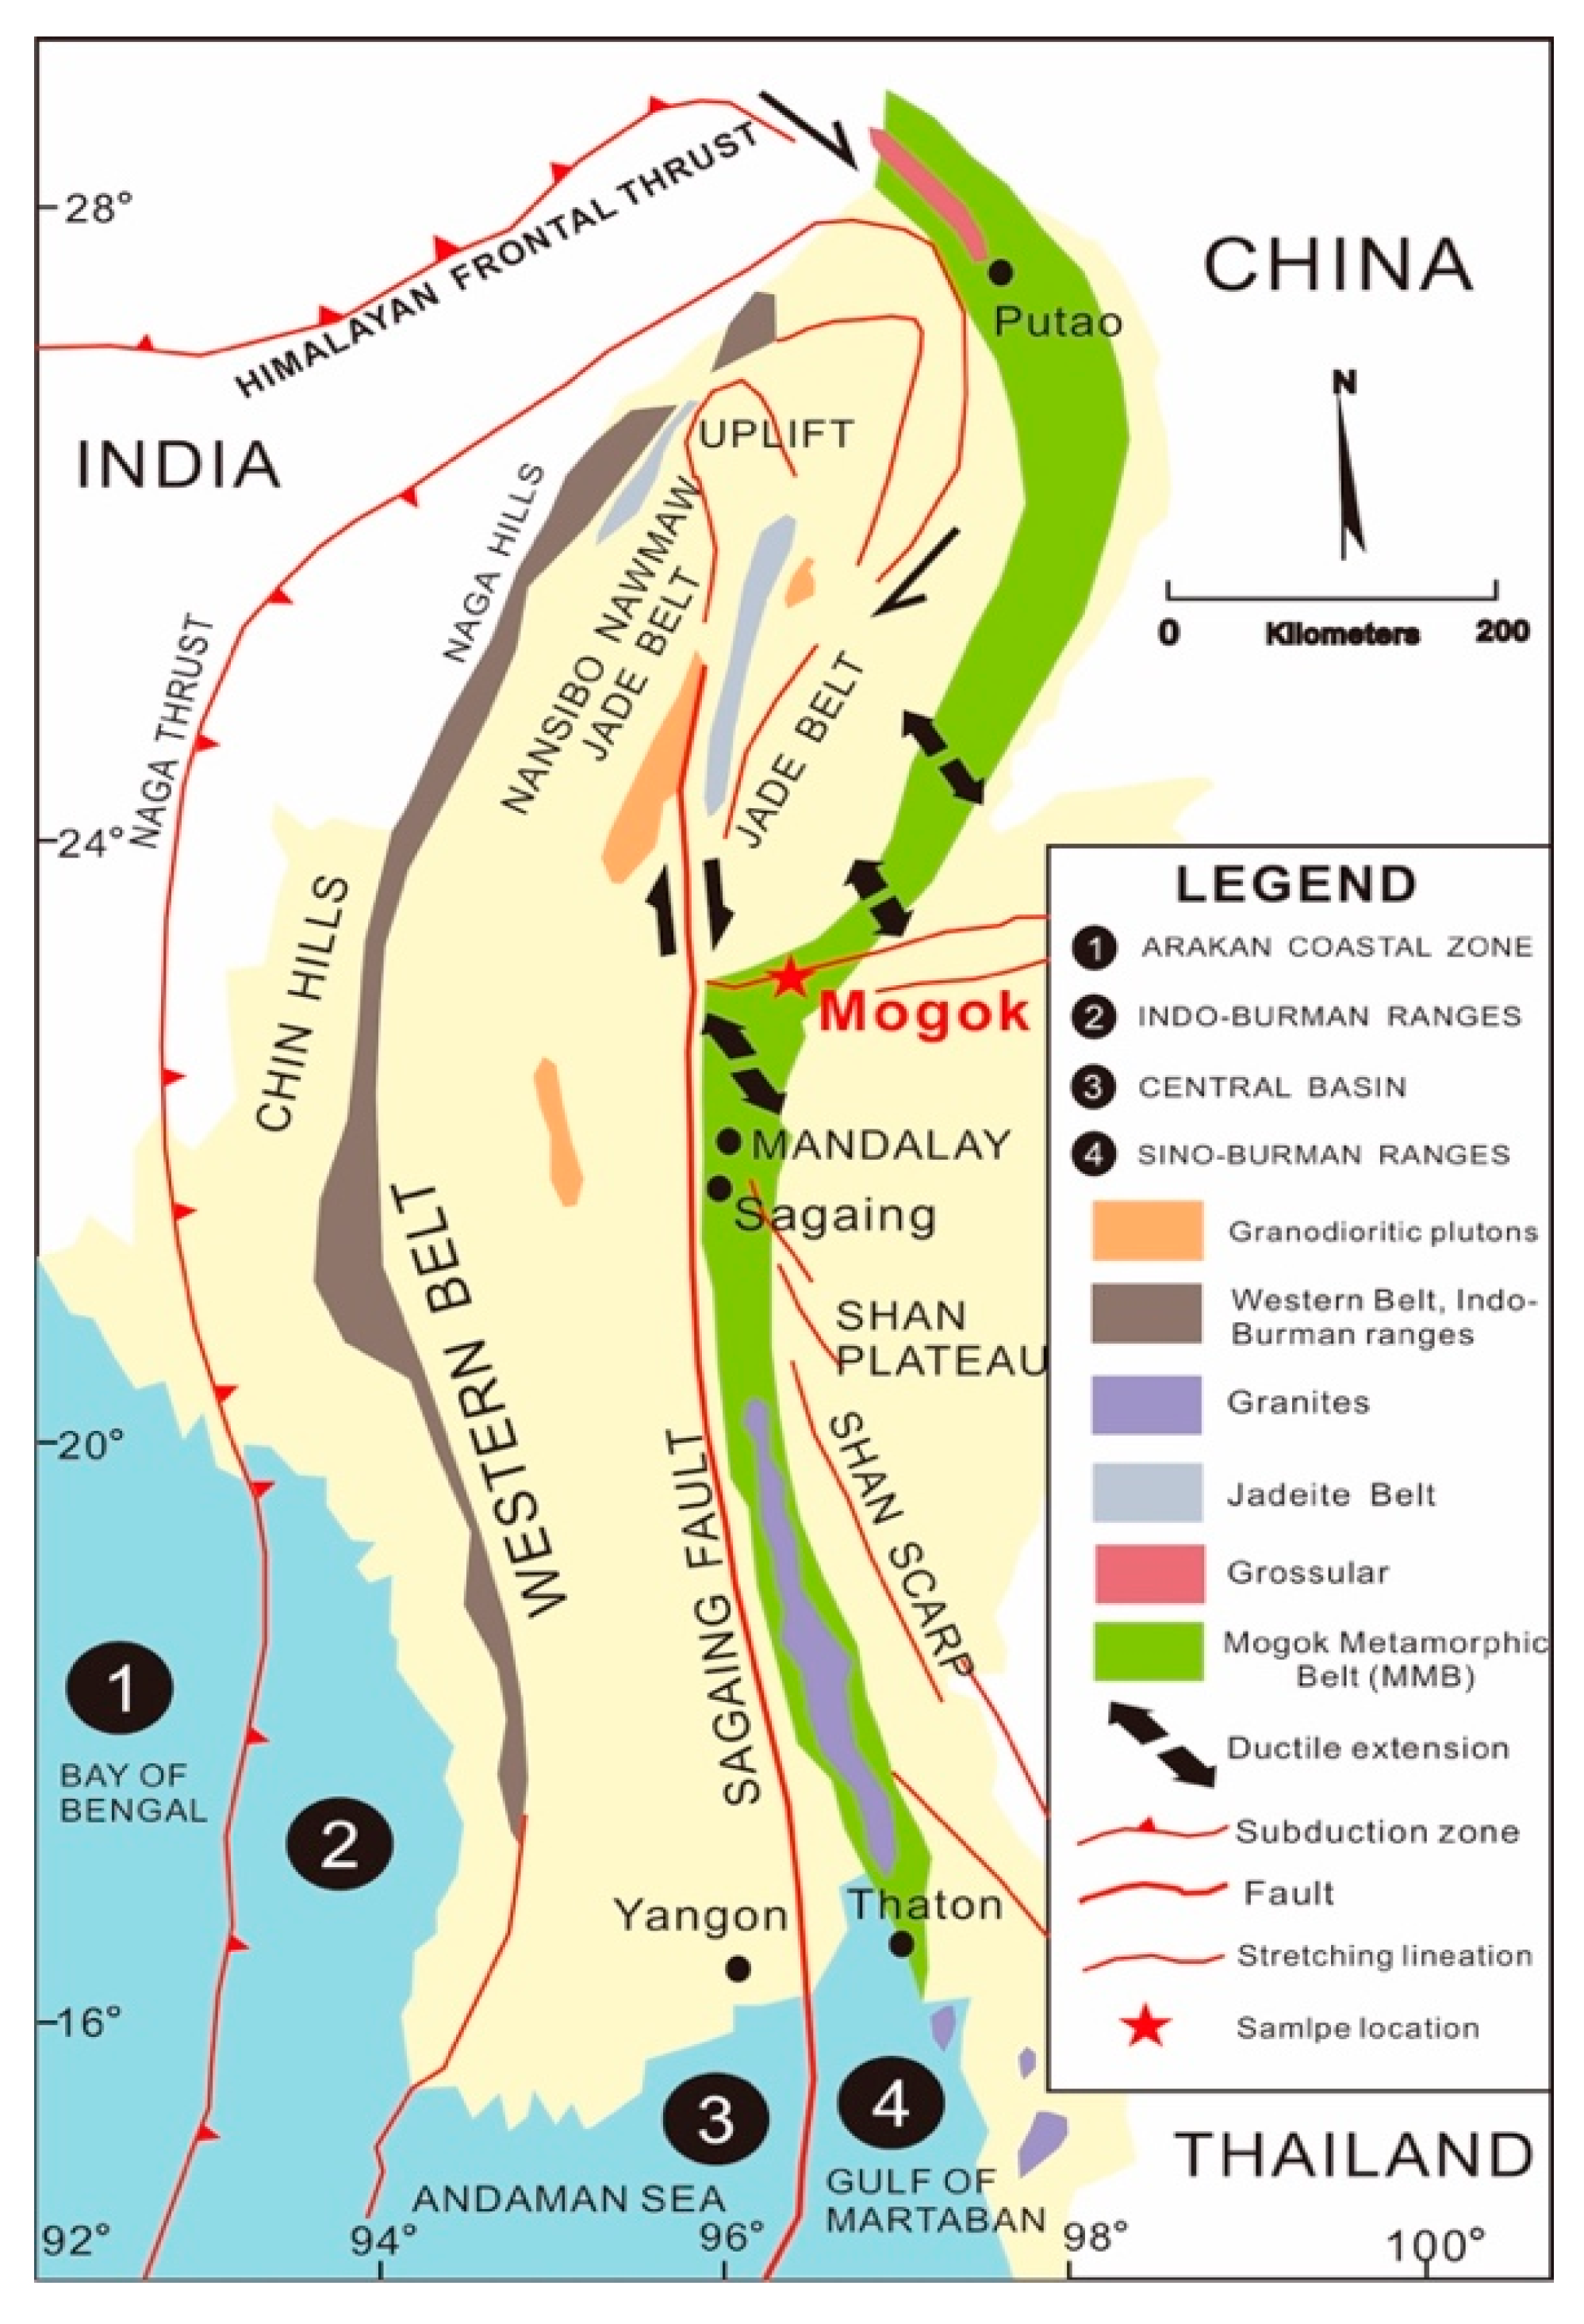
2. Geological Setting

The gem-grade spinel mine in Myanmar is mainly located in the Mogok metamorphic belt (MMB) in Mandalay Province. The geological setting is dominated by high-temperature plastic deformation, which is related to the collision between the Eurasian and Indian plates during the Oligocene to Miocene periods. The high-grade metamorphic granites (~29–37 Ma) [31] and overlying diopside-bearing marbles constitute the main part of the MMB, which is intruded by later granites at ~22–16 Ma. The metamorphic belt extends southward from the eastern Himalayas through the eastern Kachin State and Mogok region to Mandalay (Figure 2).
The gem-grade spinel mine of Mogok is located in the MMB and consists of a metamorphic platform carbonate sedimentary series. These carbonate rocks are composed of marble mixed with calcareous schist and gneiss. The marble unit is formed by discontinuous strata ranging in thickness from 0.1 m to 300 m. These metamorphic sedimentary strata are intruded by granite and pegmatite dikes [32,33] and are stratified with ruby- and spinel-bearing mines. The secondary spinel mines in Mogok are mainly hosted in the gem-rich area locally called the “Mogok Stone Tract”. The spinels from Mogok are derived from the metamorphic marble that occurred as a layered intrusion in the associated gem-bearing igneous rocks from felsic to ultramafic types [28]. It yielded a wide range of mineral assemblages and gem materials (e.g., ruby, spinel, sapphire, peridot and scapolite). Spinel can be found in all primary and secondary mines of corundum [16].
Figure 2. Simplified geological map of the Mogok metamorphic belt in Mandalay Province after Zaw [34].
Crystals 13 00447 g002

3. Materials and Methods

3.1. Sample Description

A total of 18 spinel samples from the Mogok area were collected and used for this study. These spinel samples are all of rough stones weighing from 0.406–1.063 ct (Figure 3A) and numbered from B-1 to B-18. The rough stones were divided into four groups: 3 purple samples (B-1, B-4, B-9), 3 orange ones (B-2, B-5, B-6), 4 pink ones (B-3, B-7, B-8, B-10), and rest of them are red (B-11 to B-18). B-6 is a spinel twin crystal formed by double crystal faces similar to triangular twin crystals of diamond but without herring bone spur lines (Figure 3B). B-14 can be identified as octahedral crystals (Figure 3C). B-13 is in the shape of water eroded pebbles with a rough surface (Figure 3D); the other samples are irregular crystal fragments. Purple, orange and pink samples are transparent, with bright glass luster and a smooth polished surface. The red sample is translucent with weak glass luster. All of the rough stones were cut and polished with a Face Tron faceting machine to obtain two parallel windows for gemological and spectroscopic investigation. Standard gemological instruments were used to measure refractive indices (RIs), specific gravity (SG) and fluorescence reaction to longwave (~365 nm) and short-wave (~254 nm) ultraviolet lamps.

3.2. Microscopic Analysis and Spectroscopy

The standard gemological tests gemstone microscopic observation, laser Raman spectrum, UV–visible spectrum and infrared spectrum were conducted in the Gemological Experimental Teaching Center of the School of Gemology, China University of Geosciences (Beijing). The internal characteristics and photomicrographs were observed with the Nanjing Baoguang GI-MP22 binocular gemological microscope at 10 × 65× magnification. The techniques of incident, dark field, reflected, and oblique illumination were used to investigate internal characteristics.
The HR-Evolution micro laser Raman spectrometer produced by HORIBA with a 532 nm laser was used for identifying mineral inclusions in the samples. Raman spectra were collected in the range 1200~100 cm−1. The laser output power was 45 watts, and the spot size was 2 μm. The exposure time per scan was 20 s. The mineral inclusions were identified and compared with the RRUFF databases. The ultraviolet–visible (UV–Vis) spectra were collected from 300 to 700 nm with a UV-3600 UV–Vis spectrophotometer (Shimadzu Corporation, Kyoto, Japan) to measure the absorption value. A data interval of 2 nm and a scan speed of 405 nm/min was used for operating. The infrared spectrum was carried out using a BRUKER TENSOR 27 Fourier Transform Infrared Spectrometer from Germany. The reflection mode was at 4 cm−1 resolution, and the scanning times were 32 with a measurement range from 400 cm−1 to 2000 cm−1.

3.3. Chemical Analysis

The elemental composition mapping analysis, electron microprobe analysis and laser ablation–inductively coupled plasma mass spectrometry (LA-ICP-MS) analyses were completed in the Experimental Center of the Research Institute of China University of Geosciences (Beijing). The elemental composition mappings were conducted using a Bruker M4 TORNADO X-ray fluorescence imaging spectrometer (Micro-XRF) with a voltage of 50 kV and a current of 600 mA. The analysis is carried out under vacuum conditions of 20 μm beam spot size, 20 ms single point test time and 10 μm step diameter.
Major-element compositions were analyzed by an electron probe micro-analyzer (EPMA), JEOL model JXA-8100. The analyses were carried out with an accelerating voltage of 15 kV and a beam current of 20 nA. Measurement times were set at 10 s for the peak of all analyzed elements and 5 s for the background. The standards used for calibration were NaAlSi2O3 (Na), KAlSi3O8 (K), Cr2O3 (Cr), MgCaSi2O6 (Si, Mg, Ca), Fe2O3 (Fe), Mg3Al2(SiO4)3 (Al), Mn2O3 (Mn), NiO (Ni), ZnO (Zn), TiO2 (Ti) and Ca5P3F (P) [35,36].
LA-ICP-MS was applied to analyze the trace element concentrations using a NewWave 193UC ArF laser and Agilent 7900 quaternary plasma mass spectrometer. The laser employed a 10 Hz pulse rate and 35 μm diameter spot size. The energy density was about 9 J/cm2. Ablation was carried out in a He atmosphere, and the sample gas was mixed with Ar before entering the plasma. NIST-SRM 610 glasses reference materials were used as the external calibration standards. Data reduction was carried out using Iolite software to analyze the following elements: Li, Be, Ti, V, Cr, Mn, Fe, Co, Ni, Cu and Zn [37].

4. Results

4.1. Gemological Properties

The gemological properties of the 18 studied spinel samples are summarized in Table 1. The purple, orange and pink spinel samples are transparent, whereas the red samples are translucent. The refractive index (RI) and specific gravity (SG) values of samples fell in the ranges 1.716–1.718 and 3.54–3.58, respectively. The light-colored spinel samples have lower RI and SG values than the dark-colored samples. The pink samples showed moderate red fluorescence to the long-wave ultraviolet (UV) radiation and weak purple fluorescence under the short-wave UV radiation. The red samples showed strong and weak red fluorescence to long-wave and short-wave UV radiation, respectively. The purple and orange samples are inert to both long-wave and short-wave UV radiation.

4.2. Microscopic Characteristics

Gemstone microscopic observation shows that there are multiple kinds of inclusions and fractures in Mogok spinel samples. The purple spinel samples contain gas–liquid inclusions that contain a black lamellar crystal (Figure 4A) and cloud-like healed fissures impregnated with Fe in its interior (Figure 4B). The typical octahedral inclusions developed in the orange spinel samples (Figure 4C) and the black inclusions with the fluid were also observed (Figure 4D). In addition, hexagonal plate-like inclusions (Figure 4E) and joined octahedral crystals (Figure 4F) can also be found. Some spinel crystals were surrounded by partially healed fissures.
Pink spinel samples also contain octahedral inclusions (Figure 5A), as well as many fine microgranular inclusions (Figure 5B). Due to the low transparency of the red spinel samples, the internal inclusions cannot be clearly observed, only the remnants of black octahedral inclusions and disk-like fissures can be seen (Figure 5C,D).
One of the most common inclusions of the Mogok spinel are octahedral inclusions. These can be interpreted as two types: one type is a negative crystal filled with various minerals, which is irregular in size and consistent with the direction of the spinel [6]; the other type is a parallel array of inclusions in the shape of beads or fingerprints [30]. In this study, octahedral inclusions were cut open on the surface of the host spinel and identified by Raman spectroscopy. The results show three Raman peaks of 762 cm−1, 663 cm−1 and 408 cm−1 for spinel and three peaks of 153 cm−1, 280 cm−1 and 1084 cm−1 for calcite (Figure 6A,B). The 1084 cm−1 peak corresponds to the symmetric stretching vibration of C-O in the [CO3]2−, and the 153 cm−1 and 280 cm−1 peaks correspond to the lattice vibration between Ca2+ and [CO3]2− [6,38,39,40]. Thus, the octahedral crystal inclusions in this study are calcite-bearing negative crystals. In addition, in the analysis of plate-like inclusions it was found that except for the four Raman peaks of 764 cm−1, 663 cm−1, 408 cm−1 and 312 cm−1 for spinel, the four Raman peaks of 845 cm−1, 867 cm−1, 936 cm−1 and 970 cm−1 belong to chondrodite (Figure 6C,D).

4.3. Spectroscopy

4.3.1. FTIR Spectra

The representative FTIR spectrums of the Mogok spinel samples are shown in Figure 7. The infrared spectrum of spinel in the range 400~1000 cm−1 is relatively simple. The infrared spectrum of typical spinel usually shows only two or three absorption bands in the range of the available spectrum. Characteristic mid-IR spectra revealed several absorption bands located at 731 cm−1, 586 cm−1 and 542 cm−l. Two wide absorption bands centered on 728 cm−1 and 542 cm−1, which are consistent with previous analysis results, were obviously observed by infrared spectrum tests on four colors of spinel samples from Mogok spinel [41]. The 728 cm−1 band was assigned to internal Mg-O vibrations, and the 586 cm−1 and 542 cm−1 bands were assigned to internal Al-O vibrations. In addition, a high-frequency absorption band of 840 cm−1 caused by the vibration of oxygen ions was also observed. The low-frequency absorption is caused by metal cation vibration at 579 cm−1 [4]; however, in the infrared spectrum of spinel obtained in this study, only an obvious absorption was found at 586 cm−1, the location of which is slightly different from the results of previous studies. The infrared spectra of Mogok spinel samples with different colors tends to be consistent, and only some peaks are slightly offset, so the color has little effect on the infrared spectra of Mogok spinel.

4.3.2. UV–Vis–NIR Spectra

The UV–Vis–NIR absorption spectra of the Mogok spinel samples all showed similar patterns, as illustrated in Figure 8. We selected two representative samples of each color for the UV–Vis–NIR spectrum test (purple spinel samples B-1 and B-4; orange spinels B-2 and B-6; pink spinels B-3 and B-10; and red spinel samples B-12 and B-13). The Figure 8 spectrum displays that the UV–visible spectra of red, pink and orange spinel samples from the four colors show the absorption broadband in the blue-purple zone centered at 400 nm and the yellow-green zone centered at 550 nm. These two absorption bands are formed by Cr3+ and V3+. The blue-purple zone absorption intensity of orange spinel samples is slightly higher than that of yellow-green zone, and the two broadband absorption intensities are relatively uniform. The intensity difference between the two broadbands of pink spinel samples is small, and the absorption intensity of low wavelength at 400 nm is high. The blue-purple zone is uneven absorption, and the transmittance of the blue zone is higher than that of purple zone. The absorption intensity of purple spinel samples increases at 350 nm, forming a strong absorption edge and indicating that the absorption mechanism changes widely. Taran M.N. et al. [42] believed that it was formed by the charge transfer between oxygen ions and iron ions (O2− → Fe3+ and O2− → Fe2+). In addition, the absorption intensity of the narrow band at 470 nm is not high and lower than the absorption peak at 380 nm. The absorption intensity of a sample of red spinel in the blue-purple zone is twice that of the yellow-green zone. The blue-purple absorption band is uneven inside. The transmittance of the blue area is higher than that of the purple area so it has a red hue.

4.3.3. Raman Spectra of Spinel in Mogok Samples

The Raman spectra of Mogok spinel samples show sharp spectrum peaks, high signal-to-noise ratio and the fluorescence back has no effect on the Raman signal (Figure 9). Two representative samples of each color were selected for the Raman spectrum test (purple samples B-4 and B-9; orange samples B-5 and B-6; pink samples B-8 and B-10; and red samples B-14 and B-15). The Raman spectra of spinel samples with different colors are basically similar, only the intensity and wave number of each Raman peak feature is slightly different. There are four peaks within the range of 200–900 cm−1, 312 cm−1, 408 cm−1, 663 cm−1 and 764 cm−1. The 408 cm−1 peak is the characteristic Raman peak of spinel, which is caused by the bending vibration of O-Mg-O in the tetrahedron. The 767 cm−1 peak is the bending vibration of O-Al-O, and the 312 cm−1 peak is the translation of Mg ions in the center of the tetrahedron [43,44]. The pink, orange and purple spinel samples have high peak intensity at 408 cm−1, whereas the red spinel samples are relatively weak.

4.4. Chemical Compositions

The compositions of major elements by EPMA and trace elements by LA-ICP-MS in the four colors of spinel samples from Mogok in Myanmar are presented in Table 2 and Table 3, respectively. The composition of major elements was MgO (27.75–29.49 wt.%) and Al2O3 (68.85–70.81 wt.%), which is relatively consistent in the four colors of spinel samples. The MnO and TiO2 contents were nearly identical across the four colors. The red spinel samples contain highest concentrations of Cr2O3 (1.07–1.21 wt.%) and higher FeO content than the orange and pink spinel samples but lower than purple samples. The purple and pink spinel samples possessed higher ZnO content than the other samples. In addition, the contents of trace elements such as V, Co and Ni also varied in spinel samples with different colors. The V content of orange and red spinel samples (average 2099.66 and 1142.16 ppm) was orders of magnitude different from that of pink and purple samples. The Co element was mainly distributed in purple and red spinel samples. Pink and red samples are relatively high in Ni content, but the Ni element is depleted in spinel.

5. Discussion

5.1. Mineral Structure and Crystal Chemical Formula of Mogok Spinel

The MgO content of Mogok spinel samples ranges from 27.75 wt% to 29.49 wt%, and the Al2O3 content ranges from 68.85 wt% to 70.81 wt%. They all belong to magnesia–alumina spinel (MgAl2O4), which is consistent with the infrared spectrum analysis results of Myanmar spinel samples.
“Normal” spinel is usually represented by the formula AB2O4 and the main mineral composition includes spinel, Fe-spinel, Zn-spinel, Mn-spinel, magnetite, titanite, Zn-Fe-spinel, Ni-magnetite and chromite. The main cations in Group A are Fe2+, Mg2+, Mn2+, Zn2+, Ni2+, etc. The main cations in Group B are Cr3+, Fe3+, Al3+, Ti4+, etc. In addition, Fe2+, Mg2+, Mn2+, Co2+, Ni2+ and Mn3+ can also be added to Group B. In the spinel-type structure, O2− is tightly packed in cubic shapes, with 64 tetrahedral voids (possible location of A) and 32 octahedral voids (possible location of B) in unit cells. However, only 8 tetrahedral voids and 16 octahedral voids are occupied, and the whole structure can be regarded as the connection of tetrahedron [AO4] and octahedron [BO6]. The spinel structure is that 8 Group A divalent cations occupy tetrahedral positions and 16 Group B trivalent cations occupy octahedral positions in unit cell. The octahedral site preference energy (OSPE) of Cr3+ is much higher than that of Fe2+, so the trivalent cation (Cr3+) has the priority to occupy the octahedral position, whereas the divalent cation (Fe2+) has to enter the tetrahedral position to form a spinel structure. Based on the crystal structure characteristics of spinel group minerals, the molecular formula of spinel was calculated based on the electron probe microchemical composition analysis data of 20 spinel samples in Mogok, Myanmar (Table 4).
The molecular formula of Mogok spinel samples showed that Mg2+ was the main cation in Group A, and a few samples contained Fe2+. The main cations in Group B are Al3+, Mg2+, Zn2+, Fe2+, Cr3+, Ti4+ and Mn2+. In Group B, the Al3+ cation occupancy number ranges from 1.950 to 1.986, the Mg2+ cation occupancy number is 0.001~0.043, the Fe2+ cation occupancy number is 0.001~0.010, and the Zn2+ cation occupancy number is 0.001~0.004. Cr3+ and Ti4+ cation occupancy numbers are 0.001~0.023 and 0.006~0.001, respectively. The elements with occupying atomic numbers greater than 0.05 were classified, named and combined with the principle of occupying cations of Group A and B; the four colors of Mogok spinel were all divided into the magnesium–aluminum subspecies.
A number of papers were also devoted to the experimental study of nonstoichio- metric Mg–Al spinel. For example, using the methods of electron paramagnetic resonance, optical absorption and cathodoluminescence to explore novel hole-type defects in fast neutron irradiated MgAl2O4 [45], as well as the structural defects and thermal annealing in fast-neutron-irradiated nonstoichiometric MgO⋅2.5Al2O3 [46].

5.2. Chromogenic Mechanism of Mogok Spinel

The chemical composition of spinel is MgAl2O4, and the pure spinel sample is colorless. The Mg2+and Al3+ are often replaced by Cr3+, V3+, Fe2+, Fe3+ and other transition metal ions, making them appear different colors. This study, from the perspective of mineral physics and chemistry, uses the methods of micro-XRF mapping, UV–Vis–NIR spectrum analysis and chemical composition to discuss energy level splitting, electronic transition and trace element contents of chromogenic ions in different color spinel samples in Myanmar. It gives a certain explanation for the chromogenic mechanism of spinel in different colors.

5.2.1. Micro-XRF Mapping

Micro-XRF mapping shows that different color elements make spinel display different colors (Figure 10). Orange spinel sample (B-2) is color induced by V, and the content of the V element is the highest of the four-color samples. The red spinel sample (B-15) is chromatized by Cr and contains a small amount of Fe, V and Ti. Purple spinel (B-1) is colored by Fe and also shows a small amount of Ti. The pink spinel sample (B-8) only shows a small amount of V and Cr, whereas other elements are not detected. Therefore, the higher Cr concentration of spinel, the stronger red tone. Purple spinel is colored by the trace element Fe, and the presence of V often makes the gemstone appear orange.

5.2.2. Chromogenesis by UV–Vis–NIR Spectrum

The transition group metal elements can produce electronic transition from the ground state to the excited state by light irradiation. Figure 11 shows the wavelengths of visible light waves with different colors and the spectral bands of spinel with different colors in combination with previous studies. They were analyzed using PeakFit v4.12 software (Systat software, Palo Alto, United States). The baseline Tol = 3.0%, and the curve was smooth Sm < 9.12%. Gauss fitting was used to control the fitting coefficient r2 > 99%. The position of the absorption band is related to the major elements of the samples, whereas the strength of the absorption band is related to the trace element compositions.
Red and pink spinel samples are mainly colored by Cr and V elements. The higher the concentration of Cr3+ and V3+, the stronger red tone. The curves obtained by peak fitting are shown in Figure 11A,C. The electronic transitions of Cr3+ and V3+ are the main characteristics of red (B-11) and pink (B-3) samples. The absorption spectra of the samples were fitted with 8 and 11 Gauss curves, respectively. There were two wide absorption broadbands in the range 300–600 nm (Figure 8 and Figure 10A,C). The wide absorption band centered at 400 nm was divided into several parts, which were 392 nm and 428 nm in the red sample. In the pink sample, there are 357 nm, 387 nm, 420 nm and 428nm absorption bands. In the spinel crystal structure, the composition shift is caused by the ionic radius. Cr3+ (radius of 0.615 Ǻ) instead of Al3+ (0.535 Ǻ) leads to octahedral triangle distortion [43]. The absorption peak in the range 372~389 nm is caused by the spin-allowed transitions of VICr3+ ions, 4A2g(F) → 4T1g(F) and/or VIV3+ spin-allowed transition of 3T1g(3F) → 3T2g(3F) [43,44,45]. The absorption peak in the range 416~426 nm is caused by the spin-allowed transition of VICr3+ ions, 4A2g(F) → 4T1g(F) [47,48,49]. The wide absorption band centered at 550 nm fitted two Gaussian curves of 522 nm and 563 nm in the red sample and 505 nm, 534 nm, 564 nm, 600 nm and 637 nm in the pink sample. The absorption band ranges from 524 nm to 538 nm, which is caused by the VICr3+ spin-allowed transition 4A2g(F) → 4T2g(F) [47,48,49]. The absorption band changes between 545 nm and 583 nm, which is caused by the VICr3+ spin-allowed transition 4A2g(F) → 4T2g(F) and/or the VICr3+ spin-allowed transition 3T1g(3F) → 3T1g(3P) [47,48,49]. The origin of the absorption curve fitted in the range 600–800 nm is controversial. The 699 nm absorption peak may be caused by the spin-forbidden transition of VICr3+ 4A2g(F) → 4T1g(F) and 4A2g(F) → 2Eg(F) [47,48,49]. Since the UV–visible absorption spectrum of orange spinel is basically consistent with that of the pink and red samples, the fitting results of orange spinel (shown in Figure 10B) are still mainly the Cr3+ and/or V3+ spectra. The chromogenic effect of Cr3+ may be related to its charge transfer or Mn and Fe (Fe3+) and low Fe and Cr contents. V3+ (390 nm and 560 nm) occupies the octahedral position, giving it an orange color [50].
The absorption band position of purple spinel, which is mainly chromologically induced by Fe, is shown in Figure 11D. The UV–Vis–NIR spectrum of purple spinel can be fitted with seven Gauss curves within the range 350–430 nm. In the range 350~430 nm, all purple samples can be fitted with two Gauss curves. The 379 nm absorption band is caused by the TFe2+ spin-forbidden transition 5E → 3E [23,51]. The 402 nm absorption band is caused by the TFe2+ spin-forbidden transition 5E → 3T1 or/and the MFe3+ spin-forbidden transition 6A1g4Eg(4D) [51].
In the range 500–600 nm, three Gaussian curves were fitted. Taran M.N. et al. [42] believed that light-purple spinel belongs to low Fe spinel. Their spectrum is independent of the total Fe content and is related to the ratio and distribution of Fe3+/Fe2+. It is mainly caused by the spin-forbidden transition and the spin-allowed transition of TFe2+. The 525 nm and 554 nm absorption bands are caused by the spin-forbidden transition 5E(D) → 3T2(H) of TFe2+ [42]. The 589 nm absorption band is caused by the spin-forbidden transition 5E(D) → 3T1(H) of TFe2+ [42,52].

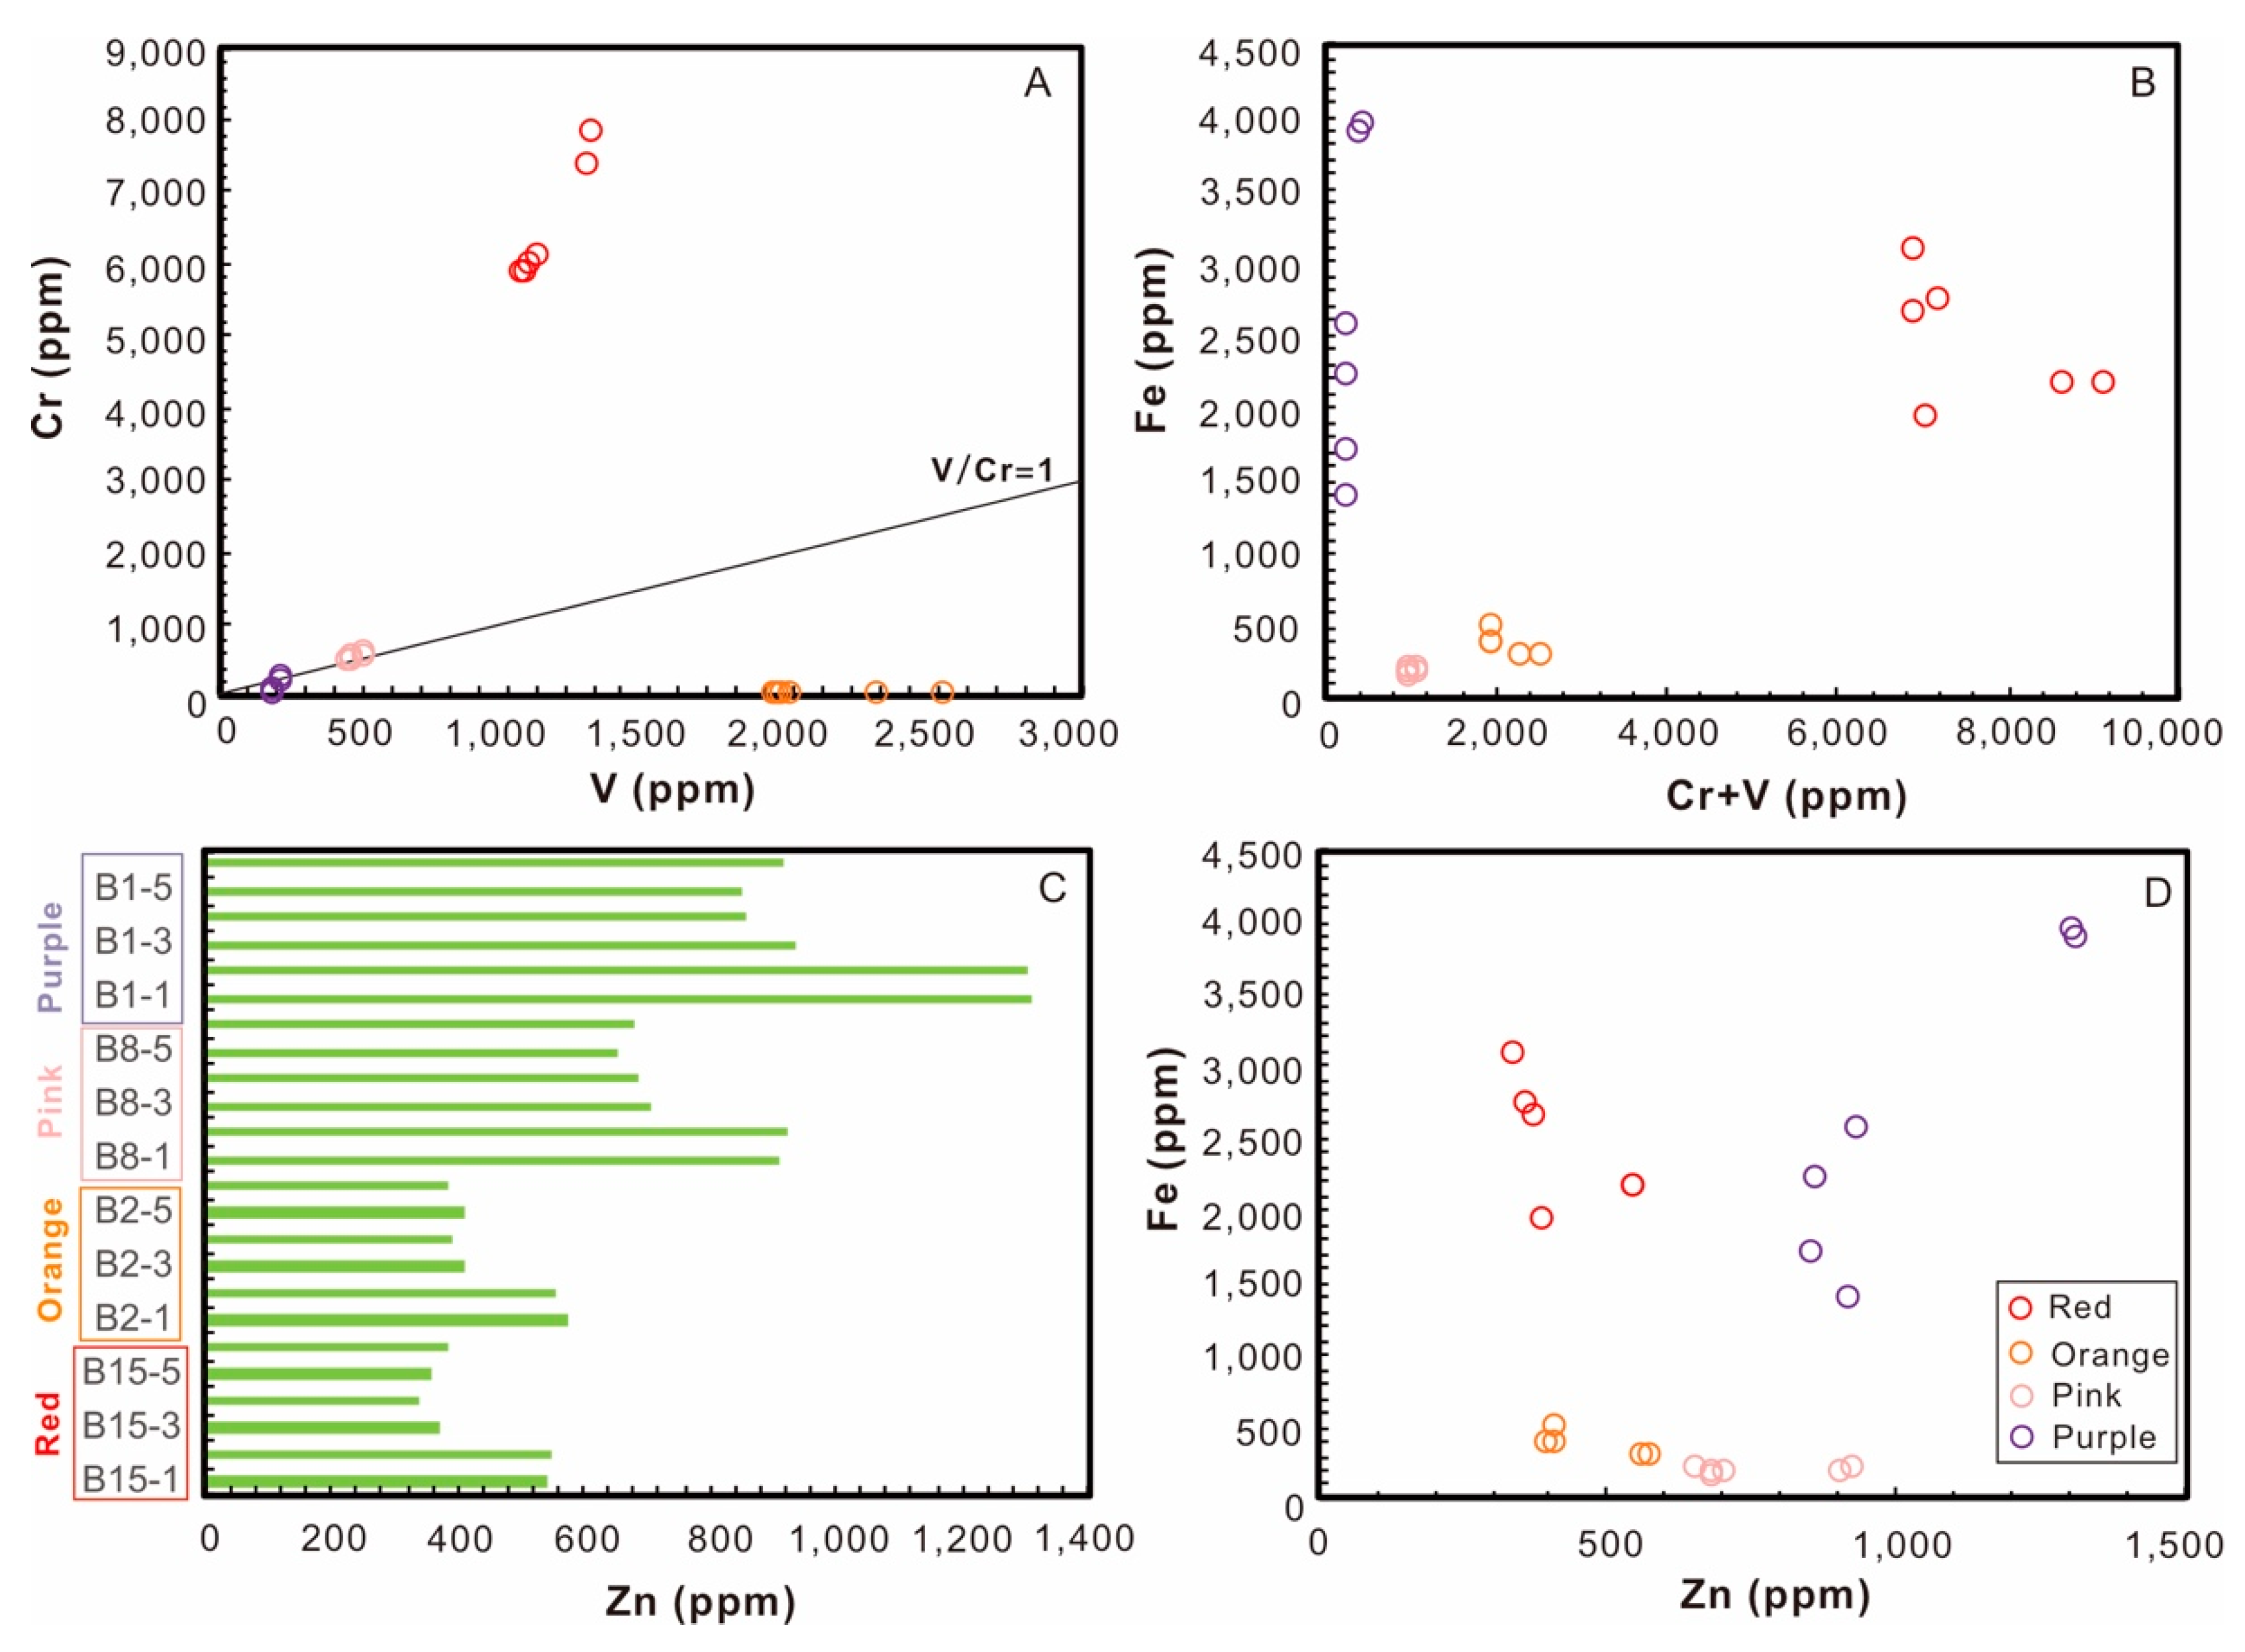
5.2.3. Trace Elements Analysis in Different Color Spinel

The transition elements contained in the four colors of Mogok spinel are mainly Cr, V and Fe. They also contain trace elements of Ti, Ni, Mn and Co, etc. The contents of Co and Ni are too low to reach the lower limit of coloration, which proves that Co and Ni are not the main cause of the blue tone in Mogok spinel samples. Moreover, the chromogenic ability of Mn and Ti is not significant in spinel samples so has no decisive effect on the chromogenesis.
Almost all of the four-color samples contain Cr, V and Fe elements. The element contents in different color systems and different tones are different, with certain regularity. As shown in Figure 12A, the Cr content of the red samples is higher than that of the other samples, of which the Cr content of sample B5-2 is the highest at 7830 ppm. The Cr2O3 content of the other samples is above 5800 ppm. The V content of orange samples is the highest and is between 1929 and 2518 ppm; the V content of sample B2-2 is the highest at 2518 ppm. The V content of red samples is higher than that of pink ones. The Fe content of pink and orange spinel samples is generally low, whereas the Fe content of red spinel samples is relatively high, ranging from 1929 ppm to 3081 ppm. The Fe content of purple spinel samples is the highest overall, ranging from 1365 ppm to 3925 ppm. The content of Fe in sample B1-2 is the highest at 3925 ppm.
The total content of Cr+V in warm-color-system (red, pink and orange) spinel samples is high. The content of Cr+V in cold-color-system (purple) spinel samples is generally low (Figure 13B). In warm-color-system spinel, the lower the contents of Cr and V, the lighter the red tone of the spinel. The orange tone of spinel is related to the V and Cr content. As shown in Figure 13A, by comparing the contents of Cr and V, the V/Cr ratios of orange spinel samples are all greater than 1. Therefore, V plays a dominant role in the orange tone of spinel. In the cool color system (purple) of spinel, the lower the Fe content, the lighter the blue tone of the sample and the higher the Fe content, the stronger the blue tone of the sample (Figure 13B).
All of the four colors of Mogok spinel samples contain Zn, and the Zn content of spinel samples of different colors is different (Figure 13C). The Zn content of warm-color (pink, red and orange) spinel is relatively low, between 339 ppm and 926 ppm; the highest Zn content of the sample is 926 ppm. In the cold-color (purple) spinel, the Zn content of spinel can reach 1312 ppm and that of the other samples is higher than 850 ppm. Therefore, according to Figure 13D, it can be seen that Fe and Zn jointly dominate the chromogenic mechanism of purple spinel samples.

5.3. Metallogenic Background and Geological Gem-Formation Conditions

The characteristics of inclusions can reflect the origin of the crystal, which is mainly manifested in two aspects: one is the geochemical conditions in the crystal growth environment (such as the temperature, pressure and chemical reaction, etc.) and the other is the chronological order, which is the comparison of the formation order between the crystals. The inclusions in crystals often follow specific rules and are affected by the geological background of the mining area. Therefore, the gem-formation conditions can also be inferred from the internal mineral assemblage.
In the metamorphic dolomitic limestone marble of Mogok, dolomites have developed into coarse grains with magnesium properties through metasomatism and replacement. They are associated with calcite and are also the parent rock of the spinel deposit in Mogok. Ruby and spinel produced in Mogok were formed in the contact metamorphism between dolomite, limestone, marble, granite and gneiss. This process introduces necessary elements, such as Ca, Mg, Al, Sn and trace elements Cr, F, P and Ti. In the Mogok deposit, diopside is the first crystalline mineral, followed by forsterite and enstatite [53]. The chemical compositions of Ca, Sn and Ti ensure the growth of sphene. F is involved in phlogopite, where the Cl element is added in apatite and scapolite. MgO is combined with Al to provide the composition of spinel. After MgO is exhausted, alumina is crystallized into corundum and a small amount of Cr was added to form ruby. Apatite, pyroxene, forsterite, and mica are the most common primary mineral inclusions in Mogok spinel [28], which is consistent with the research conclusion. There is no ruby inclusion in the spinel, mainly because the formation time of spinel is earlier than that of ruby. Therefore, the relationship between the formation order of Mogok minerals is: diopside-forsterite/enstatite-apatite-spinel-ruby.

6. Conclusions

This study systematically investigated the gemological and geochemical characteristics of four colors of Mogok spinel samples. The purple, orange and pink spinel samples are transparent, whereas the red samples are translucent with strong red fluorescence under long-wave UV radiation. Calcite and chondrodite are the main characteristic inclusions, indicating spinel samples are derived from a marble metamorphic-type deposit. Based on the occupancy of major elements in the spinel crystal lattice, all spinel samples belong to the magnesium–aluminum spinel (MgAl2O4) subspecies. Red and pink spinel samples are mainly chromatically induced by Cr and V, with two wide absorption bands centered at 400 nm and 550 nm. Orange spinel samples are mainly chromatically induced by V. Its UV–VIS spectrum is consistent with that of red-pink spinel, which is mainly attributed to the spin-allowable transition and spin-forbidden transition of Cr3+ and V3+. The purple spinel samples are mainly colored by Fe. The absorption band of UV–VIS spectrum is mainly attributed to the spin-forbidden transition of TFe2+. According to the sequence of mineral formation of the Mogok deposit, the formation of gem-grade spinel is earlier than ruby. This study can help to enrich the understanding of the gemology, chromogenic mechanism and metallogenic background of Mogok spinel.

Author Contributions

Writing—original draft, Y.Z.; writing—review and editing, Y.Z. and B.X.; data curation, Z.Z., Q.X. and Z.L.; software Y.Z. and Z.Z.; methodology, B.X. All authors have read and agreed to the published version of the manuscript.

Funding

This research was funded by the National Key Technologies R&D Program (2019YFA0708602 2020YFA0714800) and the National Natural Science Foundation of China (42222304, 42073038, 41803045, 42202084), Young Talent Support Project of CAST, the Fundamental Research Funds for the Central Universities (Grant no. 265QZ2021012), and IGCP-662.

Data Availability Statement

The data presented in this study are available within the article.

Acknowledgments

We thank the editor and three anonymous reviewers for their constructive comments which helped in improving our paper. This is the 11th contribution of B.X. for the National Mineral Rock and Fossil Specimens Resource Center.

Conflicts of Interest

The authors declare no conflict of interest.

References

  1. Xiao, L. Gemmological characteristics and commercial evaluation of Burmese spinels. Jewellery 1992, 1, 43–46. (In Chinese) [Google Scholar]
  2. Pardieu, V. Hunting for “Jedi” spinels in Mogok. Gems. Gemol. 2014, 50, 46–57. [Google Scholar] [CrossRef]
  3. Zhang, B.L.; Schwarz, D.; Lu, T.J.B. Geographic Origin Determination of Colored Gemstones, 1st ed.; Geology Press: Beijing, China, 2012; pp. 305–328. [Google Scholar]
  4. Ren, Q.Q. High Temperature Heat Treatment of Spinel from Burma. Master’s Thesis, China University of Geosciences, Wuhan, China, 2016. (In Chinese with English Abstract). [Google Scholar]
  5. Sun, W.J. The Study on Gemological Characteristics and Inclusion Origin of Spinels in Myanmar. Master’s Thesis, China University of Geosciences, Beijing, China, 2018. (In Chinese with English Abstract). [Google Scholar]
  6. Wang, S.X.; Zheng, H.F. Research on Raman Spectra of Calcite Phase Transition at High Pressure. Spectrosc. Spect. Anal. 2011, 31, 2117–2119, (In Chinese with English Abstract). [Google Scholar]
  7. Yu, X.Y.; Long, Z.Y.; Zhang, Y.; Qin, L.J.; Zhang, C.; Xie, Z.R.; Wu, Y.R.; Yan, Y.; Wu, M.K.; Wan, J.X. Overview of gemstone resources in China. Crystals 2021, 11, 1189. [Google Scholar] [CrossRef]
  8. Giuliani, G.; Fallick, A.E.; Boyce, A.J.; Pardieu, V.; Pham, V.L. Pink and red spinels in Marble: Trace elements, oxygen isotopes, and sources. Can. Mineral. 2017, 55, 743–761. [Google Scholar] [CrossRef]
  9. Wang, C.S.; Shen, X.T.; Ren, Q.Q.; Luo, Y. Composition and formation of octahedral inclusion in spinel. J. Gems Gemmol. 2016, 18, 40–46, (In Chinese with English Abstract). [Google Scholar]
  10. Zhai, S.H.; Pei, J.C.; Huang, W.Z. Orange-yellow inclusion in spinel from Man Sin, Myanmar. J. Gems Gemmol. 2019, 21, 24–30, (In Chinese with English Abstract). [Google Scholar]
  11. Themelis, T. Gems and Mines of Mogok; A&T Publishers: Los Angeles, CA, USA, 2008. [Google Scholar]
  12. Zhang, B.L. Systematic Gemmology, 2nd ed.; Geology Press: Beijing, China, 2006; pp. 281–286. [Google Scholar]
  13. Boris, C.; Benjamin, R.; Emmanuel, F.; Phillipe, R.; Jean-Luc, D. Blue spinel from the Luc Yen district of Vietnam. Gems Gemol. 2015, 51, 2–17. [Google Scholar]
  14. Wu, J.; Sun, X.; Ma, H.; Ning, P.; Tang, N.; Ding, T.; Li, H.H.; Zhang, T.Y.; Ma, Y. Purple-Violet Gem Spinel from Tanzania and Myanmar: Inclusion, Spectroscopy, Chemistry, and Color. Minerals 2023, 13, 226. [Google Scholar] [CrossRef]
  15. Giuliani, G.; Fallick, A.E.; Boyce, A.J.; Pardieu, V.; Pham, V.L. Pink and Red Gem Spinels in Marble and Placers. Incolor 2019, 43, 14–28. [Google Scholar]
  16. Malsy, A.; Klemm, L. Distinction of gem spinels from the Himalayan Mountain Belt. Chimia 2010, 64, 741–746. [Google Scholar] [CrossRef]
  17. Chauviré, B.; Rondeau, B.; Fritsch, E.; Ressigeac, P.; Devidal, J.-L. Blue spinel from the Luc Yen District of Vietnam. Gems Gemol. 2015, 51, 2–17. [Google Scholar] [CrossRef]
  18. Boehm, E.W. Gem Notes: Purple spinel from Badakhshan, Afghanistan. J. Gemmol. 2017, 35, 694–697. [Google Scholar]
  19. Hänsel, S.; Lhuaamporn, T.; Suphan, C. Gem Notes: Update on Purple Spinel from Afghanistan. J. Gemmol. 2021, 37, 678–680. [Google Scholar] [CrossRef]
  20. Astrik, G.; Annibale, M.; Anastasia, R.; Florentina, M.O.; Adolfo, E.; Augusto, M. Investigating the colour of spinel: 1. Red gem-quality spinels (“balas”) from Ratnapura (Sri Lanka). Rend. Lincei. 2013, 24, 127–140. [Google Scholar]
  21. Peretti, A.; Kanpraphai-Peretti, A.; Güther, D. World of magnificent spinel: Provenance and identification. Contrib. Gemol. 2015, 11, 285–292. [Google Scholar]
  22. Balocher, F. The spinels of Mogok: A brief overview. Incolor 2019, 43, 34–39. [Google Scholar]
  23. Belley, P.M.; Palke, A.C. Purple Gem Spinel from Vietnam and Afghanistan: Comparison of Trace Element Chemistry, Cause of Color, and Inclusions. Gems Gemol. 2021, 57, 228–238. [Google Scholar] [CrossRef]
  24. Khamloet, P.; Pisutha-Arnond, V.; Sutthirat, C. Mineral inclusions in sapphire from the basalt-related deposit in Bophloi, Kanchanaburi, western Thailand: Indication of their genesis. Russ. Geol. Geophys. 2014, 55, 1087–1102. [Google Scholar] [CrossRef]
  25. Harding, R.R. Blue spinel from the Hunza valley, Pakistan. J. Gemmol. 1987, 20, 403–405. [Google Scholar] [CrossRef]
  26. Liang, B.X.; Chen, M.H. Inclusion and Spectral Characteristics of Sapphire from Ilakaka, Madagascar. J. Gems Gemmol. 2022, 1, 28–38, (In Chinese with English Abstract). [Google Scholar]
  27. Pay, D. Tsavorite garnet and Mahenge red spinel. Gems Gemol. 2015, 51, 77–80. [Google Scholar]
  28. Phyo, M.M.; Bieler, E.; Franz, L.; Balmer, W.; Krzemnicki, M.S. Spinel from Mogok, Myanmar—A Detailed Inclusion Study by Raman Microspectroscopy and Scanning Electron Microscopy. J. Gemmol. 2019, 36, 418–435. [Google Scholar] [CrossRef]
  29. Blauwet, D. Gem News: Spinel from northern Vietnam, including a new mine at Lang Chap. Gems Gemol. 2011, 47, 60–61. [Google Scholar]
  30. Yu, X.Y. Colored Gemmology, 2nd ed.; Geology Press: Beijing, China, 2016; pp. 15–26. [Google Scholar]
  31. Searle, M.P.; Noble, S.R.; Cottle, J.M.; Waters, D.J.; Mitchell, A.H.G.; Hlaing, T.; Horstwood, M.S.A. Tectonic evolution of the Mogok Metamorphic belt, Burma (Myanmar) constrained by U-Th-Pb dating of metamorphic and magmatic rocks. Tectonics 2007, 26, TC 3014. [Google Scholar] [CrossRef]
  32. Robert, E.K.; Robert, C.K. Status of ruby and sapphire mining in the Mogok Stone Tract. Gems Gemol. 1992, 28, 152–174. [Google Scholar]
  33. Garnier, V.; Giuliani, G.; Ohnenstetter, D.; Fallick, A.E.; Dubessy, J.; Banks, D.; Vinh, H.Q.; Lhomme, T.; Maluski, H.; Pecher, A. Ar-Ar and U-Pb ages of marble-hosted ruby deposits from central and southeast Asia. Can. J. Earth Sci. 2006, 34, 169–191. [Google Scholar] [CrossRef]
  34. Zaw, K. Overview of mineralization styles and tectonic-metallogenic setting in Myanmar. Geol. Soc. Lond. Mem. 2017, 48, 531–556. [Google Scholar] [CrossRef]
  35. Xu, B.; Hou, Z.Q.; Griffin, W.L.; Lu, Y.; Belousova, E.; Xu, J.F.; O’Reilly, S.Y. Recycled volatiles determine fertility of porphyry deposits in collisional settings. Am. Mineral. 2021, 106, 656–661. [Google Scholar] [CrossRef]
  36. Xu, B.; Hou, Z.Q.; Griffin, W.L.; O’Reilly, S.Y. Apatite halogens and Sr–O and zircon Hf–O isotopes: Recycled volatiles in Jurassic porphyry ore systems in southern Tibet. Chem. Geol. 2022, 605, 120924. [Google Scholar] [CrossRef]
  37. Xu, B.; Hou, Z.Q.; Griffin, W.L.; Zheng, Y.C.; Wang, T.; Guo, Z.; Hou, J.; Santosh, M.; O’Reilly, S.Y. Cenozoic lithospheric architecture and metallogenesis in Southeastern Tibet. Earth Sci. Rev. 2021, 214, 103472. [Google Scholar] [CrossRef]
  38. Zhu, J.R.; Yu, X.Y. Inclusions of Spinel from Burma. J. Gems Gemmol. 2018, 20, 18–23, (In Chinese with English Abstract). [Google Scholar]
  39. Du, G.P.; Fan, J.L. Characteristics of Raman Spectral of Calcite Group Minerals. J. Miner. Petrol. 2010, 30, 32–35, (In Chinese with English Abstract). [Google Scholar]
  40. Liu, C.J.; Zheng, H.F. In Situ Experimental Study of Phase Transition of Calcite by Raman Spectroscopy at High Temperature and High Pressure. Spectrosc. Spect. Anal. 2012, 32, 378–382, (In Chinese with English Abstract). [Google Scholar]
  41. White, W.B.; DeAngelis, B.A. Interpretation of the vibrational spectra of spinels. Spectrochim. Acta Part A Mol. Spectrosc. 1967, 23, 985–995. [Google Scholar] [CrossRef]
  42. Taran, M.N.; Koch-Müller, M.; Langer, K. Electronic absorption spectroscopy of natural (Fe2+, Fe3+)-bearing spinels of spinel s.s.-hercynite and gahnite-hercynite solid solutions at different temperatures and high-pressures. Phys. Chem. Miner. 2005, 32, 175–188. [Google Scholar] [CrossRef]
  43. O’Horo, M.P.; Frisillo, A.L.; White, W.B. Lattic vibration of MgAl2O4 spinel. J. Phys. Chem. Solids 1973, 34, 23–28. [Google Scholar] [CrossRef]
  44. Razvan, C.; Edward, J.B. Elasticity and Raman and infrared spectra of MgAl2O4 spinel from density functional perturbation theory. Phys. Earth Planet. Inter. 2009, 174, 113–121. [Google Scholar]
  45. Lushchik, A.; Dolgov, S.; Feldbach, E.; Pareja, R.; Popov, A.I.; Shablonin, E.; Seeman, V. Creation and thermal annealing of structural defects in neutron-irradiated MgAl2O4 single crystals. Nucl. Instrum. Methods 2018, 435, 31–37. [Google Scholar] [CrossRef]
  46. Seeman, V.; Feldbach, E.; Karner, T.; Maaroos, A.; Mironova-Ulmane, N.; Popov, A.I.; Shablonin, E.; Vasil’chenko, E.; Lushchik, A. Fast-neutron-induced and as-grown structural defects in magnesium aluminate spinel crystals with different stoichiometry. Opt. Mater. 2019, 91, 42–49. [Google Scholar] [CrossRef]
  47. Taran, M.N.; Parisi, F.; Lenaz, D.; Vishnevskyy, A.A. Synthetic and natural chromium-bearing spinels: An optical spectroscopy study. Phys. Chem. Miner. 2014, 41, 593–602. [Google Scholar] [CrossRef]
  48. Lenaz, D.; Skogby, H.; Princivalle, F.; Hålenius, U. Structural changes and valence states in the MgCr2O4- FeCr2O4 solid solution series. Phys. Chem. Miner. 2004, 31, 633–642. [Google Scholar] [CrossRef]
  49. Hålenius, U.; Andreozzi, G.B.; Skogby, H. Structural relaxation around Cr3+ and the red-green color change in the spinel (sensu stricto)-magnesiochromite (MgAl2O4-MgCr2O4) and gahnite-zincochromite (ZnAl2O4-ZnCr2O4) solid-solution series. Am. Miner. 2010, 95, 456–462. [Google Scholar] [CrossRef]
  50. Malsy, A.K.; Karampelas, S.; Schwarz, D.; Klemm, L.; Armbruster, T.; Tuan, D.A. Orangey-red to orangey-pink gem spinels from a new deposit at Lang Chap (Tan Huong-Truc Lau), Vietnam. J. Gemmol. 2012, 33, 19–27. [Google Scholar] [CrossRef]
  51. Andreozzi, G.B.; D’Ippolito, V.; Skogby, H.; Hålenius, U.; Bosi, F. Color mechanisms in spinel: A multi-analytical investigation of natural crystals with a wide range of coloration. Phys. Chem. Min. 2018, 46, 343–360. [Google Scholar] [CrossRef]
  52. D’Ippolito, V.; Andreozzi, G.B.; Hålenius, U.; Skogby, H.; Hametner, K.; Günther, D. Color mechanisms in spinel: Cobalt and iron interplay for the blue color. Phys. Chem. Miner. 2015, 42, 431–439. [Google Scholar] [CrossRef]
  53. Gübelin, E.J.; Koivula, J.I. Gemstone Inclusions, 1st ed.; Dazhi Press: Taiwan, China, 1995; pp. 372–383. [Google Scholar]
Figure 1. Map of the global gem-grade spinel-producing areas (grey parts). The gray shaded area is the country of gem spinel origin. The red dot locates Mogok, Myanmar.
Crystals 13 00447 g001
Figure 3. (A) The 18 Mogok spinel rough samples collected and examined for this study; (B) twin crystal of B-6 orange spinel sample under 40× dark field; (C) octahedral crystal of B-14 red spinel sample under 50× reflected; (D) water-eroded-pebble shaped crystal of B-13 red spinel sample under 40× incident. The B-1, B-4 and B-9 are purple samples; B-2, B-5, B-6 are orange samples, B-3, B-7, B-8 and B-10 are pink samples, and rest of them are red (B-11 to B-18).
Crystals 13 00447 g003
Figure 4. Internal features of Mogok purple and orange spinel samples. (A) Gas–liquid inclusions and black lamellar inclusions in purple samples (B-1); (B) cloud-like healed fissures in B-1; (C) the octahedral crystal in the orange sample (B-2); (D) the black inclusion with fluid in the orange sample (B-5); (E) hexagonal plate-like inclusions in B-5; (F) joined octahedral crystals in B-2.
Crystals 13 00447 g004
Figure 5. Internal features of Mogok pink and red spinel samples. (A) The octahedral crystal in the pink sample (B-3); (B) fine microgranular inclusions in the pink sample (B-8); (C) remnants of black octahedral inclusions in the red sample (B-11); (D) disk-like fissures in the red sample (B-13).
Crystals 13 00447 g005
Figure 6. Raman spectra of mineral inclusions in spinel samples from Mogok. Raman spectra showing calcite (A,B) inclusions within the orange sample (B-5) and chondrodite (C,D) inclusions within the pink sample (B-3).
Crystals 13 00447 g006
Figure 7. FTIR spectrum obtained from Mogok spinel. The marked absorption bands are related to internal Mg-O vibrations (728 cm−1), Al-O vibrations (586 cm−1 and 542 cm−1) and vibration of oxygen ions (840 cm−1). The line colors represent the color of the spinel samples, pink, orange and purple spinel samples are in (A), red spinel samples are in (B).
Crystals 13 00447 g007
Figure 8. The representative UV–Vis–NIR spectrum of Mogok spinel is characterized mainly by Cr3+ or V3+ absorption features.
Crystals 13 00447 g008
Figure 9. The representative Raman spectrum of Mogok spinel is characterized mainly by the bending vibration of O-Mg-O (408 cm−1) and O-Al-O (767 cm−1) features.
Crystals 13 00447 g009
Figure 10. The photo of target (A) and BSE image (B) of representative Mogok spinel samples. The micro-XRF mapping images for V (C), Fe (D), Cr (E) and Ti (F).
Crystals 13 00447 g010
Figure 11. UV–Vis–NIR spectrum and peak-fitting Gaussian curve of Mogok spinel samples of red (A), orange (B), pink (C) and purple (D).
Crystals 13 00447 g011
Figure 12. Histogram (A) and 3D scatter plots of Cr–V–Fe compositions (B) of Mogok spinel.
Crystals 13 00447 g012
Figure 13. V–Cr (A), Cr+V–Fe (B), Zn–Fe, (D) diagram and histogram (C) of Zn trace element composition of Mogok spinel samples.
Crystals 13 00447 g013
Table 1. Summary of gemological properties of spinel from Mogok.
PropertiesObservation Data
ColorPurpleOrangePinkRed
DiaphaneityTransparentTransparentTransparentTranslucency
RI1.7181.7161.7161.718
Chelsea color filter
(CCF)
UnchangedUnchangedUnchangedMedium red
SG3.583.553.543.58
SpectrumFe spectrum Cr spectrumCr spectrum
Fluorescence
reaction
Inert to long-wave and short-wave UV radiationInert to long-wave and short-wave UV radiationCrystals 13 00447 i001
Moderate red to long-wave UV radiation; weak purple to short-wave UV radiation
Crystals 13 00447 i002
Strong red to long-wave UV radiation; weak red to short-wave UV radiation
Table 2. Major element composition (wt.%) of spinel samples from Mogok by EPMA.
SamplesTiO2Cr2O3MgOMnOAl2O3FeOZnOTotal
OrangeB-2-10.090.0528.700.0570.720.050.1799.97
B-2-20.000.0428.450.0470.810.070.0999.66
B-2-30.090.0028.510.0469.970.020.1299.00
B-2-40.000.0028.850.0370.440.010.0999.55
B-2-50.030.0528.860.0670.420.020.1999.71
PurpleB-1-10.010.0029.140.0269.350.430.2399.31
B-1-20.100.0028.480.0069.730.510.2099.15
B-1-30.080.0128.980.0170.240.480.25100.16
B-1-40.060.0329.270.0069.930.500.13100.00
B-1-50.040.0628.750.0169.710.500.1099.33
RedB-15-10.121.2128.160.0069.530.320.0699.44
B-15-20.171.1327.750.0369.210.320.1598.79
B-15-30.051.1428.090.0069.820.250.0899.49
B-15-40.101.0728.410.0169.650.240.0399.56
B-15-50.151.1328.290.0368.850.270.1398.95
PinkB-8-10.000.1329.080.0369.930.030.0199.56
B-8-20.070.0928.590.0069.680.040.2098.81
B-8-30.080.0828.810.0169.550.000.1398.78
B-8-40.000.0428.970.0269.290.070.2398.80
B-8-50.020.1229.490.0069.810.030.1799.71
Table 3. Trace element concentrations (ppm) of spinel samples from Mogok by LA-ICP-MS (average and range).
Red
6 Samples
Orange
6 Samples
Pink
6 Samples
Purple
6 Samples
Li6.03
(5.10–7.11)
7.00
(4.66–8.58)
15.36
(8.67–20.19)
9.69
(7.11–12.90)
Be1.81
(1.03–2.85)
2.74
(1.68–3.70)
17.11
(14.10–20.60)
2.98
(1.05–4.90)
Ti448.23
(408.21–497.00)
47.36
(45.42–50.97)
2.66
(0.26–3.85)
207.76
(193.07–250.00)
V1142.16
(1041.77–1295.00)
2099.66
(1928.52–2518.00)
473.42
(449.02–506.70)
196.16
(186.21–214.40)
Cr6508.15
(5864.25–7830.00)
17.56
(5.20–30.80)
537.06
(513.40–574.00)
110.85
(49.32–237.80)
Mn8.06
(5.83–9.60)
4.48
(2.44–6.72)
6.62
(5.34–7.64)
19.82
(17.62–22.21)
Fe2444.23
(1929.07–3080.58)
364.99
(276.40–481.52)
169.40
(135.68–192.75)
2602.75
(1364.84–3925.00)
Co1.37
(1.01–1.58)
0.15
(0.07–0.32)
0.30
(0.23–0.39)
2.42
(2.03–2.96)
Ni19.04
(15.48–23.80)
3.75
(2.74–4.62)
35.34
(30.50–43.20)
6.05
(3.35–8.51)
Zn424.95
(338.58–549.00)
456.25
(385.17–574.00)
759.90
(657.44–926.00)
1031.11
(853.19–1312.00)
Table 4. Molecular formula of Mogok spinel samples from Myanmar.
SamplesColorCrystal Chemical Formula
B-2-1OrangeMg (Al1.976Mg0.015Ti0.003Zn0.003Mn0.001Fe0.001Cr0.001)2O4
B-2-2OrangeMg (Al1.986Zn0.002Mn0.001Cr0.001Fe0.001Mg0.001)2O4
B-2-3OrangeMg (Al1.976Mg0.018Ti0.003Zn0.002Mn0.001)2O4
B-2-4OrangeMg (Al1.975 Mg0.023Zn0.002Mn0.001)2O4
B-2-5OrangeMg (Al1.971Mg0.022Zn0.003Mn0.001Ti0.001Cr0.001)2O4
Average Mg (Al1.977Mg0.017Zn0.002Fe0.001Ti0.001Cr0.001 Mn0.001)2O4
B-1-1PurpleMg (Al1.950Mg0.037Fe0.009Zn0.004)2O4
B-1-2PurpleMg (Al1.966Mg0.016Fe0.010Zn0.004Ti0.004)2O4
B-1-3PurpleMg (Al1.960Mg0.023Fe0.010Zn0.004Ti0.003)2O4
B-1-4PurpleMg (Al1.952Mg0.033Fe0.010Zn0.002Ti0.002)2O4
B-1-5PurpleMg (Al1.962Mg0.024Fe0.010Zn0.002Ti0.002Cr0.001)2O4
Average Mg (Al1.958Mg0.027Fe0.010Zn0.003Ti0.002)2O4
B-15-1RedMg (Al1.961Cr0.023Fe0.006Mg0.005Ti0.004 Zn0.001)2O4
B-15-2Red(Mg0.997Fe0.003)1 (Al1.966Cr0.021Ti0.006 Fe0.003Zn0.003Mn0.001)2O4
B-15-3RedMg (Al1.968Cr0.021Fe0.005Mg0.002Ti0.002 Zn0.001)2O4
B-15-4RedMg (Al1.960Cr0.020Mg0.011Fe0.005Zn0.001Ti0.003)2O4
B-15-5RedMg (Al1.951Cr0.021Mg0.014Fe0.005Ti0.005 Zn0.002Mn0.001)2O4
Average Mg (Al1.961Cr0.021Mg0.006Fe0.006Ti0.004Zn0.002)2O4
B-8-1PinkMg (Al1.963Mg0.033Cr0.002 Fe0.001Mn0.001)2O4
B-8-2PinkMg (Al1.969Mg0.022Zn0.004Cr0.002Ti0.002 Fe0.001)2O4
B-8-3PinkMg (Al1.964 Mg0.029Ti0.003 Zn0.002Cr0.001)2O4
B-8-4PinkMg (Al1.958Mg 0.035Zn0.004Fe0.001Cr0.001)2O4
B-8-5PinkMg (Al1.951Mg0.043Zn0.003Cr0.002 Fe0.001Ti0.001)2O4
Average Mg (Al1.961Mg0.032Zn0.003Cr0.002Fe0.001Ti0.001)2O4
Disclaimer/Publisher’s Note: The statements, opinions and data contained in all publications are solely those of the individual author(s) and contributor(s) and not of MDPI and/or the editor(s). MDPI and/or the editor(s) disclaim responsibility for any injury to people or property resulting from any ideas, methods, instructions or products referred to in the content.

