Article

Investigating the Electrochemical Properties of a Semiconductor Heterostructure Composite Based on WO3-CaFe2O4 Particles Planted on Porous Ni-Foam for Fuel Cell Applications

1
Department of Electronic and Engineering, Nanjing Vocational Institute of Mechatronic Technology, Nanjing 211135, China
2
School of Electronic and Engineering, Nanjing Xiaozhuang University, Nanjing 211171, China
3
Department of Physics, College of Sciences, Princess Nourah bint Abdulrahman University, P.O. Box 84428, Riyadh 11671, Saudi Arabia
4
Jiangsu Provincial Key Laboratory of Solar Energy Science and Technology/Energy Storage Joint Research Centre, School of Energy and Environment, Southeast University, No. 2 Si Pai Lou, Nanjing 210096, China
*
Author to whom correspondence should be addressed.
These authors contributed equally to this work.
Crystals 2023, 13(3), 444; https://doi.org/10.3390/cryst13030444
Submission received: 7 October 2022 / Revised: 31 January 2023 / Accepted: 21 February 2023 / Published: 4 March 2023

Abstract

:
There is tremendous potential for both small- and large-scale applications of low-temperature operational ceramic fuel cells (LT-CFCs), which operate between 350 °C and 550 °C. Unfortunately, the low operating temperature of CFCs was hampered by inadequate oxygen reduction electrocatalysts. In this work, the electrochemical characteristics of a semiconductor heterostructure composite based on WO3-CaFe2O4 deposited over porous Ni-foam are investigated. At low working temperatures of 450–500 °C, the developed WO3-CaFe2O4 pasted on porous Ni–foam heterostructure composite cathode exhibits very low area-specific resistance (0.78 Ω cm2) and high oxygen reduction reaction (ORR) activity. For button-sized SOFCs with H2 and atmospheric air fuels, we have demonstrated high-power densities of 508 mW cm−2 running at 550 °C, and even potential operation at 450 °C, using WO3-CaFe2O4 seeded on porous Ni-foam cathode. Moreover, WO3-CaFe2O4 composite heterostructure with Ni foam paste exhibits very low activation energy compared to both WO3 and CaFe2O4 alone, which supports ORR activity. To comprehend the enhanced ORR electrocatalytic activity of WO3-CaFe2O4 pasted on porous Ni-foam heterostructure composite, several spectroscopic tests including X-ray diffraction (XRD), photoelectron spectroscopy (XPS), and electrochemical impedance spectroscopy (EIS) were used. The findings may also aid in the creation of useful cobalt-free electrocatalysts for LT-SOFCs.

1. Introduction

A significant overhaul of the energy system is necessary to minimize or eliminate dependency on fossil fuels in order to address the global energy problem and pollution. With vast capacities that are many times more than the world’s energy consumption, renewable energy sources like solar, tidal, and wind are progressively making their way into the mainstream [1,2]. Unfortunately, these energy sources’ integration with electrical infrastructure is hampered by their inherent discontinuity and intermittency. In order to efficiently produce electricity from fuel to meet complicated and variable demands in complex application scenarios, ceramic fuel cells have the potential to overcome these barriers [3,4]. Ceramic fuel cells, such as SOFCs and PCFCs, require efficient oxygen reduction reaction (ORR) electrocatalysts since slow ORR kinetics reduce their efficiency [5,6]. At low working temperatures, the efficiency of SOFCs is particularly severely harmed. High working temperatures (700–1000 °C) have a number of disadvantages that make technology more complicated and restrict its use [7,8]. To push SOFCs toward commercialization, it is, therefore, crucial to lower the working temperature to a range of 300 to 600 °C [9]. On the other hand, the current PCFC cathode needs a high temperature to generate enough ORR activity. As a result, much effort has been put into creating sophisticated PCFC cathode materials that operate at LTs [10]. Yet there is still a significant obstacle.
In order to increase ORR activity, adequate A and B-site cation doping has typically been added to perovskite-oxides. This induces mixed ionic-electronic (MIE) conduction. The most cutting-edge cathodes for SOFCs have so far been produced using perovskite materials such as CF-LBZY (LaBaCo0.2Fe0.2Zr0.3Y0.3O3) and BaCo0.4Fe0.4Zr0.1Y0.1O3− (La0.6Sr0.4Co0.8Fe0.2O3−; LSCF), Pr0.8Ba0.2CoO3, Ba1−xSrxCo1−yFeYO3 (BSCF), BaCoxFe1 Furthermore recently reported with outstanding electrical and electrochemical performance are perovskite and composite materials based on titanate [11,12,13]. Although the majority of modern SOFC cathodes have higher Co concentrations, their structural stability is problematic due to their high TECs (thermal expansion coefficients [14]. As a result, Co-free cathodes have received a lot of interest over the past ten years, and because Fe-based materials have higher structural stability, they have also received a lot of attention as alternatives [15,16].
In this study, in addition to the traditional doping method, we created WO3-CaFe2O4 using a heterostructure composite made of two semiconductors, including WO3 and the CaFe2O4 spinel structure. WO3-CaFe2O4 particles were afterwards placed on porous Ni-foam, and their performance as ORR electrocatalysts in the LT-SOFC cathode was examined. While operating below 550 °C, the synthesized WO3-CaFe2O4-grown heterostructure composite exhibits outstanding ORR activity and power production. To comprehend the enhanced electrocatalytic activity of the WO3-CaFe2O4 planted Ni-foam heterostructure composite, various spectroscopic characterization was used. WO3-CaFe2O4 and lattice strain interact to create complicated oxidation (W6+/5+ and Fe3+/2+ ions), which results in very disordered structures with a variety of enhanced characteristics. Nonetheless, this research would help progress the development of advanced ORR qualities and some important heterostructure composites based on WO3-CaFe2O4 structural features for the ORR process.

2. Materials and Methods

2.1. Synthesis Procedures

By employing citric acid and ethylenediaminetetraacetic acid (EDTA) as complexing agents, CaFe2O4 residues were produced using the sol-gel method. The first stage involved dissolving 0.1 moles of EDTA in deionized water. Then, NH3 was added to get the pH up to 7.0 and make the solution clear. The solution was then added with the appropriate amounts of Ca(NO3)2.6H2O and Fe (NO3)2.9H2O (99.98%, Alfa Aesar). After that, the solution was constantly agitated for 6 h at 80 °C and 240 rpm, resulting in the formation of a CaFe2O4 brownish gel. The resultant brownish gel was then baked at 150 °C to dry it out. The dry gel was then crushed and calcined in the air for 8 h at 1050 °C. To create 3WO3-7CaFe2O4 heterostructure composites, CaFe2O4 and commercially pure WO3 (MAKLIN) powders were synthesized. More specifically, WO3 particles were dissolved in C2H5OH at a 1:5 molar ratio. The above-mentioned procedure was used to create a separate solution of CaFe2O4, which was then mixed with WO3-C2H5OH solutions with mass concentrations of 3:7 (WO3-CaFe2O4) while being continuously stirred (240 rpm) and heated to 80 °C. Moreover, a 1:2 metal-to-cation molar ratio of citric acid was added to the combined solution and agitated until a brownish gel was produced. The gel was then dried at 150 °C for 8 h and calcined at 1050 °C for 10 h as the next stage.

2.2. Characterizations Tools & Electrochemical Measurements

As compared to individual WO3 and CaFe2O4, the X-ray diffraction pattern of the WO3-CaFe2O4 heterostructure composite was measured using a Bruker D8 with Cu-K radiation (=1.5418). Scanning electron microscopy was carried out using Merlin compacts from Zeiss (SEM). X-ray photoelectron spectroscopy (Physical Electronics Quantum 2000) with an Al K X-ray source at room temperature in an ultra-high vacuum was used to analyze the surface of the WO3-CaFe2O4 heterostructure composite (UHV). Peak 41 was used for the XPS analysis. Electrochemical impedance spectroscopy (EIS) was measured using a Gamry Reference 3000, USA workstation with an open-circuit voltage (OCV) of 10 mV and a 10 mV dc signal spanning the frequency range of 0.1 to 106 Hz. ZSIMPWIN software was used to analyze the recorded data in order to provide EIS data. The four-probe approach was used to measure dc conductivity with a Keithley 2400 source meter.

2.3. Complete Fabrication of Fuel Cells

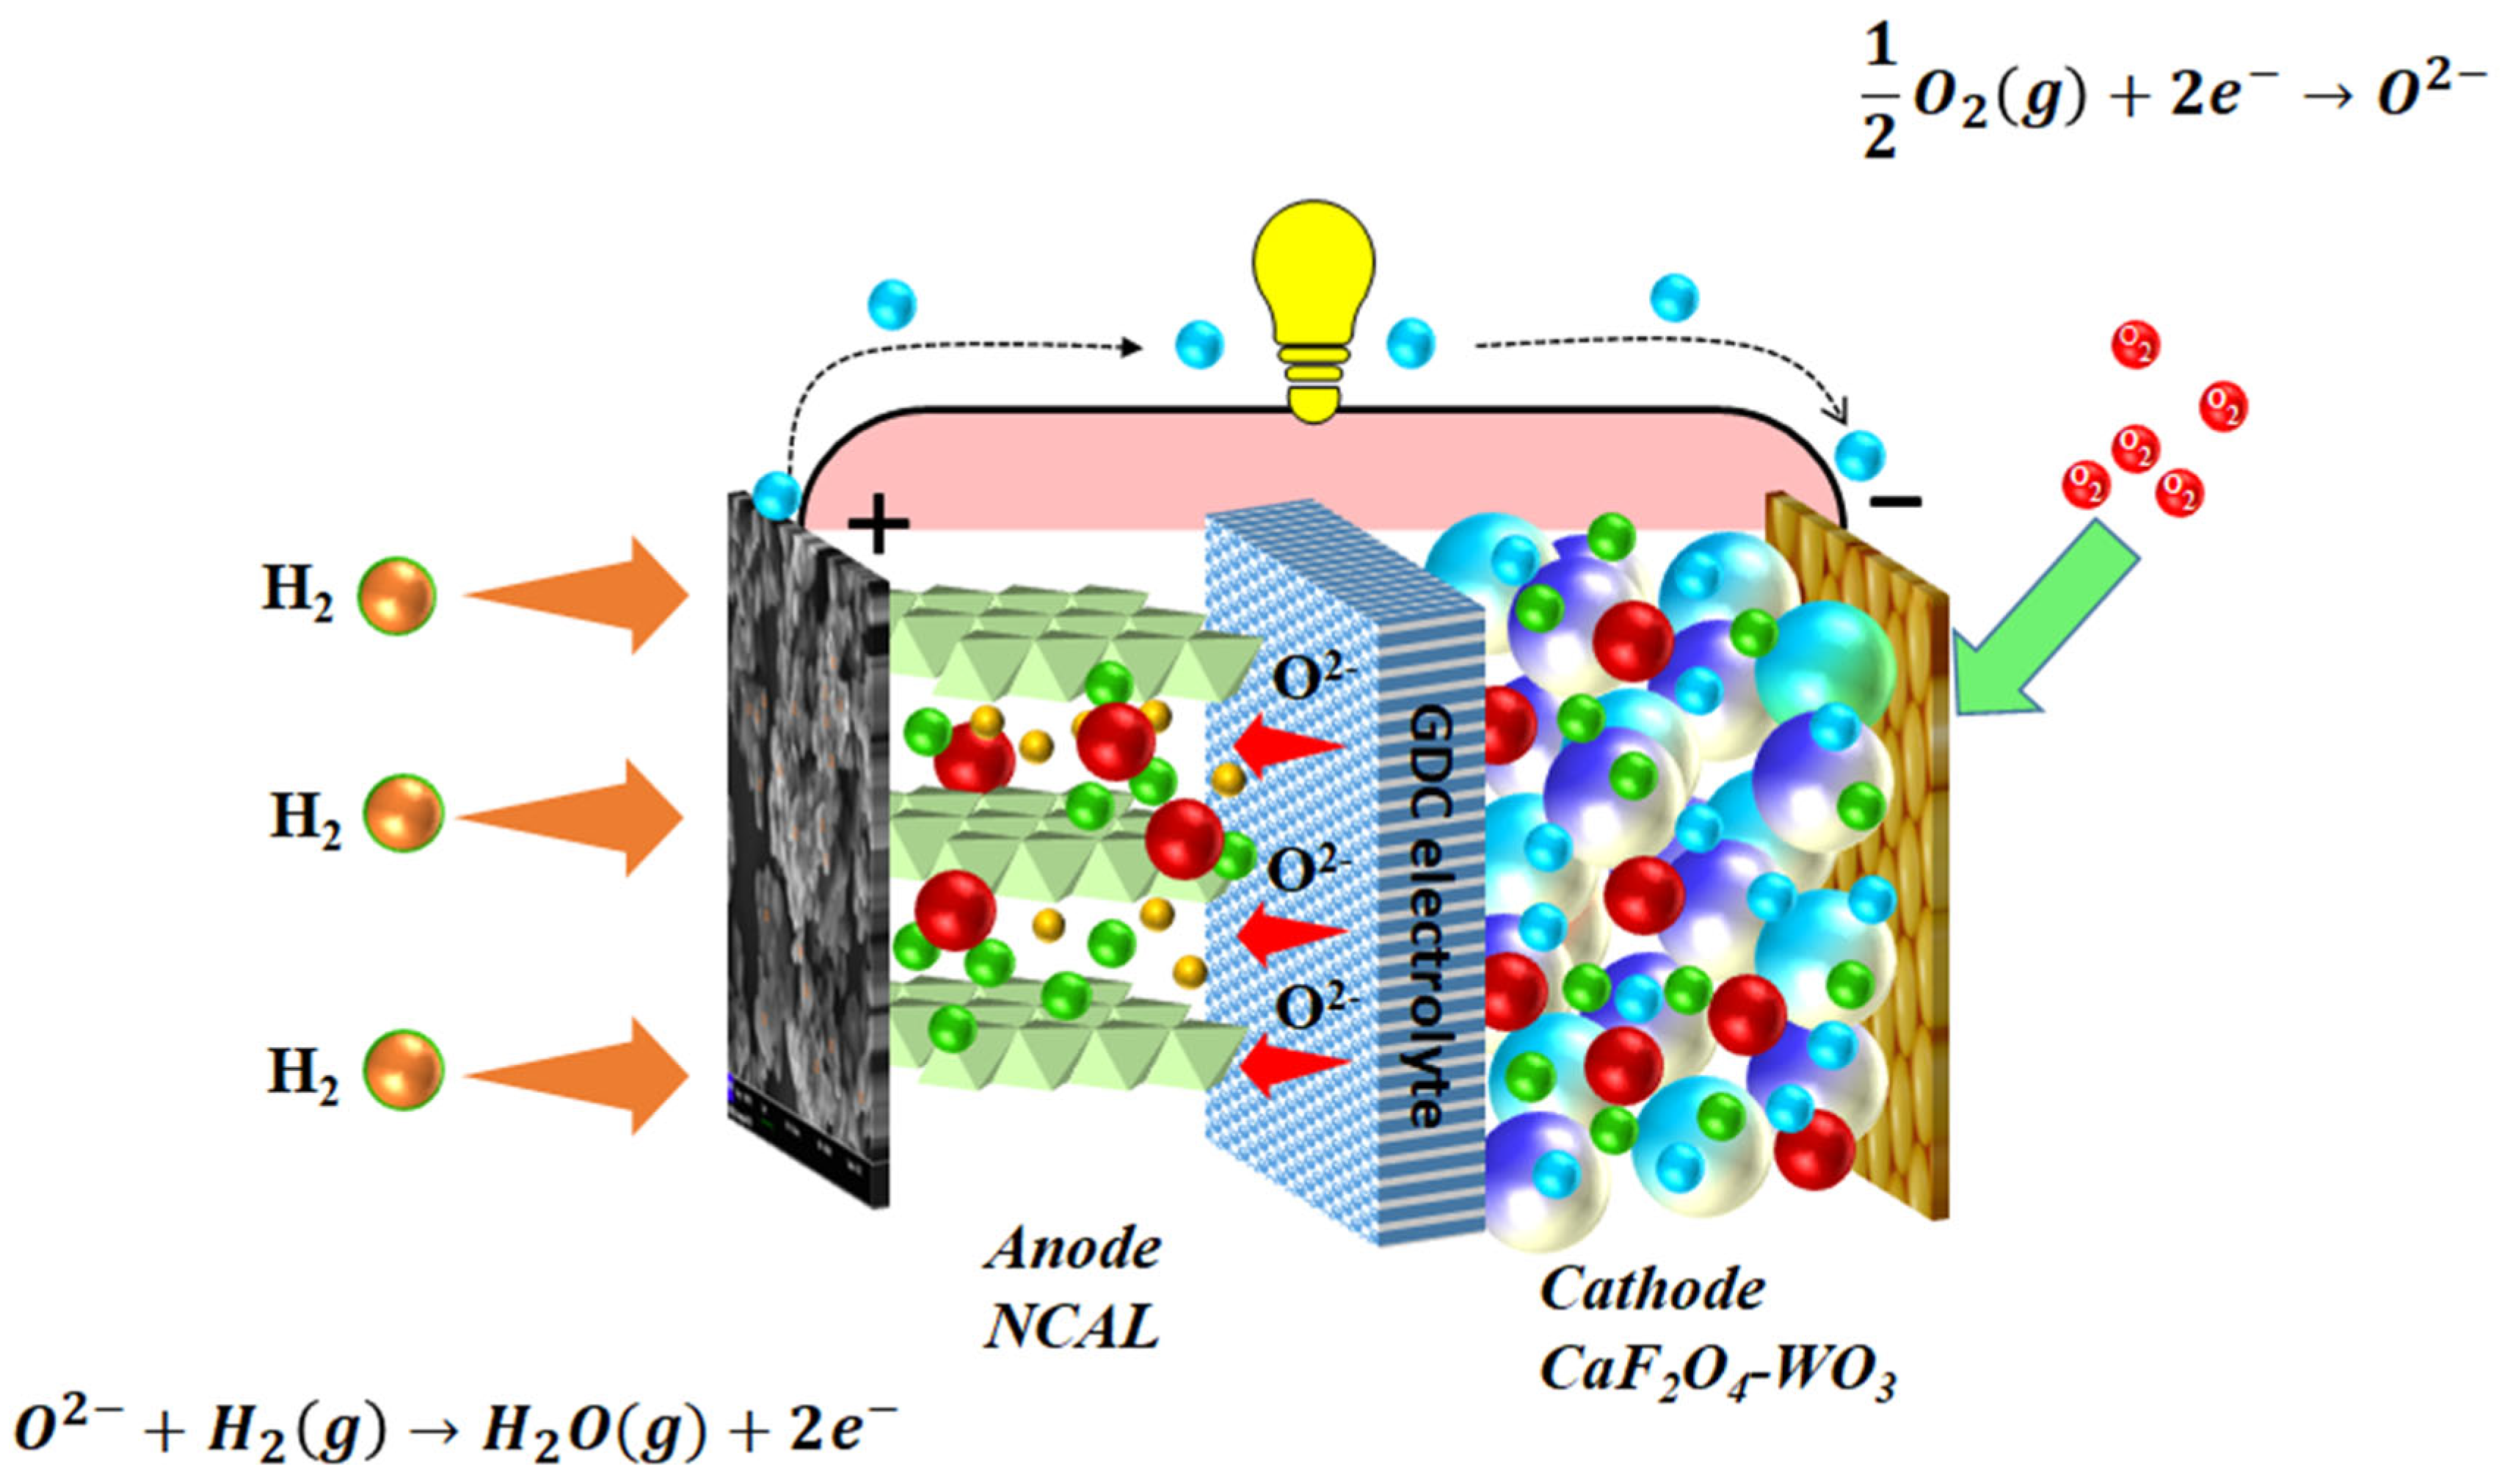
Dry pressed fuel cells were used to investigate the potential of a WO3-CaFe2O4 heterostructure composite as an air electrode in PCFC. We employed a Ni0.8Co0.15Al0.05LiO2- (NCAL from Bamo Sci. & Tech. Joint Stock Ltd., No. 8, Tianjin, 300384, China.) powder as the fuel electrode and a CaFe2O4/WO3-CaFe2O4 heterostructure composite air electrode (anode). CaFe2O4 and WO3-CaFe2O4 slurry was made by adding terpinol and brushing it onto porous Ni-foam. Then, one piece was inserted in a steel mold followed by Gd0.1Ce0.9O2- electrolyte powders (0.20 g) and NCAL-Ni-foam powders, and then pressed at 220 MPa to generate three-layer devices. The same method was used to make both types of fuel cells. After the fuel cells were assembled, they were heated in Ar at 800 degrees Celsius for four hours to create a thick electrolyte layer (relative density of 90%) that would prevent gas from escaping. Also, a symmetrical cell was constructed for ORR activity measurements, which included Ni-foam heterostructure composite electrodes planted with CaFe2O4 and WO3-CaFe2O4 on top of the GDC electrolyte. With all the devices combined, the active area was 0.64 cm2. Using hydrogen fuel humidified with 3% H2O and ambient air as oxidants, the single-cell fuel cell’s performance was shown. The H2/air drift rates were adjusted to be between 100 and 120 mL/min.

3. Results

3.1. Structure & Composition Analysis

Figure 1a reveals the XRD pattern of WO3 in the range of 2θ starting from 20° and ending on 60°. The attained peaks of the WO3 diffraction pattern are traced at 22.8, 23, 24, 26, 28, 33, 33.5, 34.5, 41, 50.5, 56, corresponding to (002) (020), (200), (120), (112), (202), (022), (220), (222), (232) and (114) planes. The obtained pattern is designated as a triclinic crystal structure, with space group Pi (C~), and lattice of a = 7.309, b = 7.522, c = 7.678, α = 88.81, β = 3 90.92, γ = 90.93 [17]. Moreover, Figure 1c shows the diffraction pattern of CaFe2O4. The foremost diffraction peaks of CaFe2O4 are detected at the position of 2θ with different values of 25.5, 31, 33, 36, 19 41, 46, 49, 55, 60, and 61°, which can be indexed to the (220), (311), (320), (222), (400), (511), 20 (421), (600), (533) and (440) planes of orthorhombic structure (Pnma 21 and lattice parameters a = 9.230 Å, b = 3.024 Å and c = 10.705) with JCPDS # 32–0168 [18]. Also, as demonstrated in Figure 1b,d, respectively, Rietveld-refinement of XRD data using ProofSuit software for measured XRD data for the individual WO3 and CaFe2O4 show a strong fit to the experimental data. As seen in Figure 1e, the WO3-CaFe2O4 heterostructure composite’s crystal structure exhibits diffraction peaks made up of the WO3 and CaFe2O4 phases. This finding shows that the WO3 and CaFe2O4 phases coexist in the composite WO3-CaFe2O4 heterostructure. The absence of additional peaks in the patterns rules out the notion that WO3 and CaFe2O4 chemically reacting to generate new phases would stabilize the structure.
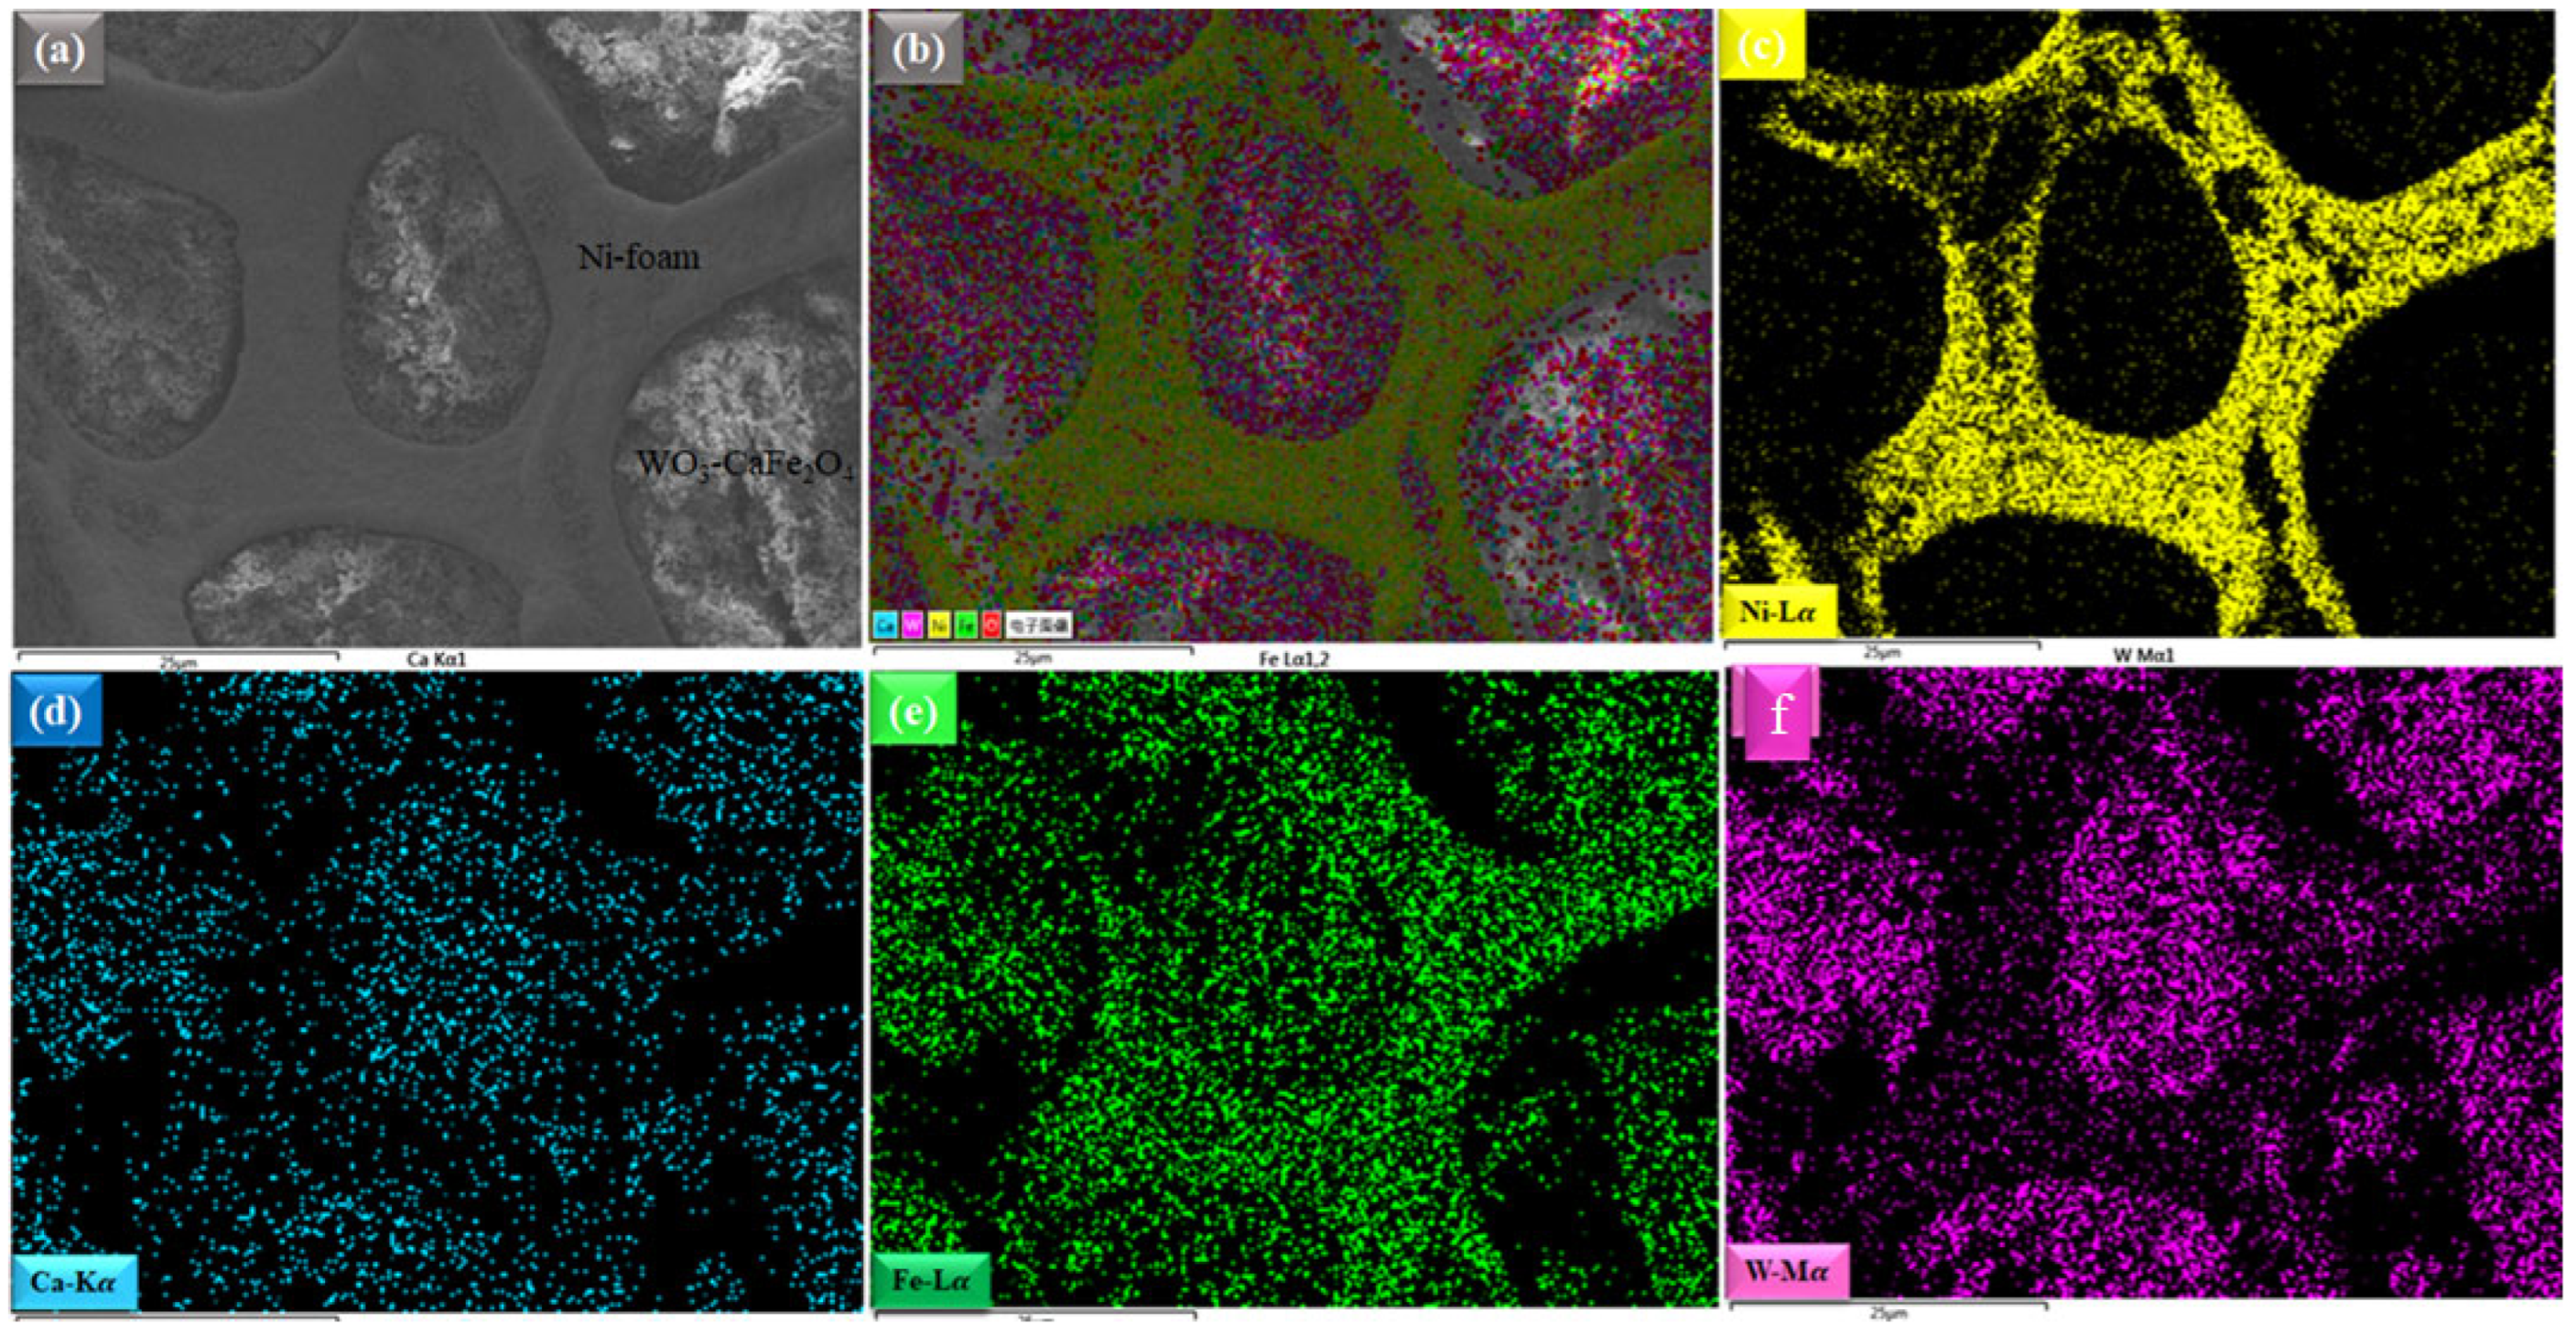
Microscopic SEM images of CaFe2O4, WO3, and the composite WO3-CaFe2O4 heterostructure are shown in Figure 2a–f, respectively. The WO3-CaFe2O4 heterostructure’s SEM picture shows particles from each composition, including WO3 and CaFe2O4. Yet, the heterostructure composite of WO3 and CaFe2O4 exhibits sophisticated and fine particles. Moreover, particles are coherently coupled to one another and form a network that might facilitate simple and rapid charge transit. The SEM picture of WO3-CaFe2O4 particles deposited on porous Ni-foam is shown in Figure 3a.
WO3-CaFe2O4 and Ni-foam, in contrast, display the combination of EDS elements mapped in Figure 3b. Energy dispersive spectroscopy (EDS) was utilized to disclose the chemical distribution of the WO3-CaFe2O4 generated on Ni-foam with mixed hues, allowing the identification of the homogenous chemical concentration of each element such as W, Ca, Fe, Ni, and O. Also, the mapping of the chemical distribution of each individual component of Ni from Ni-foam, W, Ca, and Fe is presented in Figure 3c–f, which could aid in estimating the chemical distribution [19,20].

3.2. Electrochemical Impedance and Electrical Conductivity

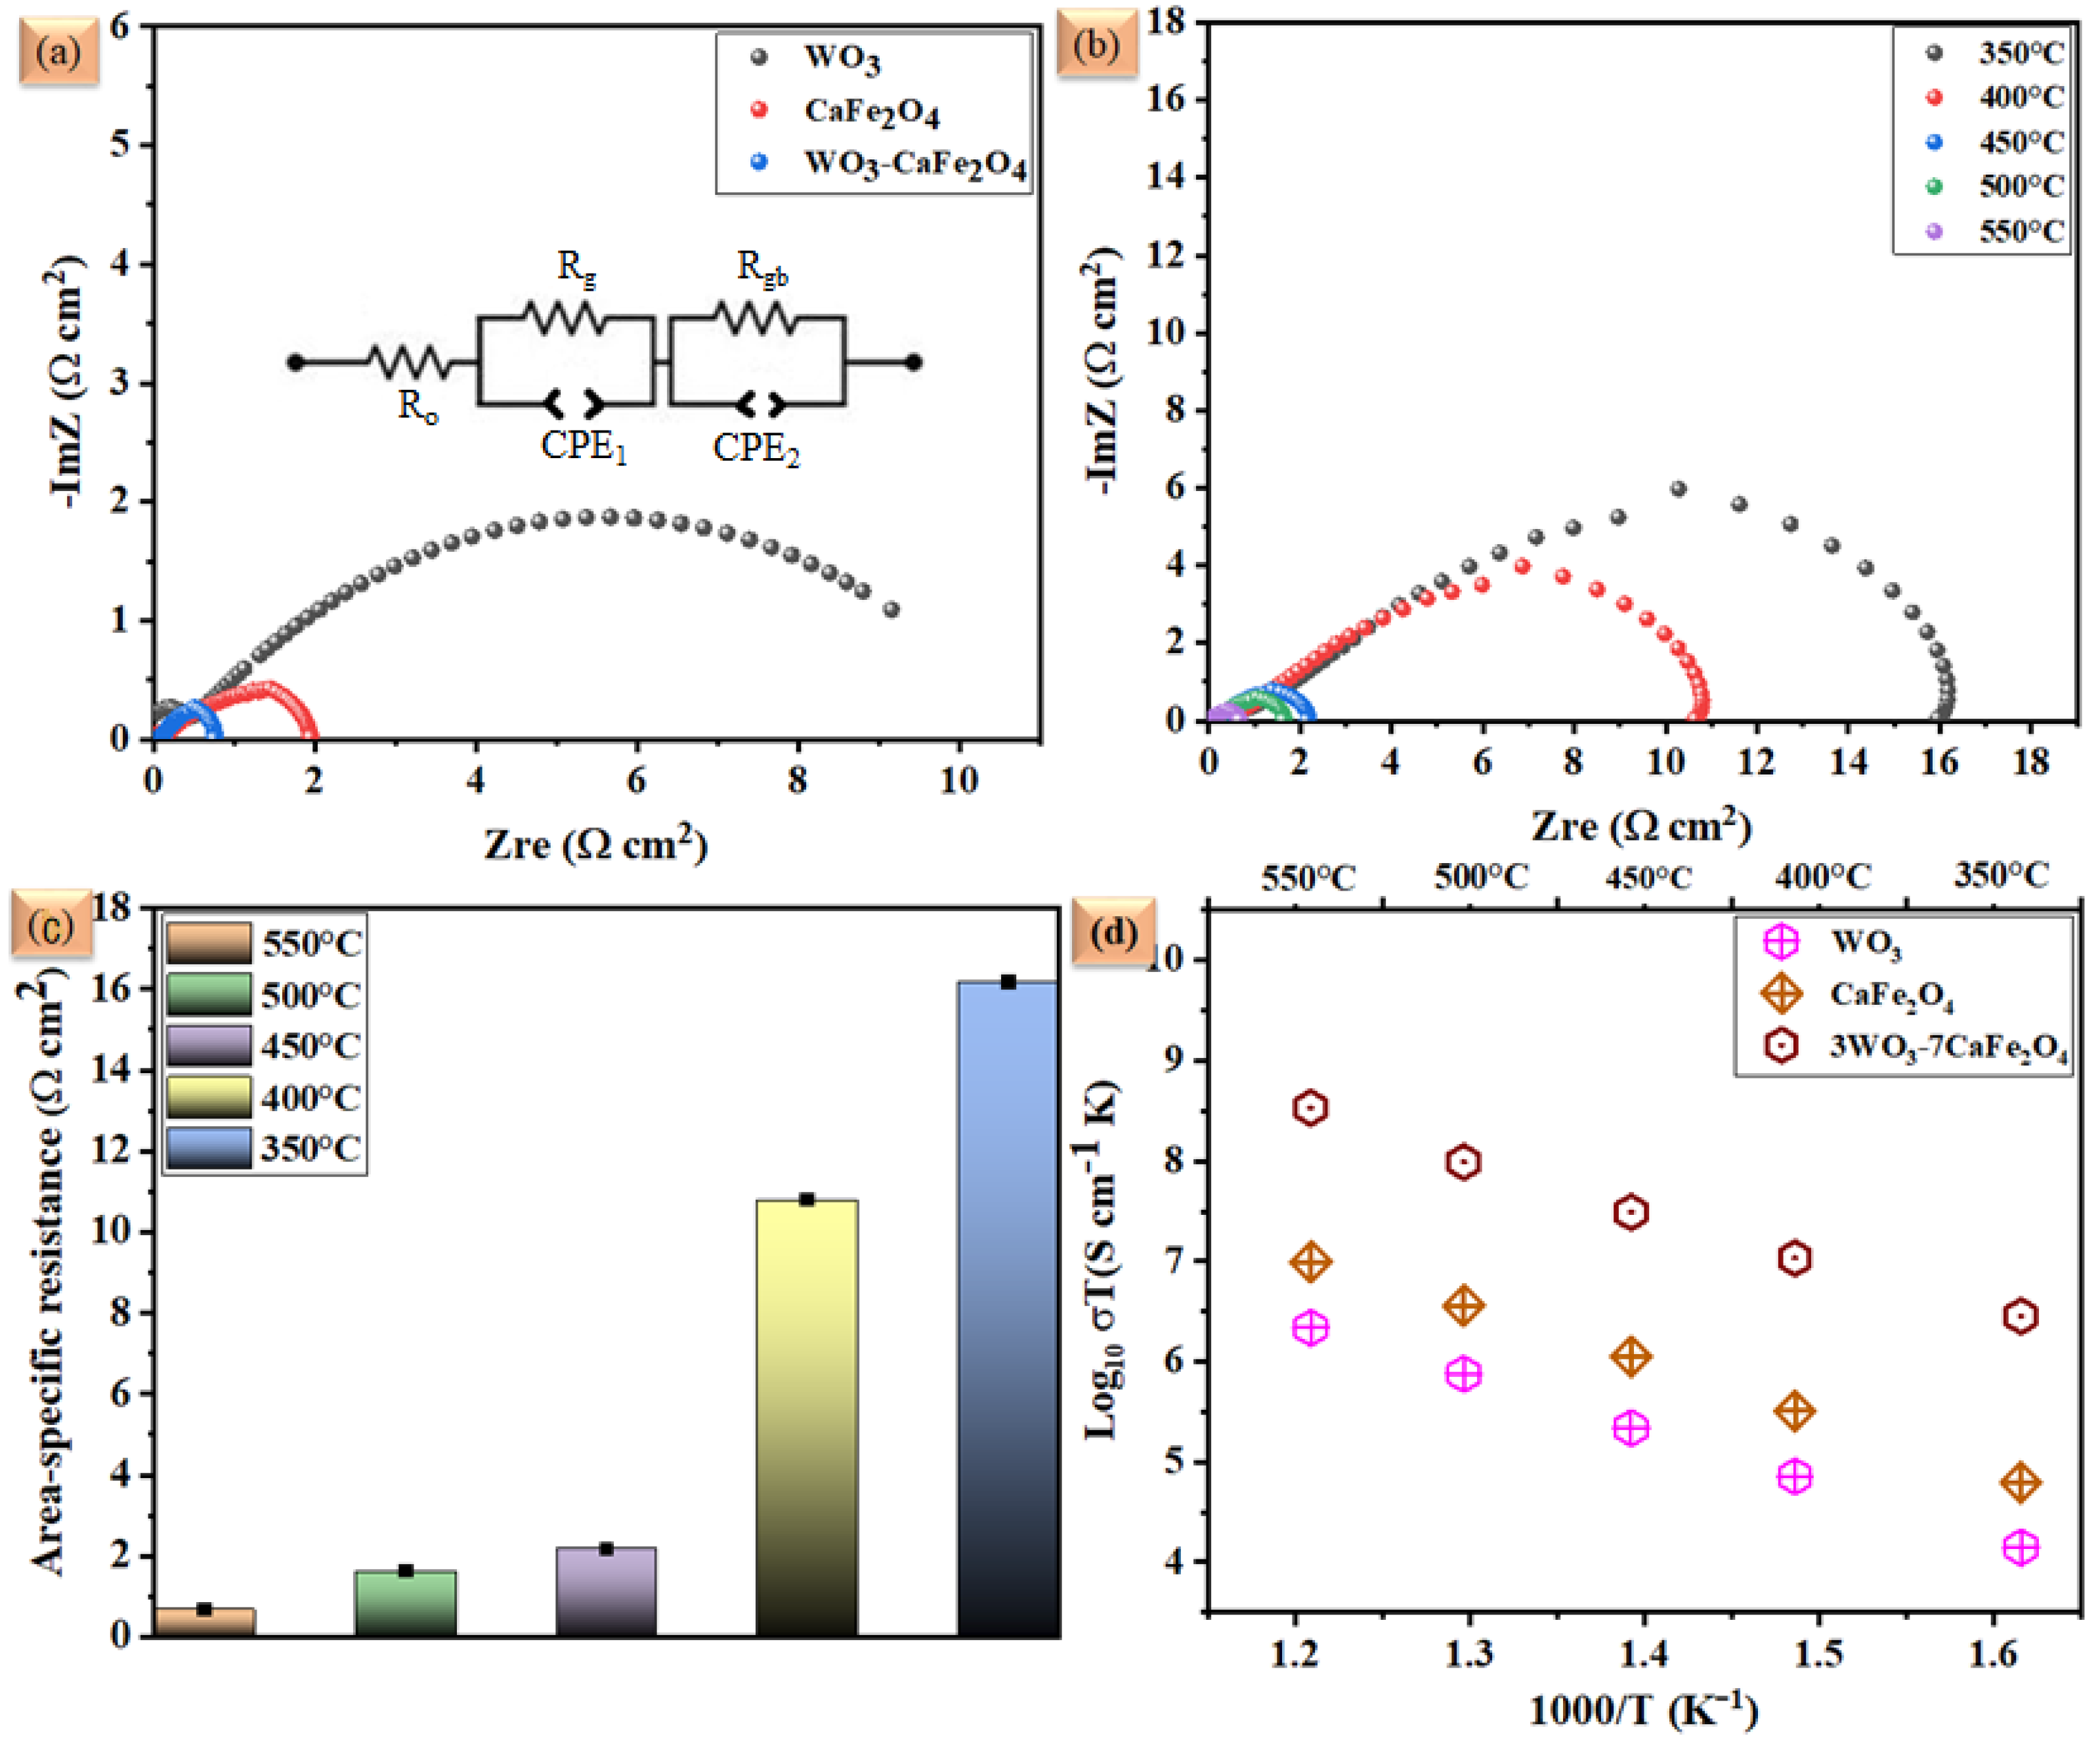
The largest portion of the SOFCs’ total impedance spectra is contributed by cathodic polarization. As a result, it’s important to comprehend, identify, and slow down the ORR activity’s rate-determining phase and cathodic polarization process. Electrochemical impedance spectroscopy (EIS) characterization was done in order to compare the ORR characteristics of various WO3-CaFe2O4 heterostructure composites to CaFe2O4 and WO3. The results are given in Figure 4a. Under OCV (Voc) circumstances, the EIS was measured in symmetrical cells in the air at 450–550 °C. Using EIS data, the Nyquist plots of heterostructure composite cells made of CaFe2O4 and WO3-CaFe2O4 were compared. When compared to cells utilizing CaFe2O4 cathodes, the model circuit Ro-(Rg-CPE1) -(Rgb-CPE2) that fits EIS results reveals very low grain R g and grain boundary (Rgb) for WO3-CaFe2O4 heterostructure composite cathode [21,22,23]. The fitted data identify two dominant polarization losses at LF (low frequencies) and HF (high frequencies) as indicated by the ASR [24,25,26]. Since ORR is a multi-step process, it includes steps like surface adsorption/gas diffusion and separation of O2 from the air, as well as diffusion of Oad, conversion of absorbed O2 to O2 in step three, and transportation of O2 to the cathode/electrolyte interface in step four. These processes may be carried out sequentially or in parallel [27,28]. Low ASR in CaFe2O4-WO3 heterostructure composite cathodes, however, might be caused by these steps being combined in parallel. The large grain boundary in single-phase cathode materials is a major factor in the ORR process’s slowing down. For WO3-CaFe2O4 heterostructure composites, very low grain resistance (Rg) of 0.06 is trailed, whereas the resistance refers to grain boundary resistance (R gb), which is 0.28 cm2. However, for WO3-CaFe2O4 heterostructure composites, a total ASR of 0.34 cm2 was attained. At low temperatures of interest for applications, oxygen vacancies are frequently virtually studied in simply doped oxide materials [29,30,31]. While the WO3-CaFe2O4 heterostructure approach can be used to improve TPBs and ORR activity for creating the cathode for SOFCs. Additionally, electrochemical impedance analysis shows that in the WO3-CaFe2O4 heterostructure composite, the surface exchange process of oxygen predominates over the bulk diffusion process of oxygen. Figure 4c compares the ASR in a composite cathode made of 3WO3 and 7CaFe2O4 at various operating temperatures. The total conductivity was also calculated using the dc four-probe method, as shown in Figure 4d, where the highest total conductivity was found to be 8.58 S/cm for WO3-CaFe2O4.

3.3. Electrochemical Performance Measurements

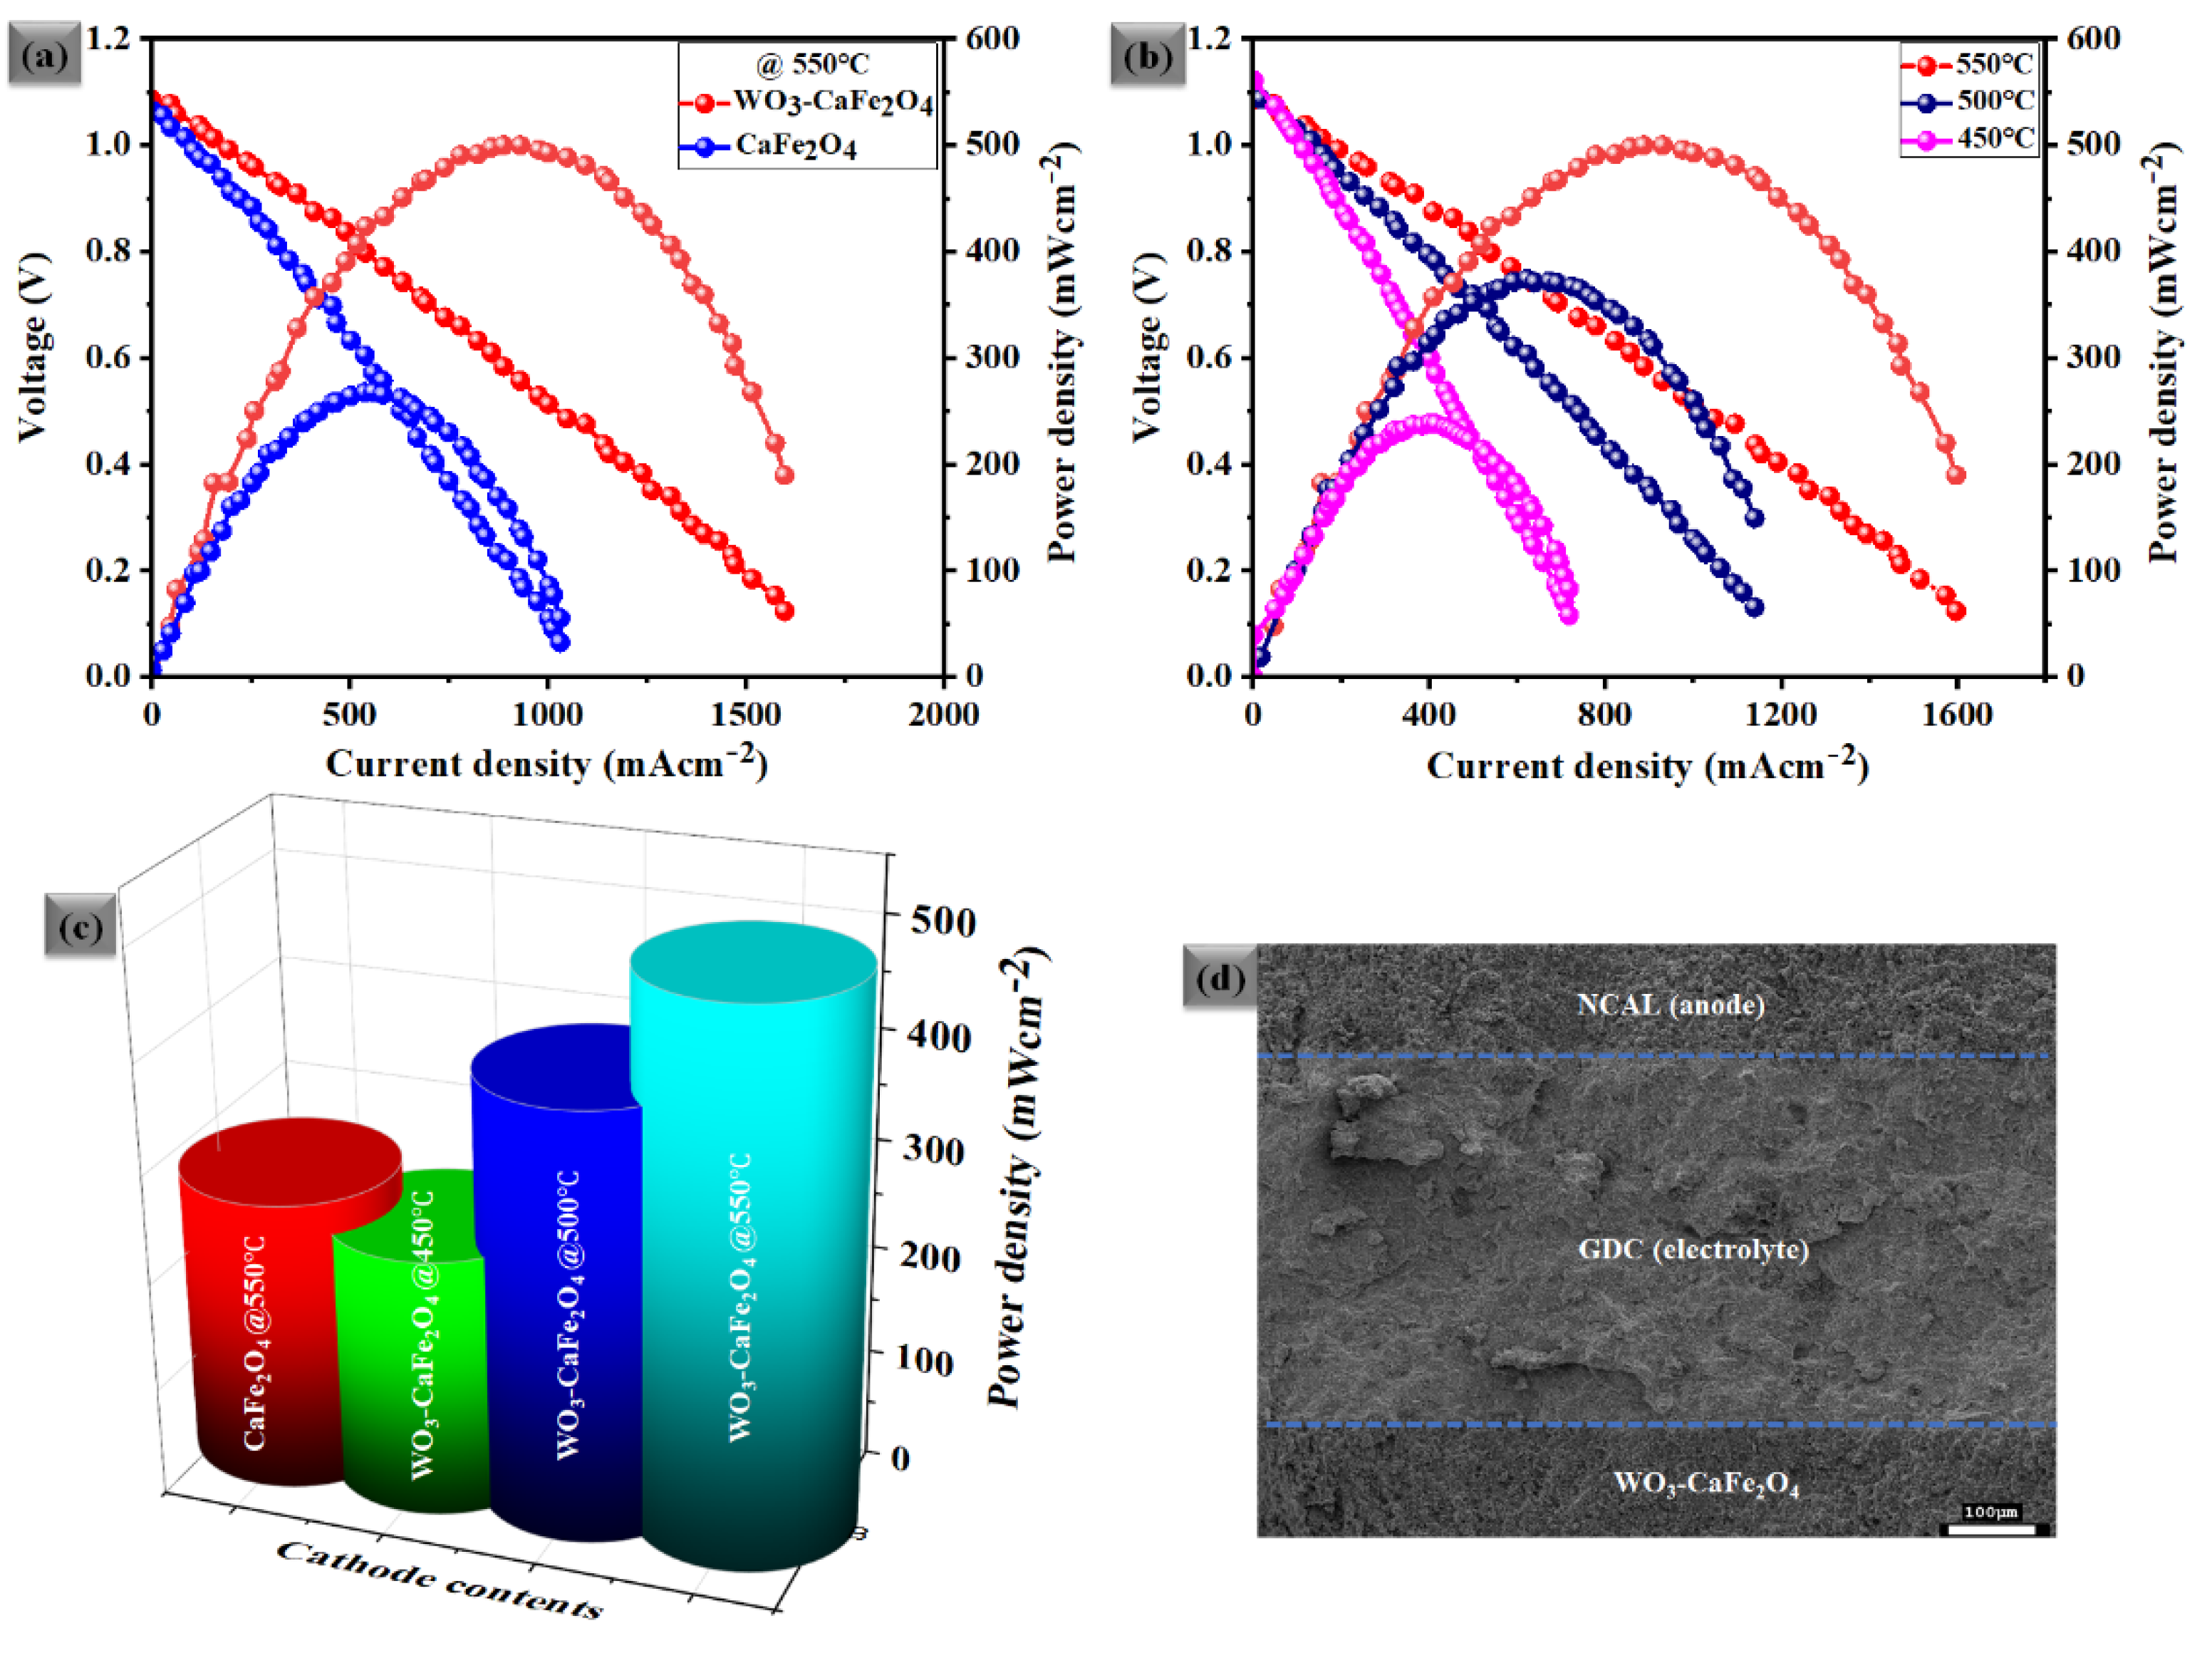
The produced CaFe2O4 and WO3-CaFe2O4 heterostructure composite air electrode’s electrochemical performance was demonstrated in SOFC at 450–550 °C over GDC electrolyte. A typical current (I)-voltage (V) and I-P characteristics curve of manufactured fuel cells is shown in Figure 5a,b. As compared to individual CaFe2O4 cathodes at 550 °C, the WO3-CaFe2O4 heterostructure composite cathode has an OCV of 1.08 V and a maximum power density (Pmax) of 508 mW cm−2. Additionally, as shown in Figure 5b, the WO3-CaFe2O4 heterostructure composite cathode performs admirably at low working temperatures, such as at 500 °C and 450 °C, where the peak power densities of 371 and 238 mW cm−2 were attained. Figure 5c compares the electrochemical performance of heterostructures made of CaFe2O4 and WO3-CaFe2O4 in comparison. The superior electrochemical performance of the composite WO3-CaFe2O4 over individual CaFe2O4 samples points to the presence of interfaces. By promoting reduced barrier O2− transport and its migratory energy, it is crucial for enhancing ORR electrocatalytic activity [16,32]. When highly oxidant WO3 ions are introduced into the CaFe2O4 lattice, the strong oxidant W5+/6+ and the highly electronegative Fe3+/2+ would enhance the capability of capturing valence electrons to improve the electrical conductivity as well. The catalytic process at the cathode surface is a multi-step process. Additionally, cross-sectional SEM of the fuel cell using a WO3-CaFe2O4 heterostructure composite cathode is carried out on each layer in the cell components following fuel cell testing, as shown in Figure 5d, allowing a specific chemical composition to be seen throughout the cell.

3.4. Spectroscopic Analysis

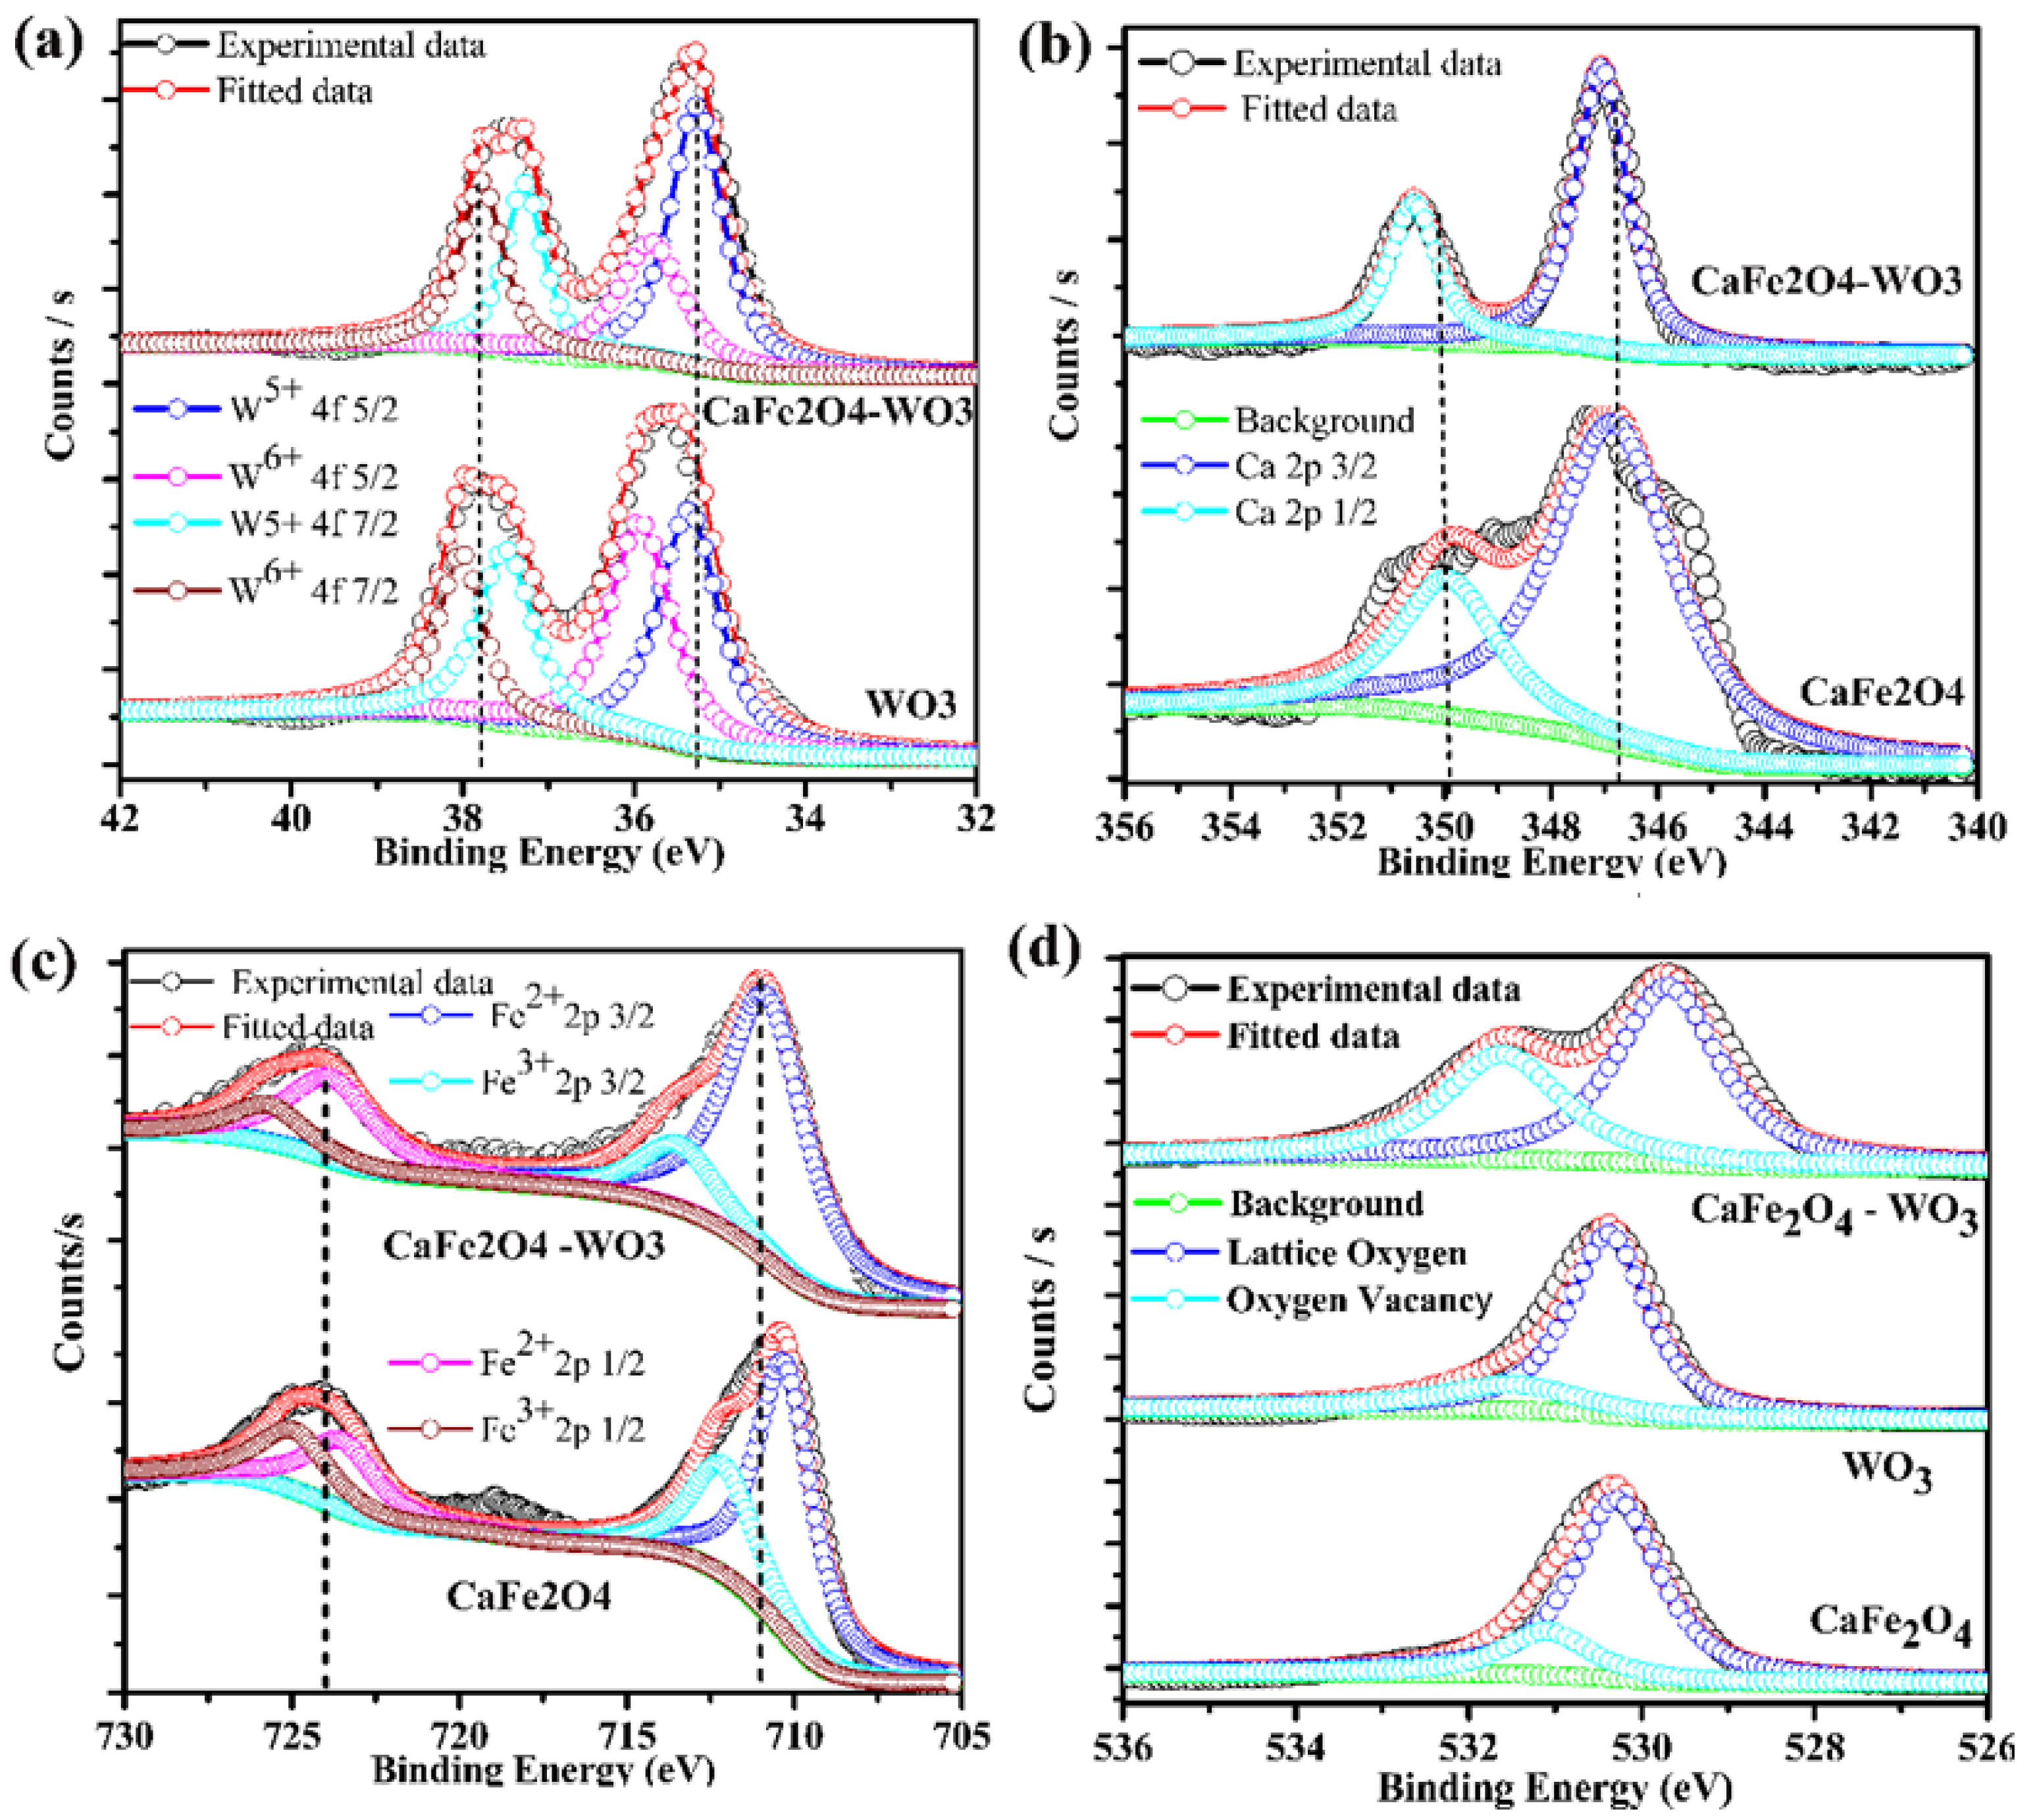
The XPS spectra of each element in the WO3, CaFe2O4, and WO3-CaFe2O4 heterostructure composite are shown in Figure 6a–d, respectively. Our main goal was to investigate the impact of the W-4f, Ca-2p, Fe 2p, and O 1s spectra on the electrochemical characteristics (Figure 6a–d). Therefore, the charge transport and ORR characteristics of the WO3-CaFe2O4 heterostructure composite could be dominated by the oxidation states of W-4f and Fe-2p, as shown in Figure 6b, c, respectively, the differences in peak locations of the W-4f and Fe-2p spectra in the WO3, CaFe2O4, and WO3-CaFe2O4 heterostructure composite. The WO3 XPS peaks for W-4f fit to W6+ 4f (5/2, 7/2) and W5+ 4f (5/2, 7/2), which appear at 35.32/37.52 and 35.7/38.05 eV and 35.12/37.22 and 35.9/37.85 eV, respectively, in WO3-CaFe2O4 heterostructure composite, respectively [17]. When compared to the WO3-CaFe2O4 heterostructure composite, the XPS peaks of Fe-2p occurred at 710.25/723.73 and 711.58/724.93 ± 0.02 eV [18], demonstrating a binding energy upshift of 0.5 to 0.6 eV. The XPS peaks of Fe-2p can be fitted to Fe3+-2p (3/2, 1/2), and Fe2+-2p (3/2, 1/2) peaks in CaFe2O4 While downshifting in the B.E of W6+ 4f (5/2, 7/2) and W5+ 4f (5/2, 7/2) in WO3-CaFe2O4 heterostructure composite demonstrates that charge transfer from CaFe2O4 toward WO3 at the interface of WO3-CaFe2O4 heterostructure composite is occurring as a result of the high electro-negativity of WO3 (2.36) as compared to Fe (1.83) and the spontaneous charge transfer. However, compared to the individual WO3 and CaFe2O4 lattices, the Fe-2p (3/2, 1/2) and W-4f spectra show an upshift in B.E and a downshift in W-4f spectra, respectively, to exhibit more mixed valence states of Fe and W in the WO3-CaFe2O4 heterostructure composite, which aid in the creation of additional oxygen vacancies by maintaining charge-neutrality. Moreover, the ionic conductivity of WO3-CaFe2O4 should be impacted by the O1s spectra [24,25,26,31,33,34,35,36,37,38]. Lattice oxygen (lattice O2) and oxygen vacancy (Vo°°) peaks can be found in the O1s spectrum of CaFe2O4, WO3, and WO3-CaFe2O4 heterostructure composites. Two partially stacked peaks can be seen in the O1s spectra of the WO3-CaFe2O4 heterostructure composite cathode material (Figure 6d). With binding energies (BE) ranging from 528 to 533.5 eV, the CaFe2O4 bands and the O1s of WO3 bands are the two main excitations. The lattice oxygen (O Lattice) is responsible for the low BE peak at 529.2, while additional V o(°°) is responsible for the higher peak at 531.4. The high oxygen vacancy concentration and good oxygen adsorption capability of the WO3-CaFe2O4 cathode, which are key factors in high ORR activity, are indicated by the cathode’s high area percentage ratio of OLat/Ovac [36,38]. However, many processes in the ORR mechanism in the WO3-CaFe2O4 cathode, such as I surface adsorption/gas diffusion and separation of O2 from the air, (ii) diffusion of Oad, (iii) conversion of absorbed O2 into O2, and (iv) transit of O2 to cathode/electrolyte interface) are illustrated in Figure 7.

4. Conclusions

As a superb ORR electrocatalyst cathode for low-temperature SOFCs, we have created a heterostructure composite based on two semiconductors, WO3 and CaFe2O4. At LTs, such as 508 mW cm−2 at 550 °C, the produced WO3-CaFe2O4 sample displays superior ORR electrocatalytic and electrochemical performance. The WO3-CaFe2O4 heterostructure composite’s strong ORR electrocatalytic activity is due to a variety of factors, most of which are brought about by the creation of an interface between the WO3 and CaFe2O4 lattices. By using various experimental techniques, the mechanism behind the remarkable electrochemical performance of the WO3-CaFe2O4 heterostructure composite is thoroughly addressed. The obtained results demonstrate that this strategy could be applied to additional pertinent applications in addition to creating effective ORR electrocatalysts.

Author Contributions

Conceptualization of this work was completed by J.L. and F.Q. (Fei Qiu); methodology was completed by N.M., M.A.K.Y.S. and F.Q. (Fenghua Qi); formal analysis and investigation by S.Y. and Y.L. The resources and data curation facilities were provided by J.L. and F.Q. (Fei Qiu). Original draft preparation was done by J.L. And was reviewed and edited by M.A., A.S.A., N.M., M.A.K.Y.S. and Y.L. All authors have read and agreed to the published version of the manuscript.

Funding

This work is supported the industry-University-Research Cooperation Project of Jiangsu Province in China (Grant No. BY2021057), and the Qing Lan Project of Jiangsu Province. This work is also partly supported by the Jiangsu Province Higher Vocational College Young Teachers Enterprise Practice Training Funding Project (Grant No. 2021QYSJ048).This work is also supported by Princess Nourah bint Abdulrahman University Researchers Supporting Project number (PNURSP2023R398), Princess Nourah bint Abdulrahman University, Riyadh, Saudi Arabia is also acknowledged.

Data Availability Statement

The data that supports the findings of this study are available from the corresponding authors upon reasonable request.

Acknowledgments

The authors would like to acknowledge the industry-University-Research Cooperation Project of Jiangsu Province in China (Grant No. BY2021057) for providing the funding to complete this work. Princess Nourah bint Abdulrahman University Researchers Supporting Project number (PNURSP2023R398), Princess Nourah bint Abdulrahman University, Riyadh, Saudi Arabia is also acknowledged.

Conflicts of Interest

The authors declare no conflict of interest.

References

  1. Ormerod, R.M. Solid oxide fuel cells. Chem. Soc. Rev. 2003, 32, 17–28. [Google Scholar] [CrossRef] [PubMed]
  2. Jacobson, A.J. Materials for solid oxide fuel cells. Chem. Mater. 2010, 22, 660–674. [Google Scholar] [CrossRef]
  3. Wachsman, E.D.; Lee, K.T. Lowering the temperature of solid oxide fuel cells. Science 2011, 334, 935–939. [Google Scholar] [CrossRef] [PubMed]
  4. Pandey, A. Progress in solid oxide fuel cell (SOFC) research. JOM 2019, 71, 88–89. [Google Scholar] [CrossRef] [Green Version]
  5. Zhang, C. Solid oxide fuel cells: Low temperature cathodes. Nat. Energy 2016, 1, 16200. [Google Scholar] [CrossRef]
  6. Rioja-Monllor, L.; Bernuy-Lopez, C.; Fontaine, M.-L.; Grande, T.; Einarsrud, M.-A. Processing of high performance composite cathodes for protonic ceramic fuel cells by exsolution. J. Mater. Chem. A 2019, 7, 8609–8619. [Google Scholar] [CrossRef]
  7. Han, G.D.; Bae, K.; Kang, E.H.; Choi, H.J.; Shim, J.H. Inkjet printing for manufacturing solid oxide fuel cells. ACS Energy Lett. 2020, 5, 1586–1592. [Google Scholar] [CrossRef]
  8. Leng, Y.; Chan, S.; Khor, K.; Jiang, S. Performance evaluation of anode-supported solid oxide fuel cells with thin film YSZ electrolyte. Int. J. Hydrogen Energy 2004, 29, 1025–1033. [Google Scholar] [CrossRef]
  9. Liu, Y.-L.; Hagen, A.; Barfod, R.; Chen, M.; Wang, H.-J.; Poulsen, F.W.; Hendriksen, P.V. Microstructural studies on degradation of interface between LSM–YSZ cathode and YSZ electrolyte in SOFCs. Solid State Ion. 2009, 180, 1298–1304. [Google Scholar] [CrossRef]
  10. Miao, L.; Hou, J.; Dong, K.; Liu, W. A strategy for improving the sinterability and electrochemical properties of ceria-based LT-SOFCs using bismuth oxide additive. Int. J. Hydrogen Energy 2019, 44, 5447–5453. [Google Scholar] [CrossRef]
  11. Tihtih, M.; Ibrahim, J.E.F.; Basyooni, M.A.; Kurovics, E.; Belaid, W.; Hussainova, I.; Kocserha, I. Role of A-site (Sr), B-site (Y), and A, B sites (Sr, Y) substitution in lead-free BaTiO3 ceramic compounds: Structural, optical, microstructure, mechanical, and thermal conductivity properties. Ceram. Int. 2022, 49, 1947–1959. [Google Scholar] [CrossRef]
  12. Tihtih, M.; Ibrahim, J.E.F.M.; Basyooni, M.A.; Belaid, W.; Gömze, L.A.; Kocserha, I. Structural, optical, and electronic properties of barium titanate: Experiment characterisation and first-principles study. Mater. Technol. 2022, 37, 2995–3005. [Google Scholar] [CrossRef]
  13. Mushtaq, N.; Lu, Y.; Xia, C.; Dong, W.; Wang, B.; Shah, M.Y.; Rauf, S.; Akbar, M.; Hu, E.; Raza, R. Promoted electrocatalytic activity and ionic transport simultaneously in dual functional Ba0.5Sr0.5Fe0.8Sb0.2O3-δ-Sm0.2Ce0.8O2-δ heterostructure. Appl. Catal. B Environ. 2021, 298, 120503. [Google Scholar] [CrossRef]
  14. Zhou, X.-D. Kill Two Problems with One Dual-Ion Cell. Joule 2019, 3, 2595–2597. [Google Scholar] [CrossRef]
  15. Shah, M.Y.; Lu, Y.; Mushtaq, N.; Rauf, S.; Yousaf, M.; Asghar, M.I.; Lund, P.D.; Zhu, B. Demonstrating the potential of iron-doped strontium titanate electrolyte with high-performance for low temperature ceramic fuel cells. Renew. Energy 2022, 196, 901–911. [Google Scholar] [CrossRef]
  16. Choi, S.; Kucharczyk, C.J.; Liang, Y.; Zhang, X.; Takeuchi, I.; Ji, H.-I.; Haile, S.M. Exceptional power density and stability at intermediate temperatures in protonic ceramic fuel cells. Nat. Energy 2018, 3, 202–210. [Google Scholar] [CrossRef] [Green Version]
  17. Song, X.; Guo, W.; Guo, Y.; Mushtaq, N.; Shah, M.Y.; Irshad, M.S.; Lund, P.D.; Asghar, M.I. Nanocrystalline surface layer of WO3 for enhanced proton transport during fuel cell operation. Crystals 2021, 11, 1595. [Google Scholar] [CrossRef]
  18. Lu, Y.; Wang, J.; Mushtaq, N.; Shah, M.Y.; Irshad, S.; Rauf, S.; Motola, M.; Yan, S.; Zhu, B. Excellent oxygen reduction electrocatalytic activity of nanostructured CaFe2O4 particles embedded microporous Ni-Foam. Int. J. Hydrogen Energy 2022, 47, 10331–10340. [Google Scholar] [CrossRef]
  19. Zhou, X.; Hou, N.; Gan, T.; Fan, L.; Zhang, Y.; Li, J.; Gao, G.; Zhao, Y.; Li, Y. Enhanced oxygen reduction reaction activity of BaCe0.2Fe0.8O3-δ cathode for proton-conducting solid oxide fuel cells via Pr-doping. J. Power Sources 2021, 495, 229776. [Google Scholar] [CrossRef]
  20. Tarutina, L.R.; Lyagaeva, J.G.; Farlenkov, A.S.; Vylkov, A.I.; Vdovin, G.K.; Murashkina, A.A.; Demin, A.K.; Medvedev, D.A. Doped (Nd, Ba) FeO3 oxides as potential electrodes for symmetrically designed protonic ceramic electrochemical cells. J. Solid State Electrochem. 2020, 24, 1453–1462. [Google Scholar] [CrossRef]
  21. Duan, C.; Tong, J.; Shang, M.; Nikodemski, S.; Sanders, M.; Ricote, S.; Almansoori, A.; O’Hayre, R. Readily processed protonic ceramic fuel cells with high performance at low temperatures. Science 2015, 349, 1321–1326. [Google Scholar] [CrossRef] [PubMed]
  22. Mushtaq, N.; Xia, C.; Dong, W.; Wang, B.; Raza, R.; Ali, A.; Afzal, M.; Zhu, B. Tuning the energy band structure at interfaces of the SrFe0.75Ti0.25O3−δ–Sm0.25Ce0.75O2−δ heterostructure for fast ionic transport. ACS Appl. Mater. Interfaces 2019, 11, 38737–38745. [Google Scholar] [CrossRef]
  23. Shah, M.Y.; Lu, Y.; Mushtaq, N.; Yousaf, M.; Rauf, S.; Asghar, M.I.; Lund, P.D.; Zhu, B. Perovskite Al-SrTiO3 semiconductor electrolyte with superionic conduction in ceramic fuel cells. Sustain. Energy Fuels 2022, 6, 3794–3805. [Google Scholar] [CrossRef]
  24. Mueller, D.N.; De Souza, R.A.; Yoo, H.-I.; Martin, M. Phase stability and oxygen nonstoichiometry of highly oxygen-deficient perovskite-type oxides: A case study of (Ba, Sr)(Co, Fe)O3−δ. Chem. Mater. 2012, 24, 269–274. [Google Scholar] [CrossRef]
  25. Chandramohan, P.; Srinivasan, M.; Velmurugan, S.; Narasimhan, S. Cation distribution and particle size effect on Raman spectrum of CoFe2O4. J. Solid State Chem. 2011, 184, 89–96. [Google Scholar] [CrossRef]
  26. Singh, S.; Khare, N. Defects/strain influenced magnetic properties and inverse of surface spin canting effect in single domain CoFe2O4 nanoparticles. Appl. Surf. Sci. 2016, 364, 783–788. [Google Scholar] [CrossRef]
  27. Kotomin, E.A.; Mastrikov, Y.A.; Merkle, R.; Maier, J. First principles calculations of oxygen reduction reaction at fuel cell cathodes. Curr. Opin. Electrochem. 2020, 19, 122–128. [Google Scholar] [CrossRef]
  28. Tatarchuk, T.; Bououdina, M.; Vijaya, J.J.; Kennedy, L.J. Spinel ferrite nanoparticles: Synthesis, crystal structure, properties, and perspective applications. In Proceedings of the International Conference on Nanotechnology and Nanomaterials, Lviv, Ukraine, 24–27 August 2016; Springer International Publishing: Berlin/Heidelberg, Germany; pp. 305–325. [Google Scholar]
  29. Zuo, F.; Wang, L.; Wu, T.; Zhang, Z.; Borchardt, D.; Feng, P. Self-doped Ti3+ enhanced photocatalyst for hydrogen production under visible light. J. Am. Chem. Soc. 2010, 132, 11856–11857. [Google Scholar] [CrossRef]
  30. Liu, M.; Lynch, M.E.; Blinn, K.; Alamgir, F.M.; Choi, Y. Rational SOFC material design: New advances and tools. Mater. Today 2011, 14, 534–546. [Google Scholar] [CrossRef] [Green Version]
  31. Vøllestad, E.; Strandbakke, R.; Tarach, M.; Catalán-Martínez, D.; Fontaine, M.-L.; Beeaff, D.; Clark, D.R.; Serra, J.M.; Norby, T. Mixed proton and electron conducting double perovskite anodes for stable and efficient tubular proton ceramic electrolysers. Nat. Mater. 2019, 18, 752–759. [Google Scholar] [CrossRef]
  32. An, H.; Lee, H.-W.; Kim, B.-K.; Son, J.-W.; Yoon, K.J.; Kim, H.; Shin, D.; Ji, H.-I.; Lee, J.-H. A 5 × 5 cm2 protonic ceramic fuel cell with a power density of 1.3 W cm−2 at 600 °C. Nat. Energy 2018, 3, 870–875. [Google Scholar] [CrossRef]
  33. Campbell, C.T.; Peden, C.H. Oxygen vacancies and catalysis on ceria surfaces. Science 2005, 309, 713–714. [Google Scholar] [CrossRef]
  34. Chen, M.; Paulson, S.; Kan, W.H.; Thangadurai, V.; Birss, V. Surface and bulk study of strontium-rich chromium ferrite oxide as a robust solid oxide fuel cell cathode. J. Mater. Chem. A 2015, 3, 22614–22626. [Google Scholar] [CrossRef]
  35. Mantzavinos, D.; Hartley, A.; Metcalfe, I.S.; Sahibzada, M. Oxygen stoichiometries in La1−xSrxCo1−yFeyO3−δ perovskites at reduced oxygen partial pressures. Solid State Ion. 2000, 134, 103–109. [Google Scholar] [CrossRef]
  36. Zhu, K.; Liu, H.; Li, X.; Li, Q.; Wang, J.; Zhu, X.; Yang, W. Oxygen evolution reaction over Fe site of BaZrxFe1−xO3−δ perovskite oxides. Electrochim. Acta 2017, 241, 433–439. [Google Scholar] [CrossRef]
  37. Wang, Z.; You, Y.; Yuan, J.; Yin, Y.-X.; Li, Y.-T.; Xin, S.; Zhang, D. Nickel-Doped La0.8Sr0.2Mn1−xNixO3 Nanoparticles Containing Abundant Oxygen Vacancies as an Optimized Bifunctional Catalyst for Oxygen Cathode in Rechargeable Lithium–Air Batteries. ACS Appl. Mater. Interfaces 2016, 8, 6520–6528. [Google Scholar] [CrossRef]
  38. Oh, N.K.; Kim, C.; Lee, J.; Kwon, O.; Choi, Y.; Jung, G.Y.; Lim, H.Y.; Kwak, S.K.; Kim, G.; Park, H. In-situ local phase-transitioned MoSe2 in La0.5Sr0.5CoO3-δ heterostructure and stable overall water electrolysis over 1000 hours. Nat. Commun. 2019, 10, 1723. [Google Scholar] [CrossRef] [PubMed] [Green Version]
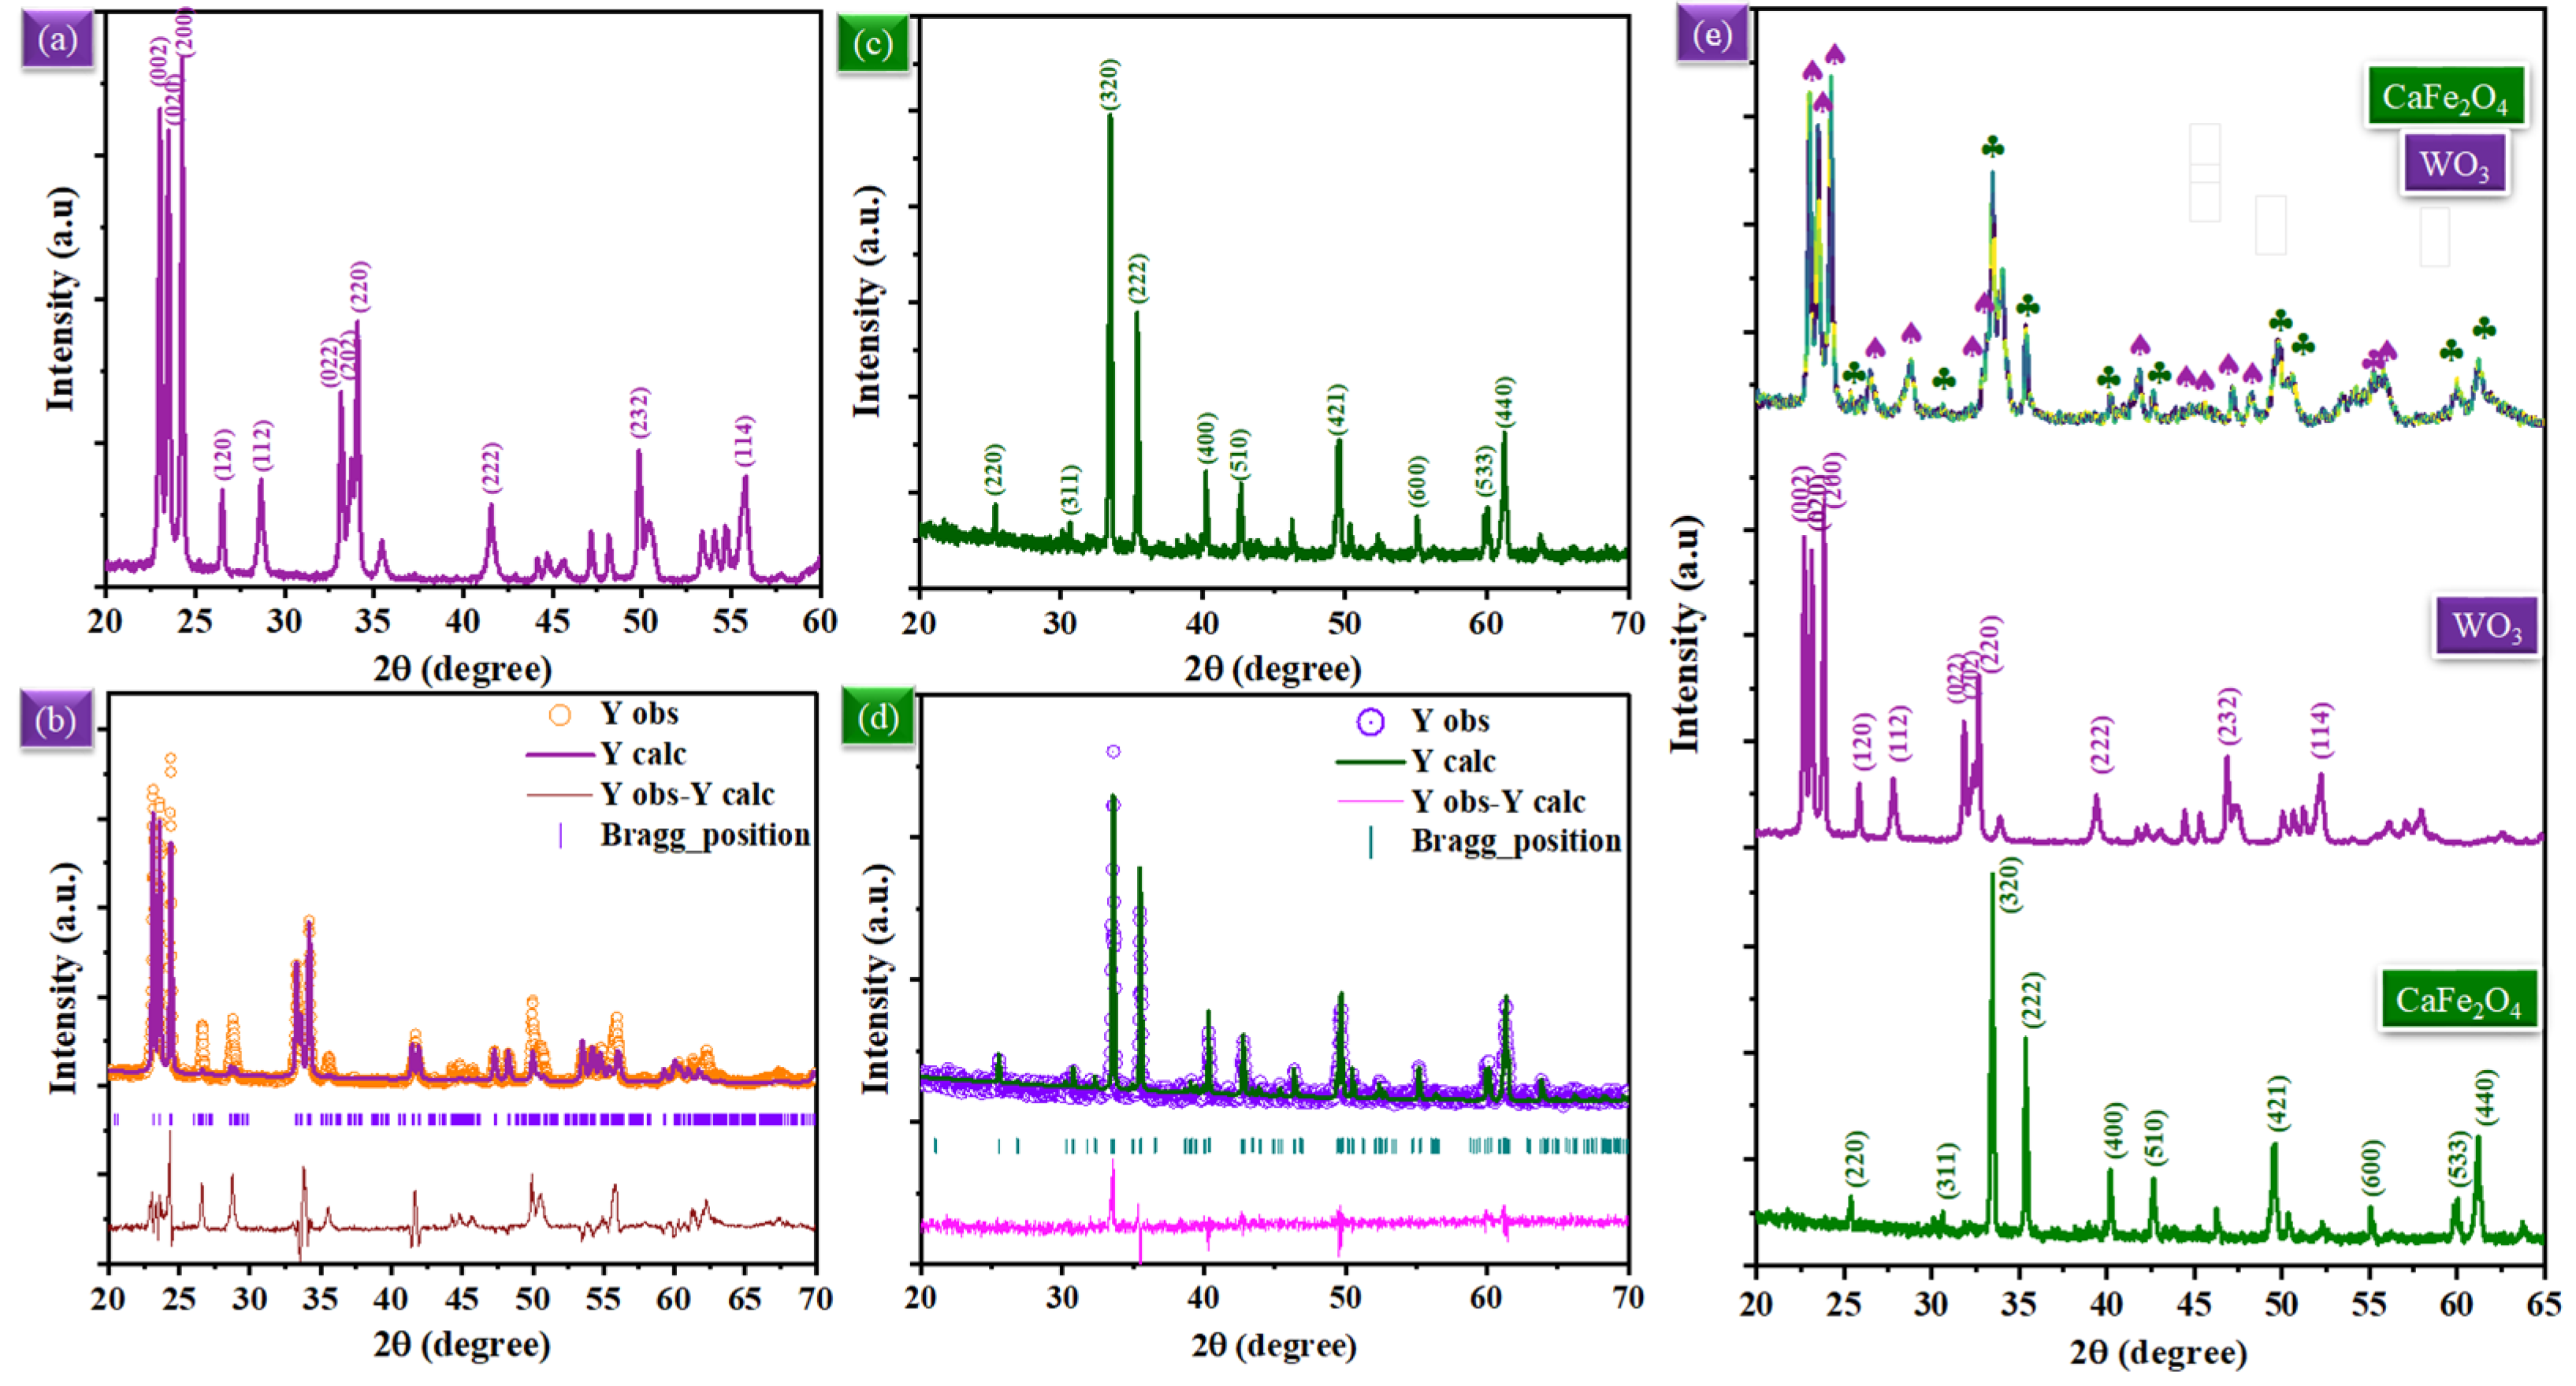
Figure 1. (a,b) measured and refined the estimated XRD data using Prof-Suit software of WO3, (c,d) measured and refined the measured XRD data using Prof-Suit software of CaFe2O4 and (e) X-ray diffraction pattern of WO3-CaFe2O4 heterostructure composite in-comparison of individual WO3 and CaFe2O4, respectively.
Crystals 13 00444 g001
Figure 2. (a,b) The surface morphology studied by SEM for CaFe2O4 powers, (c,d) SEM image for the commercially purchased WO3 and (e,f) SEM image for WO3-CaFe2O4 heterostructure composite powers, respectively.
Crystals 13 00444 g002
Figure 3. The surface morphology and compositional investigations (a) SEM image of WO3-CaFe2O4 particles planted on porous Ni-foam, (b) mix EDS mapping of WO3-CaFe2O4 particles planted on porous Ni-foam as shown in (a), (cf) individual EDS elements mapping in WO3-CaFe2O4 particles planted on porous Ni-foam such as Ni, Ca, Fe, W, respectively.
Crystals 13 00444 g003
Figure 4. (a) Nyquist plot of Impedance spectra for symmetrical electrode cell based on pure CaFe2O4, WO3, and WO3-CaFe2O4 over GDC electrolyte at 550 °C, (b) Nyquist plot of Impedance spectra for symmetrical electrode cell based on WO3-CaFe2O4 °C at GDC electrolyte operating at a different temperature from 550–350 °C, (c) comparison of the area-specific resistance of WO3-CaFe2O4 at different operating temperature of 550–350 °C and (d) dc conductivity measured by four probe method for WO3, CaFe2O4, and WO3-CaFe2O4 at 550–350 °C, respectively.
Crystals 13 00444 g004
Figure 5. Characterization of Electrochemical performances: (a) I-V & I-P Characteristics curves of utilizing our prepared WO3-CaFe2O4 in comparison of pure CaFe2O4 as a cathode in fuel cell operated at 550 °C; (b) shows fuel cell performance using our prepared WO3-CaFe2O4 cathode under different operating temperatures of 450–550 °C; (c) Comparison of the obtained power density of WO3-CaFe2O4 and CaFe2O4 cathode at different operating temperatures and (d) cross-sectional SEM images of tri-layer electrolyte supported fuel cell along with prepared WO3-CaFe2O4 cathode, GDC electrolyte and NCAL anode examined after the electrochemical test.
Crystals 13 00444 g005
Figure 6. X-ray photoelectron spectra of WO3-CaFe2O4 in comparison of pure WO3 and CaFe2O4. (a) High-resolution XPS spectra of W-4f in WO3 and WO3-CaFe2O4, (b,c) Ca-2p and Fe-2p XPS spectra of CaFe2O4 and WO3-CaFe2O4, respectively, and (d) O1s XPS spectra of CaFe2O4, WO3, and WO3-CaFe2O4, respectively.
Crystals 13 00444 g006
Figure 7. Schematic diagram of the different steps and electrochemical processes involved in power output of WO3-CaFe2O4 based cathode fuel cell.
Crystals 13 00444 g007
Disclaimer/Publisher’s Note: The statements, opinions and data contained in all publications are solely those of the individual author(s) and contributor(s) and not of MDPI and/or the editor(s). MDPI and/or the editor(s) disclaim responsibility for any injury to people or property resulting from any ideas, methods, instructions or products referred to in the content.