Abstract
Herein, the Hirshfeld surfaces analysis of the crystalline methylone hydrochloride was performed in order to analyze NH⋯Cl, CH⋯Cl, and CH⋯O intermolecular interactions and study the formation of the NН2+–Cl− salt fragment in methylone hydrochloride crystal. There are two isomeric dimers with parallel and side-by-side orientation extracted from the crystal packing to model the IR spectrum of the crystalline methylone hydrochloride within the framework of density functional theory (DFT) and B3LYP/6-31G(d,p) method. We have assigned and interpreted all observed IR bands in the experimental spectrum of the 3,4-methylenedioxymethcathinone hydrochloride standard crystal sample that is important for forensic-medical examination. It was shown that intermolecular interactions between the NН2+ and Cl− ionic moieties occur in crystalline samples that confirm the presence of the ionized form of the methylone hydrochloride compound with the NН2+Cl− fragment.
1. Introduction
Synthetic cathinones (SCs) are new psychotropic active substances related to the natural cathinone (β-ketoamphetamine), which is the main psychoactive compound of the Catha edulis plant. During the last two decades, the SCs entered the illicit drug market and started to replace controlled sympathomimetic stimulants: amphetamine, MDMA (Ecstasy), cocaine, and others. These substances are structurally related to amphetamine (Figure 1). Chemically SCs differ from amphetamine by the carbonyl group appearance in the β-position. The SCs are usually distributed by online retailers as research chemicals, plant foods, glass cleaners, and bath salts, being labeled with prohibition notes “not tested for toxicity” or “not for human use” [1].
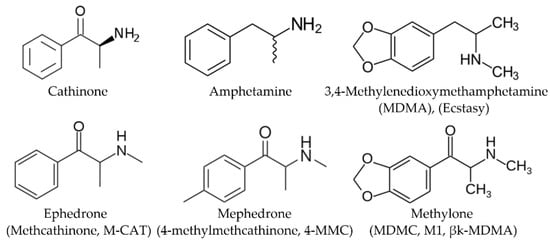
Figure 1.
Chemical structures of selected cathinones and amphetamines.
Methcathinone and 4-methylmethcathinone were the first synthetic cathinone derivatives [2,3,4,5]. Оriginally, synthetic cathinones were primarily developed for therapeutic purposes. So, for example, the new designer drug methylone (Figure 1) was synthesized by P. Jacob and A. Shulgin in 1996 as an antidepressant and anti-Parkinsonism agent [6]. Subsequently, this and other SCs drugs began to be abused for their euphoric effects. Modifications of the α-alkyl side chain, alkylamino group, and/or aromatic ring (for example, the addition of a methylenedioxy group or halogens) lead to the appearance of structurally modified analogs that replace those already prohibited by law.
The SCs substances being structurally similar to the amphetamine row (amphetamine, 3,4-methylenedioxymethamphetamine (MDMA), methamphetamine) produce analogous stimulating effects on the central nervous system that was expected on the cognate chemical structure of these compounds [7,8,9,10,11,12]. The most common side effects that have been reported with synthetic cathinones are cardiac, psychiatric, and neurological disorders (even deaths have been fixed several times) [13,14]. That is why the SCs substances were the first big group of designer drugs seized in the European Union [15,16].
Actual tasks in the field of control of narcotic compounds are the development of methods for detecting new synthetic drugs and the screening of dozens, sometimes hundreds, of known compounds in marketed products, dosage forms, and biosamples. One of the most difficult tasks for establishing the facts of the use of synthetic cathinones is the identification of SCs and their metabolites in biological objects. Synthetic cathinones in the unchanged state can be found in the hair [17,18], in oral fluid [19], in blood or blood plasma [20,21,22], urine [23,24,25]. In forensic and toxicological laboratories, the most common combined methods for the analysis of confiscated drugs and biosamples are Gas Chromatography-Tandem Mass Spectrometry (GC-MS/MS) and Liquid Chromatography-Electrospray Ionization-Mass Spectrometry (HPLC-MS/MS).
Determination of narcotic SCs can be performed using search libraries [26,27] without the use of standard samples. The identity of a substance can be confirmed using Fourier transform infrared (FTIR) spectroscopy. However, the identification of new SCs which possess common structural features with the old well-known cathinones could be difficult since the new characteristic IR spectral shifts are unknown in advance, as well as their dependence on the mutual arrangement of various functional groups. That is why the express FTIR analysis of new SCs strongly depends on the theoretical interpretation of vibrational modes, their IR frequency, and intensity by modern quantum chemical methods, such as the density functional theory (DFT). In the row of related compounds, the observed small changes in their IR absorption spectra could be very informative if the IR band assignments are known from DFT calculations. In order to increase the analytical power of FTIR spectroscopy in forensic studies of new SCs we have performed a series of DFT calculations of various cathinones: 1-(4-chlorophenyl)-2-(ethylamino) propan-1-one hydrochloride (shortly named 4-chloroethylcathinone or 4-CEC) [28], 2-(methylamino)-1-(4-methylphenyl) propan-1-one monohydrochloride (shortly named 4-methylmethcatinone, 4-MMC, and also known as mephedrone, 4-methylephedrone, and its 2-methylmethcathinone isomer or 2-MMC [29,30]. For further computational characterization of the cathinone series, we chose a synthetic stimulant drug 1-(1,3-benzodioxol-5-yl)-N-methyl-1-oxopropan-2-aminium chloridum (methylone hydrochloride, MDMC∙HCl). Here, we provide a comprehensive analysis of the intermolecular interactions in the methylone hydrochloride crystal and their impact on the IR spectrum by combining Hirschfeld surfaces analysis, atoms in molecules (AIM) calculations, and DFT state-of-the-art modeling. The unique feature of this research is the IR spectra simulation using the dimer structure model, which displays the formation of the NН2+–Cl− salt fragment in the methylone hydrochloride crystal. Its proper fixation in the dimer models is crucially important for correct IR spectra interpretation in such hydrochloride salt crystals and opens up new possibilities in the analysis of new drugs.
2. Computational Details
The methylone hydrochloride crystal packing was studied by the Hirshfeld surface analysis method [31,32], implemented in the Crystal Explorer 21.5 software [33]. The nature of the intermolecular interactions was determined with the Bader’s approach known as the Quantum Theory of Atoms in Molecules (QTAIM) [34]. The structures of dimer configurations of the methylone hydrochloride and their IR spectra were simulated through dimer configurations by the DFT method with different basis sets [35,36,37,38] and Grimme’s dispersion correction [39] (Tables S1 and S2 in Supplementary Information, SI) using the Gaussian 16 package [40]. The calculated IR spectra of the methylone hydrochloride dimers were constructed with scale factors 0.945 for high-frequency valence vibrations and 0.97 for the 1700–500 cm−1 spectral region [41] using the SWizard 4.6 program [42] (with the Lorentzian distribution function). All details regarding Hirshfeld [31,32], QTAIM [34,43,44,45], and DFT [35,36,37,38,39] calculations are described in the Supplementary Materials.
3. Results and Discussion
3.1. Hirshfeld Surface Analysis
This section represents the Hirshfeld surfaces analysis for the methylone hydrochloride crystal to substantiate the nature of intermolecular interactions that stabilize its crystal structure, as well as to explain the peculiarities of the influence of these intermolecular interactions on the IR spectrum of methylone. The hydrochloride salt of methylone crystallizes in a monoclinic P21/c space group (Figure 2A) and is described in Ref. [46]. The Hirshfeld surface of methylone mapped over dnorm is shown in Figure 2B,C, where it displays the interaction of the electron density of the selected molecule (i.e., methylone cation and chlorine ion) with the electron density of the surrounding crystalline medium.
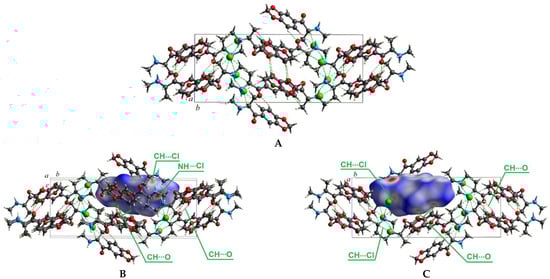
Figure 2.
Crystal structure of methylone hydrochloride, intermolecular interactions are shown by green dashed lines (A); Hirschfeld dnorm surface shows the presence of intermolecular NH---Cl and CH---Cl bonds (B); Hirschfeld dnorm surface shows the presence of intermolecular CH---O bonds (C). The Cl atoms are shown in green, O atoms are in red, N in blue, and C in gray.
The Hirschfeld dnorm surface for methylone hydrochloride demonstrates that the N–H⋯Cl interactions between the chlorine ion and the hydrogen atom of the amino group of the neighboring cation are the most prominent intermolecular contacts with experimental distances of 2.211 Å in the methylone crystal and are marked dark red spots in Figure 2B. The shortest contacts with distances of 2.197 Å in the methylone crystal can be considered as intramolecular N–H⋯Cl interactions between the hydrogen atom of the amino group of the methylone cation, which is directly bonded to its chloride ion; therefore, these contacts are not highlighted by red spots in the Hirschfeld surface. Other pale red spots correspond to CH⋯O intermolecular contacts with distances of 2.609 Å and 3.682 Å (Figure 2C) and CH⋯Cl intermolecular contacts with distances of 2.650 Å and 2.789 Å (Figure 2B,C).
Figure 3 shows two-dimensional (2D) graphs of fingerprints with the contribution (in percent) of each contact to the total Hirshfeld surface. For methylone hydrochloride, H⋯H contacts occupy the largest area on the fingerprint graph (39.7%). The Cl⋯H interactions in the 2D surface are represented by two different spikes of the same length with a contribution to the total surface area of 20.6%. The O⋯H contacts make up 20.9% and are visible in the wide central part of the Hirshfeld surface. The contribution of C⋯Н contacts is 13.7%, other C⋯О and О⋯О contacts occupy only 2.7 and 1.9% of the total area. Thus, the supramolecular arrangement of molecules in the methylone crystal is mainly determined by Cl⋯H and O⋯H contacts. A detailed analysis of intermolecular interactions in a methylone hydrochloride crystal made it possible to correctly select dimer configurations for further calculation of their IR spectra.
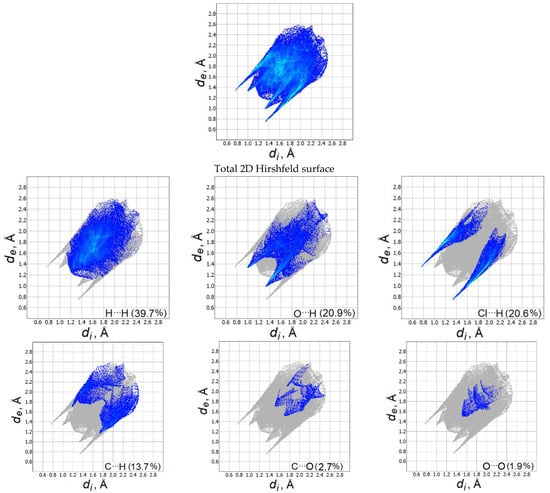
Figure 3.
Fingerprint plots for the methylone hydrochloride crystal (the de and di correspond to the external and internal distances, respectively).
3.2. Structural Features in the Dimers of Methylone Hydrochloride, DFT Results
The experimental structures of the dimers 1 and 2 of methylone hydrochloride being selected from the crystal structure are shown in Figure 4. To calculate the IR spectra and parameters of noncovalent interactions in dimer models using the Bader’s QTAIM approach, the experimental structures of dimers obtained by X-ray diffraction analysis for the crystal cell were reoptimized by the DFT method. Interesting to note, that dimer configuration 1 appears to be more stable than dimer configuration 2 by 21.855 kJ/mol (5.22 kcal/mol), calculated at the B3LYP/6-31G(d,p) level. Similar values are reproduced in the optimized dimer structures with the 6-311++G(d,p), 6-311 G(d,p) basis sets, and with Grimme’s dispersion correction [39].

Figure 4.
The structures of dimers 1 and 2 of methylone hydrochloride selected from the X-ray crystal data. Selected experimental [46] intra- and intermolecular distances (Å) for the dimers are indicated. The Cl atoms are shown in green, O atoms are in red, N in blue, and C in gray.
The calculated structural parameters for the separated methylone molecule in a vacuum (without HCl) in Ref. [46] were compared with the corresponding experimental data obtained by X-ray diffraction analysis of the crystal compound. The assignment of the crystalline FTIR spectrum of methylone hydrochloride on the ground of DFT calculation for separated molecules in a vacuum [46] seems to be not very convincing on the ground of our previous experience [29] since the HCl species provides huge perturbations in the force field of the studied SCs drugs.
That is why we have recalculated dimer models which include two methylone and two HCl molecules in the crystalline cell and simulate the experimental crystal structure. The B3LYP/6-31G(d,p) optimized structures with the numbers of atoms specified by the program are shown in Figure S1 in Supplementary Information, SI. Relevant structural data (bond lengths and angles) for the dimers 1 and 2 of the methylone hydrochloride are presented in Tables S3 and S4 in SI. Both molecules of dimer 2 and molecule 2 of dimer 1 have bond lengths, intramolecular distances, and bond and torsion angles, which are close to experimental values [46] (Table 1, Tables S3 and S4 in SI); however, in molecule 1 of dimer 1, such agreement is not always confirmed. For example, the experimental values of the C9–O4 and C9–O5 bond lengths in the 3,4-methylenedioxy group of molecule 1 are equal to 1.415 and 1.417 Å, respectively, while in molecule 2 they are 1.420 and 1.425Å. The torsion angles C17–C21–C22–C24 and C21–C22–N6–C28 in molecule 1 are equal to −79.1° and −171.5°, respectively, while in molecule 2 they are 75.9° and 165.6°. The selected intermolecular distances in dimers (Table 2) show a different arrangement of molecules 1 and 2 in the dimer relative to each other. This leads to the fact that in molecule 1 of isolated dimer 1, both hydrogen atoms H7 and H8 of the NH2 group formed during the preparation of the methylone hydrochloride salt are under the simultaneous influence of chlorine atoms Cl2 and Cl1, respectively. In molecule 2 of dimer 1, only one N–H bond (N35–H37) is under the influence of the chlorine atom (Cl1). In molecule 2 of dimer 1, the N35–H36 bond does not participate in the salt formation and can be involved in the vibrational process as a free bond (Figure 4, Figure S1 in Supplementary Information). In contrast to the structure of dimer 1, each molecule of the isolated dimer 2 possesses a free N–H bond, which will participate in the vibrational process. We scrutinize these details since both types of dimers could be realized in real crystal as follows from FTIR analysis.

Table 1.
Selected intramolecular distances (Å) for the dimer 1 and dimer 2 of methylone hydrochloride calculated at the B3LYP/6-31G(d,p) theory level.
Table 2.
Selected intermolecular distances (Å) for the dimer 1 and dimer 2 of methylone hydrochloride calculated at the B3LYP/6-31G(d,p) theory level.
In the optimized dimer structures of the methylone hydrochloride, the N–H and N–HCl bonds become slightly longer, and the NH–Cl bonds shorter compared to the experimental values (Table S3). This is because the dimer model does not take into account the equivalent intermolecular forces in all directions of the whole crystalline volume medium. However, both theoretical and experimental values of the NH–Cl bond lengths are significantly larger compared to the free H–Cl molecule (1.2746 Å) [47]. The rest of the structural parameters are well reproduced by our quantum chemical calculations.
Short intramolecular contacts N–HCl, O⋯HN and O⋯H2C in molecules of dimers 1 and 2 (Table 1), calculated with DFT/B3LYP/6-31G(d,p) approach, are in good agreement with X-ray data. One short intermolecular contact N6H8(1)⋯Cl 1(2) calculated in the structure of dimer 1 with the distance 2.280 Å (exp.: 2.211 Å) is consistent with results of the Hirshfeld surfaces analysis for the intermolecular interactions in the crystalline compound of methylone hydrochloride. In the optimized structure of the dimer 2, as well as in the X-ray experiment [46], there are found two short intermolecular contacts of the Oxygen atoms of the methylenedioxy group with the Hydrogen atoms of the benzene ring: C13ArH14(1)⋯O33(2) and C42ArH43(2)⋯O4.(1) (calc.: 2.875 Å and 2.592 Å, respectively, exp.: 2.609 Å, Table 2).
3.3. Bader’s QTAIM Analysis
For the analysis of non-covalent chemical interactions, we calculated the topological characteristics of the electron density for two dimers of methylone (Figure 4) at the (3, −1) critical points using the Bader’s QTAIM method. The presence of strong NH⋯Cl contacts in methylone dimers was found. According to the QTAIM analysis, the NH⋯Cl contacts have positive Laplacian values of the electron density ∇2ρ(r) > 0 and negative values of the Kremer-Kraka electron energy density he(r) < 0, which allows attributing these bonds to an intermediate type of interactions (Table 3). All NH⋯Cl contacts have rather small values of ellipticity (ε) (Table 3), which indicates the cylindrically symmetric shape of bonds and the dynamically stable nature of the binding of NН2+–Cl− salt fragments. Delocalization index (DI) values determine the degree of electron density concentration in the interatomic space. The calculated values of the bond energy of NH⋯Cl interactions, estimated by the Espinoza formula, are −8.91–−7.56 kcal mol−1 for NH37–Cl 1 in dimers 1 and 2 and −4.52 kcal mol−1 for N6H8(1)⋯Cl1(2) contacts (Table 3).
Table 3.
Topological characteristics of the non-covalent bonds calculated by the QTAIM method for the methylone dimers.
Methylone crystals are also stabilized by weak CH⋯О interactions with ∇2ρ(r) > 0 and he(r) > 0 parameters and belong to closed-shell interactions (Table 3).
3.4. IR Spectra of the Methylone Hydrochloride Dimers
On the background of the Hirshfeld surfaces analysis of metylone hydrochloride crystal, we selected dimer configurations representing N–H⋯Cl and CН‧‧‧О intermolecular contacts for optimization with the DFT method and the subsequent IR spectra simulation in the form of dimer 1 and dimer 2 and compared them with the experimental FTIR spectrum [48] (Tables S5 and S6 in SI, Figure 5 and Figure 6).
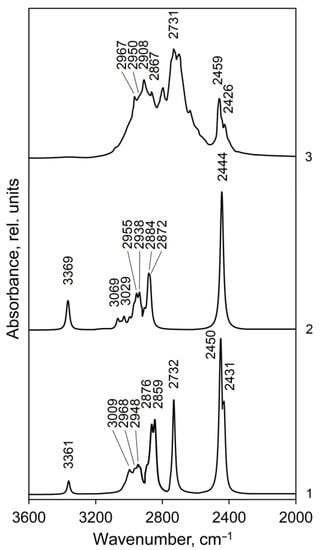
Figure 5.
Calculated (curves 1 and 2) and experimental (curve 3, [48]) IR spectra of methylone hydrochloride in the 3600–2000 cm−1 range: curve 1—IR spectrum for dimer 1, curve 2—IR spectrum for dimer 2. The line half-width is 10 cm−1.
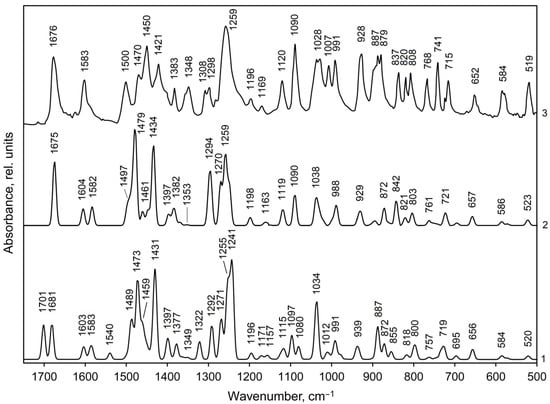
Figure 6.
Calculated (curves 1, 2) and experimental (curve 3, [48]) IR spectra of methylone hydrochloride in the 1750–500 cm−1 range: curve 1—IR spectrum for dimer 1, curve 2—IR spectrum for dimer 2. Line half-width is 10 cm−1.
The highest frequencies in the calculated IR spectra of dimer 1 (3361 cm−1) and dimer 2 (3369 cm−1) of metylone hydrochloride (Figure 5, curve 1 and 2, respectively) are presented by weak bands of ν(N–H) stretching vibrations. The corresponding N–H bonds in the isolated dimers do not interact with chlorine atoms. The calculated IR intensity of the ν(N–H) band in dimer 2 is higher compared to dimer 1 since two N–H bonds of dimer 2 are free, they are not interacting with chlorine atoms. This band is almost absent in the experimental spectrum [48] (weak and broadened in Figure 5, curve 3), but it is clearly observed in other sources: at 3350 cm−1 [46], 3356 cm−1 [49].
The calculated absorption regions of C–H stretching vibrations of the aromatic ring, asymmetric, and symmetric vibrations of the methylene and methyl groups for dimers 1 and 2 are close (Tables S5 and S6) and correspond to the characteristic group frequencies [50]. In the experimental spectrum (Figure 5, curve 3), this absorption appears as a complicated band, in which the peaks at 2967 and 2908 cm−1 belong to vibrations of methyl groups (asymmetric, νas, and symmetric, νs, respectively); the left shoulder at 2950 cm−1 on the band 2908 cm−1 and a peak at 2867 cm−1 were assigned by us to the stretching vibrations of the methylene group together with the methyl groups (νas and νs, respectively). The calculated intensities of the normal vibrations of the methylene group are much higher than those of the methyl groups (Tables S5 and S6). Stretching vibrations of aromatic C–H bonds have weak absorption in the region of 3070–3030 cm−1 (Tables S5 and S6) and do not form an independent band in the experimental spectrum. According to calculations, the C–H stretching vibrations of the methine group absorb in the region of 2971–2934 cm−1 and contribute to the bands of asymmetric vibrations of methyl groups at 2967 and 2950 cm−1.
The strong experimental band at 2731 cm−1 (calc.: 2732 cm−1 in dimer 1) is due to the interaction of a free NH group (not bound to HCl) of molecule 1 with a chlorine atom of a neighboring molecule (Figure 5, curve 3 and 1, respectively, Table S5, ν149). This interaction is determined by the short intermolecular contacts N6H8 (1)⋯Cl 1 (2) (calc.: 2.280 Å, exp.: 2.211 Å, Table 2). The N–H bonds of isolated dimer 2 do not interact with the chlorine atom of a neighboring molecule (the intermolecular distance NH7 (1)⋯Cl 1 (2) for the isolated dimer 2 of methylone are large (calc. 12.948 Å, exp.: 13.201 Å [46]); therefore, this band is absent in the calculated spectrum of dimer 2 (Figure 5, curve 2).
The strongest bands 2450 and 2431 cm−1 in the calculated spectrum of dimer 1 (Figure 5, curve 1, Table S3) are produced by valence vibration of the intramolecular N–H–Cl fragments in molecules 2 and 1, respectively (exp.: 2459 and 2426 cm−1). For the dimer 2 of metylone (Figure 5, curve 2, Table S4) this type of vibration occurs simultaneously in both molecules of dimer at 2444 cm−1 (in an out-of-phase manner, ν148) and with significantly lower IR absorption at 2442 cm−1 (in-phase, ν147). The absorption associated with the salt type N–H–Cl vibrations is relatively weaker in the experimental spectrum of the studied compound (Figure 5, curve 3) since DFT overestimates polarization in the salt link.
Such assignment of the absorption bands in the high-frequency region of the experimental IR spectrum of the methylone crystal does not coincide with the results of the Ref. [46] assignment where the band at 2920 cm−1 was assigned to the C–H stretching vibrations of the aromatic ring, the bands at 2799 and 2735 cm−1—to the C–H stretching vibrations of the methyl groups and the bands in the region of 2450 cm−1—to combination bands of the bending and libration modes of water molecules in a crystal lattice. In our opinion, the assignment of these bands carried out in the present work is more correct. The correct assignment of the IR bands in the range of 2800–2420 cm−1 for the metylone compound is confirmed by the fact that in the calculated spectrum for the free molecule metylone (without hydrochloride) [46], these bands are absent at all. The experimental spectrum of methylone-free bases is unavailable in the literature.
The calculated IR spectra of methylone hydrochloride dimers in the middle-frequency region (1750–500 сm−1) are presented by two C=O absorption bands of medium intensity at 1701 and 1681 cm−1 for dimer 1 and by a strong C=O band at 1675 cm−1 for dimer 2 (Figure 6, curves 1 and 2, exp.: 1676 cm−1, curve 3). The carbonyl groups ν(C=O) valence vibrations are mixed with the scissoring deformation vibrations of amino groups (Tables S5 and S6). Such a difference in the shape of the C=O absorption bands in the calculated IR spectra for dimers 1 and 2 is due to the fact that in isolated dimer 1, C=O vibrations occur alternately in molecules 1 (ν146) and 2 (ν145) with approximately equal intensities (158 and 166 km/mol, respectively). In isolated dimer 2, on the contrary, C=O vibrations occur simultaneously in both molecules of the dimer in-phase (ν145, I = 57 km/mol) and out-of-phase (ν146, I = 303 km/mol). The NH2 and CH2 scissoring vibrations in the spectra of dimers are calculated in the frequency region 1540–1472 cm−1, however, the calculated intensity of the normal vibrations of the methylene group is much lower than that of the amino group (Table S5 and S6, ν140–ν136). Based on the calculations, the experimental band at 1500 cm−1 (Figure 6, curve 3) was assigned to scissoring vibrations of the NH2 groups (calc.: 1489 cm−1 in dimer 1 and 1498 cm−1 (shoulder) in dimer 2). The medium intensity experimental band at 1603 cm−1 and the right shoulder at 1583 cm−1 are assigned to symmetric C=C vibrations in the phenyl ring (calc.: 1603 and 1583 cm−1 for dimer 1, curve 1, and 1604 and 1582 cm−1 for dimer 2, curve 2). The strong experimental bands at 1470 cm−1 and 1421 cm−1 we assigned to asymmetric vibrations of aromatic C=C bonds (calc.: 1473 and 1431 cm−1 for dimer 1, respectively; 1479 and 1434 cm−1 for dimer 2). The band of asymmetric C=C vibrations near 1470 cm−1 has a contribution of NH2 and CH2 scissoring vibrations (ν135, 134 in Tables S5 and S6). Asymmetric C=C vibrations of the Kekule type produce a weak-to-medium intensity experimental IR band at 1348 сm−1 (curve 3), however, the calculated IR intensity of normal vibrations is very small (ν114, 113 in Tables S5 and S6).
According to our calculations the asymmetric deformations of methyl groups (CH3 bending, as.) in the experimental IR spectrum of methylone hydrochloride (Figure 6, curve 3) produce a strong band at 1450 сm−1 (calc.: 1459 сm−1 (shoulder right on the strong band at 1473 сm−1)—for dimer 1 and a weak band at 1461 сm−1—for dimer 2). Symmetric CH3 bending deformations produce a weak band at 1383 сm−1 and a shoulder at 1400 сm−1 right on the strong band at 1421 сm−1 (calc.: 1377 and 1397 cm−1—for dimer 1, 1382 and 1397 cm−1—for dimer 2, Figure 6, curve 1 and 2, respectively). The asymmetric deformations of methyl groups are mixed with wagging and twisting deformation of the amino group; symmetric deformations—with wagging deformation of a methylene group (CH2 wag.) and with bending deformation of methine group (CH bend.). (Tables S5 and S6 in SI). Methyl rocking vibrations (CH3 rock.) contribute to a strong experimental band at 1090 cm−1 (ν89, 90 in Tables S5 and S6), to medium intensity bands at 837 cm−1 (ν69) and 768 cm−1 (ν62, 61).
The aromatic in-plane CH bending vibrations (CHAr bend.) are predicted in the range 1249–1196, 1150–1124, and 1119–1080 cm−1 (Tables S5 and S6). In the experimental IR spectrum of the methylone, they do not form independent bands but contribute to the strong bands at 1259, 1090 cm−1 and to a medium intensity band at 1120 сm−1 (Figure 6, curve 3). In the range 1150–1124 cm−1 the CHAr bending vibrations have a very weak IR absorption. The out-of-plane ССНAr bending vibrations produce a strong experimental IR band at 887 сm−1 (calc. also 887 сm−1) and contribute to the medium intensity bands at 808, 741, and 715 сm−1, however, the calculated absorption intensities are much lower than the experimental ones (Figure 6).
The twisting vibrations of the methylene group (CH2 twist.) contribute to the weak experimental IR band at 1169 сm−1 and CH2 rocking vibrations—to the weak-to-medium intensity band at 1169 сm−1. The rocking vibrations of the amino group contribute to the strong bands at 887 сm−1, to a medium intensity band at 837 сm−1, and to the weak band at 1120 сm−1 (Figure 6, curve 3, Tables S5 and S6 in SI).
The symmetrical CAr–O stretching vibrations in the 3,4-methylenedioxy-group according to our calculations provides in the region of IR spectrum 1750–500 сm−1 the most intense absorption band at 1259 сm−1 (calc.: 1255 сm−1 and 1259 сm−1—in dimer 1 and 2, respectively, Figure 6). This wide band is formed not only by symmetrical CAr–O stretching vibrations and benzene ring stretching vibrations (ν108, 107) but also by CAr–C stretching vibrations in fragment CAr–C=O (ν106, 105), as well as by NH2 twisting vibrations mixed with vibrations of methine group (ν110, 109). The asymmetrical CAr–O stretching vibrations formed the medium intensity absorption band at 1120 сm−1 (calc.: 1115 сm−1 and 1119 сm−1—in dimer 1 and 2, respectively, Figure 6). The symmetrical O–C–O stretching vibrations in the 3.4-methylenedioxy-group provide an experimental doublet band with maxima at 1036 and 1028 сm−1 of stark-to-medium intensity; the asymmetrical O–C–O vibrations—a band of approximately the same intensity at 928 сm−1.
The С–N skeletal vibrations produce individual absorption bands of the strong-to-medium intensity at 1028, 1007, 991, 879, and 820 сm−1, and only a band at 1090 сm−1 is accompanied by CH bending deformations, in-plane, of a benzene ring and rocking deformations of methyl groups. The C–C skeletal deformations mixed with CH and NH bending deformations form a doublet band of medium intensity with maxima at 1308 and 1298 cm−1, a very strong band at 1259 cm−1 as well as a weak band at 1196 cm−1 (Figure 6, Tables S5 and S6 in SI).
The medium experimental intensity IR band in the low-frequency region at 519 сm−1 (Figure 6, curve 3) was assigned to CArCC and CNC bending vibrations occurring in the out-of-phase mode; however, the calculated absorption intensity is lower than the experimental one. All other absorption bands are assigned in Tables S5 and S6 in the Supplementary Information. Vibrational features of both types of dimers are presented in the experimental IR spectrum of the crystal.
4. Conclusions
The growth of synthetic cathinones in the illicit psychotropic drug market calls on more elaborated analytical methods in forensic studies. In this paper, we present systematic Hirshfeld surfaces analysis and DFT modeling of crystalline methylone hydrochloride IR spectrum, which strongly depends on the crystal packing principles and, in particular, on the character of the methcathinone molecule interactions with the hydrochloride moiety. The Hirschfeld surfaces analysis showed that the structure of methylone hydrochloride is stabilized by N–H⋯Cl intermolecular interactions between the chlorine ion and the hydrogen atom of the amino group of the neighboring cation with experimental distances of 2.211 Å. This contact is identified in the Hirschfeld dnorm surface by intense red spots. The Hirschfeld dnorm surface also indicated weak CН‧‧‧О contacts, which contribute to additional stabilization of the methylone crystal. The Bader’s analysis additionally supports the nature of intermolecular interactions in accordance with the Hirshfeld surfaces analysis for the whole crystal cells. Finally, it should be noted that only the presence of the ionized form of the methylone hydrochloride compound with the NН2+Cl− fragment makes it possible to correctly reproduce the IR spectrum when calculating the dimer configurations as a model of a crystalline sample. The model of the free metylone molecule (without hydrochloride) cannot reproduce the experimental bands at 2459 and 2426 cm−1 corresponding to valence vibrations of the intramolecular strongly polarized N–H⋯Cl fragments.
We use a wide arsenal of theoretical facilities (DFT optimization of dimer models with their force filed and normal vibrations study, the topological “Atoms in Molecule” Bader’s theory, and the Hirschfeld surface analysis) in order to solve the puzzle of high-frequency modes in the FTIR spectra of methylone crystal. Theoretical assignments of these and many other high-frequency IR bands in Ref. [46] are doubtful according to our analysis; meanwhile, FTIR spectra of methylone synthetic drugs are important in contemporary forensic studies.
Supplementary Materials
The following supporting information can be downloaded at: https://www.mdpi.com/article/10.3390/cryst13030383/s1, Figure S1: The optimized structures of the corresponding dimers selected from crystals of methylone hydrochloride selected bond lengths and angles for the dimers 1 and 2, Tables S1–S4: structural parameters for the dimer 1 and dimer 2, Tables S5 and S6: calculated frequencies, IR intensities, corresponding experimental date, and assignment of vibrational modes for the dimers 1 and 2 of methylone hydrochloride.
Author Contributions
Conceptualization, V.M., N.K.-K., B.M. and H.Å.; formal analysis, V.M., O.P., N.K.-K. and B.M.; investigation, V.M., O.P. and N.K.-K.; writing–original draft preparation, V.M., N.K.-K. and B.M.; writing–review and editing, V.M., N.K.-K. and B.M.; visualization, O.P.; supervision, B.M. and H.Å. All authors have read and agreed to the published version of the manuscript.
Funding
This study was supported by the Ministry of Education and Science of Ukraine (projects no. 0121U107533 and 0122U000760), and by Wenner-Gren Stiftelserna (contract GFU2022-0036).
Data Availability Statement
Not applicable.
Acknowledgments
The authors extend their sincere appreciation to the Researchers Supporting Projects (0121U107533 and 0122U000760), Ministry of Education and Science of Ukraine and to Wenner-Gren Association.
Conflicts of Interest
The authors declare no conflict of interest.
References
- Cottencin, O.; Rolland, B.; Karila, L. New designer drugs (synthetic cannabinoids and synthetic cathinones): Review of literature. Curr. Pharm. Des. 2014, 20, 4106–4111. [Google Scholar] [CrossRef]
- Hyde, J.F.; Browning, E.; Adams, R. Synthetic Homologs of d,l-Ephedrine. J. Am. Chem. Soc. 1928, 50, 2287–2292. [Google Scholar] [CrossRef]
- L’italien, Y.J.; Park, H.; Rebstock, M.C. Ethylaminopropiophenone Compounds. U.S. Patent No. 2802865, 1954. [Google Scholar]
- Sanchez, S. Sur un homologue de l’ephedrine. Bull. Soc. Chim. Fr. 1929, 45, 284–286. [Google Scholar]
- Green, A.R.; King, M.V.; Shortall, S.E.; Fone, K.C.F. The preclinical pharmacology of mephedrone; not just MDMA by another name. Br. J. Pharmacol. 2014, 171, 2251–2268. [Google Scholar] [CrossRef] [PubMed]
- Peyton, J.; Shulgin, A.T. Novel n-Substituted-2-Amino-3′,4′-Methylene-Dioxypropiophenones. WIPO Patent WO1996039133A1, 12 December 1996. [Google Scholar]
- Gregg, R.A.; Rawls, S.M. Behavioral pharmacology of designer cathinones: A review of the preclinical literature. Life Sci. 2014, 97, 27–30. [Google Scholar] [CrossRef] [PubMed]
- Simmler, L.D.; Buser, T.A.; Donzelli, M.; Schramm, Y.; Dieu, L.-H.; Huwyler, J.; Chaboz, S.; Hoener, M.C.; Liechti, M.E. Pharmacological characterization of designer cathinones in vitro. Br. J. Pharmacol. 2013, 168, 458–470. [Google Scholar] [CrossRef] [PubMed]
- Karila, L.; Megarbane, B.; Cottencin, O.; Lejoyeux, M. Synthetic cathinones: A new public health problem. Curr. Neuropharmacol. 2015, 13, 12–20. [Google Scholar] [CrossRef]
- Karila, L.; Billieux, J.; Benyamina, A.; Lançon, C.; Cottencin, O. The effects and risks associated to mephedrone and methylone in humans: A review of the preliminary evidences. Brain Res. Bull. 2016, 126, 61–67. [Google Scholar] [CrossRef]
- Watterson, L.R.; Hood, L.; Sewalia, K.; Tomek, S.E.; Yahn, S.; Johnson, C.T.; Wegner, S.; Blough, B.E.; Marusich, J.A.; Olive, M.F. The Reinforcing and Rewarding Effects of Methylone, a Synthetic Cathinone Commonly Found in “Bath Salts”. J. Addict. Res. Ther. 2012, S9, 002. [Google Scholar] [CrossRef]
- Martínez-Clemente, J.; Escubedo, E.; Pubill, D.; Camarasa, J. Interaction of mephedrone with dopamine and serotonin targets in rats. Eur. Neuropsychopharmacol. 2012, 22, 231–236. [Google Scholar] [CrossRef] [PubMed]
- Prosser, J.M.; Nelson, L.S. The toxicology of bath salts: A review of synthetic cathinones. J. Med. Toxicol. 2012, 8, 33–42. [Google Scholar] [CrossRef]
- Winstock, A.; Mitcheson, L.; Ramsey, J.; Davies, S.; Puchnarewicz, M.; Marsden, J. Mephedrone: Use, subjective effects and health risks. Addiction 2011, 106, 1991–1996. [Google Scholar] [CrossRef] [PubMed]
- European Monitoring Centre for Drugs Drug Addiction (EMCDDA), Europol–EMCDDA Joint Report on a New Psychoactive Substance: 4-methylmethcathinone (Mephedrone). EMCDDA: Lisbon, Portugal, 2010. Available online: https://www.emcdda.europa.eu/publications/joint-reports/mephedrone_en (accessed on 1 March 2010).
- European Monitoring Centre for Drugs and Drug Addiction (EMCDDA). European Drug Report 2021: Trends and Developments. Publications Office of the European Union. 2021. Available online: https://www.emcdda.europa.eu/publications/edr/trends-developments/2021_en (accessed on 1 June 2021).
- Bolcato, V.; Carelli, C.; Radogna, A.; Freni, F.; Moretti, M.; Morini, L. New Synthetic Cathinones and Phenylethylamine Derivatives Analysis in Hair: A Review. Molecules 2021, 26, 6143. [Google Scholar] [CrossRef]
- Martin, M.; Muller, J.F.; Turner, K.; Duez, M.; Cirimele, V. Evidence of mephedrone chronic abuse through hair analysis using GC/MS. Forensic Sci. Int. 2012, 218, 44–48. [Google Scholar] [CrossRef] [PubMed]
- Strano-Rossi, S.; Anzillotti, L.; Castrignano, E. Francesco Saverio Romolo; Marcello Chiarotti Ultra high performance liquid chromatography–electrospray ionization–tandem mass spectrometry screening method for 150 direct analysis of designer drugs, “spice” and stimulants in oral fluid. J. Chromatogr. A 2012, 1258, 37–42. [Google Scholar] [CrossRef]
- Loganathan, D.; Yi, R.; Patel, B.; Zhang, J.; Kong, N. A sensitive HPLC-MS/MS method for the detection, resolution and quantitation of cathinone enantiomers in horse blood plasma and urine. Anal. Bioanal. Chem. 2021, 413, 2147–2161. [Google Scholar] [CrossRef]
- Beyer, J.; Peters, F.T.; Kraemer, T.; Maurer, H.H. Detection and validated quantification of nine herbal phenalkylamines and methcathinone in human blood plasma by LC-MS/MS with electrospray ionization. J. Mass Spectrom. 2007, 42, 150. [Google Scholar] [CrossRef]
- Ammann, J.; McLaren, J.M.; Gerostamoulos, D.; Beyer, J. Detection and Quantification of New Designer Drugs in Human Blood: Part 2–Designer Cathinones. J. Anal. Toxicol. 2012, 36, 381. [Google Scholar] [CrossRef]
- Meyer, M.R.; Wilhelm, J.; Peters, F.T.; Maurer, H.H. Beta-keto amphetamines: Studies on the metabolism of the designer drug mephedrone and toxicological detection of mephedrone, butylone, and methylone in urine using gas chromatographymass spectrometry. Anal. Bioanal. Chem. 2010, 397, 1225–1233. [Google Scholar] [CrossRef]
- Kamata, H.T.; Shima, N.; Zaitsu, K.; Kamata, T.; Miki, A.; Nishikawa, M.; Katagi, M.; Tsuchihashi, H. Metabolism of the recently encountered designer drug, methylone, in humans and rats. Xenobiotica Fate Foreign Compd. Biol. Syst. 2006, 36, 709–723. [Google Scholar] [CrossRef] [PubMed]
- Kamata, H.T.; Shima, N.; Zaitsu, K.; Kamata, T.; Nishikawa, M.; Katagi, M.; Miki, A.; Tsuchihashi, H. Simultaneous Analysis of New Designer Drug, Methylone, and Its Metabolites in Urine by Gas Chromatography-Mass Spectrometry and Liquid Chromatography-Electrospray Ionization Mass Spectrometry. Jpn. J. Forensic Sci. Technol. 2007, 12, 97. [Google Scholar] [CrossRef]
- Scientific Working Group for the Analysis of Seized Drugs (SWGDRUG) Website. Available online: http://www.swgdrug.org/ (accessed on 18 January 2023).
- Cayman Chemical. Available online: https://www.caymanchem.com/ (accessed on 18 January 2023).
- Minaeva, V.A.; Karaush-Karmazin, N.N.; Panchenko, A.A.; Heleveria, D.N.; Minaev, B.F. Hirshfeld surfaces analysis and DFT study of the structure and IR spectrum of N-ethyl-2-amino-1-(4-chlorophenyl)propan-1-one (4-CEC) hydrochloride. Comput. Theor. Chem. 2021, 1205, 113455. [Google Scholar] [CrossRef]
- Minaeva, V.; Minaev, B.; Panchenko, A.; Pasychnik, V. Computational study of IR, Raman and NMR spectra of 4-methylmethcathinone drug. J. Mol. Model. 2021, 27, 3. [Google Scholar] [CrossRef]
- Minaeva, V.; Panchenko, A.; Karaush-Karmazin, N.; Nycz, J.; Minaev, B. Manifestation of Intermolecular Interactions in the IR Spectra of 2- and 4-Methylmethcathinones Hydrochlorides: DFT Study and Hirshfeld Surfaces Analysis. Biointerface Res. Appl. Chem. 2023, 13, 202. [Google Scholar] [CrossRef]
- McKinnon, J.J.; Spackman, M.A.; Mitchell, A.S. Novel tools for visualizing and exploring intermolecular interactions in molecular crystals. Acta Crystallogr. Sect. B Struct. Sci. 2004, 60, 627–668. [Google Scholar] [CrossRef]
- Spackman, M.A.; Jayatilakaa, D. Hirshfeld surface analysis. Cryst. Eng. Comm. 2009, 11, 19–32. [Google Scholar] [CrossRef]
- Spackman, P.R.; Turner, M.J.; McKinnon, J.J.; Wolff, S.K.; Grimwood, D.J.; Jayatilaka, D.; Spackman, M.A. Crystal Explorer: A program for Hirshfeld surface analysis, visualization and quantitative analysis of molecular crystals. J. Appl. Cryst. 2021, 54, 1006–1011. [Google Scholar] [CrossRef]
- Bader, R.F.W. Atoms in Molecules. In A Quantum Theory; Clarendon Press: Oxford, UK, 1990; ISBN 9780198558651. [Google Scholar]
- Becke, A.D. Density-functional thermochemistry. III. The role of exact exchange. J. Chem. Phys. 1993, 98, 5648–5652. [Google Scholar] [CrossRef]
- Mardirossian, N.; Head-Gordon, M. Thirty years of density functional theory in computational chemistry: An overview and extensive assessment of 200 density functional. Mol. Phys. 2017, 115, 2315–2372. [Google Scholar] [CrossRef]
- Lee, C.; Yang, W.; Parr, R.G. Development of the Colle-Salvetti correlation-energy formula into a functional of the electron density. Phys. Rev. B 1988, 37, 785–789. [Google Scholar] [CrossRef] [PubMed]
- Francl, M.M.; Petro, W.J.; Hehre, W.J.; Binkley, J.S.; Gordon, M.S.; DeFrees, D.J.; Pople, J.A. Self-consistent molecular orbital methods. XXIII. A polarization-type basis set for second-row elements. J. Chem. Phys. 1982, 77, 3654–3666. [Google Scholar] [CrossRef]
- Grimme, S.; Antony, J.; Ehrlich, S.; Krieg, H. A consistent and accurate ab initio parametrization of density functional dispersion correction (DFT-D) for the 94 elements H-Pu. J. Chem. Phys. 2010, 132, 154104. [Google Scholar] [CrossRef] [PubMed]
- Frisch, M.J.; Trucks, G.W.; Schlegel, H.B.; Scuseria, G.E.; Robb, M.A.; Cheeseman, J.R.; Scalmani, G.; Barone, V.; Petersson, G.A.; Nakatsuji, H.; et al. Gaussian 16, Revision A.03; Gaussian, Inc.: Wallingford, CT, UK, 2016. [Google Scholar]
- Scott, A.P.; Radom, L. Harmonic Vibrational Frequencies: An Evaluation of Hartree−Fock, Møller−Plesset, Quadratic Configuration Interaction, Density Functional Theory, and Semiempirical Scale Factors. J. Phys. Chem. 1996, 100, 16502–16513. [Google Scholar] [CrossRef]
- Gorelsky, S.I. SWizard Program, University of Ottawa, Ottawa, Canada 2013. Available online: http://www.sg-chem.net (accessed on 18 January 2023).
- Keith, T.A. AIMAll (Version 10.07.25); TK Gristmill Software: Overland ParkKS, KS, USA, 2010; Available online: www.aim.tkgristmill.com (accessed on 18 January 2023).
- Espinosa, E.; Molins, E.; Lecomte, C. Hydrogen bond strengths revealed by topological analyses of experimentally observed electron densities. Chem. Phys. Lett. 1998, 285, 170–173. [Google Scholar] [CrossRef]
- Espinosa, E.; Alkorta, I.; Rozas, I.; Elguero, J.; Molins, E. About the evaluation of the local kinetic, potential and total energy densities in closed-shell interactions. Chem. Phys. Lett. 2001, 336, 457–461. [Google Scholar] [CrossRef]
- Nycz, J.E.; Malecki, G.; Zawiazalec, M.; Pazdziorek, T. X-ray structures and computational studies of several cathinones. J. Mol. Struct. 2011, 1002, 10–18. [Google Scholar] [CrossRef]
- Huber, K.P.; Herzberg, G. Molecular Spectra and Molecular Structure. IV. Constants of Diatomic Molecules; Van Nostrand Reinhold Company: New York, NY, USA, 1979. [Google Scholar]
- Monograph—SWGDRUG.org. Available online: https://www.swgdrug.org/monographs.htm (accessed on 18 January 2023).
- SpectraBase. Available online: https://spectrabase.com/ (accessed on 25 January 2023).
- Socrates, G. Infrared Raman Characteristic Group Frequencies–Tables and Charts, 3rd ed.; John Wiley & Son: Hoboken, NJ, USA, 2001. [Google Scholar] [CrossRef]


Disclaimer/Publisher’s Note: The statements, opinions and data contained in all publications are solely those of the individual author(s) and contributor(s) and not of MDPI and/or the editor(s). MDPI and/or the editor(s) disclaim responsibility for any injury to people or property resulting from any ideas, methods, instructions or products referred to in the content. |
© 2023 by the authors. Licensee MDPI, Basel, Switzerland. This article is an open access article distributed under the terms and conditions of the Creative Commons Attribution (CC BY) license (https://creativecommons.org/licenses/by/4.0/).