Article

Multi-Theory Comparisons of Molecular Simulation Approaches to TiO2/H2O Interfacial Systems

by
Dáire O’Carroll
and
Niall J. English
*
School of Chemical and Bioprocess Engineering, University College Dublin, Belfield, D04 V1W8 Dublin, Ireland
*
Author to whom correspondence should be addressed.
Crystals 2023, 13(7), 1122; https://doi.org/10.3390/cryst13071122
Submission received: 22 June 2023 / Revised: 8 July 2023 / Accepted: 10 July 2023 / Published: 19 July 2023
(This article belongs to the Special Issue First-Principles Simulation—Nano-Theory (Volume II))

Abstract

:
Herein, we present molecular dynamics analyses of systems containing TiO2 interfaces with water, simulated using empirical forcefields (FF), Density-Functional Tight-Binding (DFTB), and Density-Functional Theory (DFT) methodologies. The results and observed differences between the methodologies are discussed, with the aim of assessing the suitability of each methodology for performing molecular dynamics simulations of catalytic systems. Generally, well-parameterised forcefield MD outperforms the other methodologies—albeit, at the expense of neglecting certain qualitative behaviours entirely. DFTB represents an attractive compromise method, and has the potential to revolutionise the field of molecular dynamics in the near future due to advances in generating parameters.

1. Introduction

Choosing a suitable simulation methodology is the perennial problem of the computational chemist. Classical molecular mechanics (MM) and molecular dynamics (MD) provide simple, resource-efficient methods for calculating the properties of large systems, but often neglect or grossly simplify electronic behaviours. On the other hand, Density-Functional Theory (DFT) is a very common methodology for simulating electronic properties, but scales quite poorly with increasing system size [1]. Somewhere in between is the Density-Functional Tight-Binding (DFTB) methodology, which approximates DFT using pre-calculated parameters [2], allowing for better scaling with system size at the cost of losing some theoretical rigour.
Considering further some problematic shortcomings of molecular-simulation methods, there has been a good deal of activity in recent years to correct systematic errors inherent in traditional Kohn–Sham DFT. These include, inter alia, DFT + U [3,4] and RPBE [5,6]. These respective approaches allow for more detailed and accurate simulations in reactive systems (or those with the potential to do so, subject to reaction-energy barriers), such as reducing the electron-delocalisation problem in crystals and enhancing adsorbed-water interaction energies with surfaces.
Often, the choice of methodology is linked to the nature of the system. For some systems, there is little to be gained by including electronic interactions; for others, these interactions can be effectively approximated using parameterised or empirical adjustments to classical methods [7]. Conversely, the behaviour and properties of some systems can change considerably when a different methodology is applied; for example, the adsorption of water molecules on TiO2 surfaces. Theoretical calculations are often in quantitative disagreement with each other, and sometimes in qualitative disagreement with experimental evidence. Theoretical methods tend to favour dissociative or mixed molecular/dissociative adsorption on non-defective TiO2 surfaces [8,9,10], while experimental evidence favours molecular adsorption on the surface; however, more recent studies have also pointed towards mixed modes of adsorption, dependent on many factors [11,12,13].
In other instances, the choice of methodology is determined by the properties one wishes to observe. Many dynamical properties, such as the vibrational density of states (VDOS), require at least on the order of 103 data points in order to be considered a high-quality metric; others, such as the mean-squared displacement (MSD), should be calculated over at least a minimum time span to ensure that the system is in equilibrium and the observed behaviour is actually representative. Other properties of interest, such as the electronic band structure and density of states (DOS), require the inclusion of electronic interactions and thus constrain the size and length of the simulation, precluding (or at the very least, inhibiting) the effective calculation of the other properties mentioned above.
Bearing these above points in mind, in the present work we present a series of comparative analyses from molecular-dynamics simulation aimed at assessing the suitability of several simulation methodologies, namely, empirical forcefields (FF), Density-Functional Theory (DFT) and Tight-Binding DFT (or DFTB), as applied to various representative properties of the TiO2/H2O interface. These systems are of special interest to researchers in the field of surface science, as TiO2 is a promising candidate for the photoelectrochemical (PEC) catalysis of water for the production of hydrogen fuel. TiO2 is an n-type semiconductor with band gaps in the range of 3.00–3.5 eV [14], making it a wide band gap semiconductor. Much research has been carried out with the aim of better understanding TiO2 photo-catalysis and making it economically viable as a PEC catalyst for the production of hydrogen and methanol, as well as the removal of organic contaminants in wastewater [15,16]. TiO2 is considered to be one of the very few materials suitable for industrial applications due to its favourable combination of (relatively) efficient photo-activity, environmental stability, and low cost of production [17]. Popular approaches towards increasing the catalytic activity of TiO2 include the synthesis of novel or low-dimensional nanoscale catalysts, and doping or coupling with other materials [18,19].
Several other publications have explored various aspects of TiO2 photocatalysis in recent years, including doped catalysts, morphology control, coupling with co-catalysts and novel synthetic procedures [20]. Other theoretical studies have focused in detail on the effects of photoexcitation and applied electric fields on TiO2/H2O systems [21,22]; although highly interesting and relevant for comparisons to physically realistic systems, these methods were not employed in this study. Instead, comparable systems of anatase- and rutile-structured TiO2 surfaces were chosen in order to establish a reasonable benchmark between methodologies. These systems are outlined in Table 1 and Table 2.
Both the anatase (101) and rutile (110) surfaces are photoactive, and are the most stable bare surface of their respective crystals. As a result, they are typically the dominant surface plane (by area) observed in both nano- and macro-scale examples of TiO2, as well as being highly reactive [16]. However, as mentioned above, the surface science of TiO2 is often not well-understood. Difficulties in controlling the minutiae of surface structure, water coverage, and sample purity have also hampered experimental investigations [23].

2. Methodology

For as straightforward as possible ease of comparison, we attempted to ensure that the simulation settings employed were equivalent throughout all the simulations presented in this article. To that end, all simulations were equilibrated to, or very close to, 300 K and 1 bar pressure in the NVT ensemble for FF, DFT and DFTB, before respective production runs were performed in the NVE ensemble for the purposes of data-gathering. The simulation time-step varied according to the methodology employed, but was in the range of 0.25 to 1 fs to capture accurately the vibrational properties of water molecules.

2.1. Forcefield MD

Forcefield-based MD with empirical potentials was performed using two distinct methodologies: reactive and non-reactive potentials. Classical (i.e., non-reactive) molecular dynamics simulations were performed using the DL_POLY Classic software package [24] using the TiO2 parameters from Matsui and Akaogi [25] and the SCP/fw water model from Wu et al. [26]. Reactive MD was performed using LAMMPS software [27], employing the ReaxFF forcefield from refs. [28,29] in conjunction with the SPC/fw water model. As described above, all simulations were equilibrated to 300 K and 1 bar in the NVT ensemble before the data gathering was performed in the NVE ensemble. The simulation timestep was 0.25 fs, with coordinates and velocities were saved every 4 fs.
Three simulation cells were used for these studies: one cell contained 826 water molecules as a ‘neat-water reference’, and was used as a reference to compute values for bulk water, whilst the others consisted of a rutile structured (110) surface slab of TiO2 immersed in water, and an anatase structured (101) surface slab of TiO2, owing to these faces exhibiting greater PEC activity for each polymorph [17,18,19]. Both titania-water cells were orthogonal and contained equal numbers of TiO2 formula units and water molecules, as described in Table 1.

2.2. DFTB-MD

Two calculations were performed using the SCC-DFTB methodology [30]; these were on solvated surface slabs of anatase (101) and rutile (110). The details of the simulations are given in Table 2.
The anatase slab was generated from a unit cell sourced from the Materials Project database [31], transformed using the ASE [32] and pymatgen [33] python packages, then solvated using a bespoke Monte Carlo random insertion algorithm. The rutile (110) surface was generated from a unit cell also sourced from the Materials Project, and the same transformation/solvation procedure was applied. All simulations were performed using the DFTB+ software package [34]. In all cases, the mat-sci-0.3 parameter set [35] was used for the Slater–Koster files. This parameter set was designed to model the adsorption of phosphonic acids on rutile and anatase surfaces, and thus contained parameters for all relevant interactions contained in these simulations. Charge mixing was performed using the Bryoden–Eyert [36] scheme, as provided in the software, and the ELSI-library ELSA solver [37] was used to efficiently perform parallel charge-mixing and matrix-solvation. The SCC convergence threshold was set to 10−4 qe.
Shortly after the thermostat was disconnected from the system for NVE production simulation, the equilibrium temperature of the DFTB anatase (101) and rutile (110) systems steadily rose to 400 K and 350 K, respectively. The causative mechanism of this heating is currently unknown; it is unlikely to be an inherent flaw in the DFTB methodology, as the system energy remained constant. Furthermore, other authors have successfully employed these techniques without reporting a temperature increase [1,35,38]. It is known that poor SCC convergence may cause unintended temperature increases in DFTB-MD, which necessitates the application of correction and approximation terms during the calculation [39]. This is of particular relevance to the present work, as SCC convergence is difficult to achieve in larger MD systems. The authors have addressed this in a prior work, which details the DFTB simulation of a very large TiO2/H2O system [40]. Other potential causes of this heating may include parameter set artifacts or an insufficient equilibration phase, although the authors have no reasons to believe that either is the case.
Although this heating effect is unfortunate, as it limits the potential for a comparison to experimental results and the results of other simulations, it was found that the NVE ensemble was preserved, and thus the trajectories could be considered valid. Further investigation into the thermostat implementation in DFTB+ and its interaction with various charge solvers should be conducted to investigate any undesirable dependence on hardware or other computational specifics, although temperature control in DFTB [34,35,36,37] is known to be especially challenging in practice.

2.3. DFT-MD

The computational cost and relatively low numerical stability associated with DFT constrains its use to quite small systems and short trajectories. These constraints limit the quantity of data obtainable from a given simulation, but compensate with the accuracy and detail contained in the data. Only a rutile (110) system was studied using DFT-MD, using the same rutile system as for DFTB; see the system properties outlined in Table 2.
For this system, the average water molecule density was approximately 0.65 g cm−3, due to the small system size and to allow for the formation of water layers during the trajectory. The VASP (version 5.3.5) software package was used to perform the simulations, using the recommended pseudo-potentials for H, O, and Ti. The PBE functionals [41] were used for all atomic types in the system; no distinction was made between solid oxygen atoms and oxygen atoms belonging to water molecules. The PAW energy cut-off was set to 550 eV, and a Hubbard U correction of 4.0 eV was applied to the Ti atoms, using the scheme by Dudarev et al. [42].
In terms of rough comparative timings, per MD step, for systems of a similar size, one DFT step was 12.24 CPU seconds, one DFTB step was 3.8 CPU seconds, while one classical-MD step was 0.01 CPU seconds.

3. Results and Discussion

3.1. Water Layering

The formation of water layers on surfaces of TiO2 is a phenomenon that has been well-documented by both experimental and theoretical studies [43,44]. Detailed discussions of the nature and behaviour of these layers in molecular dynamics simulations have been presented by authors in previous publications [45,46,47]; thus, we only give a high-level treatment of the subject here for comparative purposes.

3.2. Forcefield MD

Using forcefield MD, both the anatase (101) and rutile (110) surfaces exhibited notable layering effects. The first layer was typically formed within 5 Å of the surface, with a second (and third, in the case of rutile) layer forming within 10 Å. A graph of water molecule density as a function of position along the z axis for both surfaces using classical MD is given in Figure 1a, and for the rutile (110) surface using ReaxFF in Figure 1b. The density was calculated by subdividing the cell into slices of 0.1 Å along the z axis and averaging the number of molecules in each slice over a period of 250 ps.
It is notable that the surfaces have quite different layering schemes; the rutile (110) surface features a very tightly bound first layer (denoted as 1AL, graphed in red) and pronounced second and third layers (2AL and 3AL, graphed in blue and orange respectively), whereas anatase (101) was observed to form only two layers. Rutile (110) also formed layers under ReaxFF, but these were slightly less dense. The existence and classification of a third water layer at the rutile (110) surface is somewhat contentious; some studies, such as ref. [34], have reported a distinct third layer, whereas others [48] consider it to be part of the second layer. Furthermore, the prevalence of the third layer seems to vary according to the layer identification methodology employed (see ref. [46] for further details). To avoid becoming embroiled in this debate, we use the term “inner layer” to denote water molecules in the layer immediately adjacent to the surface, and “outer layer” to denote those in layers further away. Figure 2 shows the colour-coded layers at either surface, as simulated using classical MD.

3.3. DFTB-MD

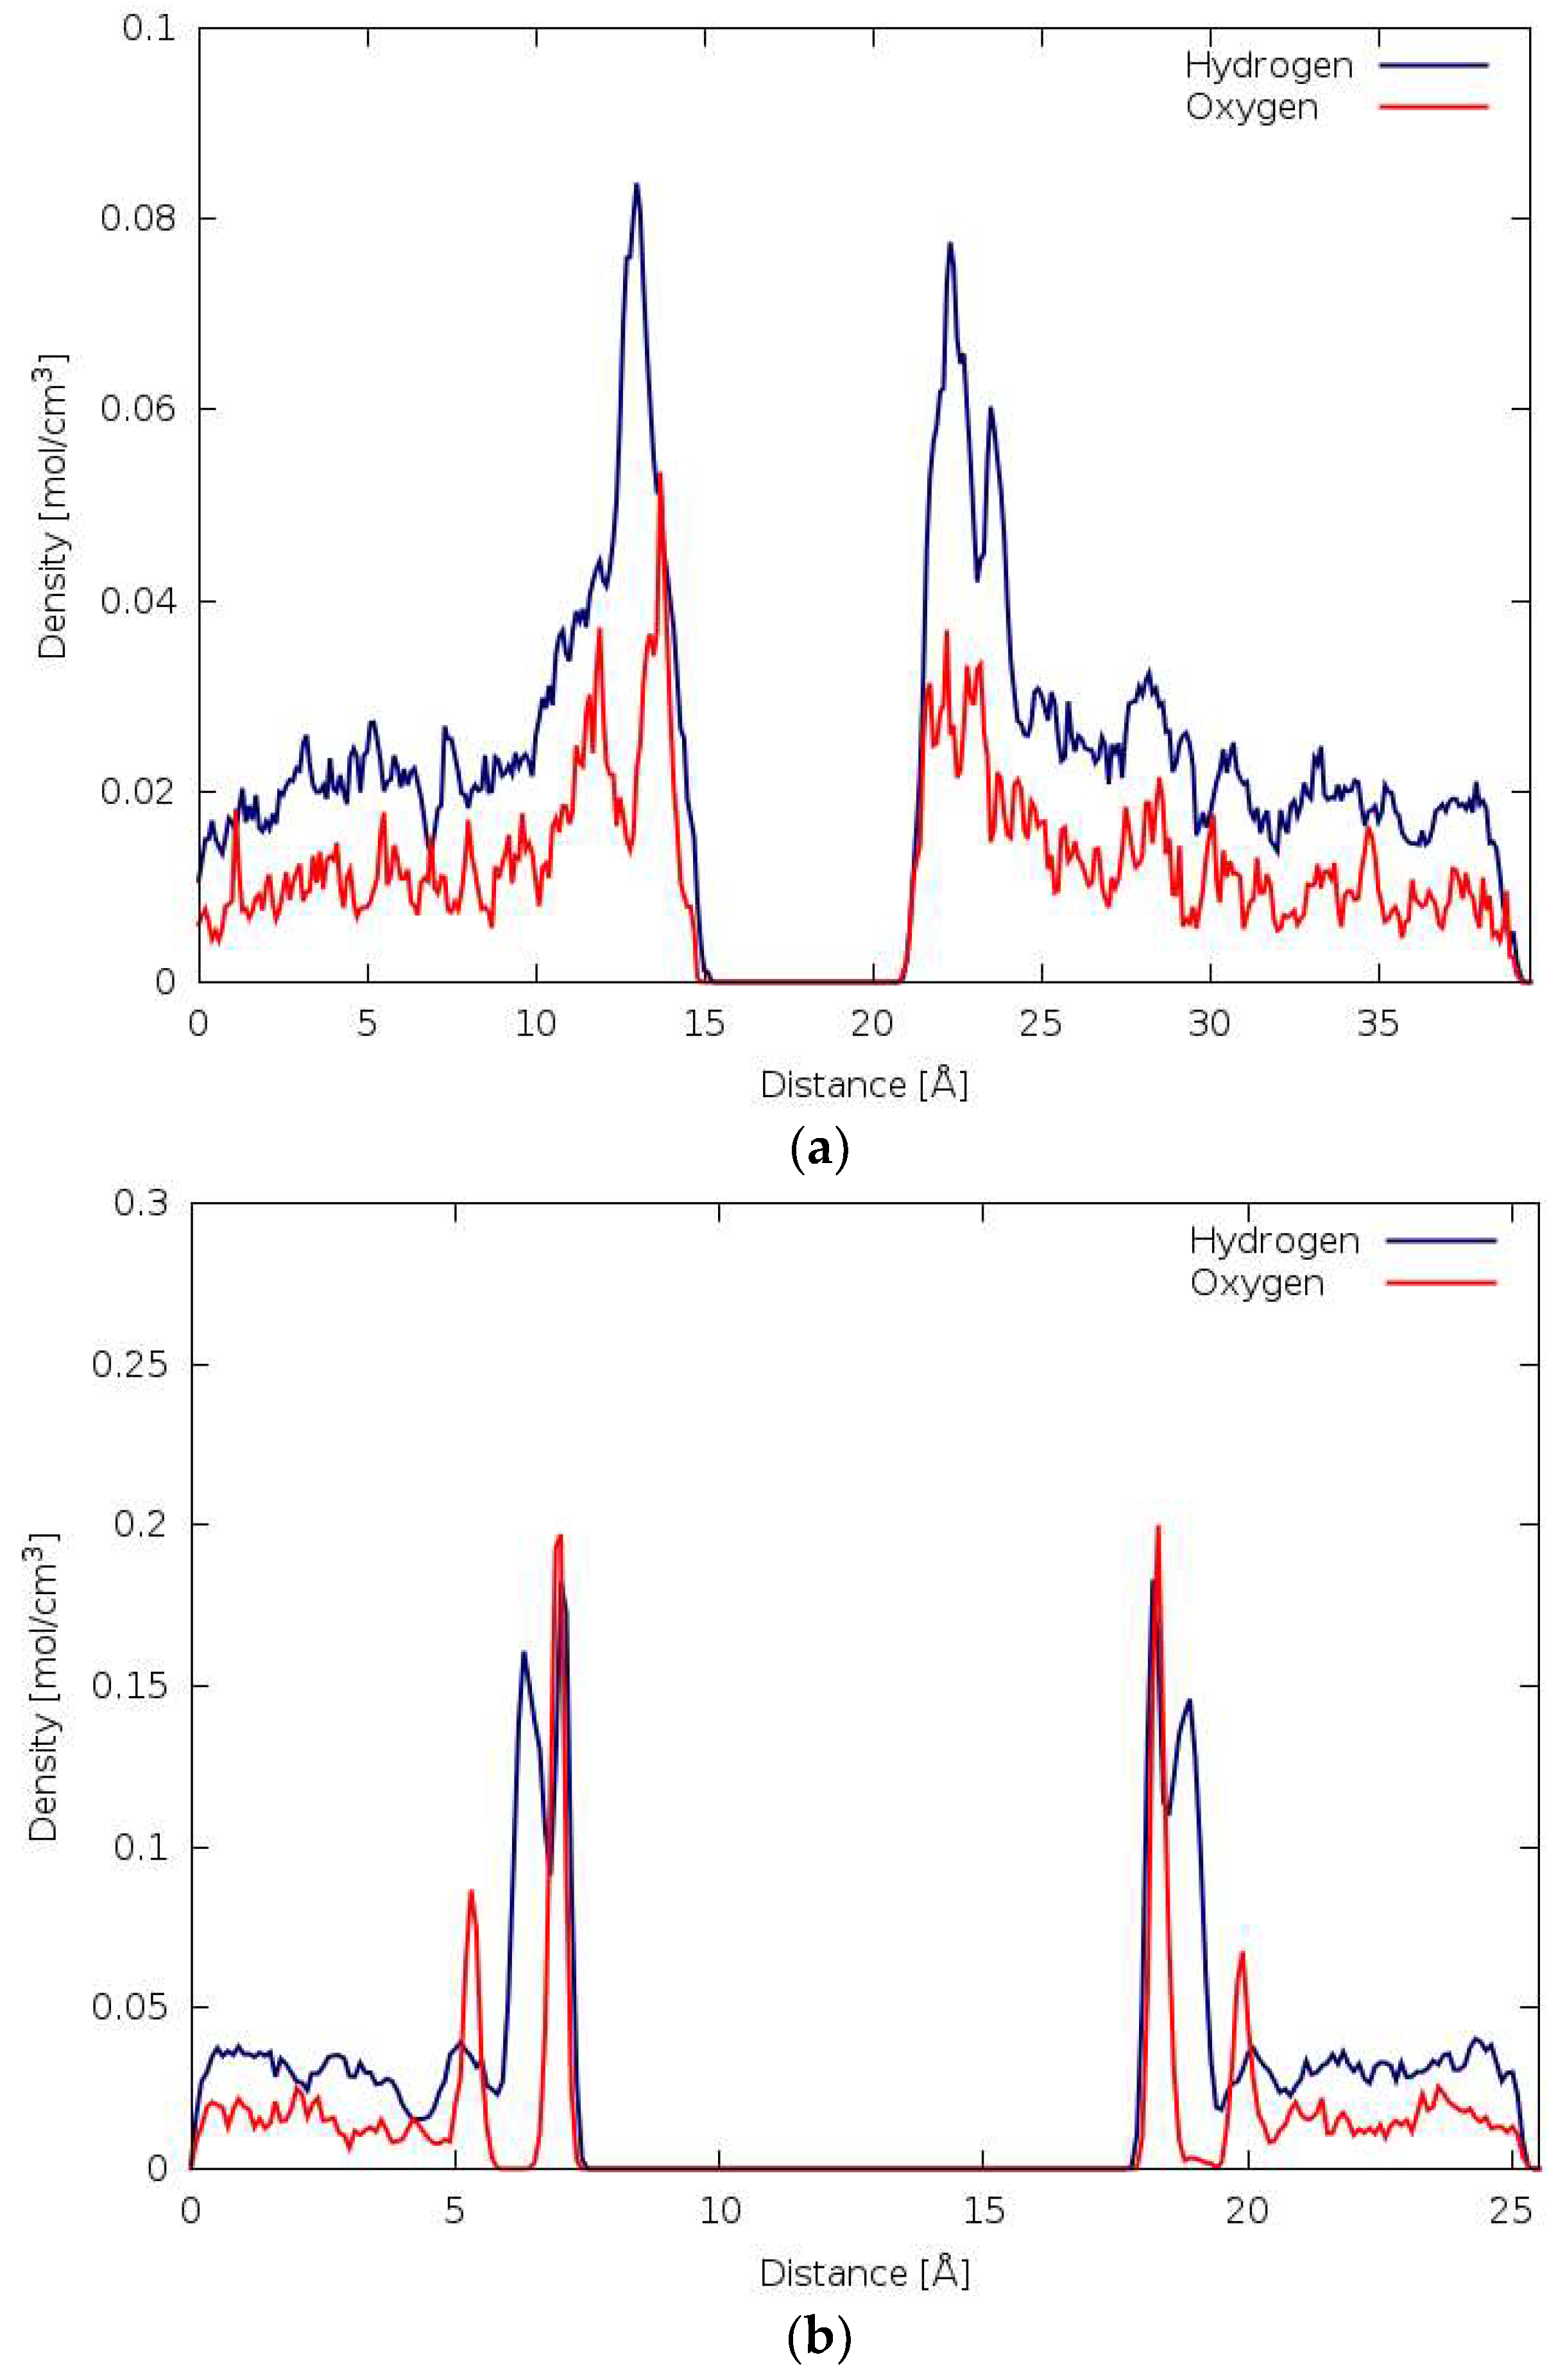
Figure 3 shows the molar (i.e., not mass-weighted) density of water oxygen and hydrogen atoms at the anatase (101) and rutile (110) surfaces, respectively. The density profiles for the rutile (110) interfacial system (Figure 3b) show two definite, narrow oxygen density peaks at either surface, similar to Figure 1a, above, and corresponding to inner and outer layers. The hydrogen density is also arranged into two peaks; however, these are much broader than the oxygen peaks. The inner hydrogen density peak is bifurcated, with one sub-peak at the same position as the oxygen peak and the other, smaller sub-peak slightly further away from the surface. This suggests that adsorbed water molecules have an O H bond roughly parallel to the slab surface. Conversely, the anatase (101) density profile (Figure 3a) is less structured, showing only one peak adjacent to either side of the surface slab and a gradual drop in density thereafter.

3.4. DFT

Due to the small size and limited duration of these trajectories, it is quite difficult to assess the extent of layer formation. Figure 4 shows the density of water molecules along the z axis of the rutile/water system.
This density profile is in good agreement with Figure 1a and Figure 3, albeit with a lower overall density. Pronounced first and second layers formed; the density of the first layer at the rutile interface is approximately four times greater than the density in the middle of the space between slab surfaces. A second layer can also be clearly observed, with near-zero density observed between the first and second layer, which speaks to strong physico-chemical adsorption at the surface.

3.5. Hydrogen Bonding

Hydrogen bonding has a significant influence on the structure, dynamics, and reactivity of water molecules in the vicinity of a metal–oxide interface. Hydrogen bonding is also a property that is notably difficult to predict accurately using atomistic simulations, and many software implementations use explicit parameters to better reflect experimental properties. None of the simulations presented in this paper used explicit hydrogen bond terms, in order to assess the performance of the methodology independently of the performance of the hydrogen bond term. For the purposes of this paper, hydrogen bonding is defined using the Luzar–Chandler criteria [49].

3.6. Forcefield MD

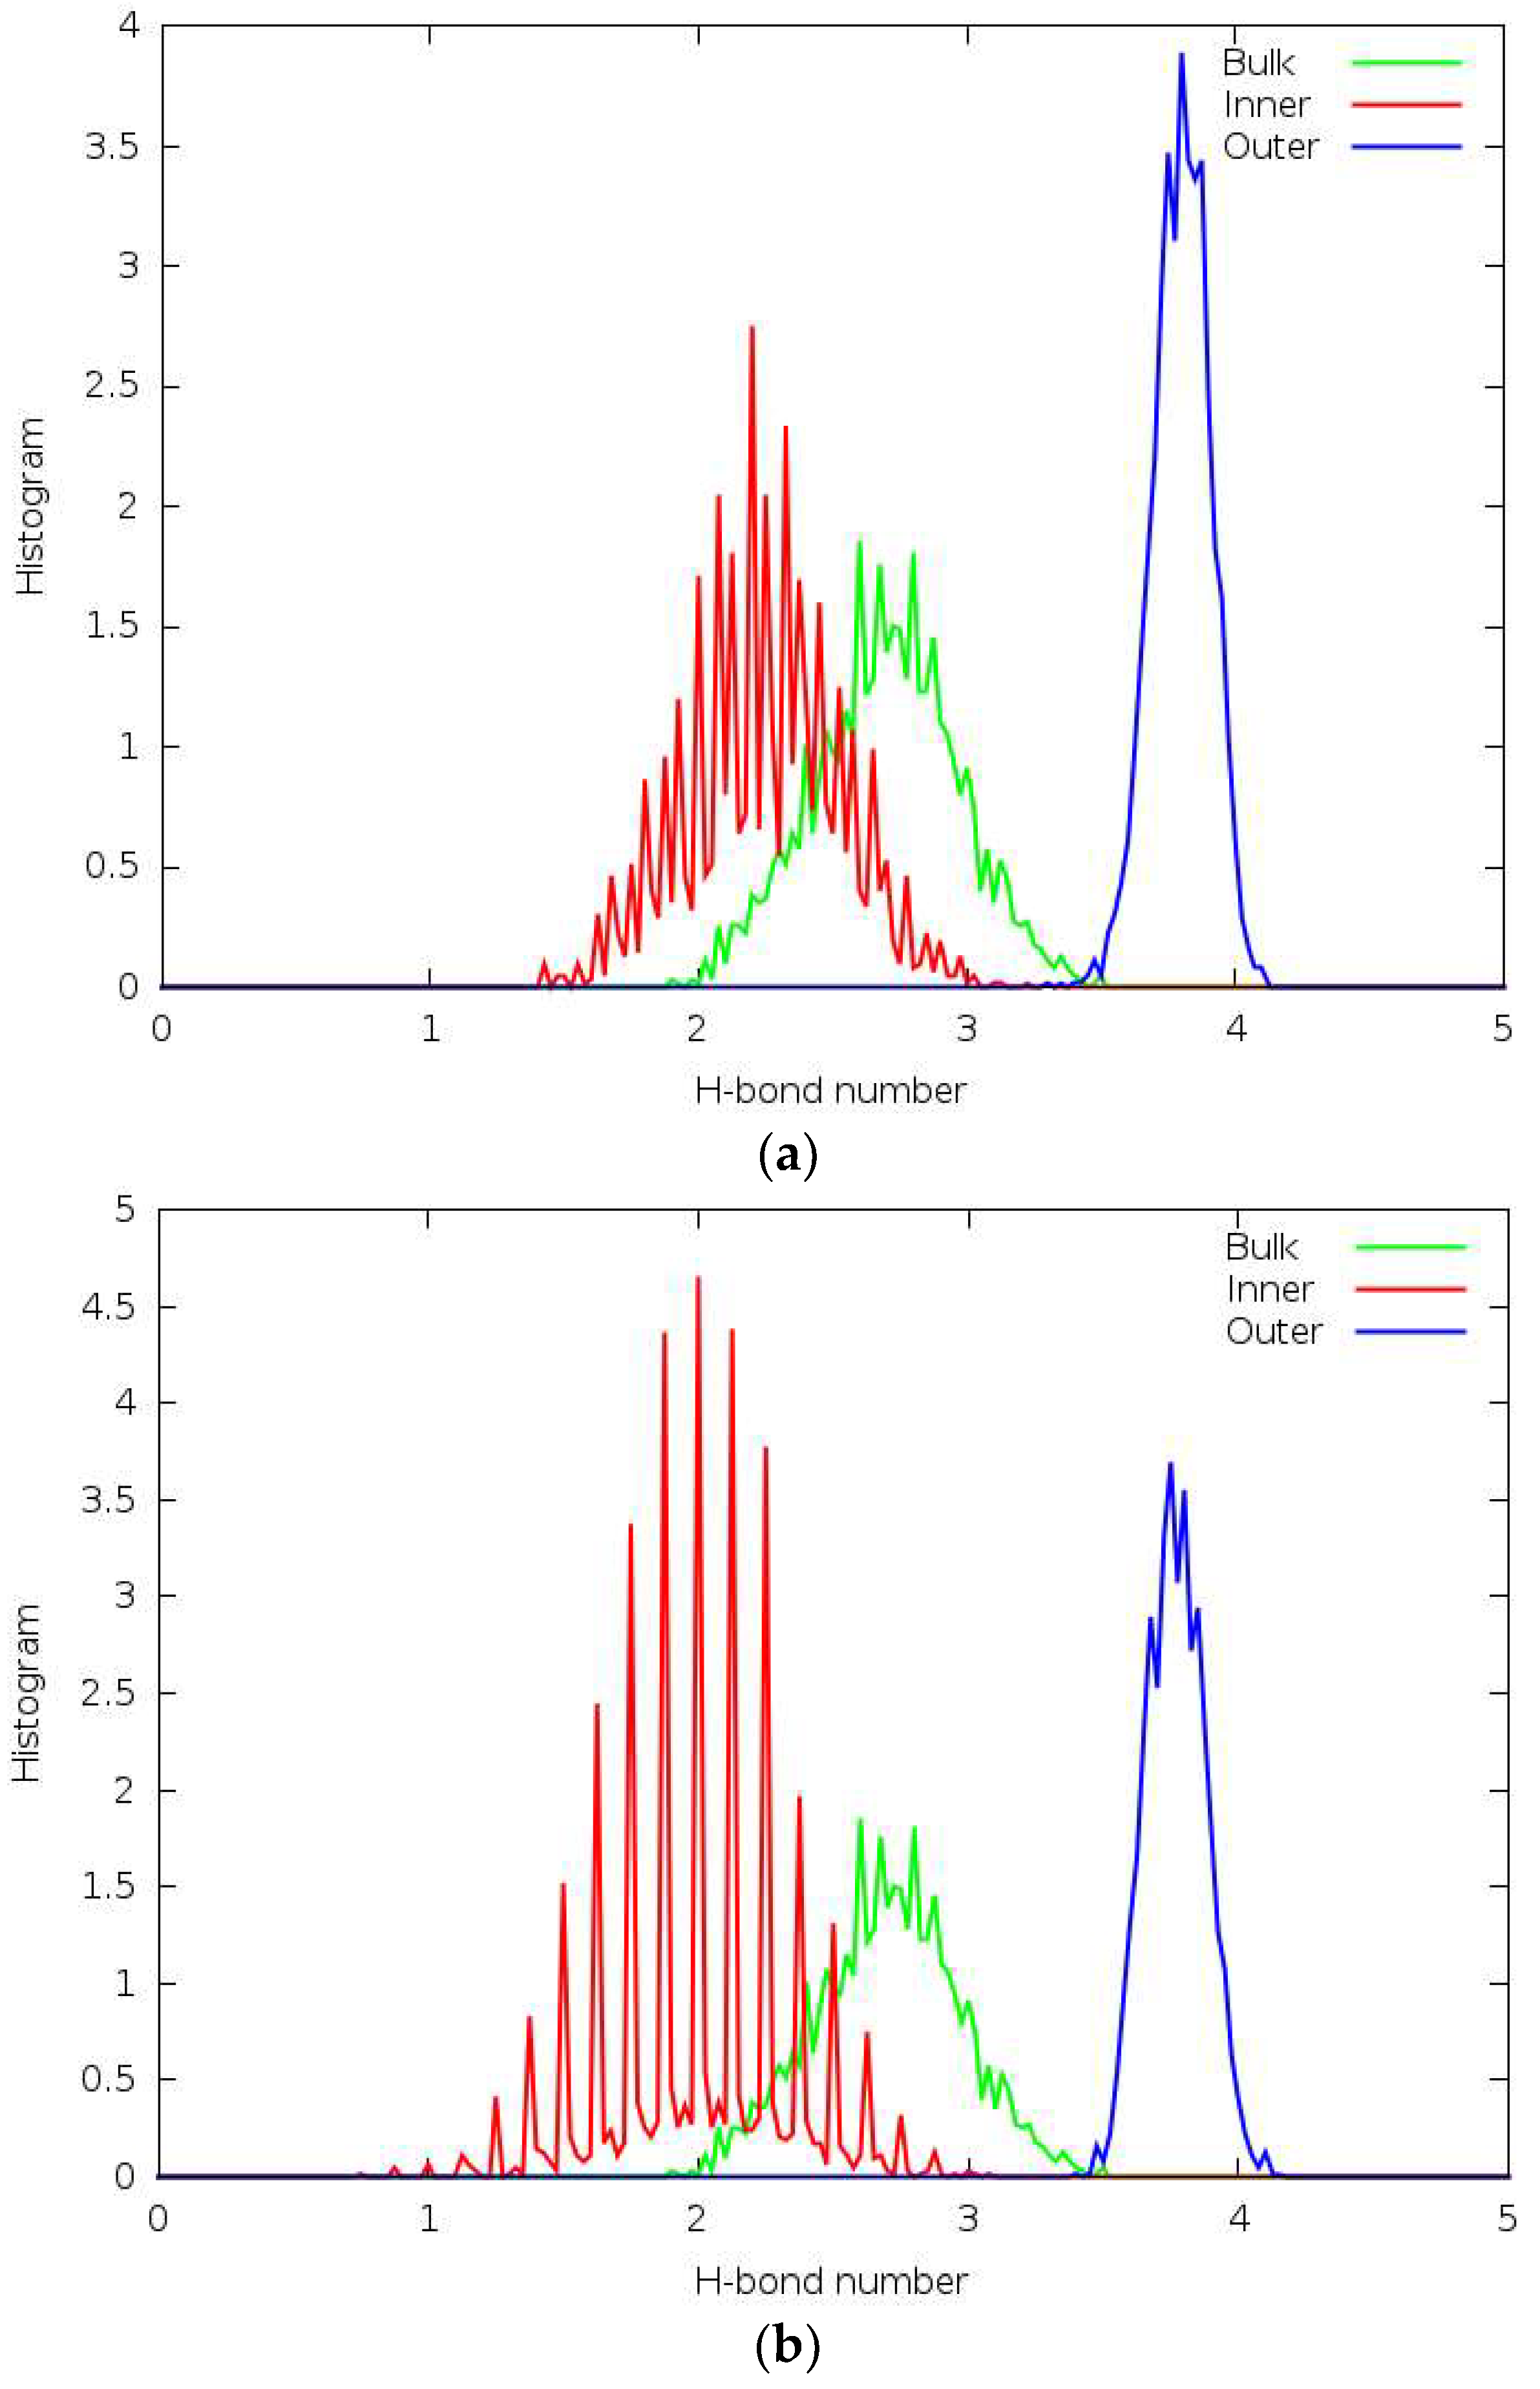
Figure 5 shows the average number of hydrogen bonds per molecule in the inner and outer layers, as well as the bulk, for the forcefield MD systems. It was found that, on average, water molecules in the inner layer typically had between 1.0 and 3.1 hydrogen bonds, depending on the surface; the very “spiky” shape of the distributions is due to the small sample size of inner layer molecules (31 molecules for anatase (101) and 16 for rutile (110)) and the low mobility of the molecules, causing the average number of hydrogen bonds to not change much over the simulation. As the 1AL at both interfaces is immediately adjacent to the TiO2 surface, it is not unexpected that molecules in the 1AL have approximately half the average number of hydrogen bonds as those further away from the surface.
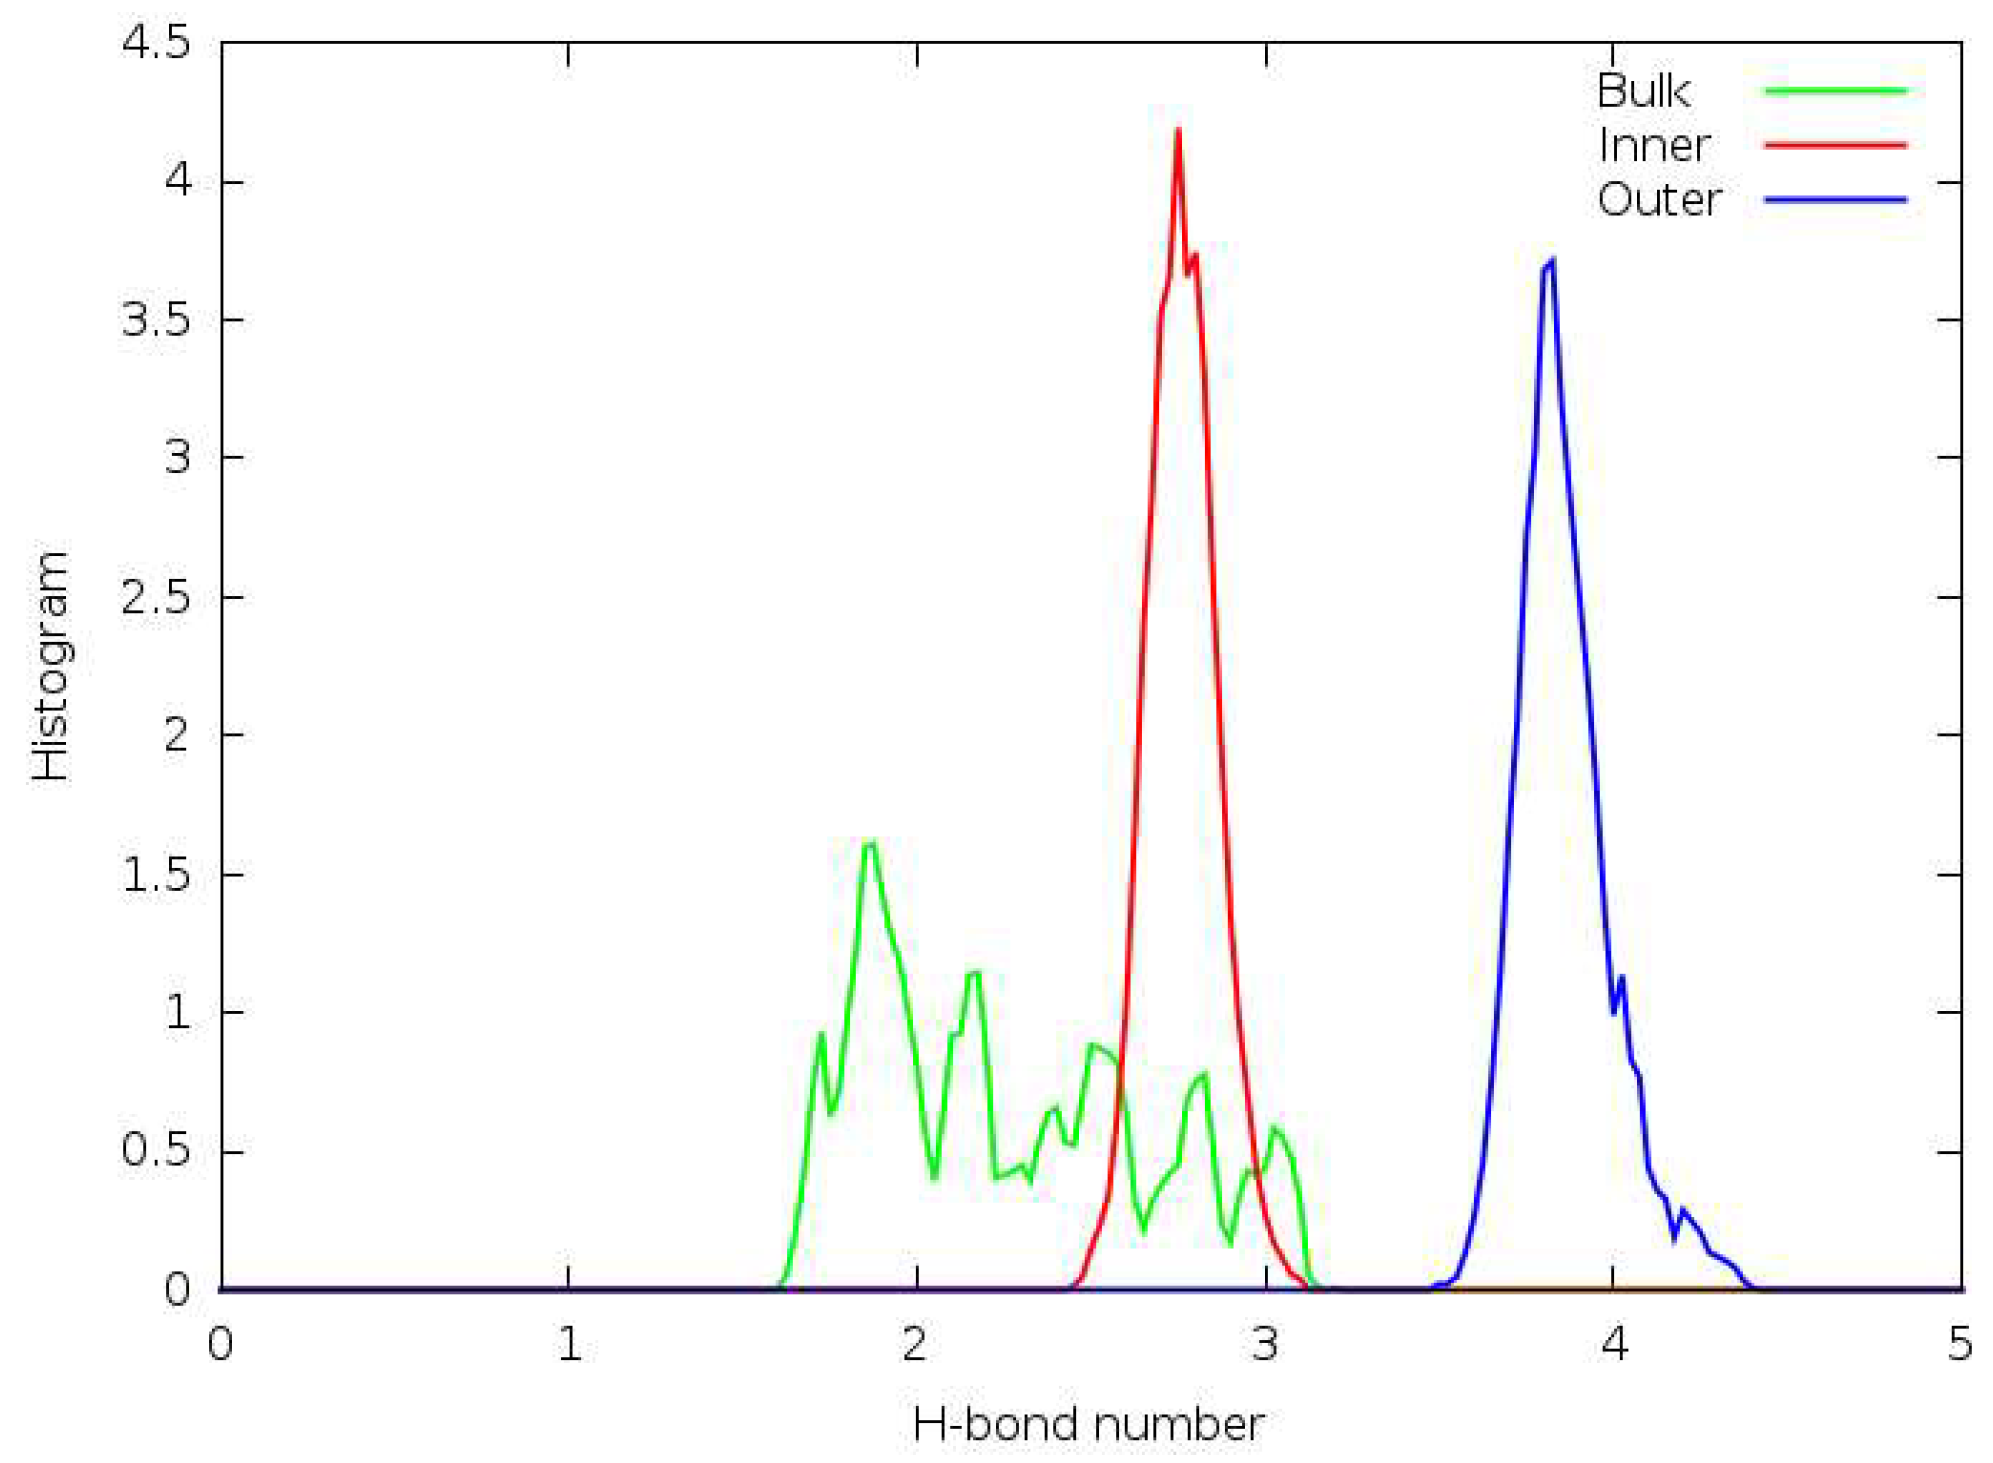
The hydrogen bonding régime observed at the rutile (110) service using ReaxFF was notably different from that observed using classical MD; see Figure 6. In this system, bulk water molecules had between 1.6 and 3.1 hydrogen bonds, and the distribution was not close to normal, as in the classical systems. Conversely, both layers had narrow, almost normal distributions centred on 2.8 and 3.9 hydrogen bonds for the inner and outer layer, respectively. The difference between classical and reactive MD is very apparent in this case, and it is likely that the change in the number of hydrogen bonds per molecule in the layers is due to the dissociation of water molecules close to the surface, creating a more “flexible” environment conducive to the formation of energetically favourable hydrogen bonds.
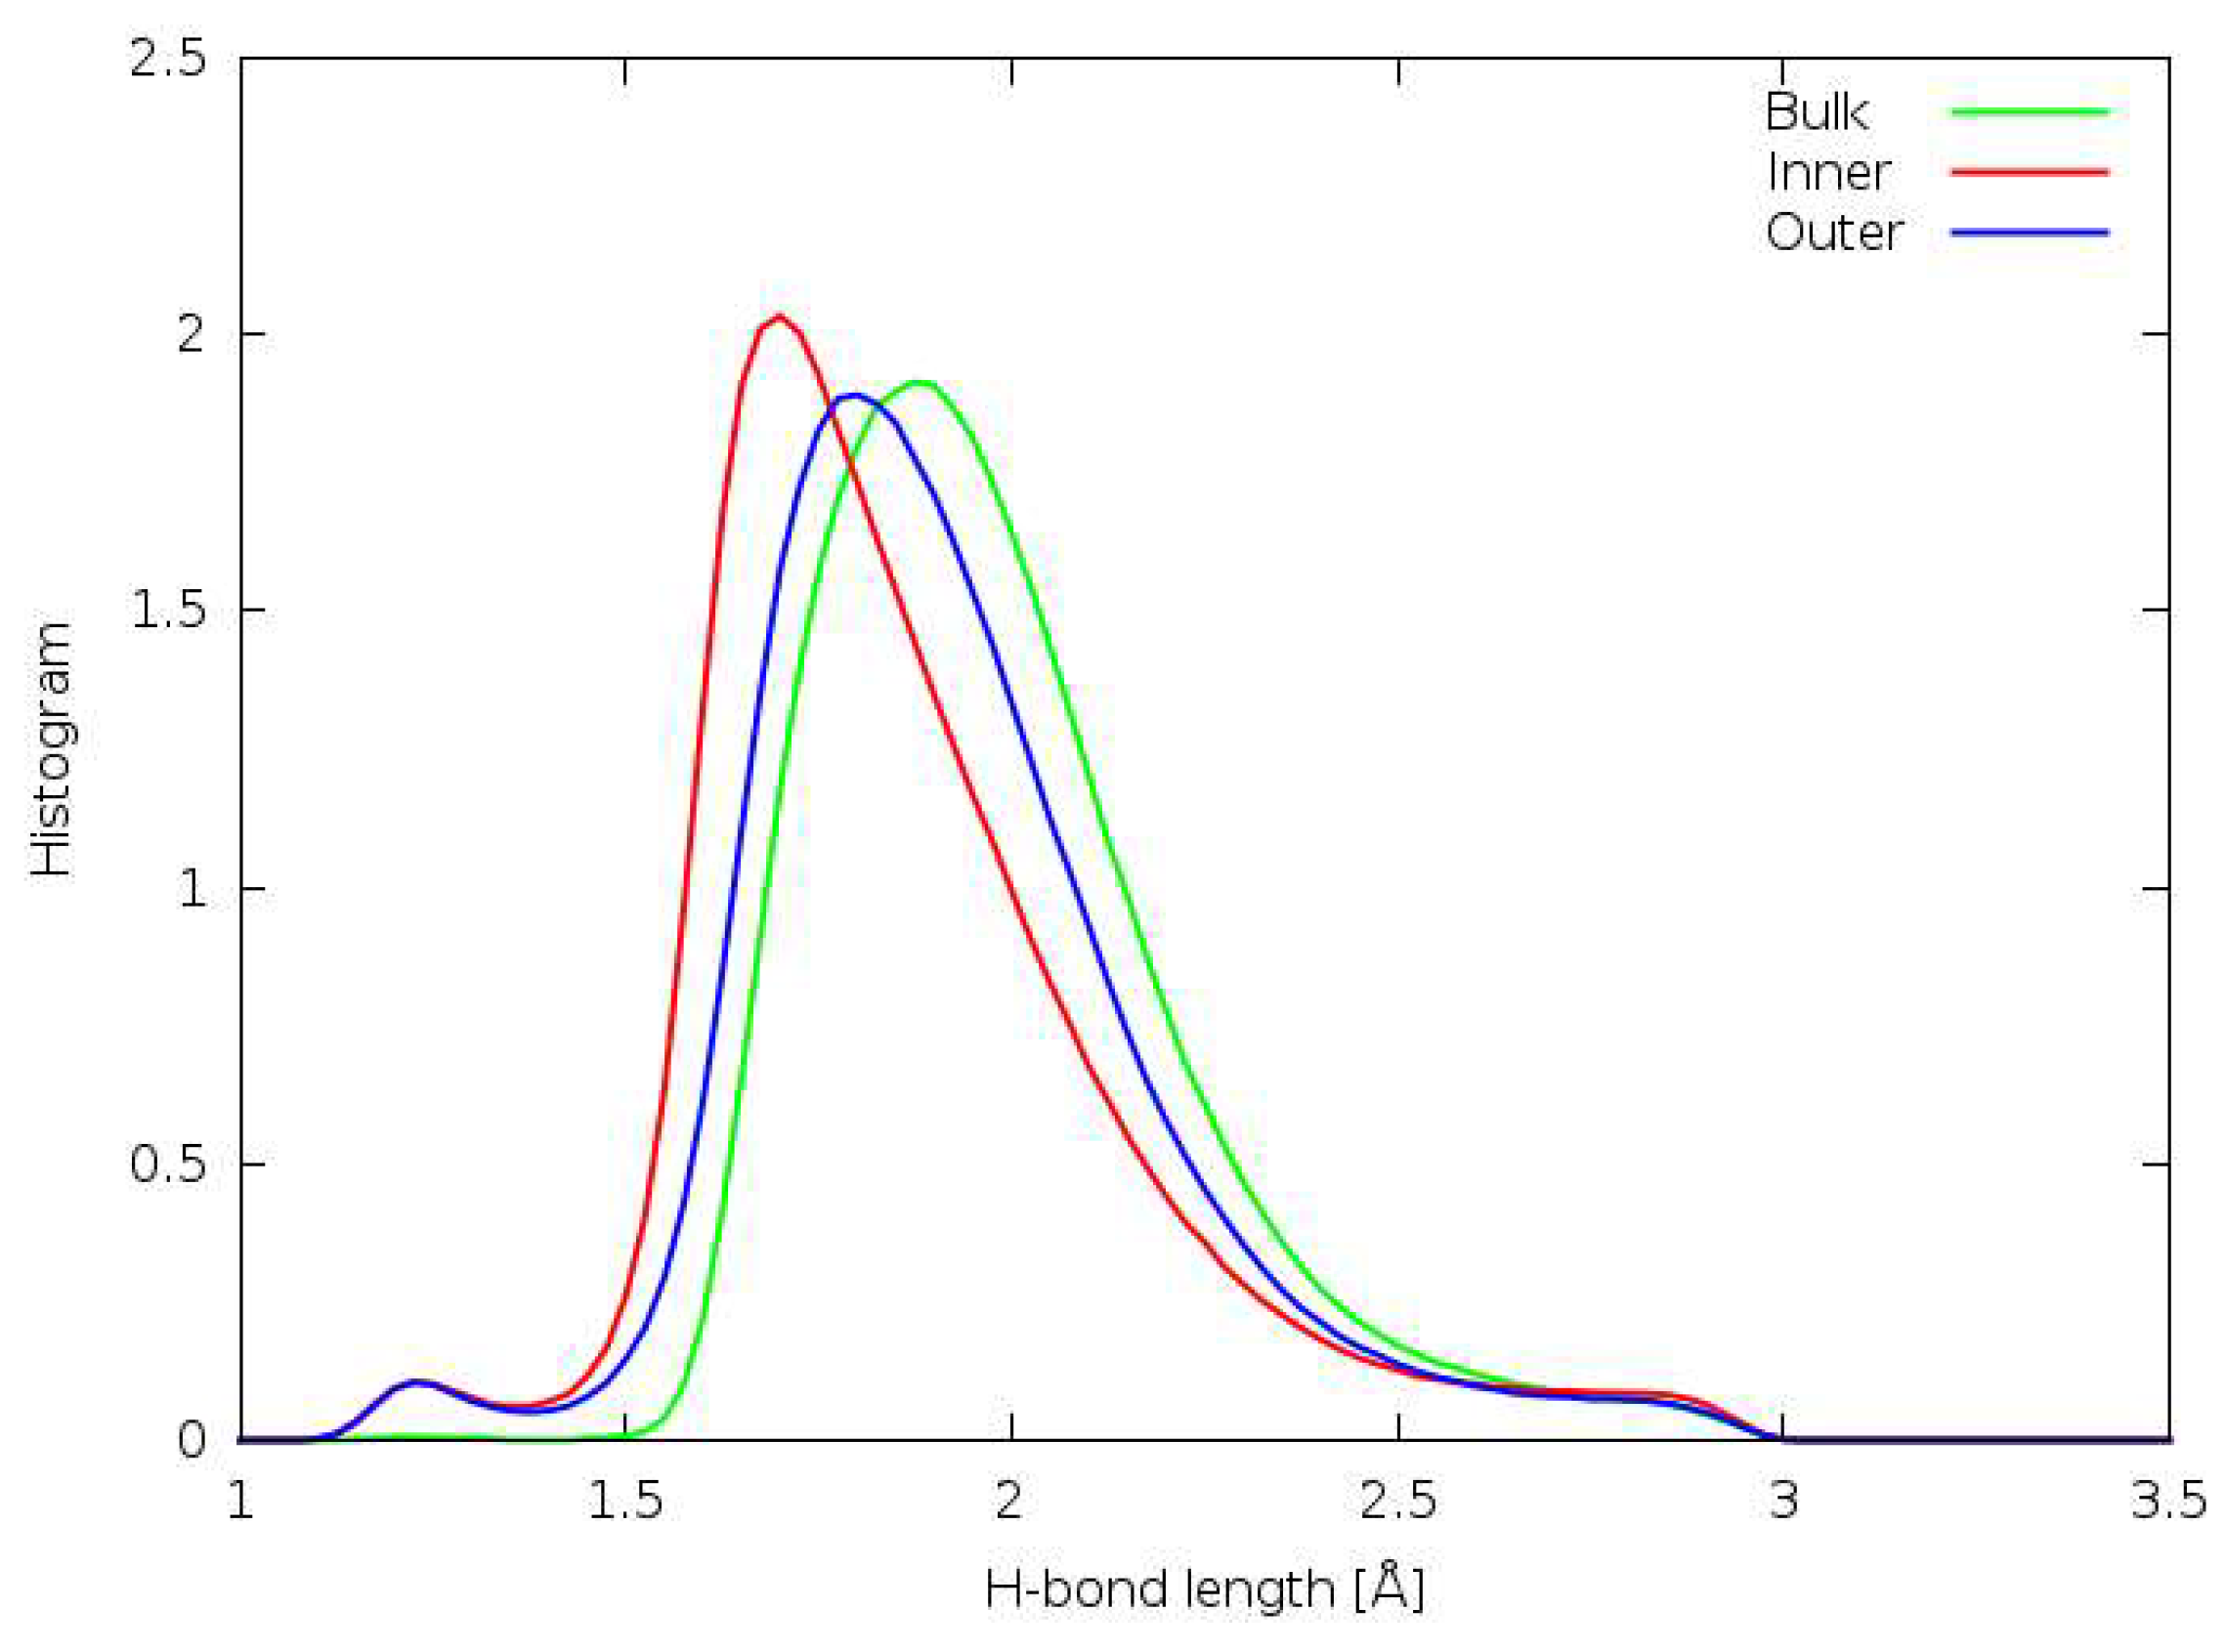
Figure 7 shows the distributions of hydrogen bond lengths in the interfacial systems. In both systems, the mode bond length was approximately 1.65 Å in both the layers and the bulk; however, in the layers the distribution was much narrower, i.e., there was less variance in the bond length. The inner and outer layer distributions were nearly identical (Figure 8), which suggests that this was not solely a result of increased density. Using ReaxFF, the mode bond length for inner layer molecules was also approximately 1.65 Å; however, the bulk and the outer layers had slightly longer bonds at the mode, being approximately 1.75 Å and 1.85 Å, respectively.

3.7. DFTB

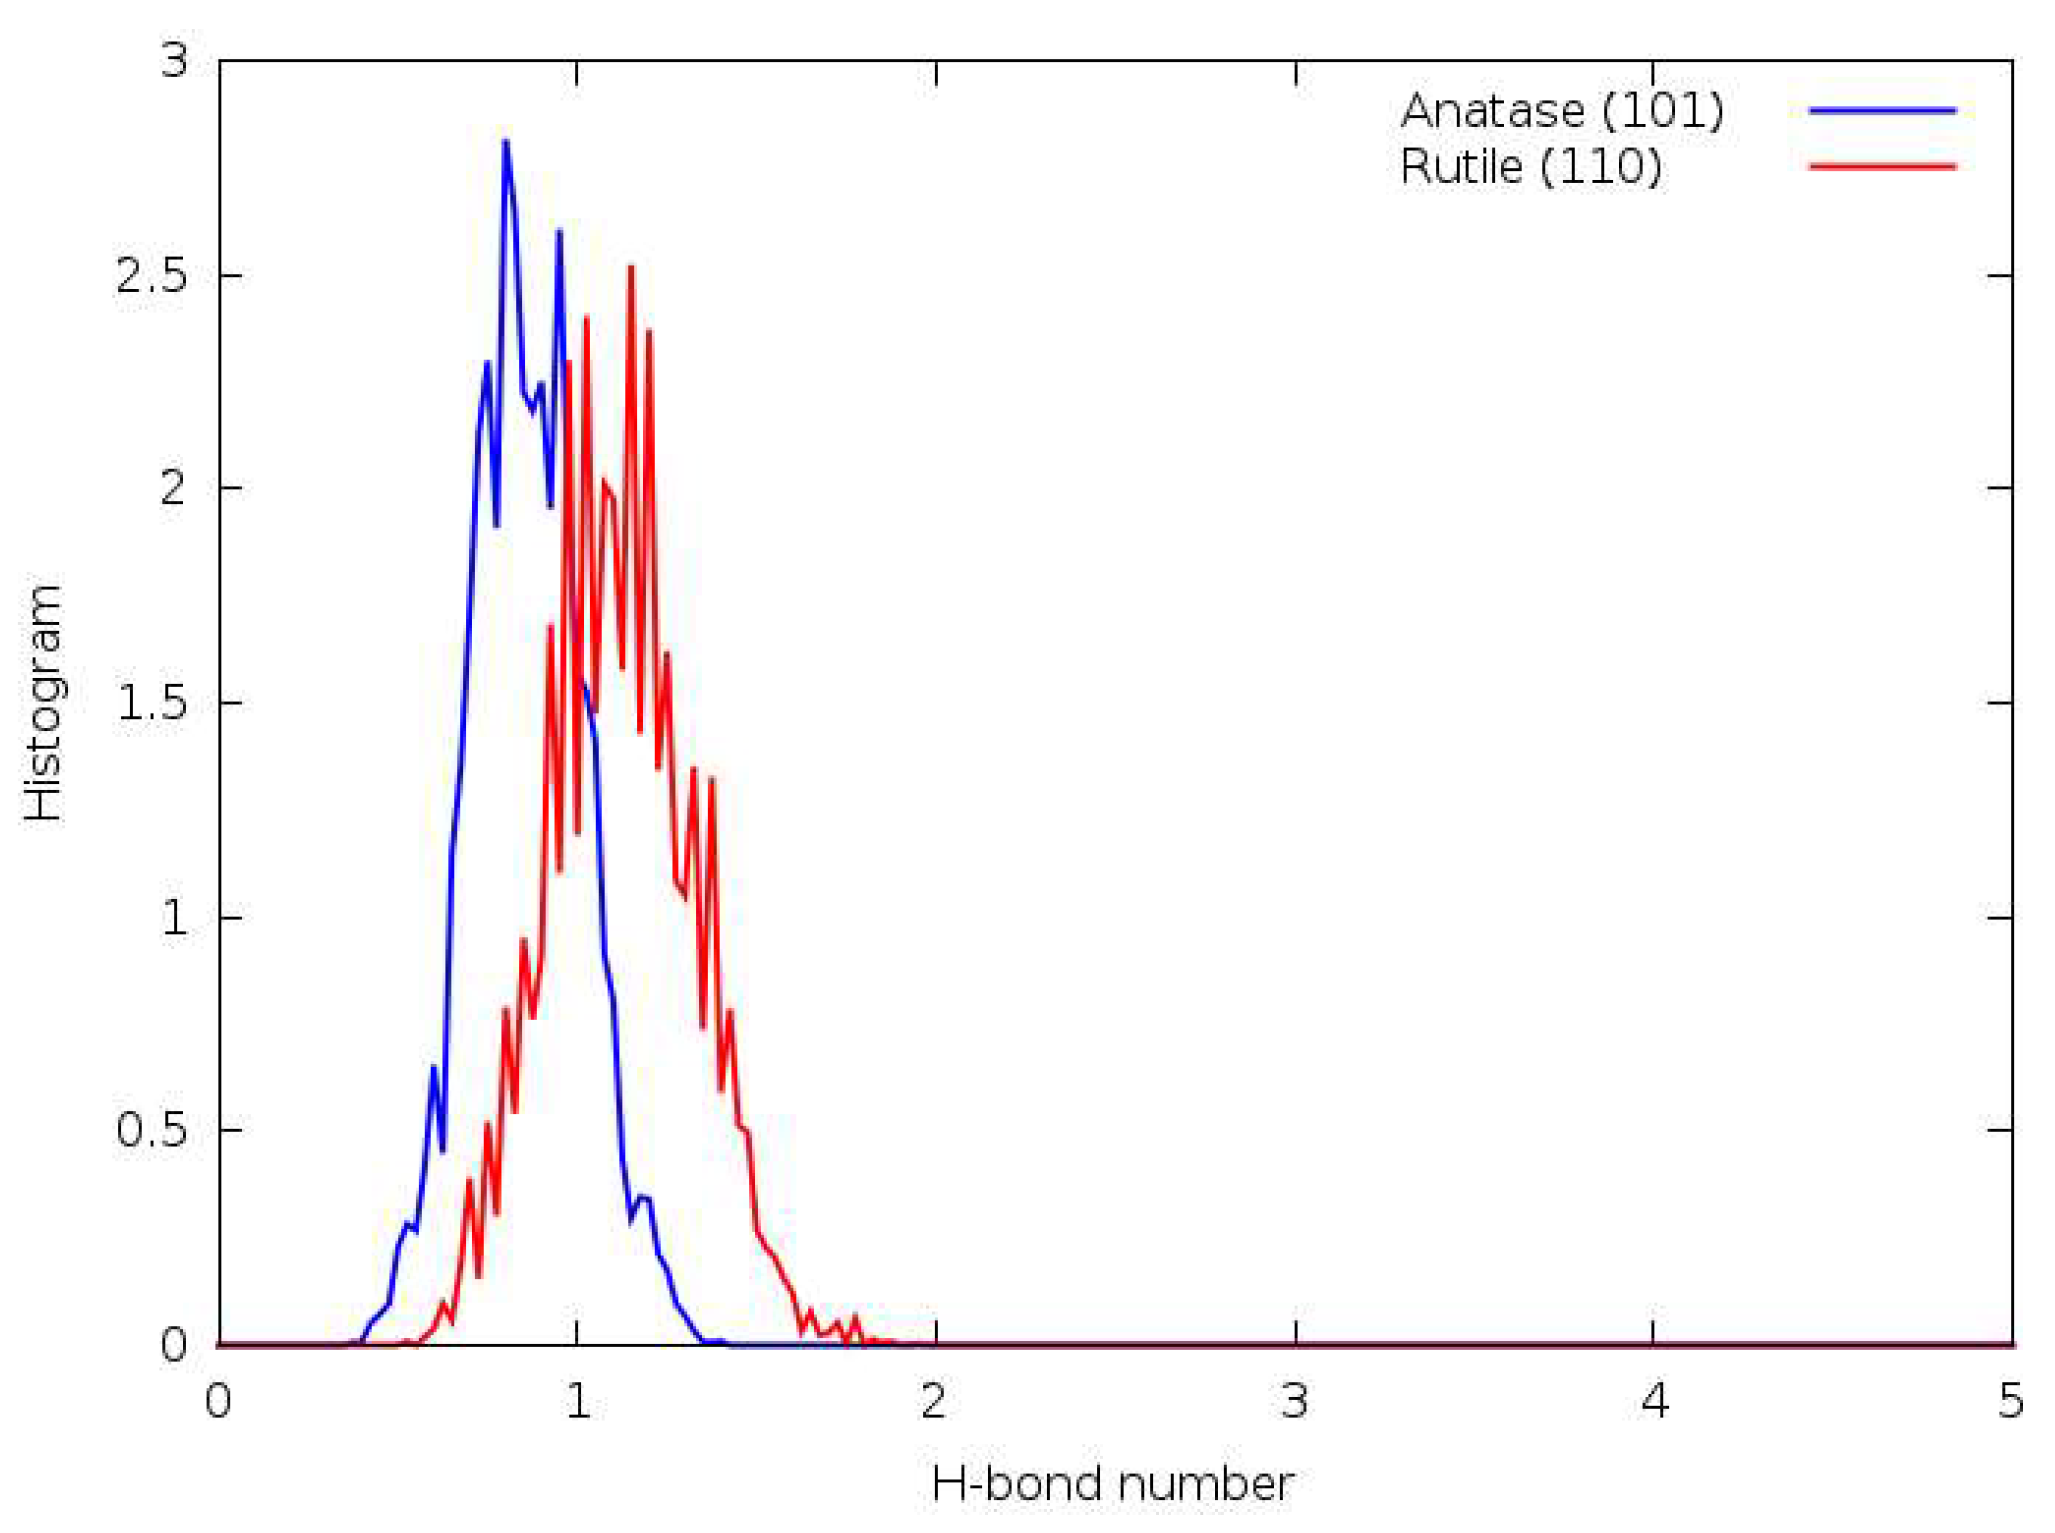
Hydrogen bonding in the systems modelled using DFTB was dominated by the low water density of the systems, and their predilection to dissociate at TiO2 surfaces. Figure 9 shows the distribution of average hydrogen bond numbers in the nanoparticle, anatase (101) and rutile (110) systems.
The average number of hydrogen bonds per molecule was less than two at the interfacial systems, and there was no apparent difference between molecules close to the surface (i.e., layered molecules) and those further away. This is a notable deviation from the behaviour in the larger, classical MD system, where only the inner layer molecules had fewer than two hydrogen bonds and bulk-like molecules had approximately 3.5, and also the reactive MD system, where layered molecules had between three and four hydrogen bonds. Similar to Figure 5, the notably “spiky” shape of the interfacial distributions was an artefact of the small sample size and short trajectory in these systems.
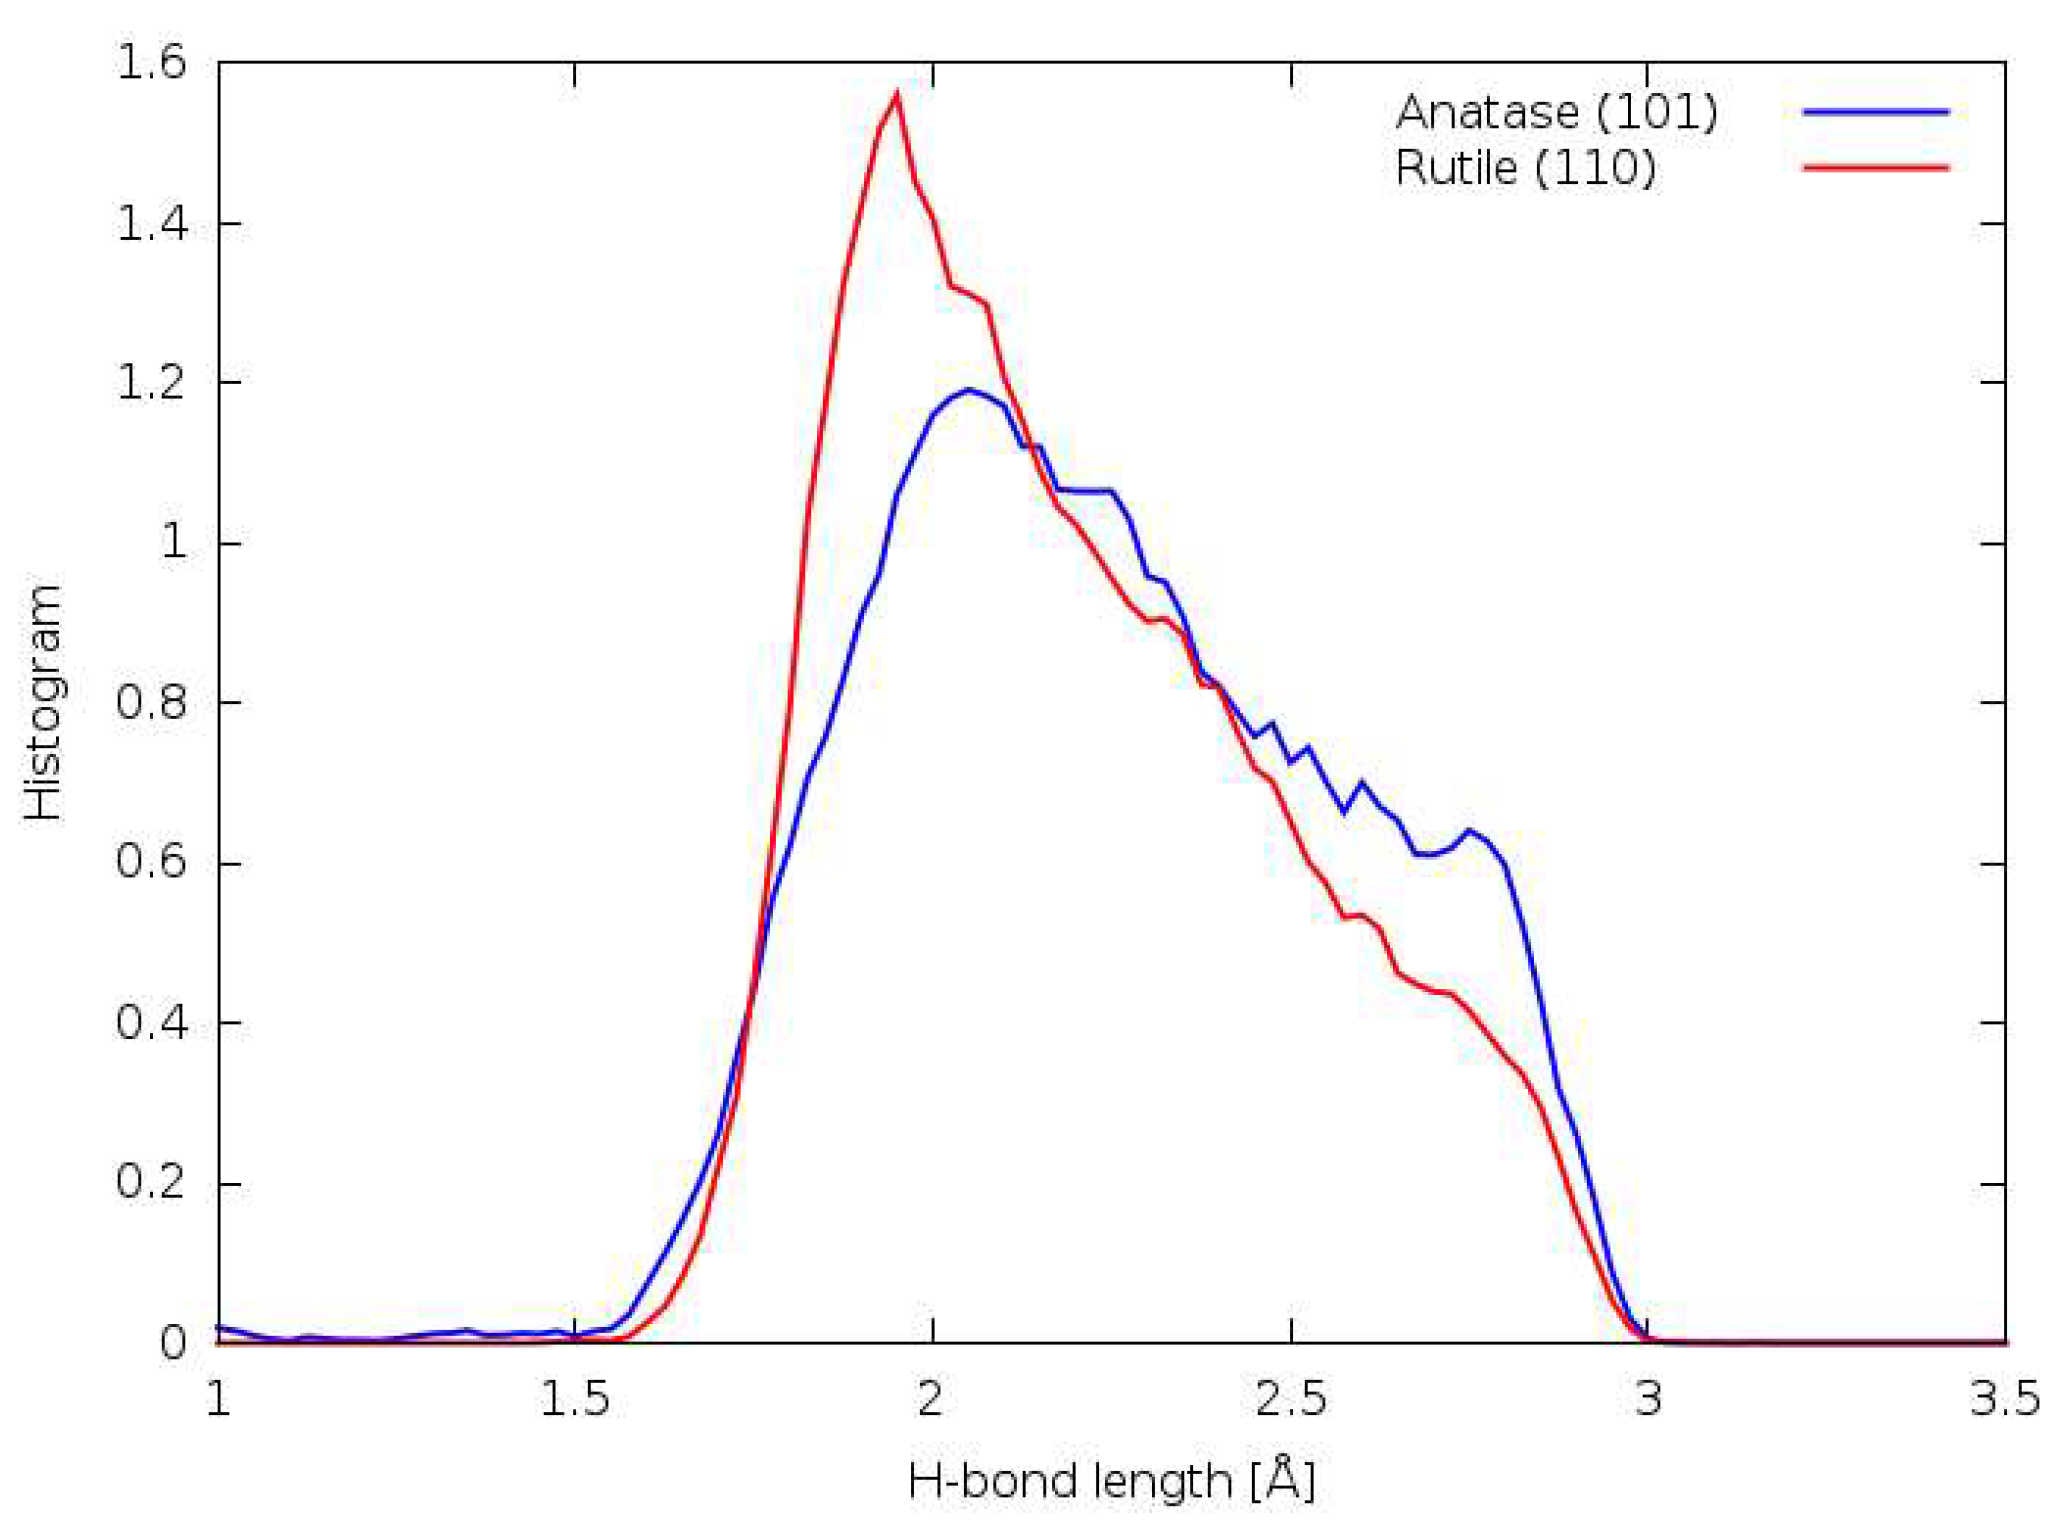
Figure 10 shows that the average length of hydrogen bonds also varies between the systems. In particular, the nanoparticle system, anatase (101) system and bulk water all had similar hydrogen bond length distributions, which were quite broad with a slight peak at approximately 2.1 Å. In contrast, the rutile (110) distribution had a sharp peak at slightly less than 2.0 Å and a slowly decaying right tail. This suggests that the inter-molecular structure in at least a subsection of this system (e.g., close to the surface) was relatively constrained compared to the other systems, which supports the hypothesis that the layering effect was much stronger in this system. These average bond lengths were still between 0.45 and 0.15 Å higher than those observed in the forcefield systems, respectively.

3.8. DFT

Using DFT methods, the distinction between intramolecular O-H bonds and intermolecular hydrogen bonds can become somewhat muddled, and there is instead a continuum of possible bond régimes as the electron density of the system rearranges itself. Thus, the geometric considerations imposed by the Luzar–Chandler conditions are important to distinguish between stretched O-H bonds (which are energetically unstable) and actual hydrogen bonds, which increase the stability of the system.
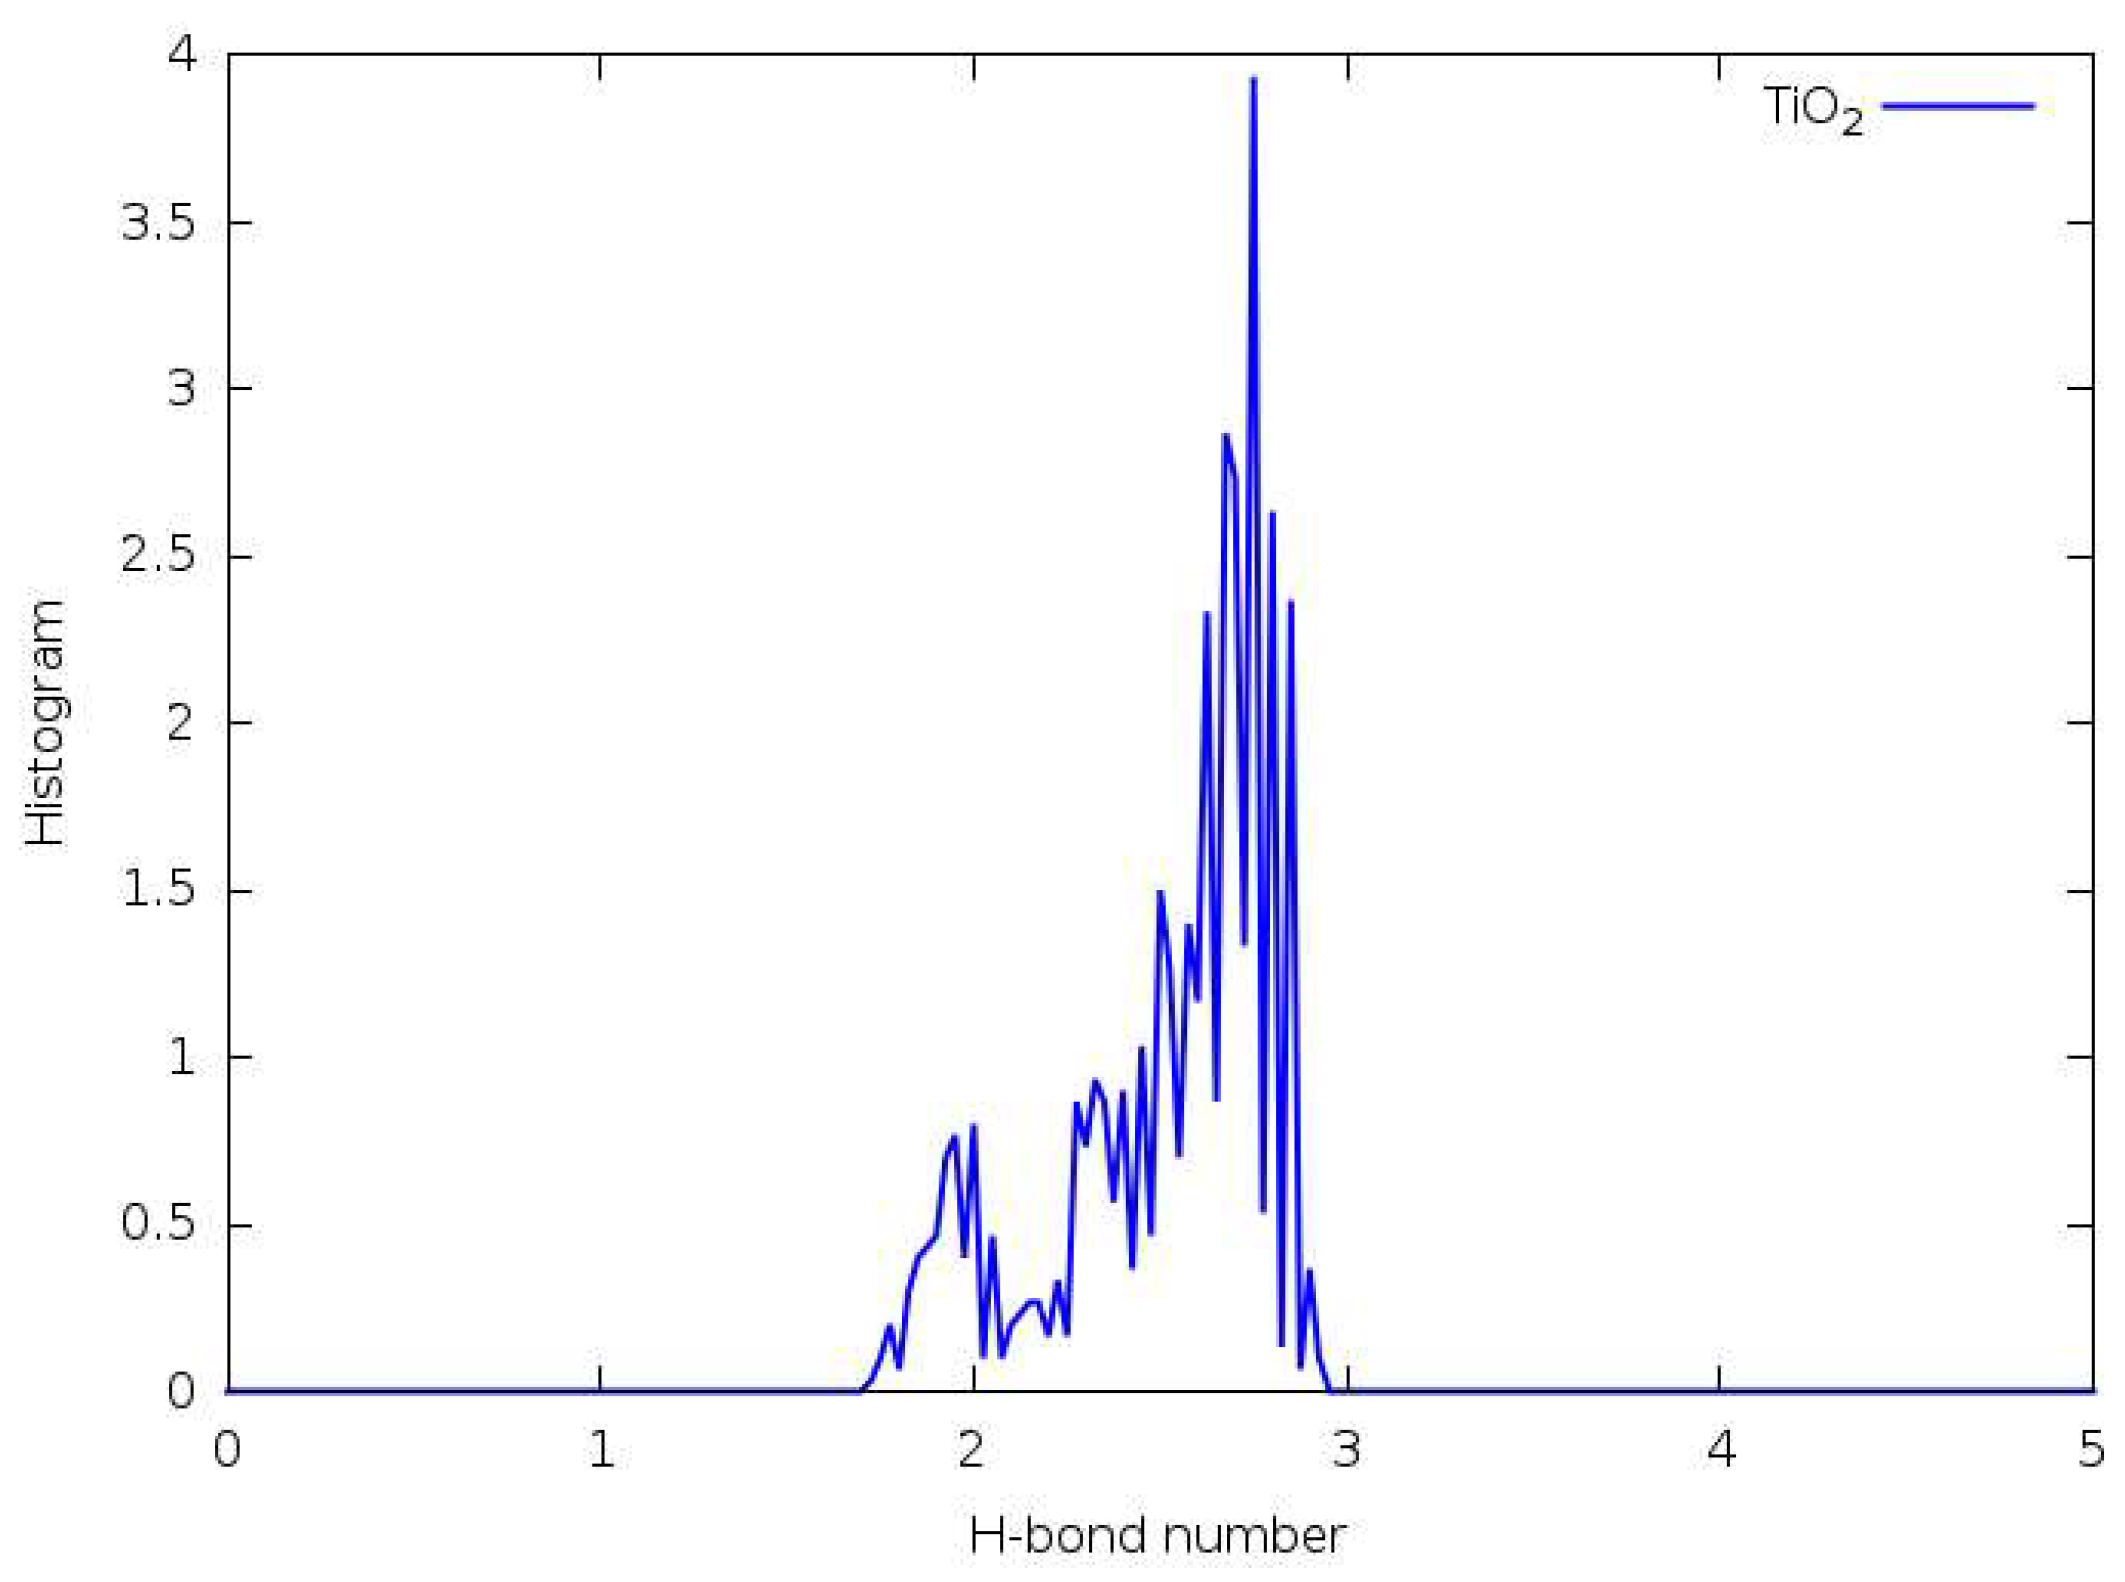
Figure 11 shows the distribution of average hydrogen bond numbers for all water molecules in the DFT system; c.f. Figure 5, above, which show the distribution for layered molecules. Unlike the “spiky” distributions in the previous figures, Figure 11 shows two distinct distributions: a small peak between 2.00 and 2.30 hydrogen bonds, possibly corresponding to a subset of molecules which adopt a stable 2 H-bond configuration for a significant proportion of the trajectory, and a single, irregular peak at 2.75 hydrogen bonds per molecule. The latter distribution is left-skewed and lies between 1.75 and 3.00 hydrogen bonds per molecule, which reflects the small size and lower density of this system.
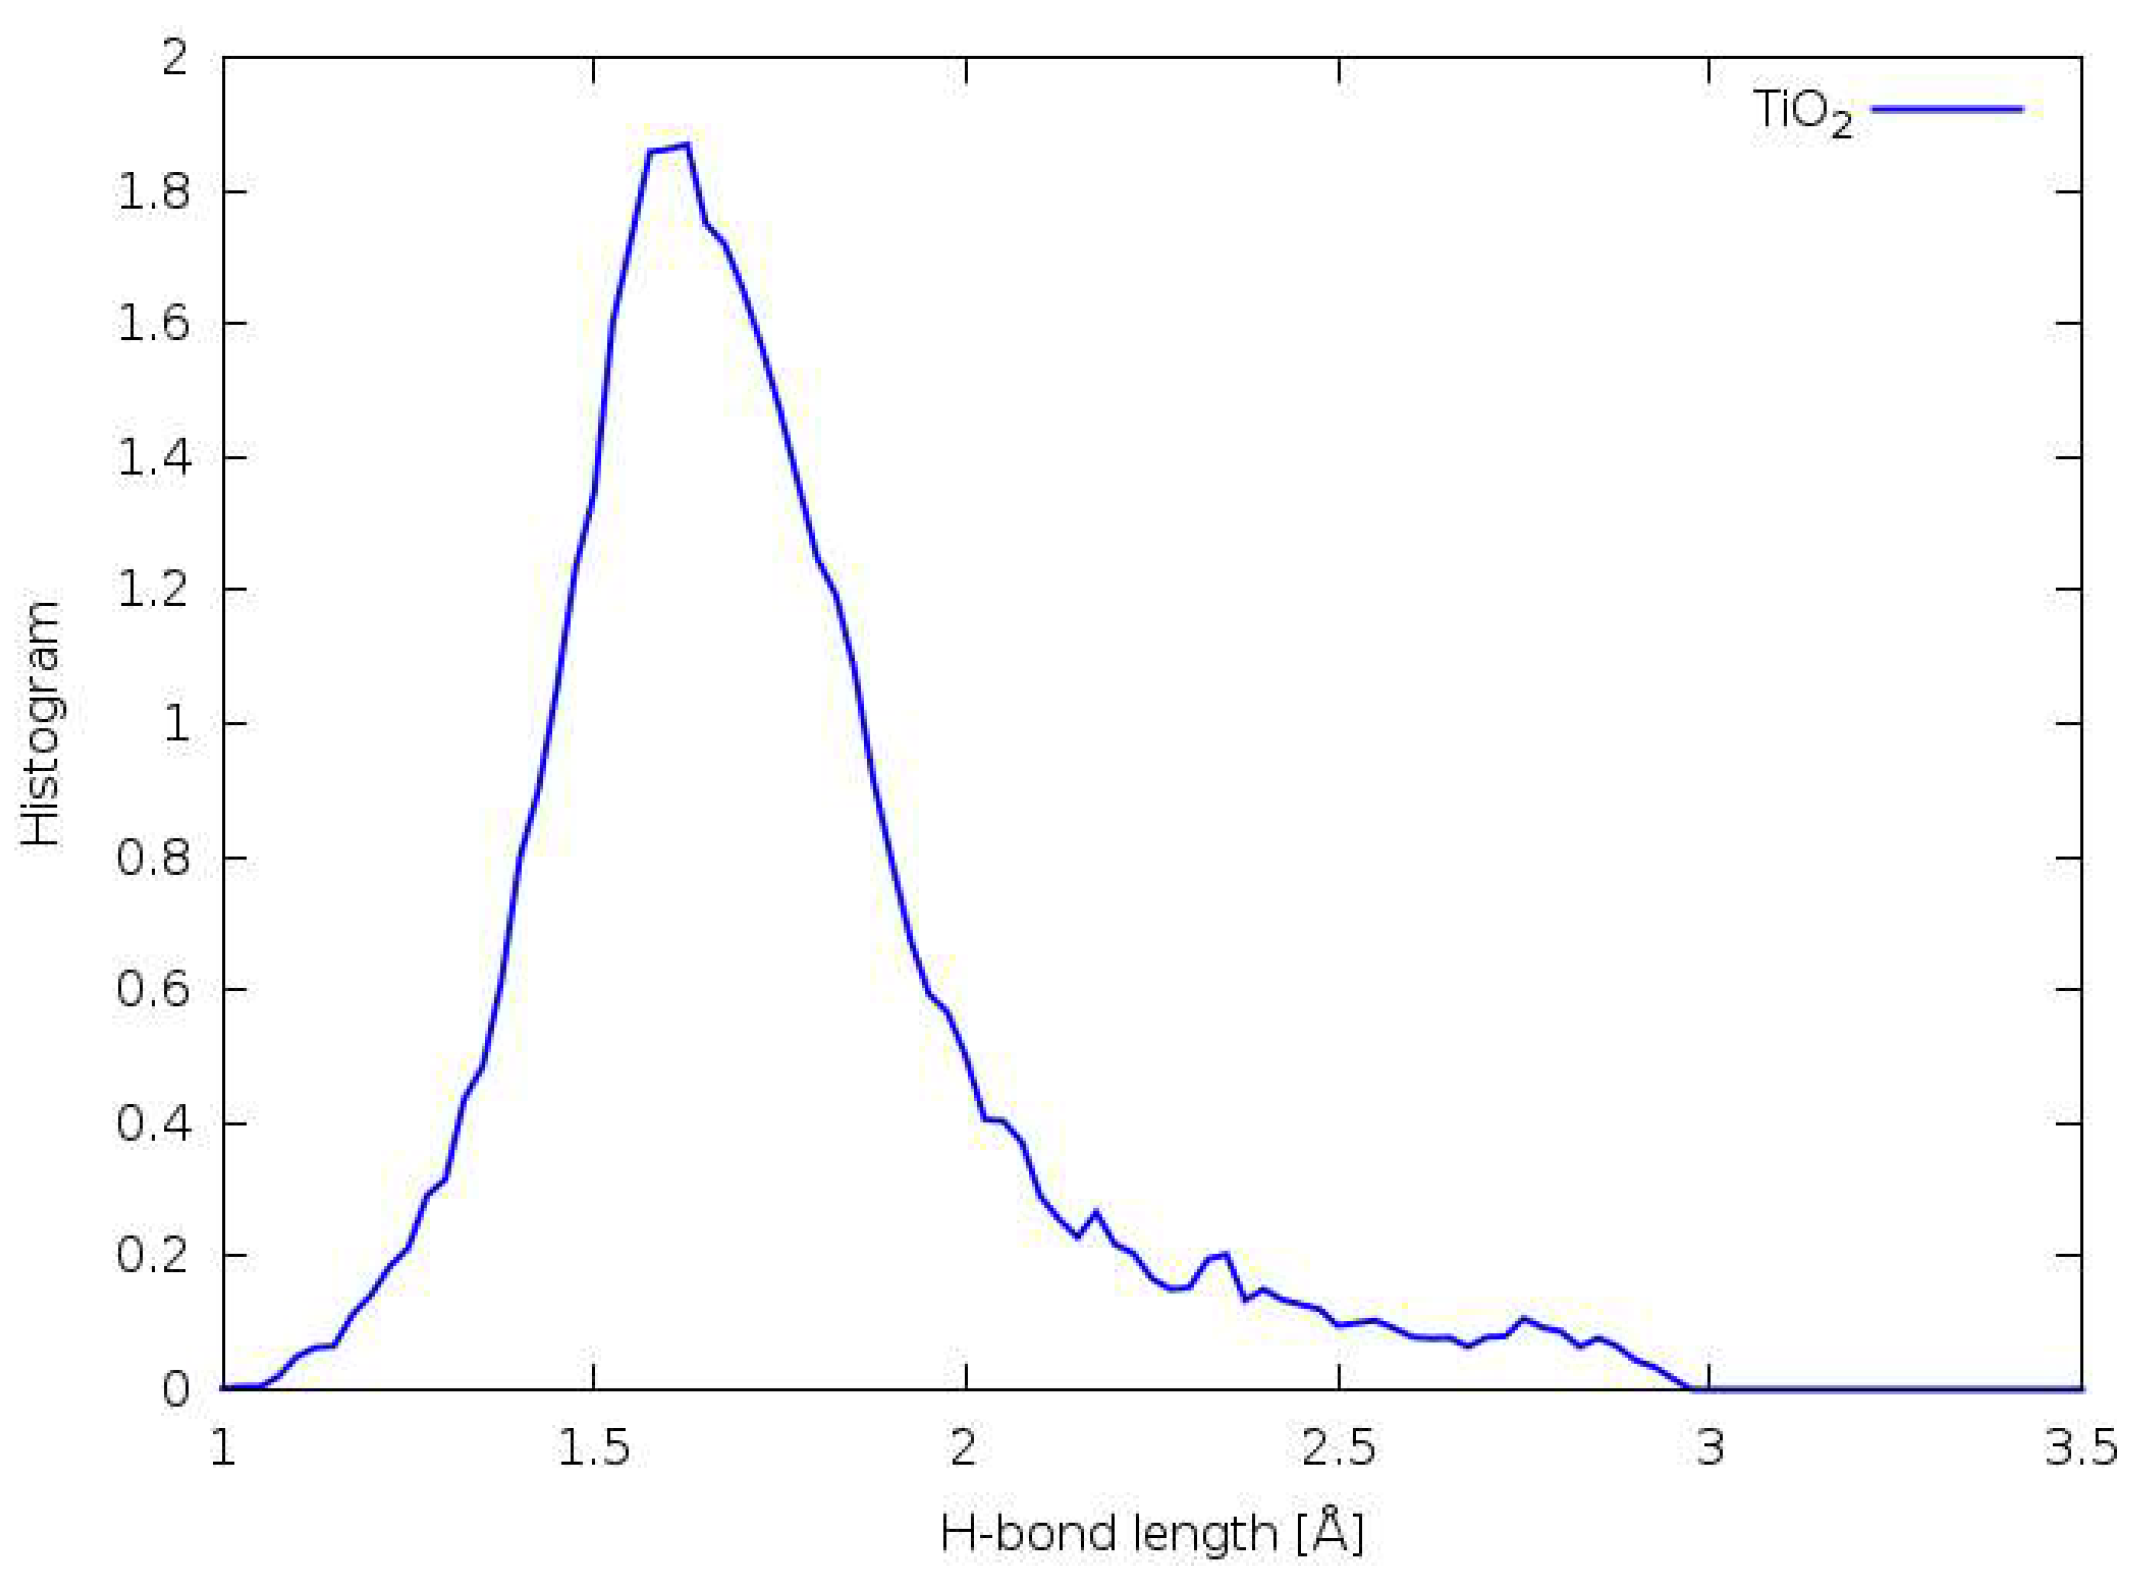
Figure 12 shows the distribution of acceptor–hydrogen bond lengths averaged over the 2 ps trajectory. As can be seen from the Figure, the distribution was approximately normal, with a right tail. The peak hydrogen bond length occurred at 1.6 Å, similar to the forcefield system and shorter than DFTB. This was despite the fact that the starting geometry, density and simulation settings of the DFT and DFTB systems were identical, highlighting the differences between these two related methodologies.

3.9. Vibrational Spectra

The computation of the vibrational density of states (VDOS) for particles in a molecular dynamics simulation is a long-standing analysis method, and the spectra thus obtained can be compared to the experimentally observed IR spectrum of equivalent systems. In these simulations, the VDOS is calculated from atomic velocity data via Fourier transform, as per the Wiener–Khinchin Theorem.

3.10. Forcefield MD

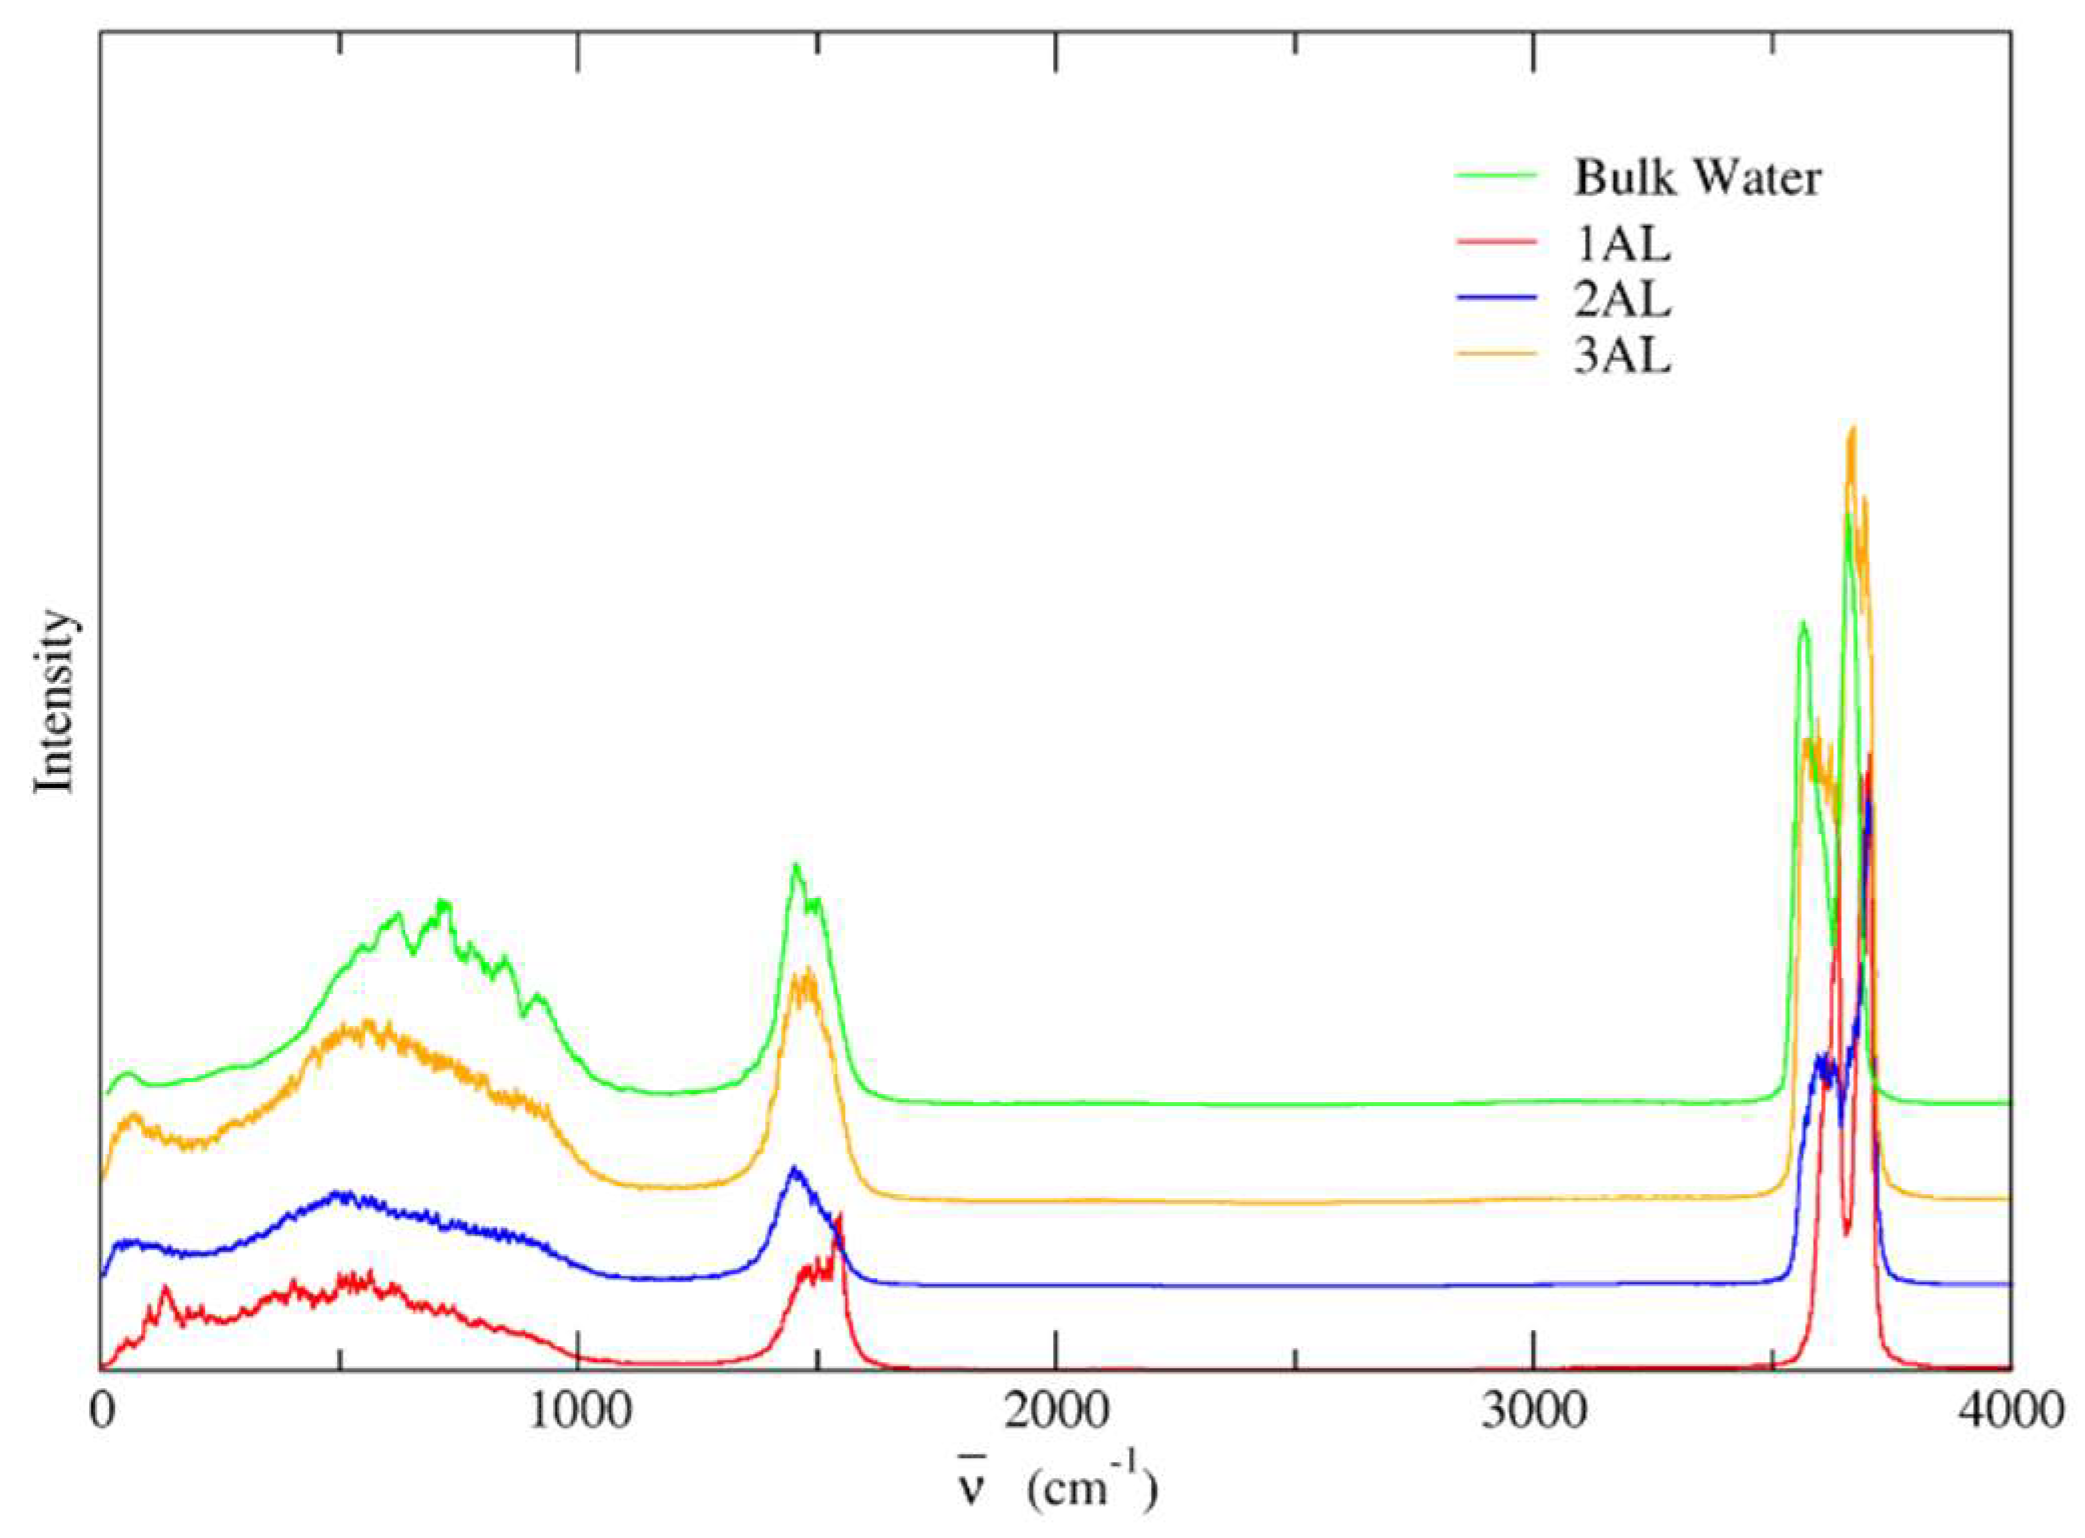
A detailed analysis of the features contained in the VDOS of water molecules in these systems was presented in our previous publication; thus, only a brief overview is given here. The hydrogen atom VDOS for the anatase (101) and rutile (110) classical-MD systems are shown in Figure 13 and Figure 14.
All of the calculated spectra exhibited some shared features: the presence of poorly defined translational/rotational modes up to 1000 cm−1, the presence of the bending mode at approximately 1500 cm−1, and the presence of two stretching modes quite close together at approximately 3600 cm−1. In the layered regions, the intensities of the translational/rotational modes and bending mode were suppressed relative to the stretching modes, and there was some slight shifting in frequency relative to the bulk water spectrum. These effects decreased in magnitude in the outer layer. Figure 15 shows the corresponding hydrogen atom VDOS for the rutile (110) ReaxFF system. Notably, the rotational/librational region of the spectrum was significantly enhanced compared to the spectra in Figure 13 and Figure 14, and there was a marked broadening of all peaks. The spectra corresponding to the inner and outer layers showed pronounced deviations from the bulk, to a much greater degree than in the classical systems, highlighting the effects of molecular dissociation at this level of theory.

3.11. DFTB

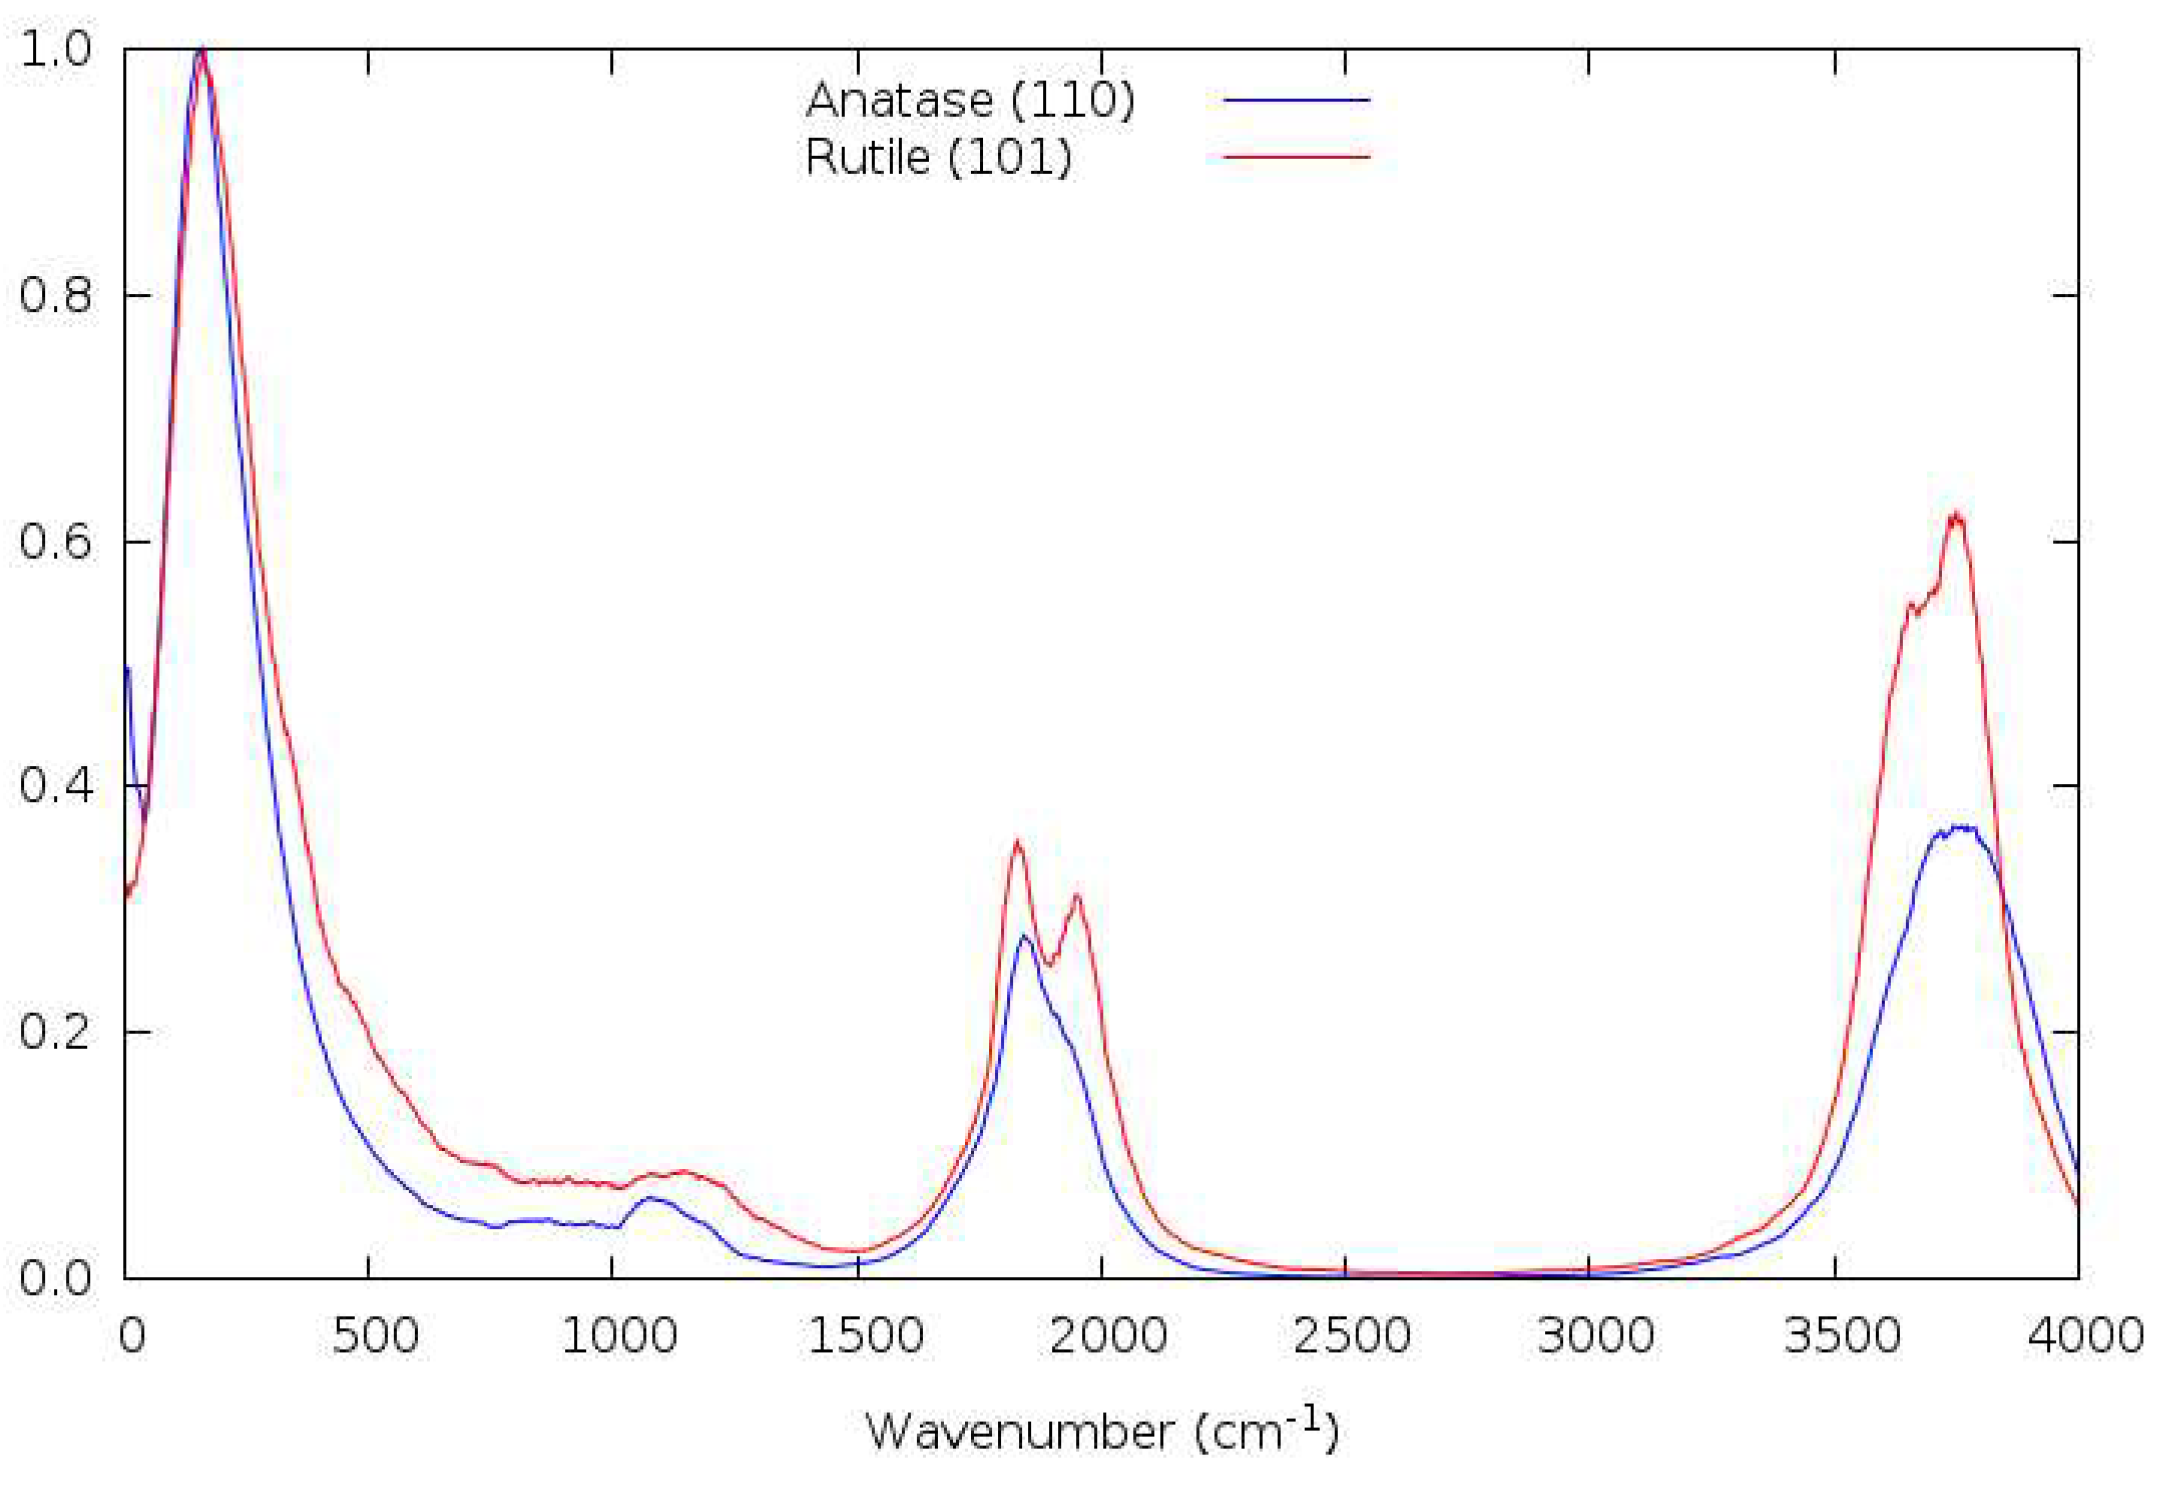
Due to the small system size, it was possible to run reasonable trajectories of the anatase (101) and rutile (110) surface slabs using the DFTB methodology, although these were still significantly shorter than those obtained from the forcefield MD simulations. Figure 16 shows the hydrogen atom VDOS for the two systems, using the DFTB methodology.
The most obvious difference between the VDOS obtained from DFTB simulations and classical MD is the appearance of a mode at approximately 2000 cm−1 in both systems, which replaced the bending mode, which is usually at approximately 1600 cm−1. Compared to the classical systems, the intensity of the stretching peaks (approximately 3600 cm−1) was somewhat reduced relative to the translational/rotational range (∼100–500 cm−1) and bending mode. The high intensity of the translational/rotational modes was largely an artefact of the short trajectory length, and would be expected to reduce to levels similar to classical-MD VDOS if calculated over a comparable period, i.e., 50 ps. Another noticeable difference was the appearance of a peak at approximately 1200 cm−1, which was plausibly present as a shoulder in the hydrogen VDOS of the rutile (110) system calculated with ReaxFF (cf. Figure 15). This peak did not correspond to any calculated or observed water molecule or hydroxyl vibrational mode.

3.12. DFT

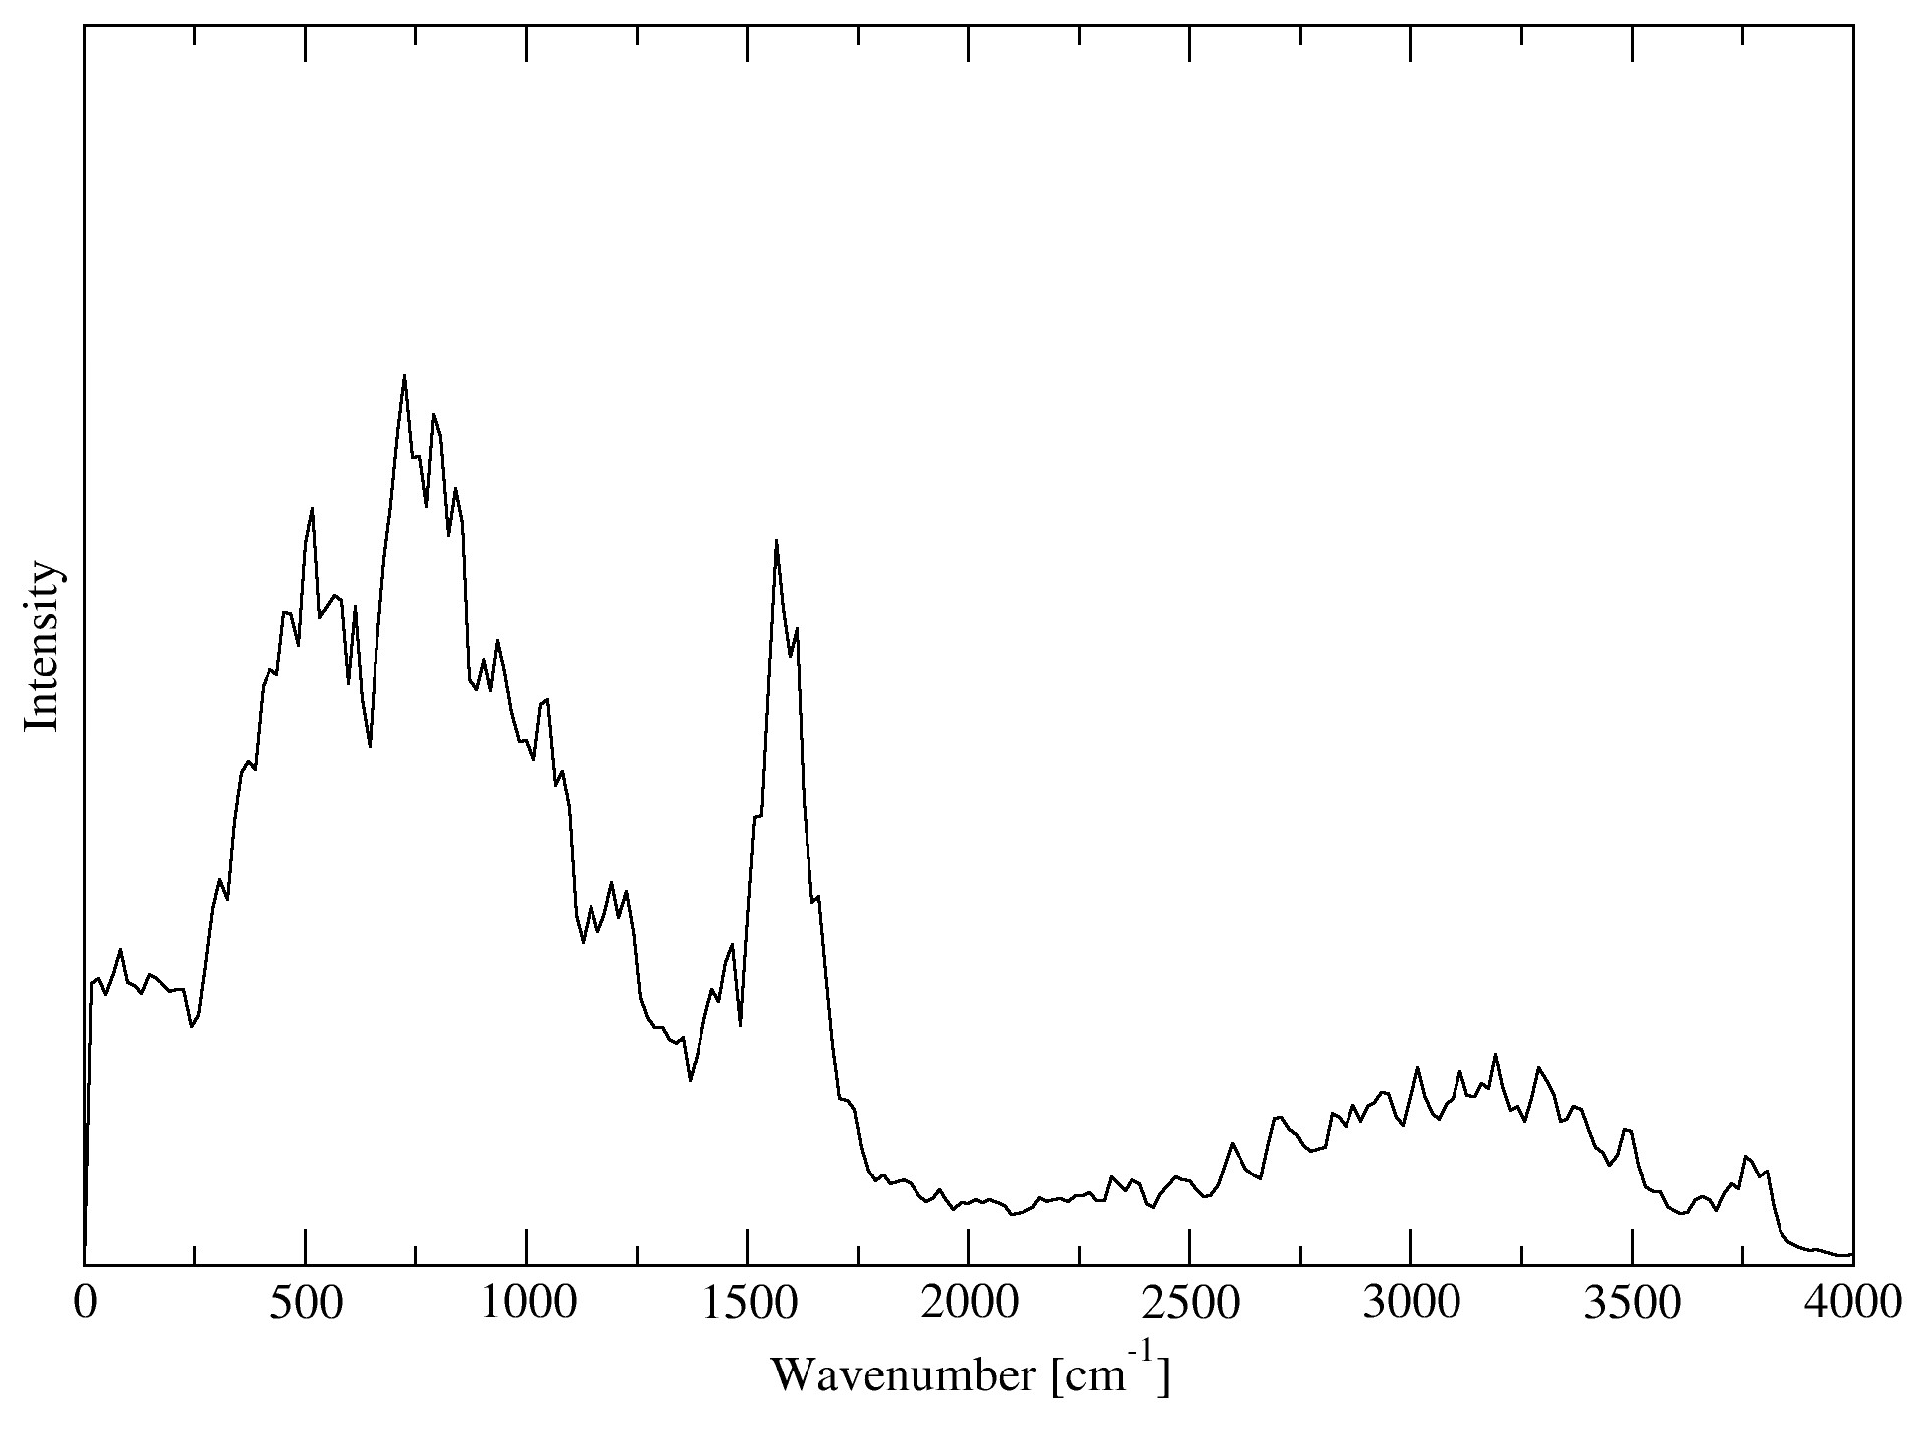
The computational expense of DFT was most apparent when attempting to calculate ensemble properties such as the VDOS. Although the rutile (110) system size was quite small compared to the forcefield MD systems, it was only possible to run a very short trajectory. The VDOS for this system is presented in Figure 17, and was calculated using the vaspkit software [50].
This spectrum was markedly different from the previous spectra: the librational band was much more significant than the bending mode at ~1500 cm−1, and the stretching modes had almost entirely disappeared into a very broad range of low intensity peaks between approximately 2250 and 3750 cm−1. The low density of the system and short trajectory length (necessitated by the computational demands of DFT-MD) are likely causes of this discrepancy, and serve as a reminder that the absolute in theoretical rigour is not always preferable over reasonable system size and trajectory length.

4. Conclusions

In this work, we have presented various analyses of systems containing TiO2 interfaces with water, simulated using multiple popular techniques. The observed properties of these systems were discussed, and the suitability of using each technique was outlined in the context of these results.
Generally, forcefield MD presents the best combination of scalability and accuracy of experimental results for dynamical properties, but entirely neglects the physical reality of dissociation and chemical reaction. Forcefield-MD methods are also highly dependent on the parametrisation quality and intended usage of the forcefield; for example, the reaxFF forcefield allowed for the dissociation of water molecules in solution, but resulted in a less precise VDOS than a classical pairwise potential. These methods are therefore best employed when the behaviour of the system is well understood and statistical properties are of greater interest than precise mechanism, although of course exceptions exist.
Although typically more accurate and rigorous than forcefield methods, DFT generally scales too poorly to be of much use when calculating dynamic properties, except for very small systems. Even for such systems, the results obtained may not be in sufficient quantity to sufficiently sample the phase space of the system; Figure 11, Figure 12 and Figure 17 in the present work have appreciably lower granularity and confidence than the other Figures obtained from forcefield MD and DFTB-MD. Conversely, DFT is the only method studied in the current work that allows for the accurate modelling of the mechanism of adsorption of H2O on the TiO2 surface, which is indubitably valuable for studies which are concerned with those details.
DFTB gives reasonably accurate results, with much better scalability than DFT, but like forcefield MD is dependent on the quality of the parameter set. This makes DFTB something of a compromise solution, albeit a very powerful one. DFTB-MD scales on the order of 102–103 times slower than the equivalent forcefield MD simulation, depending on the choice of algorithm and the speed of SCC convergence. This is still much faster than typical AIMD/DFT-MD methods, and the interactions between atoms in the DFTB simulation are typically calculated on a pairwise basis, which allows for a much better resource scaling with system size. However, the use of this method is stymied by the relatively poor availability of parameter sets, and the generation of new, high-quality parameter sets is non-trivial. Advances in fitting and generating new parameter sets, such as efforts by van den Bossche [51], are likely to improve the DFTB technique rapidly in the near future.
The recommendation of one method over the other is fraught with difficulty and conditionality, bearing in mind the desired simulation accuracy, both qualitatively and in terms of (semi-) quantitative agreement, and, naturally, the level of system size and computational expense. Considering solvent-surface systems, in general, for longer-time simulations of more realistic nanoscale systems and surfaces featuring defects where it is desired to probe vibrational and solvent-phonon-coupling properties, then the use of empirical potentials is unrivalled. In contrast, for detailed electronic-structure calculations of band-gap characteristics, or solvent/surface-defect mid-gap states, then DFT (with the appropriate treatment of dispersion interactions) is superior—with the caveat of unrealistically small system sizes sometimes leading to possible questions as to accuracy. In any event, DFTB+ is ideally placed for longer-time and larger-system simulations (with thousands of atoms) at more nanoscale dimensions and for more realistic dopant concentrations below 0.1–0.2% that cannot be achieved with DFT, e.g., to see solvent and dopant effects in systems approaching the nanoscale with potential surface defects, such as vacancies.
In general, given the much better size-scaling properties compared to DFT, DFTB is gaining in importance and applicability for titania-water systems for modelling at the nanoscale, e.g., as nanoparticles interacting with water. In particular, our recent DFTB study of a solvated anatase nanoparticle has shown the clear potential in DFTB to model qualitatively reasonable trends at the genuine nanoscale [40], and shows promise for comparisons with experimental data of comparable length-scales, with nanoscale imperfections that are so important in governing PEC activity [17], for instance.

Author Contributions

Conceptualization, N.J.E.; methodology, D.O. and N.J.E.; software, D.O. and N.J.E.; validation, D.O.; formal analysis, D.O. and N.J.E.; investigation, D.O.; resources, N.J.E.; data curation, D.O.; writing—original draft preparation, D.O.; writing—review and editing, N.J.E.; visualization, D.O.; supervision, N.J.E.; project administration, N.J.E.; funding acquisition, N.J.E. All authors have read and agreed to the published version of the manuscript.

Funding

This research was funded by Science Foundation Ireland, grant number SFI-NSFC/17/2259 and the APC was funded by Science Foundation Ireland.

Data Availability Statement

Data is available from the corresponding author upon reasonable request.

Conflicts of Interest

The authors declare no conflict of interest.

References

  1. Selli, D.; Fazio, G.; Di Valentin, C. Using Density Functional Theory to Model Realistic TiO2 Nanoparticles, Their Photoactivation and Interaction with Water. Catalysts 2017, 7, 357. [Google Scholar] [CrossRef] [Green Version]
  2. Koskinen, P.; Mäkinen, V. Density-functional tight-binding for beginners. Comput. Mater. Sci. 2009, 47, 237–253. [Google Scholar] [CrossRef] [Green Version]
  3. Guan, D.; Zhong, J.; Xu, H.; Huang, Y.-C.; Hu, Z.; Chen, B.; Zhang, Y.; Ni, M.; Xu, X.; Zhou, W.; et al. A universal chemical-induced tensile strain tuning strategy to boost oxygen-evolving electrocatalysis on perovskite oxides. Appl. Phys. Rev. 2022, 9, 011422. [Google Scholar] [CrossRef]
  4. Daqin, G.; Chenliang, S.; Hengyue, X.; Yuxing, G.; Jian, Z.; Yuchen, S.; Zhiwei, H.; Meng, N.; Zongping, S. Simultaneously mastering operando strain and reconstruction effects via phase-segregation strategy for enhanced oxygen-evolving electrocatalysis. J. Energy Chem. 2023, 82, 572–580. [Google Scholar]
  5. Huang, B.; Xu, H.; Jiang, N.; Wang, M.; Huang, J.; Guan, L. Tensile-Strained RuO2 Loaded on Antimony-Tin Oxide by Fast Quenching for Proton-Exchange Membrane Water Electrolyzer. Adv. Sci. 2022, 9, 2201654. [Google Scholar] [CrossRef]
  6. Xu, H.; Guan, D.; Ma, L. The bio-inspired heterogeneous single-cluster catalyst Ni100–Fe4S4 for enhanced electrochemical CO2 reduction to CH4. Nanoscale 2023, 15, 2756–2766. [Google Scholar] [CrossRef]
  7. Futera, Z.; English, N.J. Exploring Rutile (110) and Anatase (101) TiO2 Water Interfaces by Reactive Force-Field Simulations. J. Phys. Chem. C 2017, 121, 6701–6711. [Google Scholar] [CrossRef]
  8. Bredow, T.; Jug, K. Theoretical investigation of water adsorption at rutile and anatase surfaces. Surf. Sci. 1995, 327, 398–408. [Google Scholar] [CrossRef]
  9. Lindan, P.J.D.; Zhang, C. Exothermic water dissociation on the rutile TiO2 (110) surface. Phys. Rev. B 2005, 72, 075439. [Google Scholar] [CrossRef]
  10. Zhang, W.; Yang, J.; Luo, Y.; Monti, S.; Carravetta, V. Quantum molecular dynamics study of water on TiO2(110) surface. J. Chem. Phys. 2008, 129, 064703. [Google Scholar] [CrossRef]
  11. Allegretti, F.; O’Brien, S.; Polcik, M.; Sayago, D.I.; Woodruff, D.P. Adsorption Bond Length for H2O on TiO2(110): A Key Parameter for Theoretical Understanding. Phys. Rev. Lett. 2005, 95, 226104. [Google Scholar] [CrossRef] [Green Version]
  12. Walle, L.E.; Borg, A.; Uvdal, P.; Sandell, A. Experimental evidence for mixed dissociative and molecular adsorption of water on a rutile TiO2 (110) surface without oxygen vacancies. Phys. Rev. B 2009, 80, 235436. [Google Scholar] [CrossRef]
  13. Wu, L.; Fu, C.; Huang, W. Surface chemistry of TiO2 connecting thermal catalysis and photocatalysis. Phys. Chem. Chem. Phys. 2020, 22, 9875–9909. [Google Scholar] [CrossRef] [PubMed]
  14. Reyes-Coronado, D.; Rodríguez-Gattorno, G.; Espinosa-Pesqueira, M.E.; Cab, C.; de Coss, R.; Oskam, G. Phase-pure TiO2 nanoparticles: Anatase, brookite and rutile. Nanotechnology 2008, 19, 145605. [Google Scholar] [CrossRef] [PubMed]
  15. Guo, Q.; Xu, C.B.; Ren, Z.F.; Yang, W.S.; Ma, Z.B.; Dai, D.X.; Fan, H.J.; Minton, T.K.; Yang, X.M. Stepwise Photocatalytic Dissociation of Methanol and Water on TiO2(110). J. Am. Chem. Soc. 2012, 134, 13366–13373. [Google Scholar] [CrossRef]
  16. Panayotov, D.A.; Burrows, S.P.; Morris, J.R. Photooxidation Mecanism of Methanol on Rutile TiO2 Nanoparticles. J. Phys. Chem. C 2012, 116, 6623–6635. [Google Scholar] [CrossRef]
  17. Santo, V.D.; Naldoni, A. Titanium Dioxide Photocatalysis. Catalysts 2018, 8, 591. [Google Scholar] [CrossRef] [Green Version]
  18. Kment, S.; Riboni, F.; Pausova, S.; Wang, L.; Wang, L.; Han, H.; Hubicka, Z.; Krysa, J.; Schmuki, P.; Zboril, R. Photoanodes based on TiO2 and α-Fe2O3 for solar water splitting—Superior role of 1D nanoarchitectures and of combined heterostructures. Chem. Soc. Rev. 2017, 46, 3716–3769. [Google Scholar] [CrossRef]
  19. Yang, X.; Liu, R.; Du, C.; Dai, P.; Zheng, Z.; Wang, D. Improving Hematite-based Photoelectrochemical Water Splitting with Ultrathin TiO2 by Atomic Layer Deposition. ACS Appl. Mater. Interfaces 2014, 6, 12005–12011. [Google Scholar] [CrossRef]
  20. Deng, A.; Zhu, Y.; Guo, X.; Zhou, L.; Jiang, Q. Synthesis of Various TiO2 Micro-/Nano-Structures and Their Photocatalytic Performance. Materials 2018, 11, 995. [Google Scholar] [CrossRef] [Green Version]
  21. Futera, Z.; English, N.J. Oscillating electric-field effects on adsorbed-water at rutileand anatase-TiO2 surfaces. J. Chem. Phys. 2016, 145, 204706. [Google Scholar] [CrossRef] [PubMed] [Green Version]
  22. Futera, Z.; English, N.J. Electric-Field Effects on Adsorbed-Water Structural and Dynamical Properties at Rutile- and Anatase-TiO2 Surfaces. J. Phys. Chem. C 2016, 120, 19603–19612. [Google Scholar] [CrossRef]
  23. Schaefer, A.; Lanzilotto, V.; Cappel, U.; Uvdal, P.; Borg, A.; Sandell, A. First layer water phases on anatase TiO2(101). Surf. Sci. 2018, 674, 25–31. [Google Scholar] [CrossRef]
  24. Smith, W.; Forester, T.R. DL_POLY_2.0: A general-purpose parallel molecular dynamics simulation package. J. Mol. Graph. 1996, 14, 136–141. [Google Scholar] [CrossRef] [PubMed]
  25. Matsui, M.; Akaogi, M. Molecular Dynamics Simulation of the Structural and Physical Properties of the Four Polymorphs of TiO2. Mol. Simul. 1991, 6, 239–244. [Google Scholar] [CrossRef]
  26. Wu, Y.; Tepper, H.L.; Voth, G.A. Flexible simple point-charge water model with improved liquid-state properties. J. Chem. Phys. 2006, 124, 024503. [Google Scholar] [CrossRef]
  27. Plimpton, S. Fast Parallel Algorithms for Short-Range Molecular Dynamics. J. Comput. Phys. 1995, 117, 1–19. [Google Scholar] [CrossRef] [Green Version]
  28. Van Duin, A.C.; Dasgupta, S.; Lorant, F.; Goddard, W.A. ReaxFF: A Reactive Force Field for Hydrocarbons. J. Phys. Chem. A 2001, 105, 9396–9409. [Google Scholar] [CrossRef] [Green Version]
  29. Raju, M.; Kim, S.-Y.; van Duin, A.C.T.; Fichthorn, K.A. ReaxFF Reactive Force Field Study of the Dissociation of Water on Titania Surfaces. J. Phys. Chem. C 2013, 117, 10558–10572. [Google Scholar] [CrossRef]
  30. Aktulga, H.M.; Fogarty, J.C.; Pandit, S.A.; Grama, A.Y. Parallel Reactive Molecular Dynamics: Numerical Methods and Algorithmic Techniques. Parallel Comput. 2012, 38, 245–259. [Google Scholar] [CrossRef] [Green Version]
  31. Jain, A.; Ong, S.P.; Hautier, G.; Chen, W.; Richards, W.D.; Dacek, S.; Cholia, S.; Gunter, D.; Skinner, D.; Ceder, G.; et al. Commentary: The Materials Project: A materials genome approach to accelerating materials innovation. APL Mater. 2013, 1, 011002. [Google Scholar] [CrossRef] [Green Version]
  32. Hjorth Larsen, A.; Jørgen Mortensen, J.; Blomqvist, J.; Castelli, I.E.; Christensen, R.; Dułak, M.; Friis, J.; Groves, M.N.; Hammer, B.; Hargus, C.; et al. The atomic simulation environment—A Python library for working with atoms. J. Phys. Condens. Matter 2017, 29, 273002. [Google Scholar] [CrossRef] [PubMed] [Green Version]
  33. Ong, S.P.; Richards, W.D.; Jain, A.; Hautier, G.; Kocher, M.; Cholia, S.; Gunter, D.; Chevrier, V.L.; Persson, K.A.; Ceder, G. Python Materials Genomics (pymatgen): A robust, open-source python library for materials analysis. Comput. Mater. Sci. 2013, 68, 314–319. [Google Scholar] [CrossRef] [Green Version]
  34. Hourahine, B.; Aradi, B.; Blum, V.; Bonafé, F.; Buccheri, A.; Camacho, C.; Cevallos, C.; Deshaye, M.Y.; Dumitrică, T.; Dominguez, A.; et al. DFTB+, a software package for efficient approximate density functional theory based atomistic simulations. J. Chem. Phys. 2020, 152, 124101. [Google Scholar] [CrossRef] [PubMed]
  35. Luschtinetz, R.; Frenzel, J.; Milek, T.; Seifert, G. Adsorption of Phosphonic Acid at the TiO2 Anatase (101) and Rutile (110) Surfaces. J. Phys. Chem. C 2009, 113, 5730–5740. [Google Scholar] [CrossRef]
  36. Eyert, V. A Comparative Study on Methods for Convergence Acceleration of Iterative Vector Sequences. J. Comput. Phys. 1996, 124, 271–285. [Google Scholar] [CrossRef]
  37. Yu, V.W.-Z.; Campos, C.; Dawson, W.; García, A.; Havu, V.; Hourahine, B.; Huhn, W.P.; Jacquelin, M.; Jia, W.; Keçeli, M.; et al. ELSI—An open infrastructure for electronic structure solvers. Comput. Phys. Commun. 2020, 256, 107459. [Google Scholar] [CrossRef]
  38. Selli, D.; Fazio, G.; Seifert, G.; Di Valentin, C. Water Multilayers on TiO2 (101) Anatase Surface: Assessment of a DFTB-Based Method. J. Chem. Theory Comput. 2017, 13, 3862–3873. [Google Scholar] [CrossRef] [Green Version]
  39. Aradi, B.; Niklasson, A.M.N.; Frauenheim, T. Extended Lagrangian Density Functional Tight-Binding Molecular Dynamics for Molecules and Solids. J. Chem. Theory Comput. 2015, 11, 3357–3363. [Google Scholar] [CrossRef] [PubMed]
  40. O’Carroll; English, N. J. A DFTB-Based Molecular Dynamics Investigation of an Explicitly Solvated Anatase Nanoparticle. Appl. Sci. 2022, 12, 78. [Google Scholar]
  41. Perdew, J.P.; Burke, K.; Ernzerhof, M. Generalized gradient approximation made simple. Phys. Rev. Lett. 1996, 77, 3865. [Google Scholar] [CrossRef] [PubMed] [Green Version]
  42. Dudarev, S.L.; Botton, G.A.; Savrasov, S.Y.; Humphreys, C.J.; Sutton, A.P. Electron-energy-loss spectra and the structural stability of nickel oxide: An LSDA+U study. Phys. Rev. B 1998, 57, 1505–1509. [Google Scholar] [CrossRef]
  43. Tilocca, A.; Selloni, A. Structure and Reactivity of Water Layers on Defect-Free and Defective Anatase TiO2(101) Surfaces. J. Phys. Chem. B 2004, 108, 4743–4751. [Google Scholar] [CrossRef]
  44. Zhou, G.; Liu, C.; Huang, L. Molecular Dynamics Simulation of First-Adsorbed Water Layer at Titanium Dioxide Surfaces. J. Chem. Eng. Data 2018, 63, 2420–2429. [Google Scholar] [CrossRef]
  45. O’carroll, D.; Martinez-Gonzalez, J.A.; English, N.J. Coherency spectral analysis of interfacial water at TiO2 surfaces. Mol. Simul. 2020, 1–10. [Google Scholar] [CrossRef]
  46. O’carroll, D.; English, N.J. Self-ordering water molecules at TiO2 interfaces: Advances in structural classification. J. Chem. Phys. 2020, 153, 064502. [Google Scholar] [CrossRef]
  47. Kavathekar, R.S.; English, N.J.; MacElroy, J.M.D. Spatial distribution of adsorbed water layers at the TiO2 rutile and anatase interfaces. Chem. Phys. Lett. 2012, 554, 102–106. [Google Scholar] [CrossRef]
  48. Sumita, M.; Hu, C.; Tateyama, Y. Interface Water on TiO2 Anatase (101) and (001) Surfaces: First-Principles Study with TiO2 Slabs Dipped in Bulk Water. J. Phys. Chem. C 2010, 114, 18529–18537. [Google Scholar] [CrossRef]
  49. Luzar, A.; Chandler, D. Structure and hydrogen bond dynamics of water–dimethyl sulfoxide mixtures by computer simulations. J. Chem. Phys. 1993, 98, 8160–8173. [Google Scholar] [CrossRef] [Green Version]
  50. Wang, V.; Xu, N.; Liu, J.-C.; Tang, G.; Geng, W.-T. VASPKIT: A user-friendly interface facilitating high-throughput computing and analysis using VASP code. Comput. Phys. Commun. 2021, 267, 108033. [Google Scholar] [CrossRef]
  51. Van den Bossche, M. DFTB-Assisted Global Structure Optimization of 13- and 55-27-Atom Late Transition Metal Clusters. J. Phys. Chem. A 2019, 123, 3038–3045. [Google Scholar] [CrossRef] [PubMed]
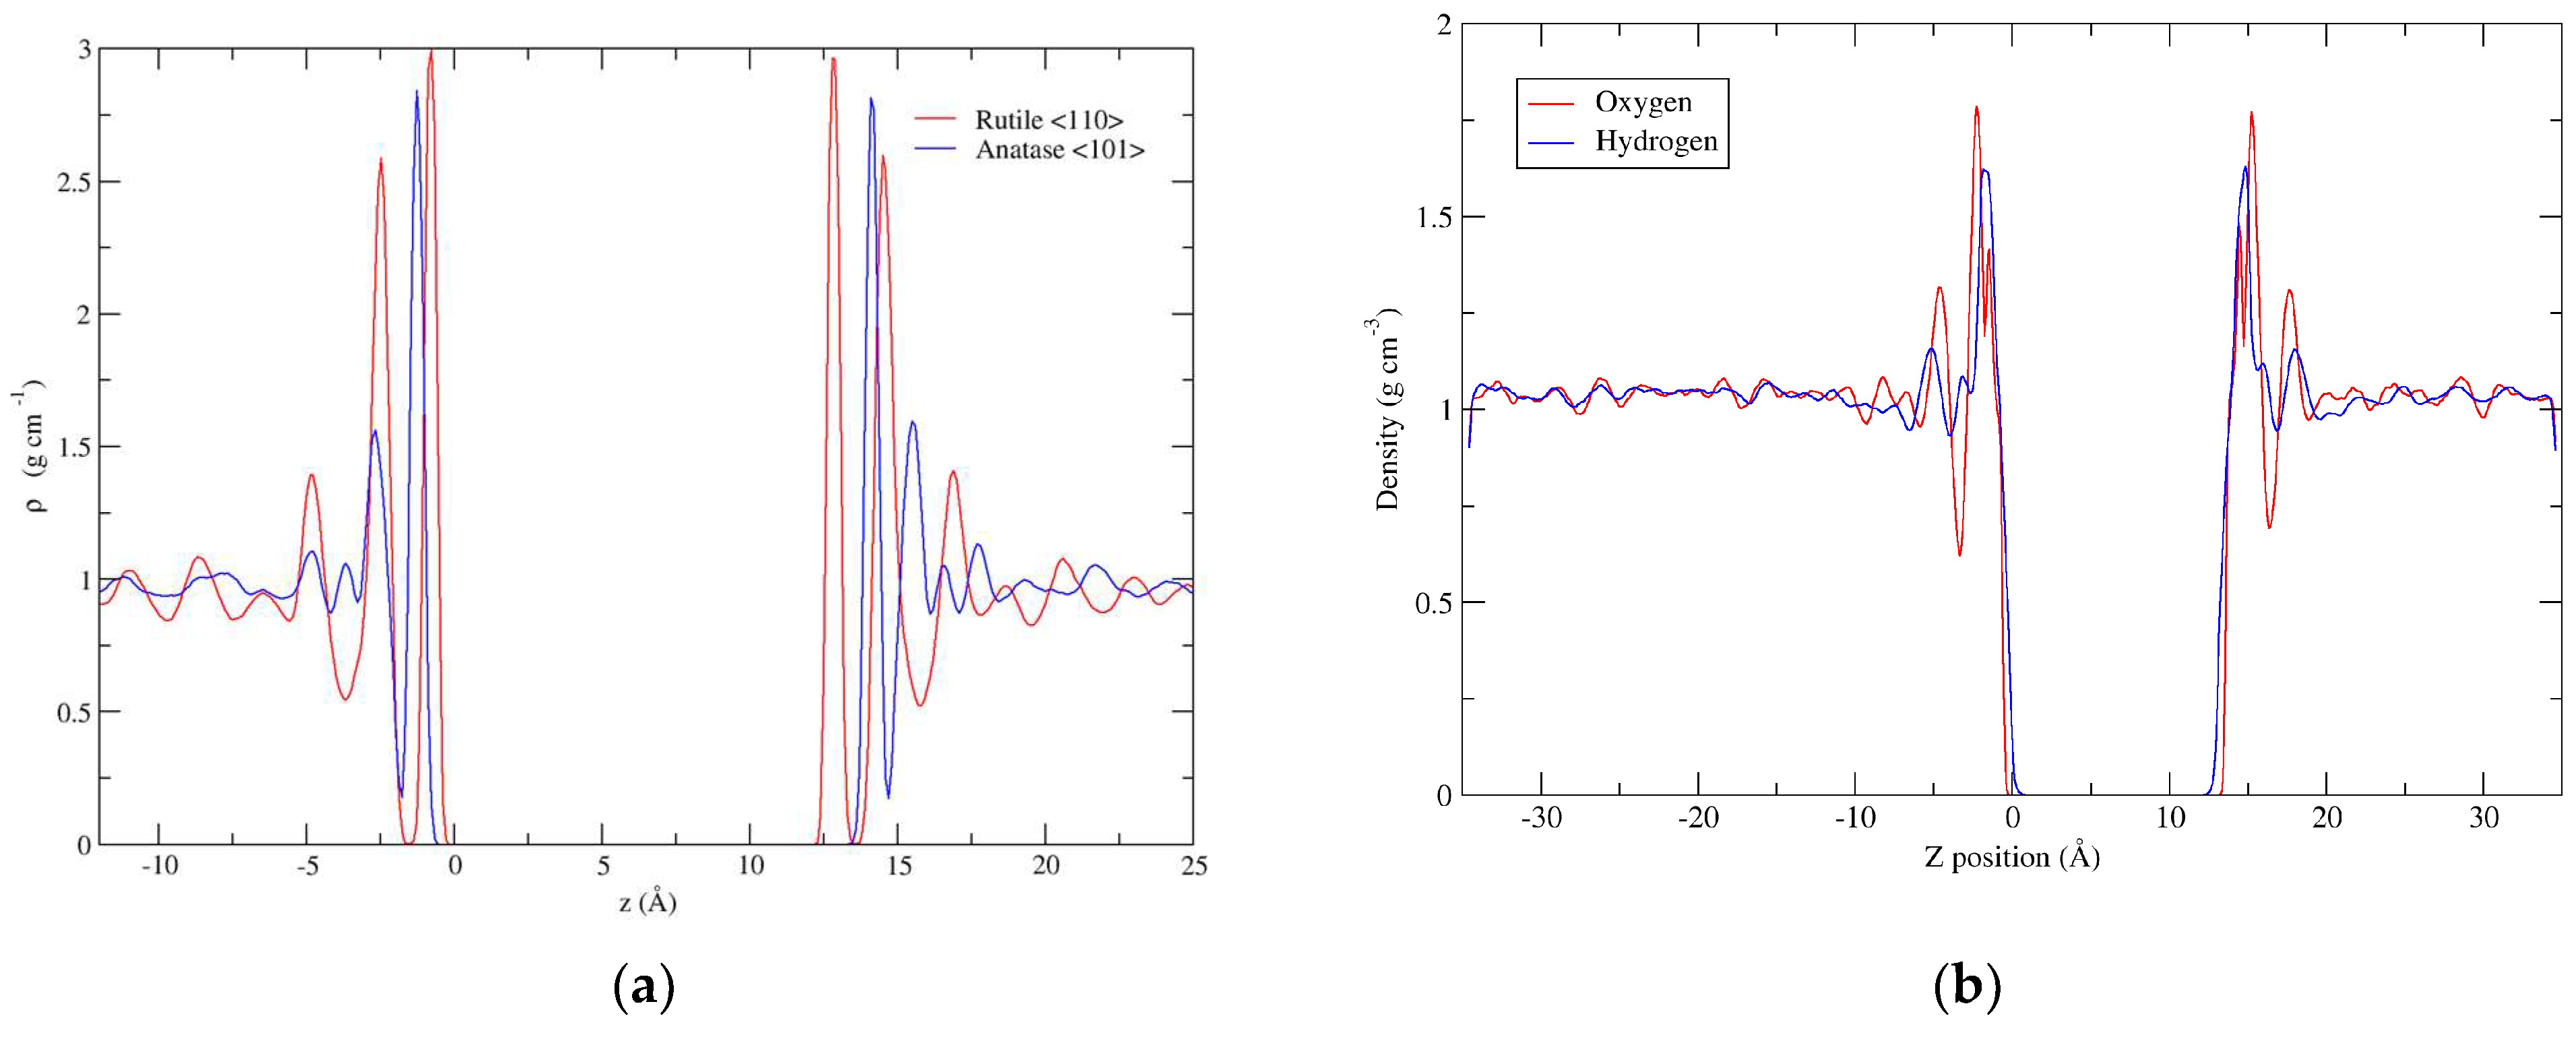
Figure 1. (a): Density of water molecule centres-of-mass along the z axis in the FF ‘classical’ systems. (b): Density of water O and H atoms along the z axis in the rutile (110) system with ReaxFF.
Crystals 13 01122 g001
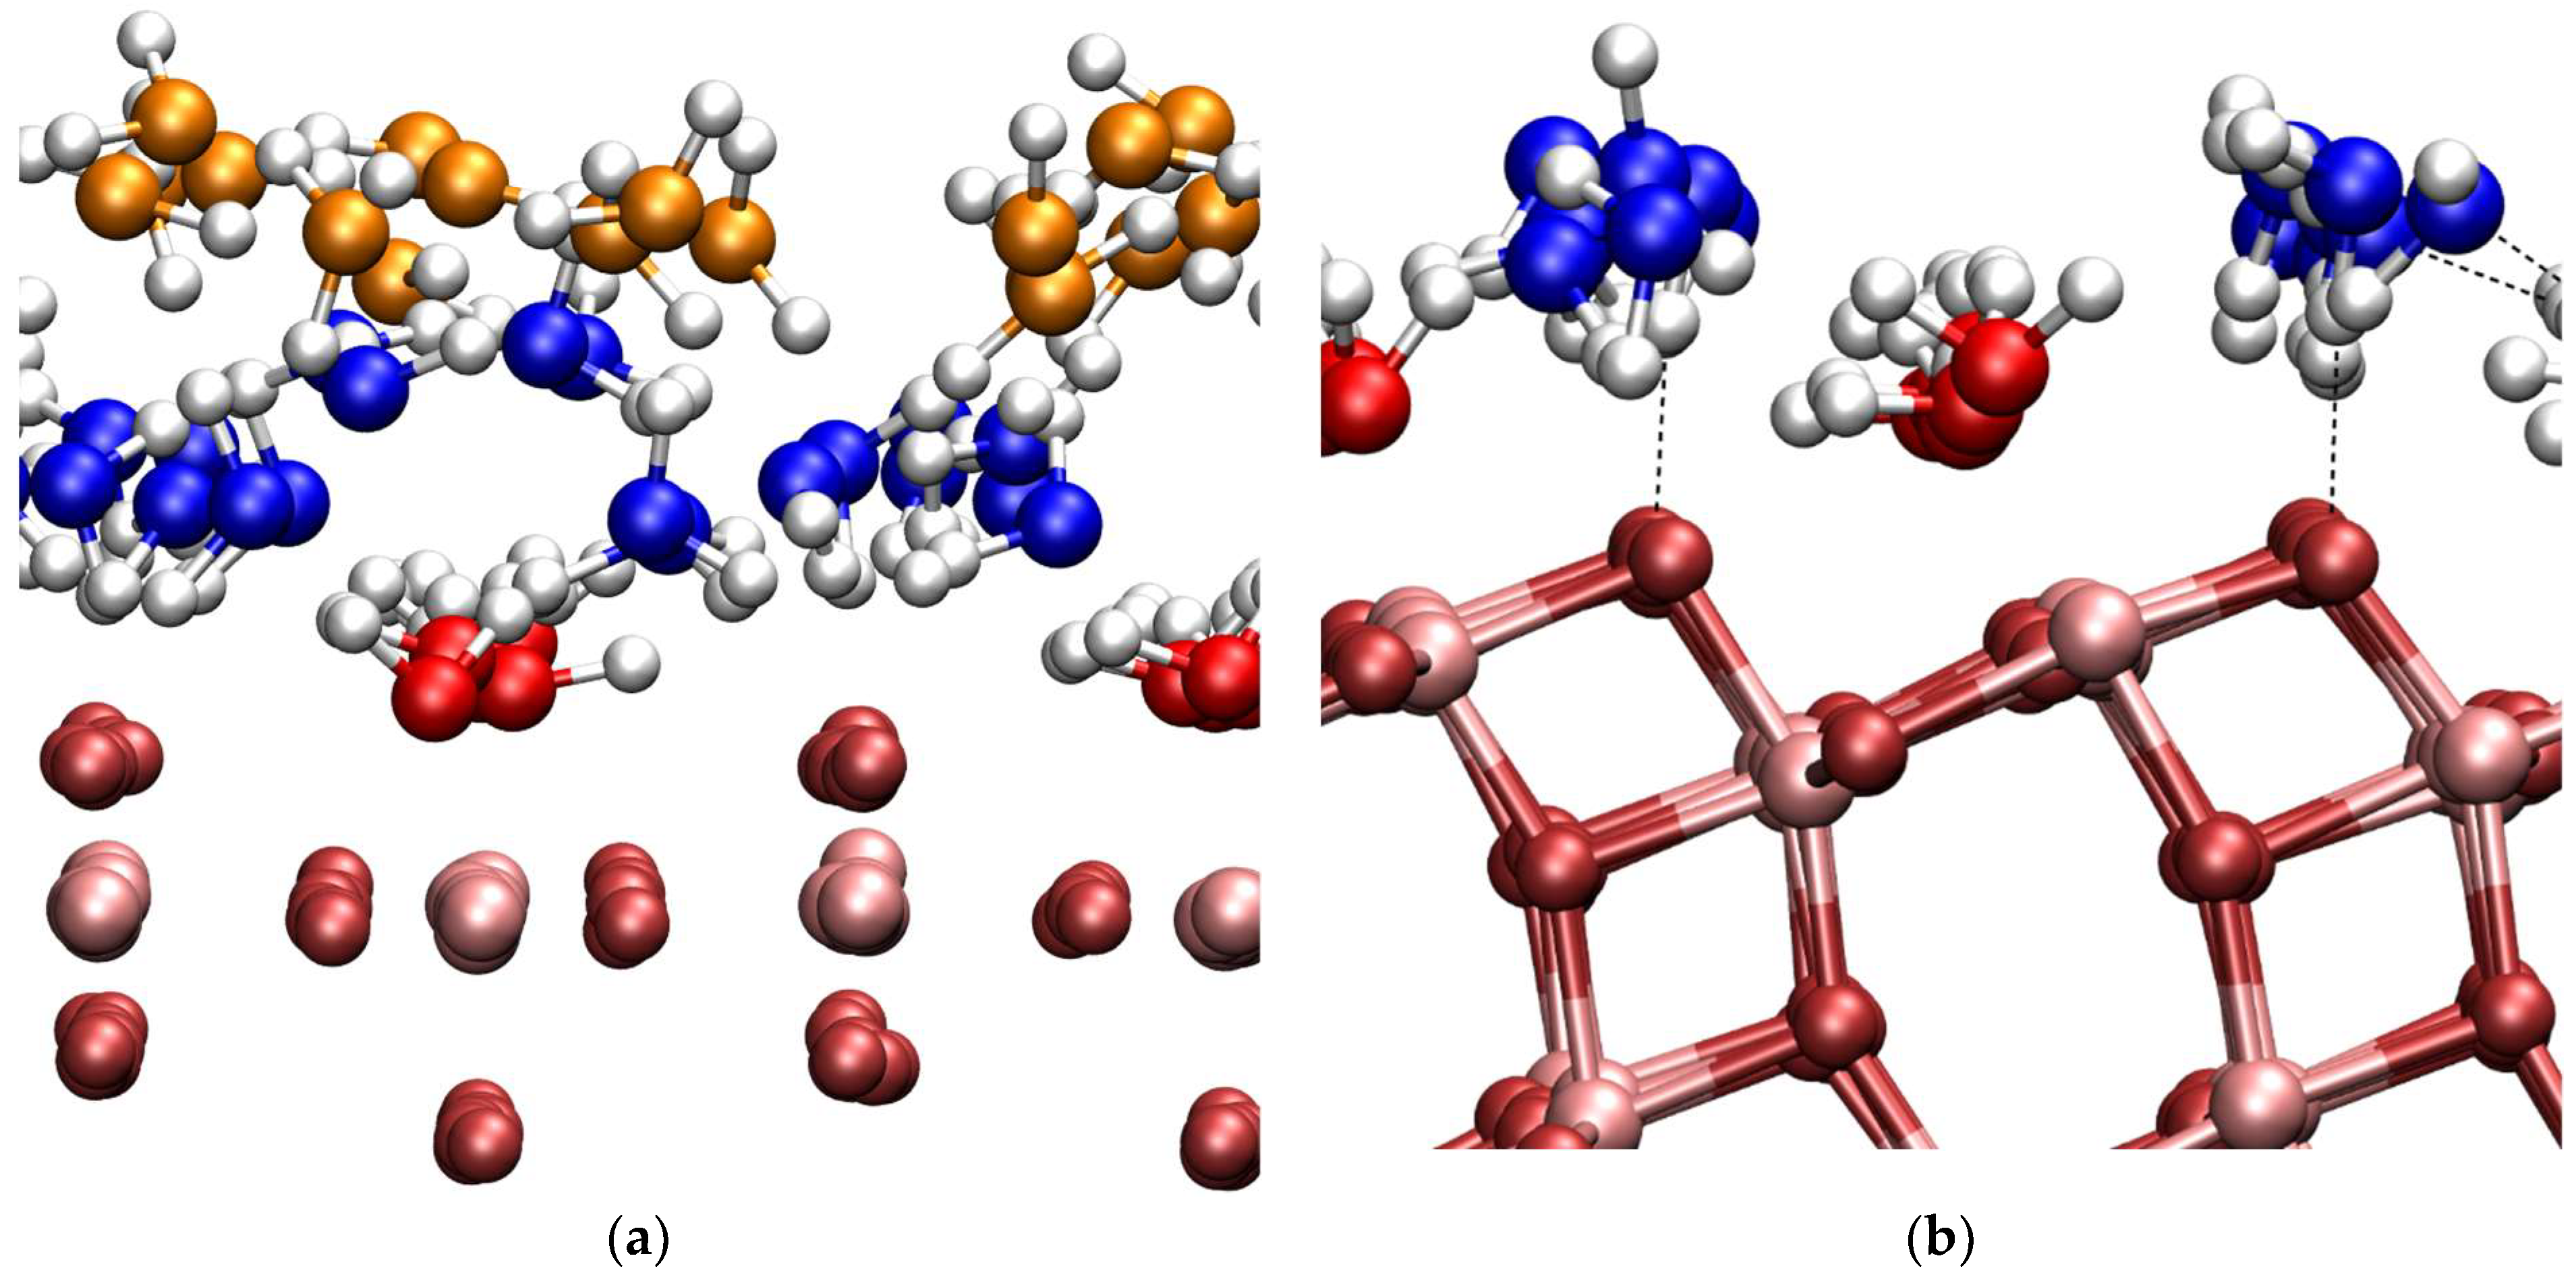
Figure 2. (a): Colour-coded water layers at the anatase (101) interface. (b): Colour-coded water layers at the rutile (110) interface.
Crystals 13 01122 g002
Figure 3. (a): Density of water O and H atoms modelled using DFTB at the anatase (101) surface. (b): Density of water O and H atoms modelled using DFTB at the rutile (110) surface.
Crystals 13 01122 g003
Figure 4. Density of water oxygen atoms at the rutile (110) interface modelled with DFT-MD.
Crystals 13 01122 g004
Figure 5. (a): Hydrogen-bond number distribution for anatase (101) modelled using classical MD. (b): Hydrogen-bond number distribution for rutile (110) modelled using classical MD.
Crystals 13 01122 g005
Figure 6. Hydrogen-bond number distribution for rutile (110) system modelled using ReaxFF.
Crystals 13 01122 g006
Figure 7. Hydrogen-bond length distribution for (a) anatase (101) and (b) rutile (110) using classical MD.
Crystals 13 01122 g007
Figure 8. Hydrogen-bond-length distribution for rutile (110) system modelled using ReaxFF.
Crystals 13 01122 g008
Figure 9. Hydrogen-bond-number distribution for the rutile (110) system modelled using DFTB.
Crystals 13 01122 g009
Figure 10. Hydrogen-bond-length distribution for the rutile (110) system modelled using DFTB.
Crystals 13 01122 g010
Figure 11. Hydrogen bond number distribution for the rutile (110) system modelled using DFT.
Crystals 13 01122 g011
Figure 12. Hydrogen-bond-length distribution for the rutile (110) system modelled using DFT.
Crystals 13 01122 g012
Figure 13. Hydrogen-atom VDOS for the anatase (101) system modelled with classical MD.
Crystals 13 01122 g013
Figure 14. Hydrogen-atom VDOS for the rutile (101) system modelled with classical MD.
Crystals 13 01122 g014
Figure 15. Hydrogen-atom VDOS for the rutile (101) system modelled with ReaxFF.
Crystals 13 01122 g015
Figure 16. Hydrogen-atom VDOS for the systems modelled using DFTB.
Crystals 13 01122 g016
Figure 17. Hydrogen atom VDOS for the rutile (110) system modelled using DFT.
Crystals 13 01122 g017
Table 1. Simulation cell parameters for the FF-MD calculations.
SystemNTiO2NH2Oa (Å)b (Å)c (Å)
Non-reactive
Rutile448200026.5040.9669.87
Anatase448200023.6245.3869.45
Reactive
Rutile448200026.5040.9669.87
Table 2. Simulation cell parameters for the DFTB-MD calculations.
SystemNTiO2NH2Oa (Å)b (Å)c (Å)
Anatase286511.4110.4739.26
Rutile32459.30711.0425.04
Disclaimer/Publisher’s Note: The statements, opinions and data contained in all publications are solely those of the individual author(s) and contributor(s) and not of MDPI and/or the editor(s). MDPI and/or the editor(s) disclaim responsibility for any injury to people or property resulting from any ideas, methods, instructions or products referred to in the content.