Article

The Influence of Inserted Metal Ions on Acid Strength of OH Groups in Faujasite

Division of Materials Chemistry, Ruđer Bošković Institute, Bijenička 54, 10000 Zagreb, Croatia
*
Author to whom correspondence should be addressed.
Crystals 2023, 13(2), 332; https://doi.org/10.3390/cryst13020332
Submission received: 7 January 2023 / Revised: 10 February 2023 / Accepted: 13 February 2023 / Published: 16 February 2023

Abstract

:
The number and the strength of acid sites in catalysts have paramount importance on their efficiency. In zeolites chemistry, increased content of framework Al in zeolites gives a higher number of strong acid sites. Their strength can be a disadvantage in catalytic reactions (e.g., methanol to olefins conversion) due to undesired secondary reactions of coke formation. Here, the Faujasite type of zeolite with higher content of Al has been used for investigating the role of defects in structure and inserted (wet impregnation and thermal treatment) metal cations (Mg, Co, Ni, Zn) on the strength of OH acid sites. Desorption of deuterated acetonitrile, as a probe molecule, was used for OH groups acid strength measurements at different temperatures (150, 200, and 300 °C).

1. Introduction

Modified zeolite Y (ZY) is the most important catalyst used in chemistry for fuel production via hydrocracking of crude oil (Fluid Catalytic Cracking—FCC). On the other hand, “green” synthesis of hydrocarbons from CO2 using solid-state acid catalysts, can be made in several steps, including conversion to CH4 or CH3OH, then to higher alkanes.
ZY is a high-silica zeolite of the Faujasite (FAU) topology. If the content of Al in the framework increases, it becomes ZX, but there is no widely accepted exact value for the Si/Al ratio when zeolite Y becomes ZX (the Si/Al ratio range for association to ZX name varies from 1 to 5, due to different authors).
A large number of articles are dedicated to modifications of ZY with rare-earth cations, and to understanding its structural characteristics and their correlation to catalytic activity [1]. An increase in efficiency, product selectivity, and longevity are just some of the properties that we are constantly trying to improve in existing commercially available catalysts. One of the most popular methods for catalyst modification is increasing the active surface of the zeolite either by reducing crystal size to nanoscale [2] or creating mesopores in larger crystals through the usage of mesoporosity templates such as cetrimonium bromide (CTAB) [3,4] and/or etching solutions [5]. Many of these materials have been further functionalized by the introduction of cations inside the zeolite framework, but this type of treatment can also lead to the formation of metal oxide/hydroxide nanoparticles on the zeolite’s internal or external surface that are also catalytically active [6,7,8].
Special attention is dedicated to the understanding of the location, number, type, and accessibility of acid sites in zeolite structures [9], which are needed to fine-tune the catalytic properties of zeolites. The acid strength of OH groups can be measured using various probe molecules such as carbon monoxide [10], pyridine, or deuterated acetonitrile at low-pressure conditions. Even though many papers have reported a detailed analysis of Brønsted (BAS) and Lewis acid sites (LAS) after various post-synthesis treatments and modifications [11,12], only a few of them mentioned the effect of position and the cation species in the framework on the ratio between acid sites (AS).
Recent papers in the research of zeolites put a lot of emphasis on understanding the acidity [13] of metal cations in the zeolite framework and how they affect the mechanisms of chemical reactions. The amount of metal cations in the framework directly influences the occupancies of specific binding sites [14,15]. Changes in the coordination number and connectivity of donor atoms directly influence the binding affinity of probe molecules to the acid sites in the vicinity of the metal center. To further explore this concept and find out how much it affects specific metal cations, we have chosen three low-silica FAU zeolites of different crystal morphologies (size as well), with different Si/Al ratios (1.5, 2.0, and 2.3) and inserted (insert = wet impregnation + consecutive thermal treatment) several cations into the structure under the same conditions, while keeping the molar ratio of loaded metal to aluminum (M/Al) around 0.3 (about 60% of acid sites of ZX). To see the difference in acid strength of OH groups near the positions of exchangeable cations, relatively high loading of Mg2+, Co2+, Ni2+, and Zn2+ in ZX were investigated by desorption of D3-acetonitrile. These cations were chosen due to their similar ionic radii (from 69 to 74.5 pm) [16] and the stability of their II+ oxidation state with a low expectation of forming large amounts of metal oxide, unlike Fe2+ or Cu2+. Additionally, all of the chosen metals have shown potential for various applications such as gas storage and catalytic reactions. It is of paramount importance to better understand chemical and structural factors that affect catalyst acidity and activity in reactions such as CO2 methanation, isopropilation of phenolic compounds from biomass, and hydro-dechlorination of chlorinated compounds [17,18,19,20].

2. Materials and Methods

2.1. Sample Preparation and Cation Introduction

Here, zeolites were prepared using three different procedures. Nano-crystallites labeled ZX-n (Si/Al = 1.44) were prepared from the gel of oxide composition 8.0 Na2O: 0.7 Al2O3: 10.0 SiO2: 160.0 H2O [21] while the preparation of crystals with higher Si/Al ratio, the composition of 4 Na2O:Al2O3:10 SiO2:158 H2O was used [22]. The preparation of the sample with Si/Al ratio of 2.3 was made using the procedure described by Bosnar et al. The post-synthesis desilication was performed using 0.2 mol dm−3 basic solution (mixture of NaOH and TPAOH) [12]. The treatment was carried out at 60 °C for 60 min, in a slurry with a ratio of zeolite to etching mixture 1:33 and the sample was labeled ZX-6060. To get the crystals with Si/Al ratio of 2.0, after 24 h of synthesis, the gelatinous solution of CTAB in alkaline water was added to the reaction gel and stirred vigorously until homogenized. The ratio of CTAB to solvent was 1:1, while the ratio of Si:CTAB was 1:0.4. The rest of the synthesis was carried out as already written. This sample was labeled ZX-Ct. All types of synthesized samples were washed, dried at 60 °C, and calcined at 550 °C for 8 h.
All prepared samples were impregnated using nitrate salts of magnesium(II), cobalt(II), nickel(II), and zinc(II) dissolved in redistilled water. The ratio of zeolite to a salt solution was 1:10. Concentration of 1 mol dm−3 was chosen for magnesium and zinc nitrate, while for the cobalt(II) and nickel nitrate, it was diluted to 0.5 mol dm−3 due to the solution’s lower pH. The exchange procedure was repeated twice, after which all samples were thoroughly washed with redistilled water, dried at 60 °C, and calcined at 550 °C for 6 h.

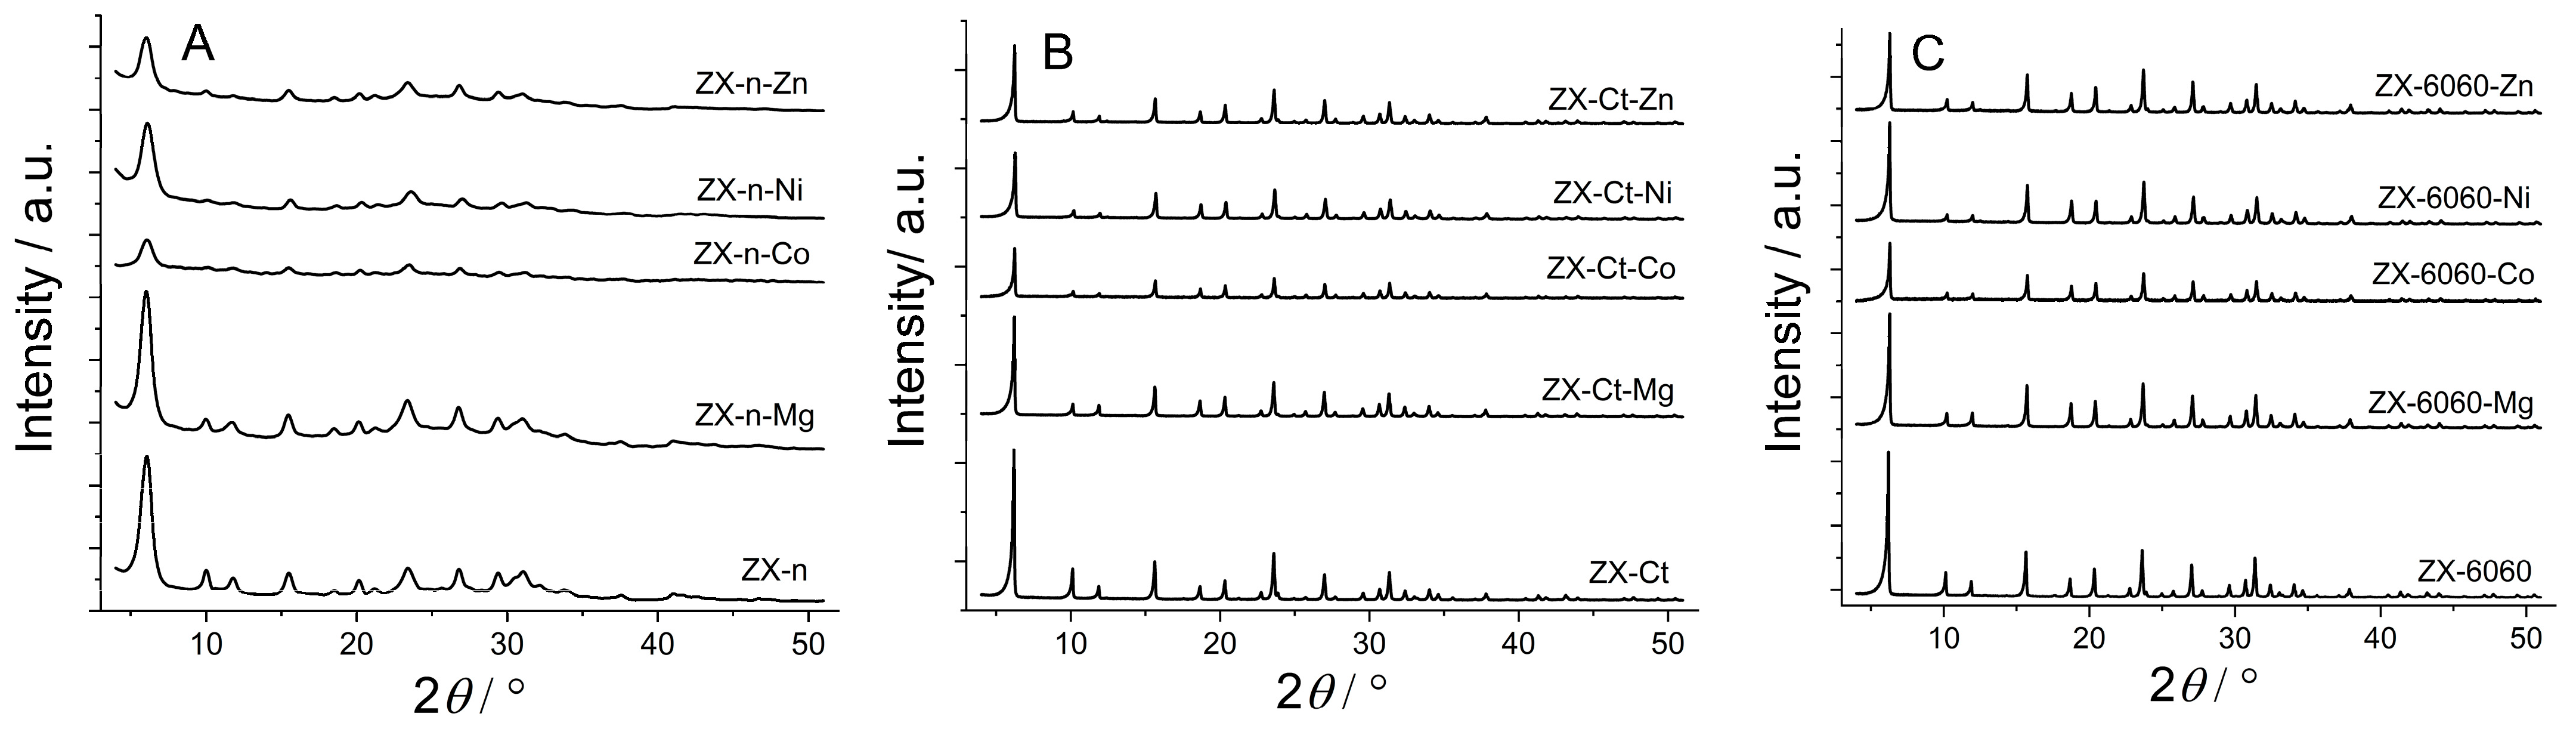
2.2. Methods of Sample Characterization (PXRD, SEM, FAAS, FTIR, UVVis-DRS)

Powder X-ray diffraction was used for the phase analysis of the synthesized samples after each modification step. Diffraction patterns were collected using copper Kα radiation on an Empyrean (Malvern Panalytical, Malvern, UK) diffractometer with the Bragg–Brentano optics at 2θ angles from 5° to 50°.
High-resolution field emission scanning electron microscope (SEM) images of the samples were made using a JSM-7000F (JEOL) microscope.
The elemental composition of the samples was measured using Flame Atomic Absorption Spectroscopy (FAAS) on Aanalyst 200 (Perkin Elmer, Waltham, MA, USA). All solutions for the analysis were prepared in the accordance with prescribed procedures.
Qualitative and quantitative analysis of acid sites was determined using Fourier-transformed infrared spectroscopy (FTIR) on a Frontier (Perkin-Elmer) instrument, in the transmission mode under the pressure of 5 × 10⁻⁵ mBar and resolution of 4 cm−1. Self-supported pellets (d = 13 mm) for the analysis were prepared from around 10 mg of sample and activated at 400 °C for 3 h. To determine acid site strength, desorption of deuterated acetonitrile was measured at 25, 150, 200, and 300 °C.
The concentration of the specific acid site (Brønsted and Lewis) was calculated from the integral intensity of the corresponding bands in the IR spectra after adsorption of CD3CN, using the formula
C   ( µ mol   g cat 1 ) = I A   ( X ) ε   ( X ) *   σ
where IA(X) is the integrated absorbance of the peak of the acid species X (Lewis or Brønsted), σ is the “density” of the wafer normalized to the value of 10 mg cm−2 (actually it is wafer thickness after making at predefined pressure of 2 T/cm2), while ε is the molar extinction coefficient (2.05 ± 0.1 cm/μmol and 3.6 ± 0.2 cm/μmol, for Brønsted and Lewis acid sites, respectively) as described by Wichterlova et al. [23].
UV–Vis diffuse reflectance spectroscopy (DRS) measurements were made using the instrument model UV 3600 (Shimadzu, Kyoto, Japan), equipped with Integrating Sphere, using BaSO4 as standard.

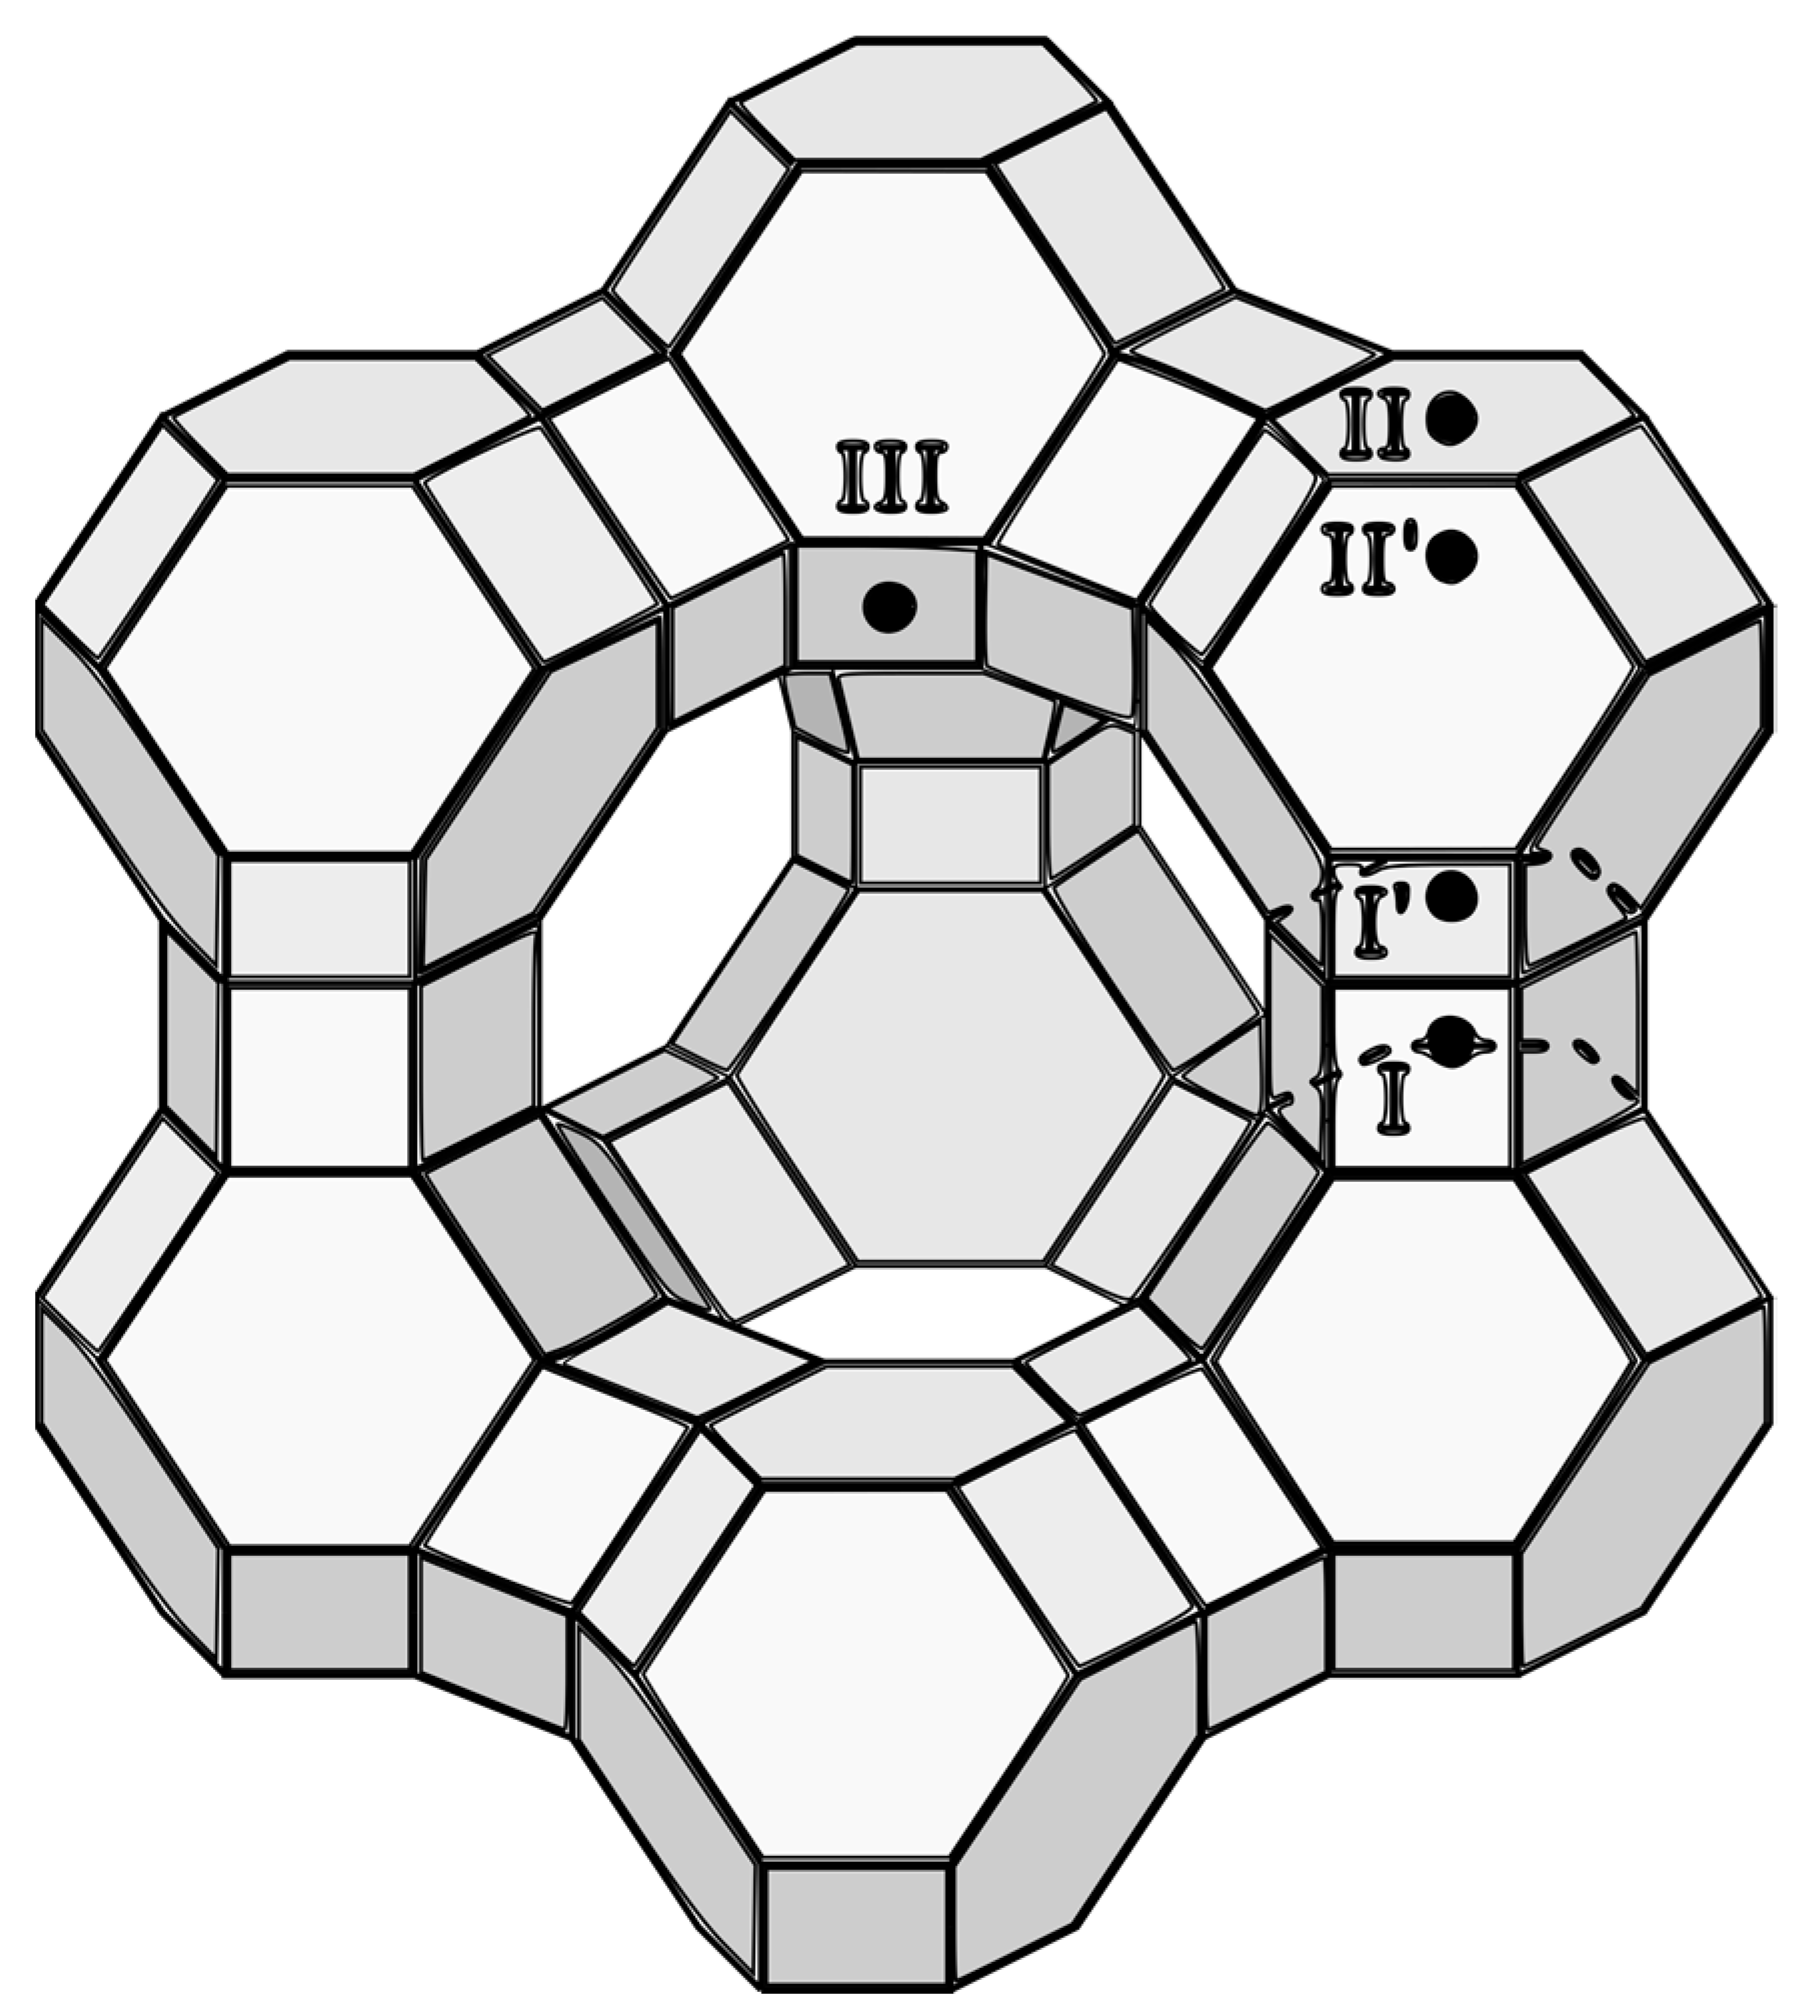
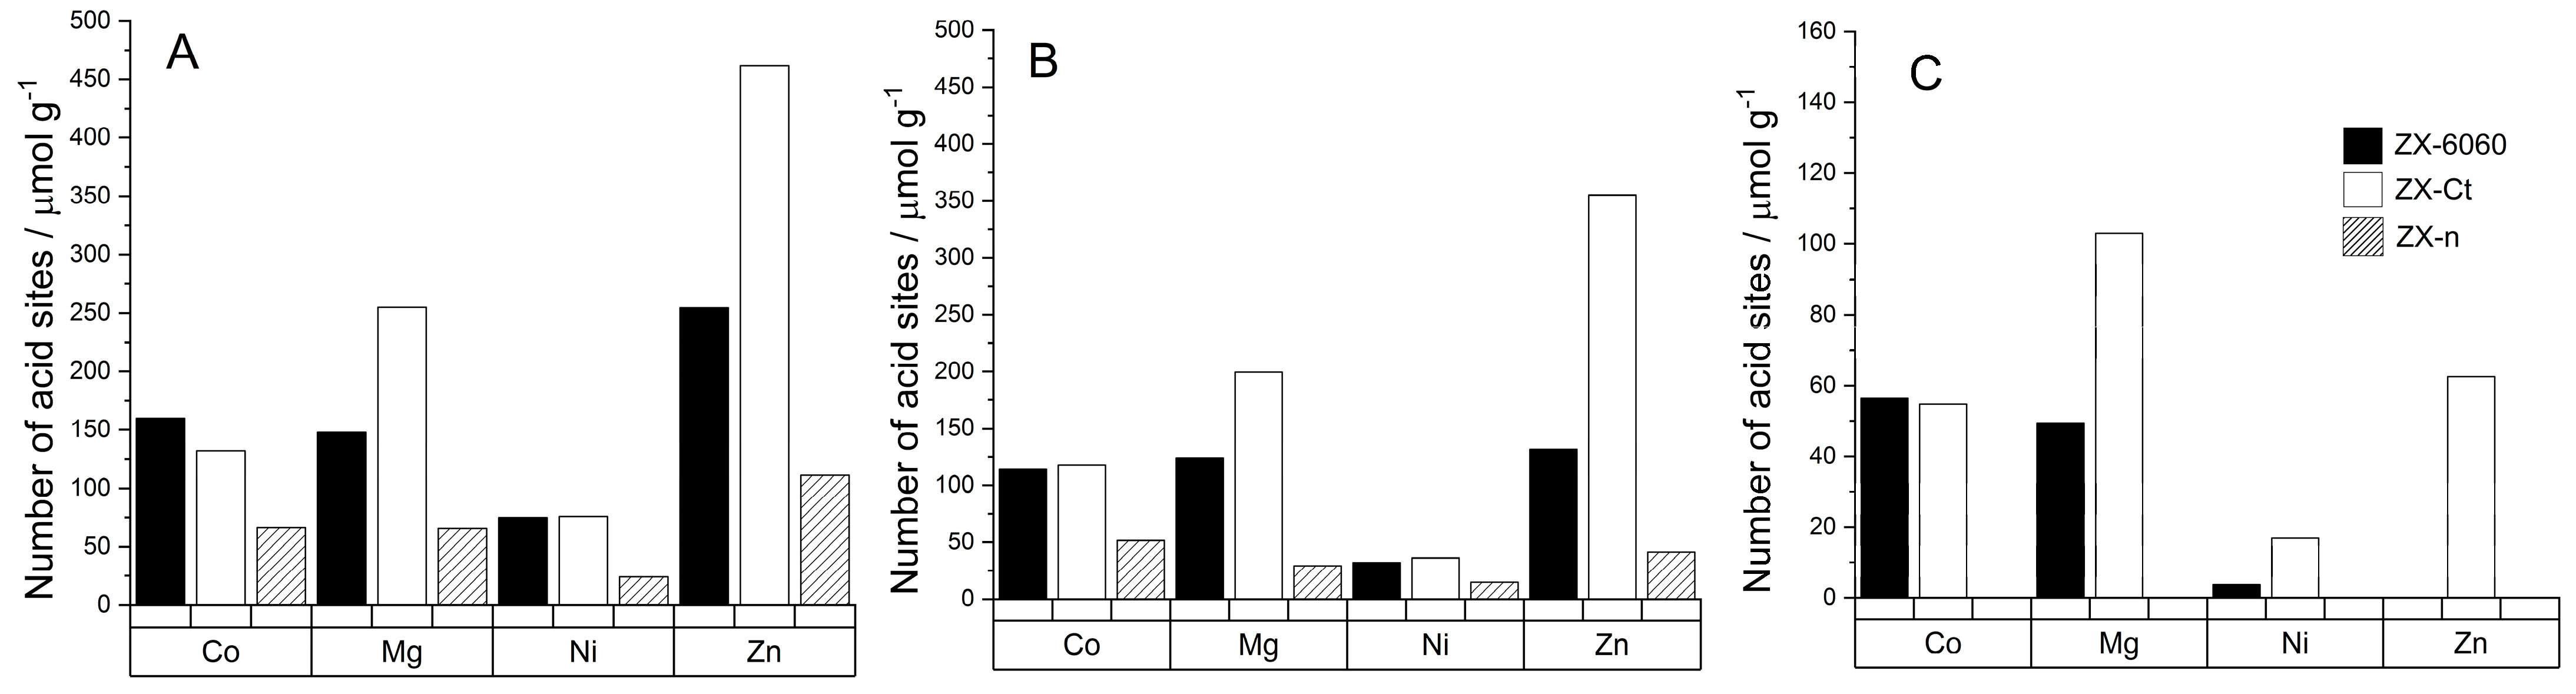
3. Results and Discussion

Comparing the XRD patterns of all three samples (ZX-n, ZX-Ct, and ZX-6060), one can observe lower intensity but wider peaks of nanocrystals, and there is no significant difference in the crystallinity of the ZX-6060 and ZX-Ct samples (Figure 1A). According to SEM photos, the size of nanocrystals is 60–100 nm and can be better seen at higher magnification (33,000×, insert in Figure 1B). The twin ZX crystals, made with the addition of CTAB during the synthesis, consist of several smaller fragments (size around 0.5 μm) and large voids between them (Figure 1C). Changes on the surface of the ZX-6060 sample after treatment with etching solution are the creation of voids, which are visually similar to those of ZX-Ct. The difference in surface defects compared to the parent sample can be seen in the insert of the SEM image in Figure 1D.
All PXRD patterns of samples after cation introduction (except for Mg in ZX-n) display a decrease in crystallinity compared to the starting material (Figure 2). Despite using a lower concentration of Co and Ni salts (0.5 M) during wet impregnation, the highest degradation of ZX structure (amorphization) was observed on systems with Co, due to lower pH caused by hydrolysis. So, the influence of cation type on ZX structure amorphization is in the following order Mg < Ni < Zn < Co. The decrease is more pronounced for the samples of the ZX-n series, which have larger outside crystal surfaces and lower crystallinity to begin with (lower intensity but wider peaks are a result of much smaller—nanosized—zeolite crystals). After sample calcination at 550 °C, an increase in the peak intensity was observed. This can be explained by partial reintegration of the silanol nest to framework inducing the “healing effect” on the structural defects, which were introduced by acid solution light amorphization of the external crystal surface during wet impregnation. In the case of insertion of Mg2+ to ZX nanocrystals, crystallinity is even better than that of starting material, indicating lower amorphization during wet impregnation and a more pronounced healing effect of (reintegrated) silanol nests. There are no additional peaks between 35° and 50°, which indicates that there is no detectable amount (at least by PXRD technique) of metal oxide formed on the zeolite internal or external crystal surface [24,25,26,27].
The effect of change in Si/Al ratio on OH groups in zeolite is best visible in FTIR spectra (Figure 3). A comparison of parent samples shows that all of them have a broadband at ca. 3400 cm−1 which belongs to silanol nests [28], and the intensity of that band increases with the decrease of the Si/Al ratio (also with a decrease of crystal size). It is surprising for sample ZX-6060, which was modified by desilication of “solid” micrometer-sized crystals. It is also an indication that most of silanol nests are close to the external crystal surfaces, including mesopores. After the insertion of metal cation into the structure, the intensity of the band decreases for all samples compared to the parent sample, which indicates more interactions between inserted cation and silanol nests.
Besides the external surface of ZX crystals (determined by the size of crystals and macro-voids of twin crystals), the intensity of the band at 3745 cm−1 assigned to ν(SiOH), largely depends on the structural defects of the ZX framework introduced by amorphization during wet impregnation. The band intensity rises proportionally to the decrease in crystallinity, as can be confirmed from PXRD patterns in Figure 2.
Traces of metal M-OH stretching can also be observed in other samples. Both ZX-Ct-Co and ZX-6060-Co have a band at 3675 cm−1 assigned to Co-OH, ZX-Ct-Ni and ZX-6060-Ni have a Ni-OH shoulder at 3672 cm−1, [29] while ZX-Ct-Zn and ZX-6060-Zn have a shoulder at 3672 cm−1, as well as another two at 3656 and 3639 cm−1, but one of highest intensities is at 3646 cm−1, as observed here [30]. Comparing the rest of the acquired spectra to that of zeolite’s H-form, one can observe that position of bands at 3645 cm−1 matches that of H positioned in the super cage (Figure 4 position II) and is not present in the samples before impregnation. Aside from that, samples ZX-Ct-Zn, ZX-6060-Zn, and ZX-6060-Ni also have the prominent band at 3546 cm−1 matching the protonated bridging oxygen atom in the sodalite cage (Figure 3 position I’) [31]. Other samples from the ZX-Ct and ZX-6060 series have the mentioned band, but it is of much lower intensity. It is difficult to differentiate any peaks in that area from the background noise for the samples of the ZX-n series. The reason for the presence of protonated bridging atoms is H3O+ generated from hydrolysis of the used salts (pHs of Zn, Ni, and Co nitrate solutions were between 4 and 5, while Mg(NO3)2 solution has a pH value 5.7) [32,33]. This process is further enhanced by the interaction of the metal cation with the zeolite framework.
Detailed analysis of the atomic composition of the samples also indicates that there is a slight deficiency in the positive charge needed to fully compensate negative charge of the framework (Table 1), as well as slight dealumination caused by an acidic environment during cation insertion [34,35,36]. The presence of those acid sites is further confirmed by the adsorption of D3-acetonitrile.
All samples after cation insertion have a band in the range of 2295 to 2298 cm−1 from D3-acetonitrile adsorbed on type A or B of Brønsted acid sites as described by Pelmenschikov et al. [37]. At room temperature, the amount of adsorbed D3-acetonitrile varies greatly from sample to sample due to surface adsorption. After desorption at 150 °C, it can be observed that samples ZX-Ct-Mg and ZX-Ct-Zn have the highest amount of D3-acetonitrile still adsorbed on Brønsted acid sites (BAS) out of all samples (Figure 5), but the strength of those sites differs. ZX-Ct-Zn has by far the largest amount of probe molecules adsorbed on BAS, but only around 15% of them are strong enough to bind D3-acetonitrile after desorption at 300 °C; while in the ZX-Ct-Mg sample, strong acid sites make almost 50% of all detected Brønsted acid sites. Even though samples with Co and Ni have a similar amounts of probe molecules adsorbed on BAS compared to Mg and Zn at room temperature, most of those sites are weak and most of D3-acetonitrile was desorbed at 150 °C. The possible reason for that is the tendency of Mg2+ and Zn2+ to occupy site II’ in the sodalite cage (Figure 4) [38], which leads to the increase in the acidity of the proton present near that binding site. A similar effect was already described in the presence of the Al3+ Lewis acid site (LAS) in the sodalite cage by Li et al. [39].
Unlike Brønsted acid sites, all samples have multiple bands of adsorbed probe molecule that match Lewis acid sites (Figure 5). Those sites can be roughly divided into three different regions: type 1 (from 2303 to 2317 cm−1), type 2 (from 2321 to 2324 cm−1), and type 3 (around 2327 cm−1). Their ratios vary from sample to sample and they are prone to shifts and disappearance at higher temperatures due to cation migrations and probe molecule protonation.
Type 1 sites are caused by the presence of the metal cations in the zeolite framework and usually consist of one or two bands depending on the number of different sites in zeolite that accommodate the cation. The number of those LAS does not always increase with the increase in a number of metal atoms in the framework. For samples exchanged with Co2+, the number of adsorbed probe molecules on Lewis acid sites at 150 °C slightly decreases with the increase of the Si/Al ratio but the amount of D3-acetonitrile bound to stronger acid sites stays unchanged for the samples with a Si/Al ratio over 2 (Figure 6).
Comparing the spectra of samples to those of D3-acetonitrile absorbed on H-FAU we were able to conclude that type 2 sites are related to the presence of H3O+ in the framework and are the result of protonation of the probe molecule, which is in accordance with Hadjiivanov [40]. Type 3 sites indicate the presence of extra framework aluminum (EF-Al) which is further confirmed by the weak band around 3600 cm−1 (Figure 3) [41,42,43]. The presence of the EF-Al in the framework can propagate the formation of Brønsted acid sites [44]. If we compare the number of D3–acetonitrile molecules adsorbed on EF-Al Lewis acid sites between the samples of the ZX–Ct series (Figure 7) it can be seen that even though samples with Mg, Ni, and Zn have a fairly similar numbers of EF–Al, ZX-Ct-Ni has far fewer BAS than the other two. That further solidifies the assumption that the increase of acid site strength is caused by the presence of the exchanged cation in the sodalite cage rather than the EF–Al.
Changes in the Lewis acidity for these cations indicate that the number of those acid sites mainly depends on the number of metal cations in the binding sites I’ and II’. Since the preferred binding site of Co2+ and Ni2+ is site I, it is coordinatively saturated (mostly by Ox, which means oxygen directly binds to the zeolite framework) and does not allow binding of D3–acetonitrile to a metal center.
On the other hand, the preferred positions for Mg2+ and Zn2+ are II’ and I’. Therefore, they occupy the position more accessible (within the alpha cage) for D3-acetonitrile probe molecules adsorbed to the Lewis site, and the result is a higher number of determined acid sites (Figure 6).
If we look at the ratio between probe molecules bound to Brønsted and Lewis acid sites, it can be seen that all cations create a larger number of BAS than LAS, except Ni2+ which preferably creates more Lewis sites (Figure 7). Approximately linear growth of the BAS/LAS ratio with the Si/Al ratio at 150 °C shows usual behavior at higher temperature: faster elimination of D3-acetonitrile from LAS than from BAS with increased temperature of desorption. Additionally, it shows that the most thermally stable systems are the ZX-Ct series at all temperatures, and systems ZX-n are the most unstable. The availability of BAS and LAS in ZX-n can be explained by a more open structure (also positions for exchangeable cations) due to the much larger outer crystal surface.
The DRS spectra of samples after wet impregnation with Co, Ni, Mg, and Zn are shown in Figure 8. It is evident that the strongest bands are associated with Co2+ species in all three ZX samples. Absorption spectra of ZX-Ct-Co and ZX-6060-Co have a band in the visible region at 520 nm assigned to the 4T1(P) ← 4A2, near 600 nm from 4A2g4T1g and a broadband from 1000 to 1400 nm from 4T2g4T1g. All of these transitions indicate the presence of octahedrally coordinated [Co(H2O)6]2+ in the binding site III’ in hydrated samples [45,46]. The shoulder at 620 nm can be attributed to the small amount of tetrahedrally coordinated Co3+ [47], but the exact amount is hard to determine due to overlapping with the band at 720 nm from octahedrally coordinated Co2+ at binding site I [48]. On the other hand, ZX-n-Co has typical tetrahedral triplet bands which did not disappear, even after being exposed to air moisture for a week [49]. This indicates the formation of very stable pseudo tetrahedral Co(Ox)3H2O species within the framework (Ox stands for oxygen directly bound to the zeolite framework). This is in accordance with the work published by Egerton et al. [50], which mentions the tendency of cobalt(II) to have tetrahedral coordination at high loadings. All samples have weak bands from 250–400 nm. The band at 370 nm can be assigned to the presence of Co(OH)2 while the shoulder at 400 nm in ZX–6060–Co and ZX–n–Co samples can be assigned to the mixed cobalt oxide, Co3O4 [51].
The situation is similar for the samples impregnated with nickel. Sample ZX-Ct-Ni has a band in the visible region at 400 nm assigned to the 3T1g(P) ← 3A2g and two bands between 600 and 800 nm from 1Eg3A2g and 3T1g3A2g. All of these transitions indicate presence of octahedral coordinated [Ni(Ox)6]2+ [52,53,54] in the binding site I. In the ZX-6060-Ni and ZX-n-Ni samples, another band at 430 nm can be seen. This is from Ni(OH)2, which also has an additional band at 384 nm [55,56] that overlaps with those of octahedral nickel(II). Weak bands around 300 nm indicate the presence of small amounts of NiO. Samples containing Mg and Zn have no visible bands in the region from 200 to 1500 nm, so we can only assume that those samples would follow the same trend in metal coordination. The weak bands at 970, 1180, and 1430 nm come from the zeolite network and are shown as inserts in Figure 8. This implies that samples with low Si/Al ratio, and larger accessible surface have a tendency to form a small amount of metal oxide particles, not detectable by PXRD [57], that have very weak Lewis acid sites. The formation of these particles also leads to a decrease in the overall number of acid sites.

4. Conclusions

Samples with different Si/Al ratios treated with M2+ salts under the same conditions were analyzed to determine the strength and number of acid sites. In spite of similar M2+ relatively high loadings, the total amount and ratio between Brønsted and Lewis acid sites varied greatly. The amount and strength of acid sites were primarily influenced by the location of the metal cation in the framework (positions II’ and I’ within the sodalite cage), the amount of structural defects generated by wet impregnation, and the amount of metal oxide formed during cation insertion.
The structural healing effect is observed for silanol nests after insertion (wet impregnation + thermal treatment) of any of the used Me cations (Mg, Zn, Co, Ni) in all three ZX samples. The most pronounced example (from PXRD and FTIR data) is the insertion of Mg2+ cations into nanosized ZX crystals (sample ZX-n-Mg).
Samples ZX-Ct-Mg and ZX-Ct-Zn had the highest amount of strong Brønsted acid sites, which is explained by an increase of the number of cations in the binding site II’ that stabilize H+ in the sodalite cage mostly with stable octahedral coordination. Insertion of Ni2+ in the structure preferably formed more Lewis than Brønsted acid sites, while other cations had the opposite effect. Furthermore, with the decrease in the Si/Al ratio, the proportion of BAS/LAS slightly increases, due to the formation of metal oxide particles that have weak Lewis acidity and whose formation leads to the mitigation of stronger acid sites.

Author Contributions

Conceptualization, experimental research, data collection, and analysis draft writing: G.M.; data analysis, visualization, and validation: A.P.; concept, resources, writing—review and editing, and supervision: J.B. All authors have read and agreed to the published version of the manuscript.

Funding

This research received no external funding.

Data Availability Statement

No additional data available.

Acknowledgments

This work was financially supported by Croatian Science Foundation through the project IP-2016-06-2214.

Conflicts of Interest

The authors declare no conflict of interest. The funders had no role in the design of the study; in the collection, analysis, or interpretation of data; in the writing of the manuscript; or in the decision to publish the results.

References

  1. Haas, A.; Harding, D.; Nee, J. FCC catalysts containing the high-silica faujasites EMO and EMT for gas-oil cracking. Micropor. Mesopor. Mater. 1999, 28, 325–333. [Google Scholar] [CrossRef]
  2. Rodionova, L.; Knyazeva, E.; Konnov, S.V.; Ivanova, I. Application of Nanosized Zeolites in Petroleum Chemistry: Synthesis and Catalytic Properties (Review). Pet. Chem. 2019, 59, 455–470. [Google Scholar] [CrossRef]
  3. Guzmán-Castillo, M.; Armendáriz-Herrera, H.; Pérez-Romo, P.; Hernández-Beltrán, F.; Ibarra, S.; Valente, J.; Fripiat, J. Y zeolite depolymerization-recrystallization: Simultaneous formation of hierarchical porosity and Na dislodging. Micropor. Mesopor. Mater. 2011, 143, 375–382. [Google Scholar] [CrossRef]
  4. Sachse, A.; Grau-Atienza, A.; Jardim, E.; Linares, N.; Thommes, M.; García-Martínez, J. Development of Intracrystalline Mesoporosity in Zeolites through Surfactant-Templating. Cryst. Growth Des. 2017, 17, 4289–4305. [Google Scholar] [CrossRef]
  5. Verboekend, D.; Nuttens, N.; Locus, R.; Van Aelst, J.; Verolme, P.; Groen, J.; Pérez-Ramírez, J.; Sels, B. Synthesis, characterisation, and catalytic evaluation of hierarchical faujasite zeolites: Milestones, challenges, and future directions. Chem. Soc. Rev. 2016, 45, 3331–3352. [Google Scholar] [CrossRef] [Green Version]
  6. Otto, T.; Zones, S.; Iglesia, E. Synthetic strategies for the encapsulation of nanoparticles of Ni, Co, and Fe oxides within crystalline microporous aluminosilicates. Micropor. Mesopor. Mater. 2018, 270, 10–23. [Google Scholar] [CrossRef]
  7. Kostyniuk, A.; Bajec, D.; Likozar, B. Catalytic hydrogenation, hydrocracking and isomerization reactions of biomass tar model compound mixture over Ni-modified zeolite catalysts in packed bed reactor. Renew. Energy 2021, 167, 409–424. [Google Scholar] [CrossRef]
  8. Choo, M.; Oi, L.; Ling, T.; Ng, E.; Lin, Y.; Centi, G.; Juan, J. Deoxygenation of triolein to green diesel in the H2-free condition: Effect of transition metal oxide supported on zeolite Y. J. Anal. Appl. Pyrolysis 2020, 147, 104797. [Google Scholar] [CrossRef]
  9. Lakiss, L.; Kouvatas, C.; Gilson, J.; Aleksandrov, H.; Vayssilov, G.; Nesterenko, N.; Mintova, S.; Valtchev, V. Unlocking the Potential of Hidden Sites in Faujasite: New Insights in a Proton Transfer Mechanism. Angew. Chem. Int. Ed. 2021, 133, 26906–26913. [Google Scholar] [CrossRef]
  10. Datka, J.; Gil, B.; Kawałek, M.; Staudte, B. Low temperature IR studies of CO sorbed in ZSM-5 zeolites. J. Mol. Struct. 1999, 511–512, 133–139. [Google Scholar] [CrossRef]
  11. Sadowska, K.; Góra-Marek, K.; Datka, J. Accessibility of acid sites in hierarchical zeolites: Quantitative IR studies of pivalonitrile adsorption. J. Phys. Chem. C 2013, 117, 9237–9244. [Google Scholar] [CrossRef]
  12. Thibault-Starzyk, F.; Travert, A.; Saussey, J.; Lavalley, J. Correlation between activity and acidity on zeolites: A high temperature infrared study of adsorbed acetonitrile. Top. Catal. 1998, 6, 111–118. [Google Scholar] [CrossRef]
  13. Huang, Z.; Li, T.; Yang, B.; Chang, C. Role of surface frustrated Lewis pairs on reduced CeO2(110) in direct conversion of syngas. Chin. J. Catal. 2020, 41, 1906–1915. [Google Scholar] [CrossRef]
  14. Olszowka, J.; Lemishka, M.; Mlekodaj, K.; Kubat, P.; Rutkowska-Żbik, D.; Dedecek, J.; Tabor, E. Determination of Zn Speciation, Siting, and Distribution in Ferrierite Using Luminescence and FTIR Spectroscopy. J. Phys. Chem. C. 2021, 125, 9060–9073. [Google Scholar] [CrossRef]
  15. Montanari, T.; Bevilacqua, M.; Resini, C.; Busca, G. UV-Vis and FT-IR Study of the Nature and Location of the Active Sites of Partially Exchanged Co-H Zeolites. J. Phys. Chem. B 2004, 108, 2120–2127. [Google Scholar] [CrossRef]
  16. Shannon, R.D. Revised Effective Ionic Radii and Systematic Studies of Interatomie Distances in Halides and Chaleogenides. Acta Cryst. 1976, 32, 751–767. [Google Scholar] [CrossRef]
  17. Bacariza, M.; Maleval, M.; Graça, I.; Lopes, J.; Henriques, C. Power-to-Methane over Ni/Zeolites: Influence of the Framework Type. Micropor. Mesopor. Mater. 2019, 274, 102–112. [Google Scholar] [CrossRef]
  18. Afreen, G.; Patra, T.; Upadhyayula, S. Zn-Loaded HY Zeolite as Active Catalyst for Iso-Propylation of Biomass-Derived Phenolic Compounds: A Comparative Study on the Effect of Acidity and Porosity of Zeolites. Mol. Catal. 2017, 441, 122–133. [Google Scholar] [CrossRef]
  19. Kim, H.; Choi, S.; Lim, W. Preparation and Structural Study of Fully Dehydrated, Highly Mg2+-Exchanged Zeolite Y (FAU, Si/Al = 1.56) from Undried Methanol Solution. J. Porous Mater. 2014, 21, 659–665. [Google Scholar] [CrossRef]
  20. Imre, B.; Konya, Z.; Hannus, I.; Halasz, J.; Nagy, J.; Kiricsi, I. Hydrodechlorination of Chlorinated Compounds on Different Zeolites. Stud. Surf. Sci. Catal. 2002, 142, 927–934. [Google Scholar]
  21. Awala, H.; Gilson, J.; Retoux, R.; Boullay, P.; Goupil, J.; Valtchev, V.; Mintova, S. Template-free nanosized faujasite-type zeolites. Nat. Mater. 2015, 14, 447–451. [Google Scholar] [CrossRef] [PubMed]
  22. Bosnar, S.; Bosnar, D.; Ren, N.; Rajić, N.; Gržeta, B.; Subotić, B. Positron lifetimes in pores of some low-silica zeolites: Influence of water content, crystal size and structural type. J. Porous Mater. 2013, 20, 1329–1336. [Google Scholar] [CrossRef]
  23. Wichterlova, P.; Tvaružkova, B.; Sobalik, Z.; Sarv, Z. Determination and properties of acid sites in H-ferrierite A comparison of ferrierite and MFI structures. Micropor. Mesopor. Mater. 1998, 24, 223–233. [Google Scholar] [CrossRef]
  24. Srivastava, V.; Gusain, D.; Sharma, Y. Synthesis, characterization and application of zinc oxide nanoparticles (n-ZnO). Ceram. Int. 2013, 39, 9803–9808. [Google Scholar] [CrossRef]
  25. Bulavchenko, O.; Cherepanova, S.V.; Malakhov, V.V.; Dovlitova, L.; Ishchenko, A.V.; Tsybulya, S.V. In situ XRD study of nanocrystalline cobalt oxide reduction. Kinet. Catal. 2009, 50, 192–198. [Google Scholar] [CrossRef]
  26. Dharmaraj, N.; Prabu, P.; Nagarajan, S.; Kim, C.; Park, J.; Kim, H. Synthesis of nickel oxide nanoparticles using nickel acetate and poly(vinyl acetate) precursor. Mater. Sci. Eng. B Solid State Mater. Adv. Technol. 2006, 128, 111–114. [Google Scholar] [CrossRef]
  27. Aramendía, M.; Benítez, J.; Borau, V.; Jiménez, C.; Marinas, J.; Ruiz, J.; Urbano, F. Characterization of Various Magnesium Oxides by XRD and1H MAS NMR Spectroscopy. J. Solid State Chem. 1999, 144, 25–29. [Google Scholar] [CrossRef]
  28. Palčić, A.; Moldovan, S.; El Siblani, H.; Vicente, A.; Valtchev, V. Defect Sites in Zeolites: Origin and Healing. Adv. Sci. 2022, 9, 2104414. [Google Scholar] [CrossRef]
  29. Tang, Y.; Liu, Y.; Yu, S.; Guo, W.; Mu, S.; Wang, H.; Zhao, Y.; Hou, L.; Fan, Y.; Gao, F. Template-free hydrothermal synthesis of nickel cobalt hydroxide nanoflowers with high performance for asymmetric supercapacitor. Electrochim. Acta 2015, 161, 279–289. [Google Scholar] [CrossRef]
  30. Noei, H.; Qiu, H.; Wang, Y.; Löffler, E.; Wöll, C.; Muhler, M. The identification of hydroxyl groups on ZnO nanoparticles by infrared spectroscopy. Phys. Chem. Chem. Phys. 2008, 10, 7092–7097. [Google Scholar] [CrossRef]
  31. Li, X.; Han, H.; Xu, W.; Hwang, S.J.; Lu, P.; Bhan, A.; Tsapatsis, M. Enhanced Reactivity of Accessible Protons in Sodalite Cages of Faujasite Zeolite. Angew. Chem. Int. Ed. 2022, 61, e202111180. [Google Scholar] [CrossRef]
  32. Chizallet, C.; Costentin, G.; Che, M.; Delbecq, F.; Sautet, P. Infrared characterization of hydroxyl groups on MgO: A periodic and cluster density functional theory study. J. Am. Chem. Soc. 2007, 129, 6442–6452. [Google Scholar] [CrossRef] [PubMed]
  33. Knözinger, E.; Jacob, K.; Singh, S.; Hofmann, P. Hydroxyl groups as IR active surface probes on MgO crystallites. Surf. Sci. 1993, 290, 388–402. [Google Scholar] [CrossRef]
  34. Seo, S.; Lim, W.; Seff, K. Single-crystal structures of fully and partially dehydrated zeolite y (FAU, Si/Al = 1.56) Ni 2+ exchanged at a low pH, 4.9. J. Phys. Chem. C 2012, 116, 13985–13996. [Google Scholar] [CrossRef]
  35. Seo, S.; Moon, D.; An, J.; Jeong, H.; Lim, W. Time-dependent Ni2+-ion exchange in zeolites y (FAU, si/Al = 1.56) and their single-crystal structures. J. Phys. Chem. C 2016, 120, 28563–28574. [Google Scholar] [CrossRef]
  36. Kim, C.; Jung, K.; Heo, N.; Seff, K. Crystal Structures of Vacuum-Dehydrated Ni2+-Exchanged Zeolite Y (FAU, Si/Al = 1.69) Containing Three-Coordinate Ni2+, Ni8O4·xH2O8+, x ≤ 4, Clusters with Near Cubic Ni4O4 Cores, and H+. J. Phys. Chem. C 2009, 113, 5164–5181. [Google Scholar] [CrossRef]
  37. Pelmenschikov, A.; Van Santen, R.; Jänchen, J.; Meijer, E. CD3CN as a probe of Lewis and Bronsted acidity of zeolites. J. Phys. Chem. 1993, 97, 11071–11074. [Google Scholar] [CrossRef] [Green Version]
  38. Frising, T.; Leflaive, P. Extraframework cation distributions in X and Y faujasite zeolites: A review. Micropor. Mesopor. Mater. 2008, 114, 27–63. [Google Scholar] [CrossRef]
  39. Li, S.; Zheng, A.; Su, Y.; Zhang, H.; Chen, L.; Yang, J. Brønsted/Lewis Acid Synergy in Dealuminated HY Zeolite: A Combined Solid-State NMR and Theoretical Calculation Study. J. Am. Chem. Soc. 2007, 129, 11161–11171. [Google Scholar] [CrossRef]
  40. Hadjiivanov, K. Chapter 2: Identification and Characterization of Surface Hydroxyl Groups by Infrared Spectroscopy. Adv. Catal. 2014, 57, 99–318. [Google Scholar] [CrossRef]
  41. Batool, S.; Sushkevich, V.; van Bokhoven, J. Correlating Lewis acid activity to extra-framework aluminum species in zeolite Y introduced by Ion-exchange. J. Catal. 2022, 408, 24–35. [Google Scholar] [CrossRef]
  42. Xu, B.; Bordiga, S.; Prins, R.; Van Bokhoven, J. Effect of framework Si/Al ratio and extra-framework aluminum on the catalytic activity of Y zeolite. Appl. Catal. A General 2007, 333, 245–253. [Google Scholar] [CrossRef]
  43. Lutz, W.; Rüscher, C.; Heidemann, D. Determination of the framework and non-framework [SiO2] and [AlO2] species of steamed and leached faujasite type zeolites: Calibration of IR, NMR, and XRD data by chemical methods. Micropor. Mesopor. Mater. 2002, 55, 193–202. [Google Scholar] [CrossRef]
  44. Bhering, D.; Ramírez-Solís, A.; Mota, C. A density functional theory based approach to extraframework aluminum species in zeolites. J. Phys. Chem. B 2003, 107, 4342–4347. [Google Scholar] [CrossRef]
  45. Han, J.; Woo, S. UV/VIS diffuse reflectance spectroscopic (DRS) study of cobalt-containing Y zeolites dehydrated at elevated temperatures. Korean J. Chem. Eng. 1991, 8, 235–239. [Google Scholar] [CrossRef]
  46. Sebastian, J.; Jinka, K.; Jasra, R. Effect of alkali and alkaline earth metal ions on the catalytic epoxidation of styrene with molecular oxygen using cobalt (II)-exchanged zeolite X. J. Catal. 2006, 244, 208–218. [Google Scholar] [CrossRef]
  47. Smeets, P.; Woertink, J.; Sels, B.; Solomon, E.; Schoonheydt, R. Transition-Metal Ions in Zeolites: Coordination and Activation of Oxygen. Inorg. Chem. 2010, 49, 3573–3583. [Google Scholar] [CrossRef] [Green Version]
  48. Verberckmoes, A.; Weckhuysen, B.; Schoonheydt, R. Spectroscopy and coordination chemistry of cobalt in molecular sieves 1. Micropor. Mesopor. Mater. 1998, 22, 165–178. [Google Scholar] [CrossRef] [Green Version]
  49. Verberckmoes, A.; Weckhuysen, B.; Pelgrims, J.; Schoonheydt, R. Diffuse reflectance spectroscopy of dehydrated cobalt-exchanged faujasite-type zeolites: A new method for Co2+ siting. J. Phys. Chem. 1995, 99, 15222–15228. [Google Scholar] [CrossRef] [Green Version]
  50. Egerton, T.; Hagan, A.; Stone, F.; Vickerman, J. Magnetic Studies of Zeolites. Part 1.—The magnetic properties of CoY and CoA. J. Chem. Soc. Faraday Trans. 1971, 68, 723–735. [Google Scholar] [CrossRef]
  51. Alrehaily, L.; Joseph, J.; Biesinger, M.; Guzonas, D.; Wren, J. Gamma-radiolysis-assisted cobalt oxide nanoparticle formation. Phys. Chem. Chem. Phys. 2013, 15, 1014–1024. [Google Scholar] [CrossRef] [PubMed]
  52. Bacariza, M.; Graça, I.; Westermann, A.; Ribeiro, M.; Lopes, J.; Henriques, C. CO2 Hydrogenation over Ni-Based Zeolites: Effect of Catalysts Preparation and Pre-reduction Conditions on Methanation Performance. Top. Catal. 2016, 59, 314–325. [Google Scholar] [CrossRef]
  53. Schoonheydt, R.; Roodhooft, D.; Leeman, H. Coordination of Ni2+ to lattice oxygens of the zeolites X and Y. Zeolites 1987, 7, 412–417. [Google Scholar] [CrossRef]
  54. Lever, A. Inorganic Electronic Spectroscopy, 1st ed.; Elsevier Publishing Company: Amsterdam, The Netherlands, 1968. [Google Scholar]
  55. Graça, I.; González, L.V.; Bacariza, M.; Fernandes, A.; Henriques, C.; Lopes, J.; Ribeiro, M. CO2 hydrogenation into CH4 on NiHNaUSY zeolites. Appl. Catal. B Environ. 2014, 147, 101–110. [Google Scholar] [CrossRef]
  56. Qi, Y.; Qi, H.; Li, J.; Lu, C. Synthesis, microstructures and UV-vis absorption properties of β-Ni(OH)2 nanoplates and NiO nanostructures. J. Cryst. Growth 2008, 310, 4221–4225. [Google Scholar] [CrossRef]
  57. Zhang, Z.; Xiao, Q.; Gu, J. Effective synthesis of zeolite-encapsulated Ni nanoparticles with excellent catalytic performance for hydrogenation of CO2 to CH4. Dalt. Trans. 2020, 49, 14771–14775. [Google Scholar] [CrossRef]
Figure 1. XRD patterns of parent samples before cation insertion (A). SEM images of nanocrystals, ZX-n. Insert—magnification of 33,000× (B). The sample prepared with the addition of CTAB during synthesis, ZX-Ct (C), and sample exposed to a mixture of NaOH + TPAOH solution and consecutive thermal treatment (insert—ZX crystals before etching), ZX-6060 (D).
Crystals 13 00332 g001
Figure 2. XRD patterns for the series of ZX-n (A), ZX-Ct (B), and ZX-6060 (C) samples before and after wet impregnation (Zn, Ni, Co, Mg) and consecutive thermal treatment. The scale for ZX-n samples is expanded for better visibility.
Crystals 13 00332 g002
Figure 3. FTIR spectra of OH groups in the region from 3800 to 3100 cm−1 of prepared samples before and after insertion of Mg2+, Co2+, Ni2+, and Zn2+ cations of samples: ZX-n (A), ZX-Ct (B), ZX-6060 (C), OH groups of used parent samples (D), OH groups of H-form of ZX-(E), an example of deconvolution of adsorbed acetonitrile FTIR spectra for ZX-Ct-Co sample at 150 °C (F).
Crystals 13 00332 g003
Figure 4. FAU structure with marked positions of exchangeable cations.
Crystals 13 00332 g004
Figure 5. Number of Brønsted acid sites per gram of zeolite for samples after cation insertion, determined from the amount of desorbed D3-acetonitrile molecules at BAS at 150 °C (A), BAS at 200 °C (B), BAS at 300 °C (C). The legend on graph (C) is valid for all graphs (AC).
Crystals 13 00332 g005
Figure 6. Number of specific acid sites per gram of zeolite determined from the amount of adsorbed D3–acetonitrile molecules at different temperatures: LAS at 150 °C (A), LAS at 200 °C (B), LAS at 300 °C (C). Unspecified acid sites: AS at 150 °C (D), AS at 200 °C (E), AS at 300 °C (F). The legend on graph C is valid for all graphs (AF).
Crystals 13 00332 g006
Figure 7. Dependence of ratio of Brønsted to Lewis acid sites (BAS/LAS) on the Si/Al ratio at 150 °C (A) and 200 °C (B). The number of extra framework aluminum (EF-Al) Lewis acid sites (C), obtained from deconvolution of the band at 2327 cm−1. Si/Al ratio was also calculated from the number of adsorbed D3-acetonitrile molecules.
Crystals 13 00332 g007
Figure 8. UV–Vis DRS spectra of samples after insertion of Co2+, Ni2+, Mg2+, and Zn2+ cations and consecutive thermal treatment.
Crystals 13 00332 g008
Table 1. Molar quantity of elements determined by flame atomic absorption spectroscopy (FAAS) and Si/Al ratio.
SampleONaAlSiMetalSi/Al
ZX-n-Na4.640.690.691.00 1.44
ZX-n-Mg4.990.320.671.000.191.50
ZX-n-Co4.150.260.681.000.201.47
ZX-n-Ni4.770.290.671.000.211.50
ZX-n-Zn4.480.180.701.000.231.48
ZX-Ct-Na4.210.500.501.00 1.99
ZX-Ct-Mg4.440.160.481.000.152.09
ZX-Ct-Co4.300.180.481.000.152.09
ZX-Ct-Ni4.040.150.451.000.142.21
ZX-Ct-Zn4.150.150.481.000.142.10
ZX-6060-Na3.940.440.441.00 2.27
ZX-6060-Mg4.160.160.431.000.122.27
ZX-6060-Co3.990.170.431.000.142.30
ZX-6060-Ni4.030.150.441.000.142.28
ZX-6060-Zn4.090.140.441.000.132.28
Disclaimer/Publisher’s Note: The statements, opinions and data contained in all publications are solely those of the individual author(s) and contributor(s) and not of MDPI and/or the editor(s). MDPI and/or the editor(s) disclaim responsibility for any injury to people or property resulting from any ideas, methods, instructions or products referred to in the content.

