Article

Microstructure and Property Evolutions of Q345B Steel during Ultrasonic Shot Peening

1
College of Mechanics and Materials, Hohai University, Nanjing 211100, China
2
Jiangsu Technical Center for Wind Energy Engineering, Nanjing 210008, China
*
Author to whom correspondence should be addressed.
Crystals 2023, 13(2), 299; https://doi.org/10.3390/cryst13020299
Submission received: 9 January 2023 / Revised: 4 February 2023 / Accepted: 9 February 2023 / Published: 11 February 2023
(This article belongs to the Section Crystalline Metals and Alloys)

Abstract

:
In this paper, the surface of Q345B steel was strengthened using ultrasonic shot peening (USP) technology. Through the adjustment of USP time, power and distance, the surface morphology, roughness and microhardness of the USPed samples were measured using scanning electron microscopy (SEM), energy dispersive analysis (EDS), a roughmeter and a microhardness tester. At the same time, the corrosion behavior of USPed samples was observed and analyzed using software simulation calculation and an immersion experiment on the dynamic polarization curve. Through tests and characterization, the influence of different USP process parameters on Q345B steel and the relationship between them were explored. The original intention of this research was to obtain better parameters to improve both the strength and corrosion resistance of the material. The results indicated that, with the increase in the USP time and power and the decrease in the USP distance, the surface roughness, the thickness of the deformed layer and the microhardness of the samples increased at first and then stabilized, and an obvious delamination phenomenon and chemical composition difference appeared between the deformed layer and the substrate. It was shown that a longer USP time and a shorter USP distance caused spalling and cracks on a substrate surface, resulting in the corrosion becoming more serious. However, with the increase in the USP power, the corrosion resistance of the sample improved.

1. Introduction

Surface mechanical attrition treatment (SMRT) is a technology used to change structures and properties on the surfaces of alloys through the application of severe plastic deformation (SPD). After SMRT, nanocrystallization and excellent properties, such as high levels of hardness, fracture toughness and wear resistance, are obtained on the surfaces of metallic materials. Ultrasonic shot peening [1] is a new SMRT method which is different from traditional shot peening but is a similar concept; it involves processing the surface of a material. It is an effective method used to prepare nanocrystalline layers on the surfaces of coarse bulk metallic materials [2,3,4,5,6].
The USP process is advantageous, as it provides high precision, the easy control of process parameters, a high surface quality and effective surface nanoization [7,8,9] and surface modification [3]. After USP treatment, the corrosivity of a material surface is complicated. Some research [10,11,12,13] proved that the corrosion resistance of a material is enhanced by surface strengthening treatment; on the other hand, some research [14,15,16] proved that surface strengthening treatment will reduce the corrosion resistance of a material. Differences in opinion also exist regarding the change in the roughness value after ultrasonic shot peening. Ramos et al. [17] found that a material’s surface roughness after USP treatment was lower than that caused by particle peening. Zhu et al. [18] found that, with the increase in time, the surface roughness of pure titanium became higher because, after USP treatment, the surface pits formed peaks and valleys on the surface of the sample. Ultrasonic shot peening can also be understood as a contact–collision problem, which can be analyzed via finite element theory [19,20] to further deepen the understanding of the strengthening mechanism in ultrasonic shot peening.
Steel is one of the most widely used metals by human beings. Compared with other metals, iron ore has higher smelting and processing efficiencies, a larger production scale and lower costs. With the continuous development of large-scale buildings, highways, bridges, vehicles and ships in China, low-alloy, high-strength steels have been widely used. In practical applications, the failure of materials mostly occurs on the surface or sub-surface, which directly affects the comprehensive service performance of components. Therefore, surface strengthening has become an indispensable processing procedure for key components of mechanical products [21,22,23,24,25]. Q345B steel is a type of low-alloy steel. Due to its comprehensive properties, low-temperature properties, cold stamping properties, welding properties and good machinability, it is widely used in bridges, vehicles, ships and other applications. However, its application is limited to a certain extent due to its shortcomings in terms of strength and hardness. After USP treatment, the hardness, strength and wear resistance of a material can be improved. The service life of a material is improved after the wear resistance is improved, which can greatly widen its application field. In previous studies, researchers only analyzed changes in roughness and hardness before and after ultrasonic shot peening and did not analyze the influence law of each process parameter specifically, and there was little analysis regarding the hardened layer of the shot peening section. Previous shot peening experiments focused more heavily on strength change and fatigue performance tests, but less research was carried out regarding the corrosion resistance of steel. In this paper, Q345B steel was used as the research object to carry out ultrasonic shot peening surface treatment, and projectile shot peening equipment was used. By controlling the shot peening process parameters, the changes in the surface roughness, microhardness and corrosion resistance of the samples before and after USP treatment were studied, and the thickness of the cross-section deformation layer in the samples was observed so as to analyze the influence of different parameters in the ultrasonic shot peening process on the surface structure and properties of Q345B steel. The relationship among the microstructure, strength and corrosion resistance was established.

2. Materials and Methods

The material used in this paper was Q345B steel plates with thicknesses of 10 mm and diameters of φ70 mm; the chemical composition is shown in Table 1; the mechanical property parameter is shown in Table 2. Before USP treatment, the samples were grinded using #100 SiC papers to obtain relatively smooth surfaces.
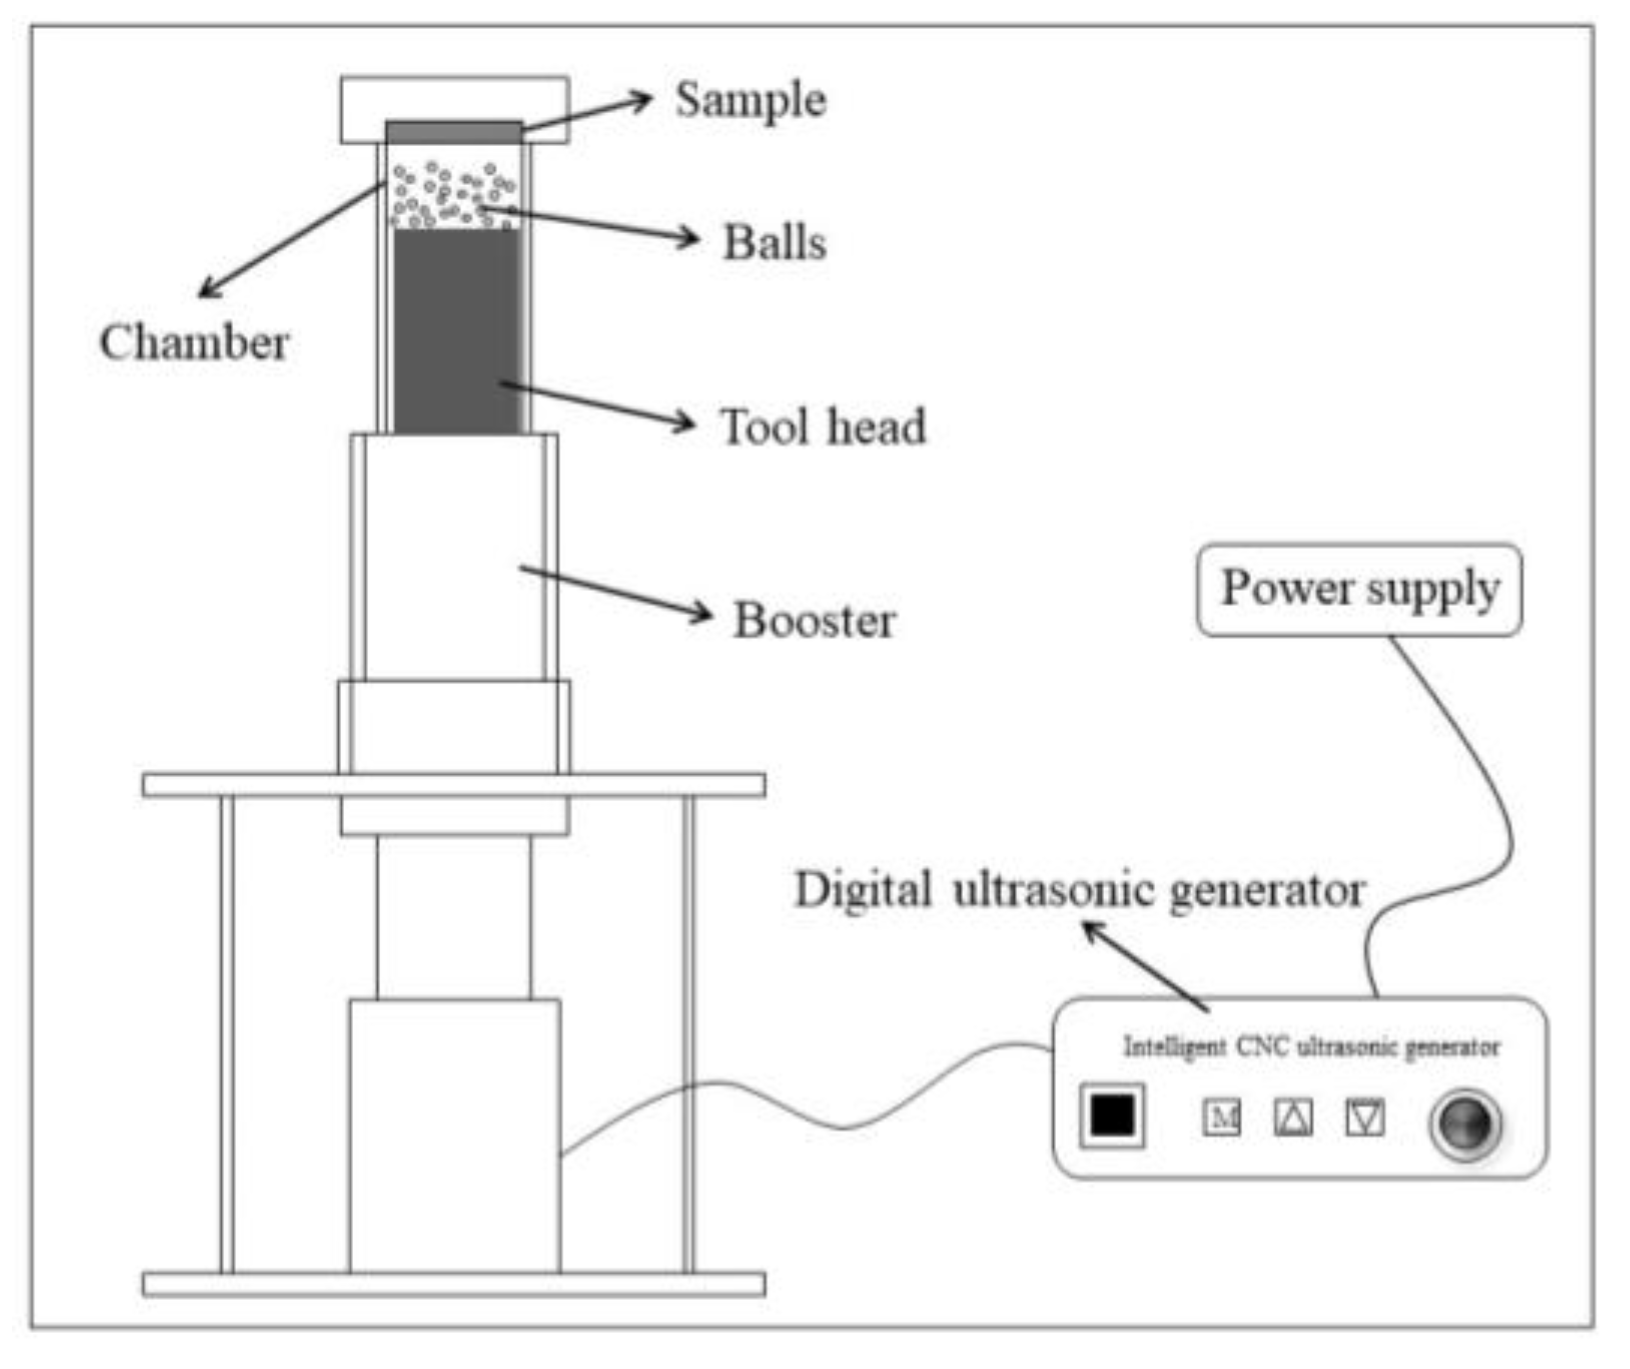
Figure 1 displays a diagram of USP equipment powered by an ultrasonic processor with a frequency of 15 kHz and a power of 2600 W. The selected shot peening medium was high-carbon chromium-bearing steel with a grade of GCr15 and a diameter of 3 mm. Due to its high hardness and good wear resistance, this shot peening can be reused many times. The given USP treatment samples could be characterized by three different parameters: shot peening time, shot peening power and shot peening distance. The peening distance represented the distance between the top surface of the tool head and the bottom surface of the samples. Enough pellets were used to cover the top layer of the tool head. The specific experimental parameters are shown in Table 3. After USP treatment, the samples were washed with alcohol to eliminate any impurities on the surface; then, they were air-dried in an oven.
The surface roughness of the un-USPed samples and USPed samples with different parameters was measured using the TR200 (Beijing, China) portable surface roughness meter. An average value of the surface roughness was taken from five locations on the surface of the samples. A Vickers microhardness tester HXD-1000TC (Shanghai, China) was used to press the diamond indenter into the surface of the sample under a load of 100 g, maintain the load for 15 s and then remove it; then, the hardness of the tested sample was calculated according to the indentation. The surface and cross-section microstructures were obtained with a Hitachi S-3400 N (Japan) scanning electron microscope (SEM), and the chemical composition of the samples was analyzed using a Horiba EX250 energy-dispersive spectroscope EDS (Japan). The phase structures of the samples before and after USP treatment were characterized via X-ray diffraction (XRD, Bruker D8-Advanced) (Japan) at a scanning speed of 5°/min with Cu Kα radiation (λ = 1.54 Å).
Corrosion experiments were carried out in the laboratory, in which 3.5 wt.% NaCl solution was used to simulate the actual marine environment. The samples used in the immersion test and electrochemical test were covered with a layer of epoxy resin, and a remaining surface area of about 1 cm2 was exposed to 3.5 wt.% NaCl solution. The immersion and electrochemical tests were conducted in 3.5 wt.% NaCl solution. Before and after the immersion test, the morphology of the samples was obtained via SEM, and the chemical composition of the corrosion products was analyzed via EDS. The electrochemical experiment was conducted with the CS310H electrochemical system containing three electrodes, i.e., a working electrode (specimen electrode), a reference electrode (saturated calomel electrode) and a counter electrode (platinum wire). As the OCP became steady, the potential dynamic polarization test was conducted at a scanning rate of 1 mV/s. All the tests were repeated three times or more to ensure the accuracy of the results.

3. Results

3.1. Microstructure

Figure 2 shows the cross-sectional SEM microstructure of the samples after USP treatment with different lengths of time, and the thickness statistics of the deformed layers are shown in Figure 2f. The grains on the surface layer of the sample were obviously refined [8,9], and the thickness of the deformed layer gradually increased as the USP time grew. From 50 s to 100 s, the thickness of the refinement area increased rapidly from 38 μm to 85 μm. Then, as the USP time increased, the growth in the deformation layer thickness slowed down, and from 100 s to 600 s, the thickness only increased from 85 μm to 104 μm. With the increase in the USP time, the impact of the steel ball on the surface of the samples increased; meanwhile, the plastic deformation increased, resulting in the enhancement of the work hardening. At the later USP stage, the plasticity of the samples’ surface was lost, and the growth rate of the deformed area thickness slowed down.
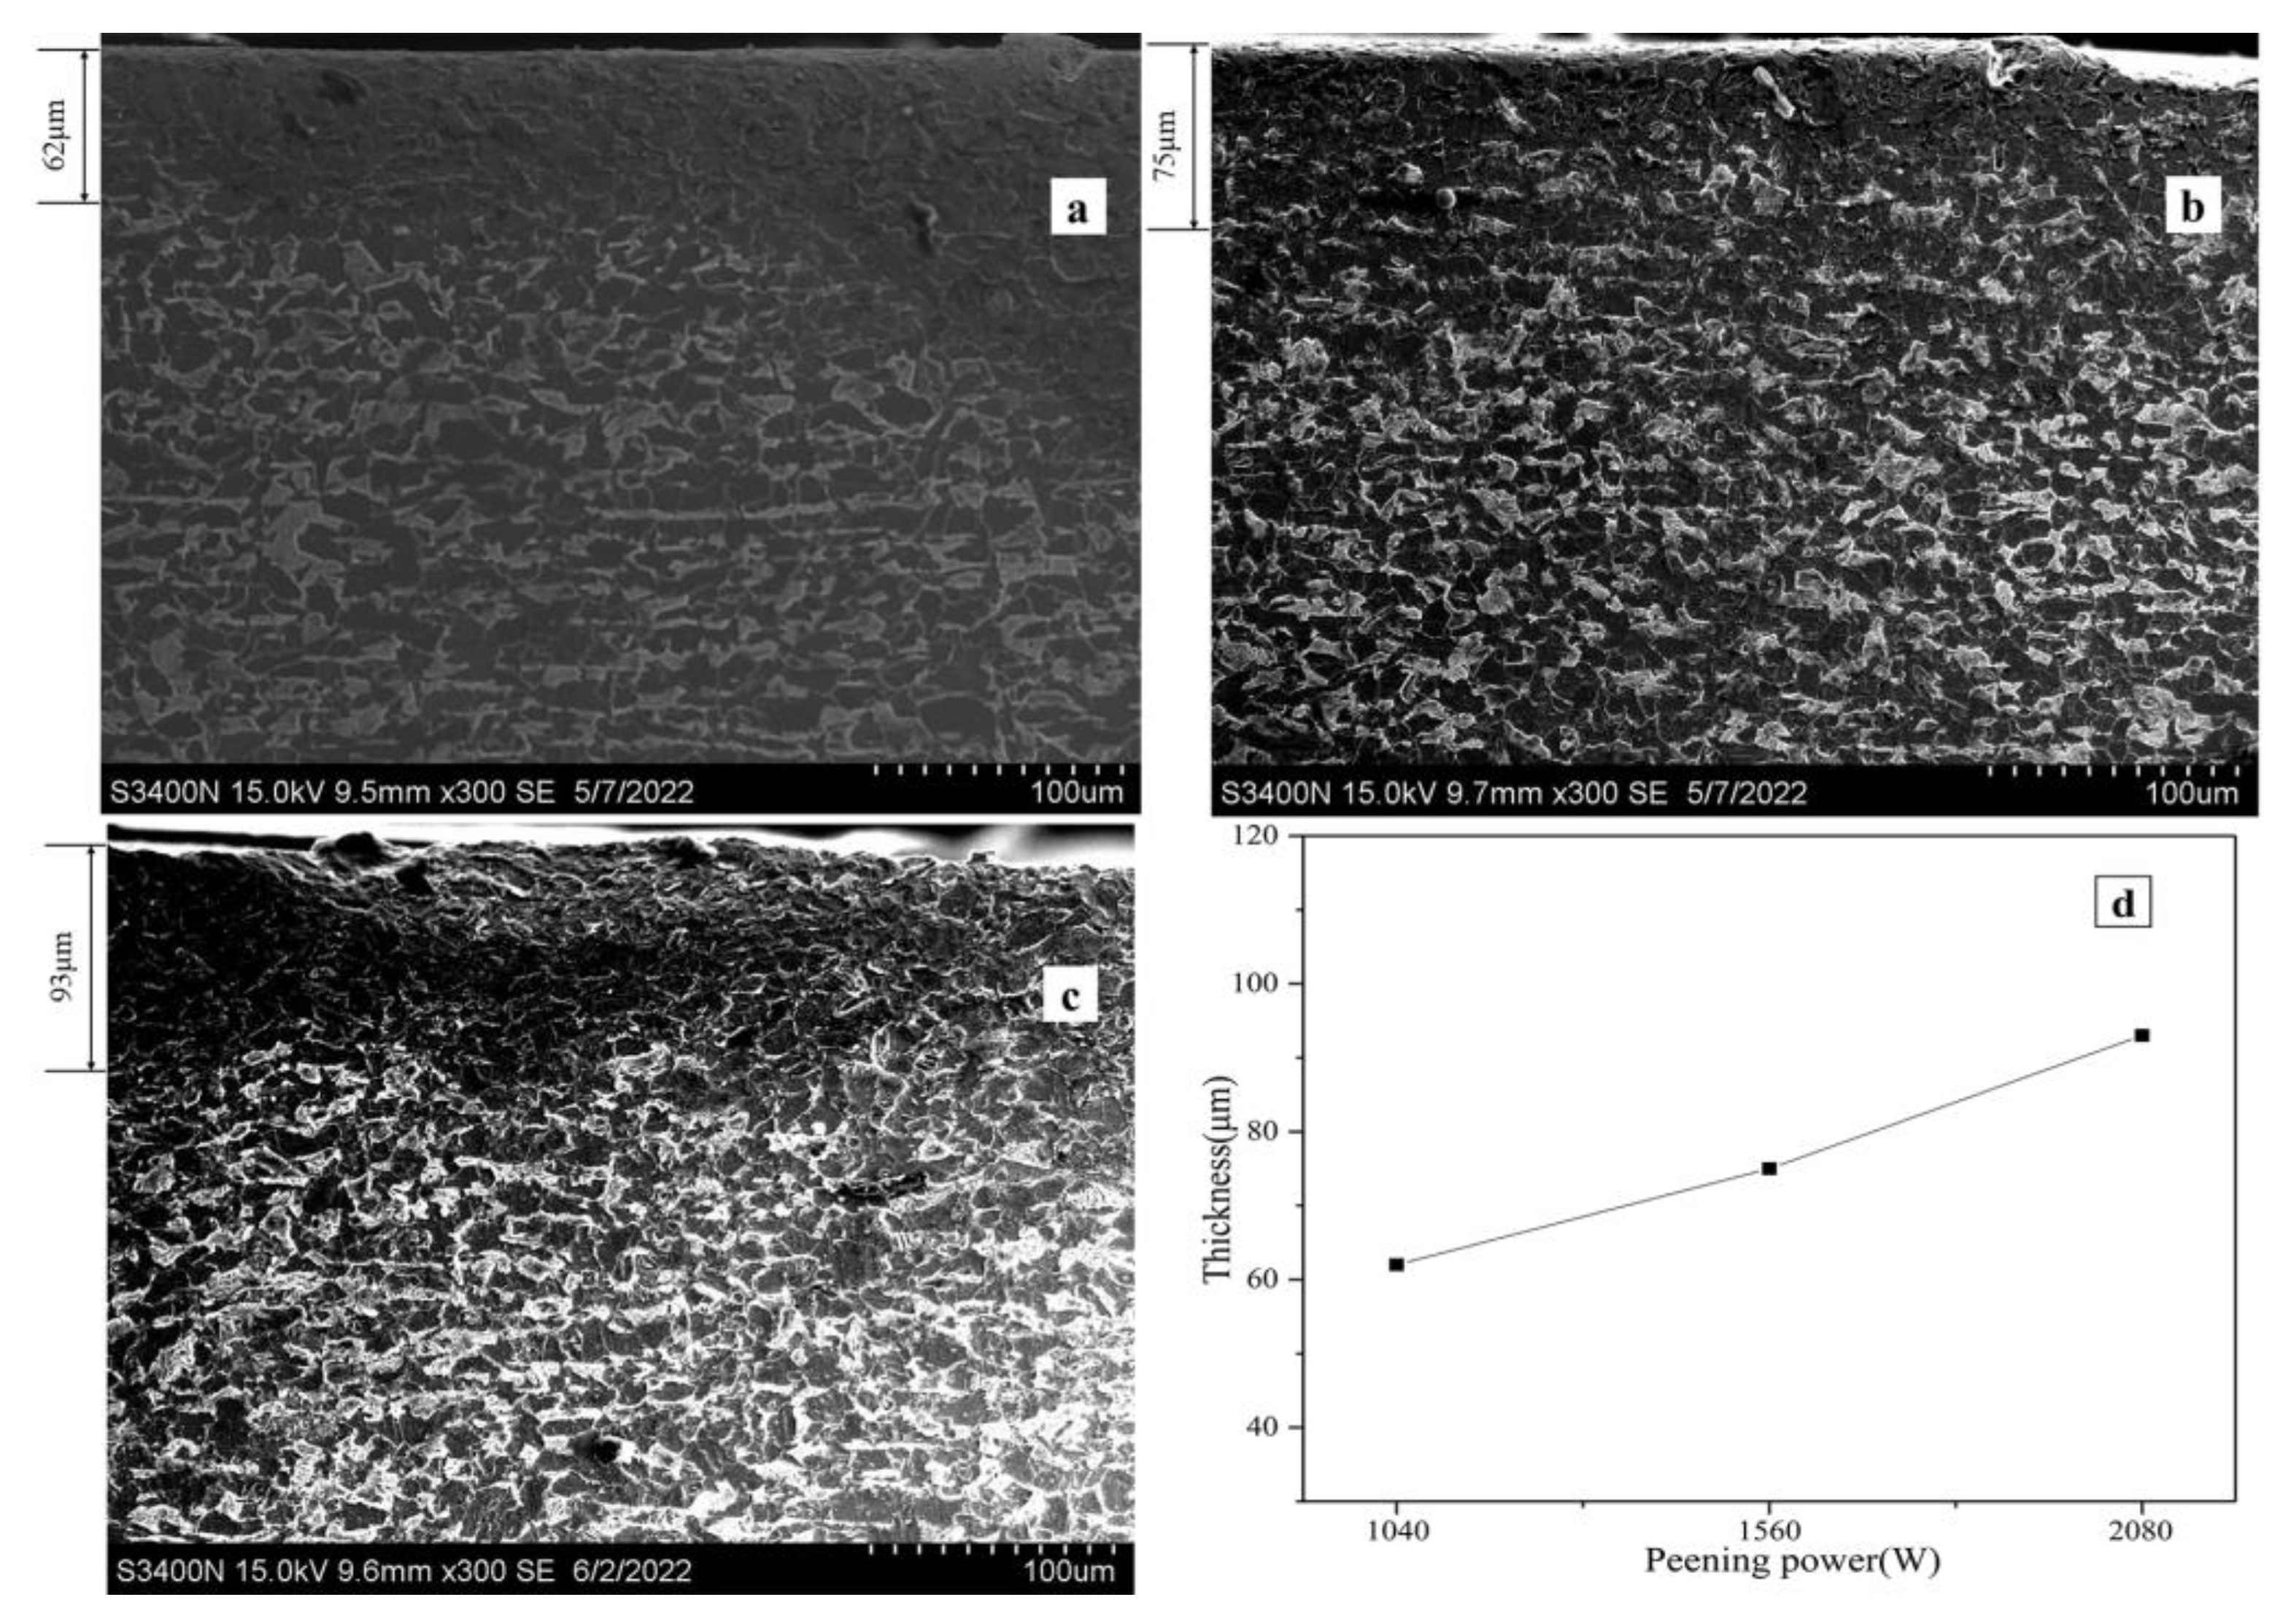
Figure 3 shows the cross-sectional SEM microstructure of the samples after USP treatment with different levels of power. Additionally, the thickness statistics of the deformed layers are shown in Figure 3d. With the increase in USP power, the thickness of the deformed layer increased gradually. Additionally, when the USP power increased from 1040 W to 2080 W, the thickness of the deformed layer proportionally increased from 62 μm to 93 μm. The higher USP power provided a higher-energy steel ball to the samples’ surfaces, resulting in increases in the plastic deformation and the thickness of deformed layers.
Figure 4 shows the cross-sectional SEM microstructure of the samples after USP treatment with different distances, and the thickness statistics of the deformed layer are shown in Figure 4d. The thickness of the deformed layer increased gradually as the distance decreased. As the USP distance decreased from 11 mm to 8 mm, the thickness of the deformed layer drastically increased from 93 μm to 155 μm, which indicated that the USP distance had an evident impact on the deformed layer thickness. The smaller the USP distance was, the more times the steel ball hit the sample, the smaller the shot gravity, and the lower the energy loss, resulting in higher energy acting on the sample.
As the plastic deformation increased, the dislocations increased, and the slip refined the original equiaxed grains. The increase in the hardness of the layer generated a large number of twins, which refined the grains, increased the number of grain boundaries and significantly improved the strength of the samples’ surface layer. The greater the energy of the USP was, the more serious the plastic deformation that occurred and the higher the degree of the grain refined on the samples’ surface.
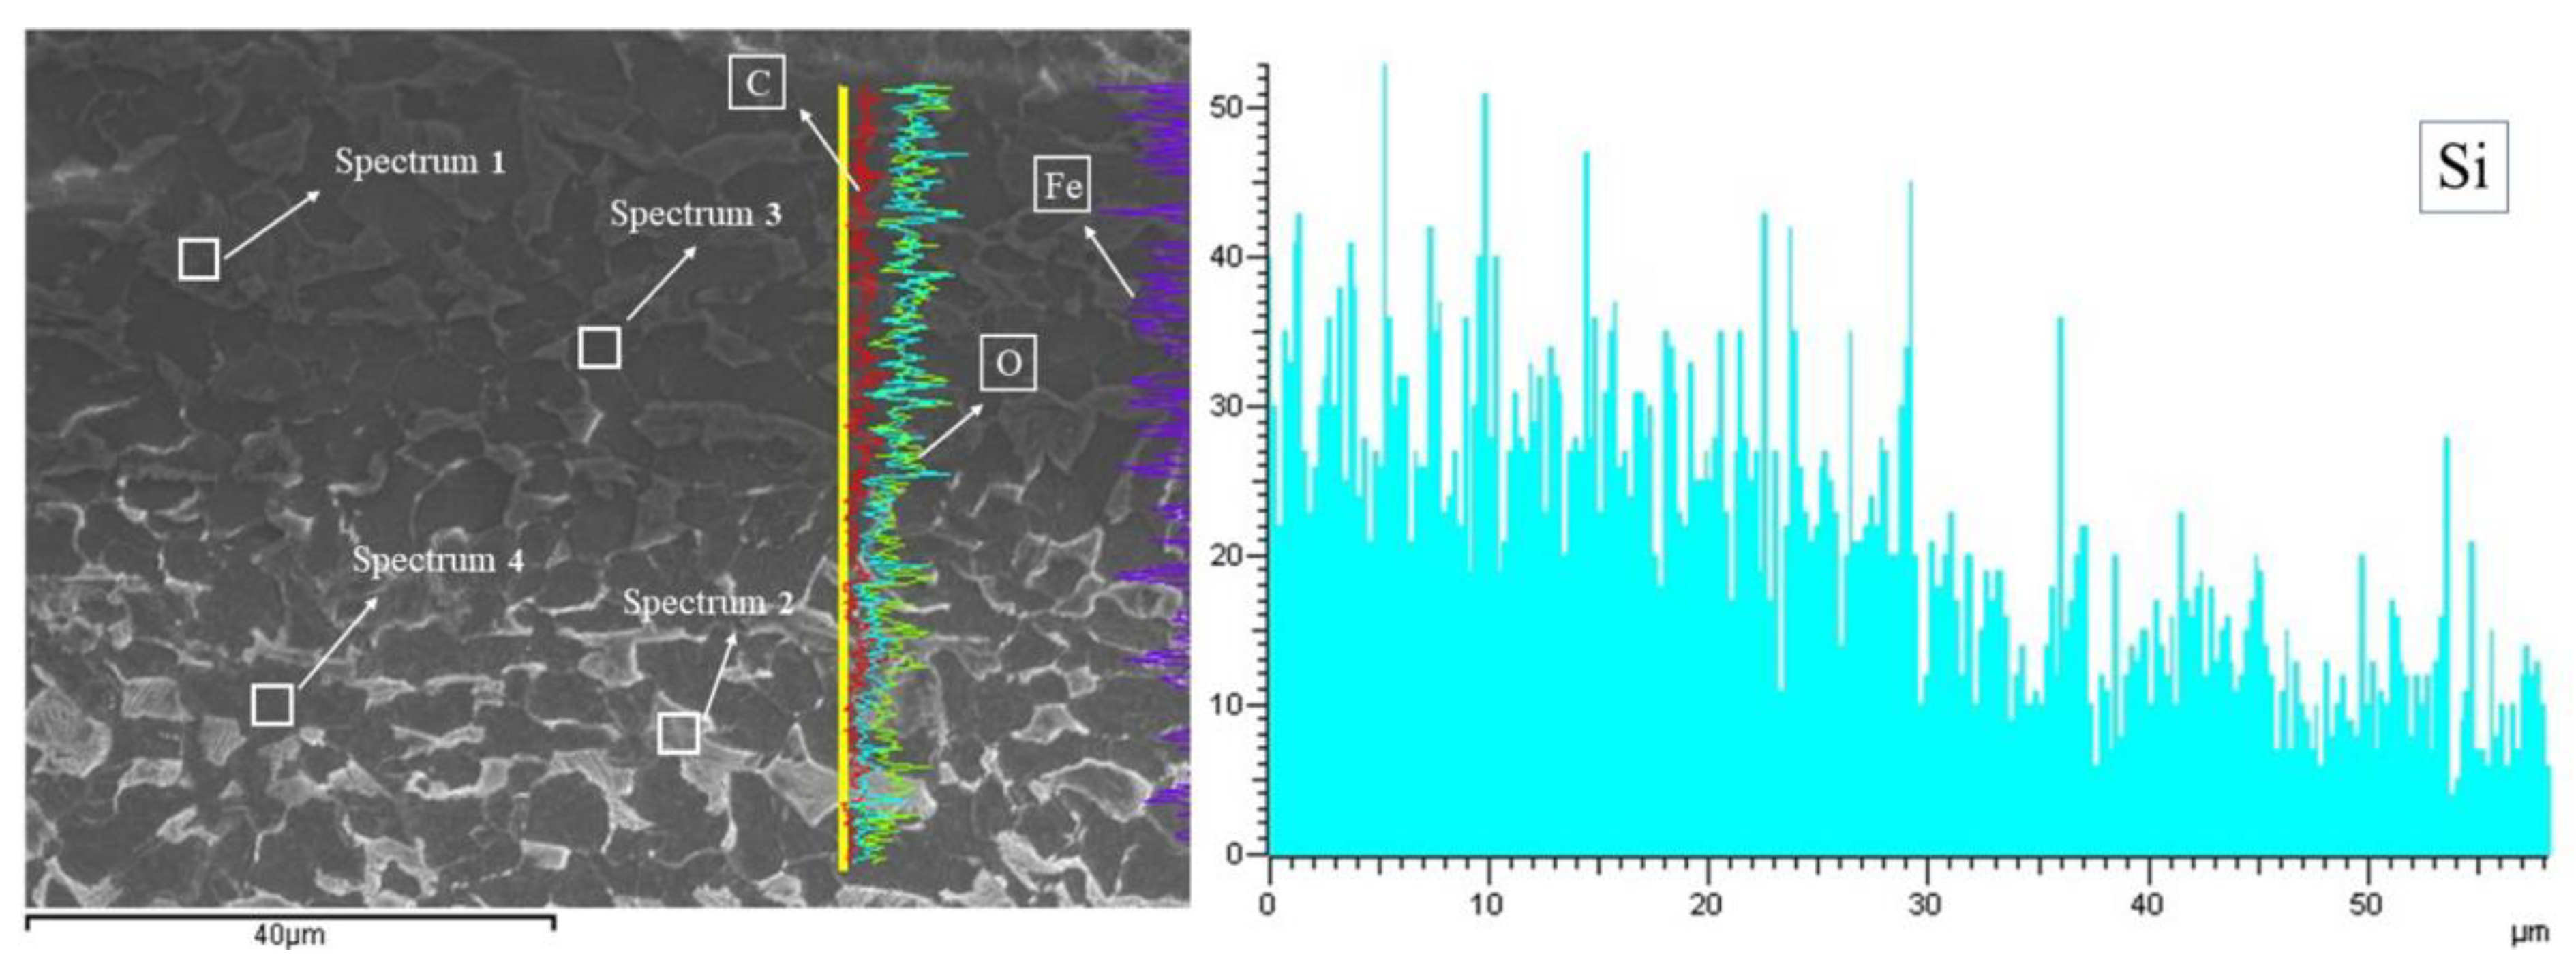
Figure 5 shows the cross-sectional SEM image and EDS analysis of the sample after 3 mm-2080 W-11 mm-400 s (diameter-power-distance-time) USP treatment. An obvious delamination phenomenon and chemical composition difference appeared between the deformed layer and the substrate. The chemical compositions of the pearlite area and the ferrite area on the deformed layer and the substrate are listed in Table 4. The pearlite area and the ferrite area were mainly composed of C, O, Si, Mn and Fe elements. The carbon content of the pearlite area decreased from 9% to 6.97% after the USP treatment. However, the carbon content of the ferrite area increased from 3.22% to 6.96% after the USP treatment. In general, the carbon content in the deformed layer was higher than that in the matrix, which corresponded to the carbon content distribution, as shown in Figure 5. The oxygen content in the surface layer of the sample also increased, which may have been due to the sharp increase in the surface temperature during the USP treatment, and some oxides appeared. No significant change was found in the Mn content, while the Si content in the deformed layer increased. The strength and hardness of pearlite were higher than those of ferrite. During the USP process, the ferrite area more commonly suffered from deformation than the pearlite area, leading to the proportion of the ferrite area decreasing and the proportion of the pearlite area increasing. Additionally, the Si content in the pearlite area was higher than that in the ferrite area. As the result, the deformed layer had a higher Si content than the undeformed area.
Figure 6 shows the XRD patterns of the samples after USP treatment for different lengths of time. With the increase in the USP time and the progress of plastic deformation, the number of dislocations in the crystal increased and more slip occurred, which inevitably caused the mutual delivery of dislocation and greatly improved the strength of the metal materials. The untreated sample was a typical rolled steel which had preferential orientation (110). After the USP treatment, the phase structure did not change, but the diffraction peaks of the USPed samples shifted to higher angles. The change in the peak value after the USP treatment indicated that severe plastic deformation led to grain refinement. This was caused by the residual stress induced on the surface of the samples during the USP process [26]. At the same time, the diffraction peaks of the USPed sample broadened. This is according to the Bragg’s law equation shown in Equation (1), where d is the interplanar spacing of the crystal, θ is the Bragg angle, n is a positive integer and λ is the wavelength of the incident wave.
2 d sin θ = n λ
Residual compressive stress will reduce the interplanar spacing d, resulting in a larger Bragg angle and a right shift of the diffraction peak. Surface segregation also affects the shift in diffraction peaks. As the USP time increased, dislocations and slips were generated, and the dislocation density increased, which caused the diffraction peaks to broaden [27].

3.2. Surface Roughness and Microhardness

Surface roughness refers to the unevenness of small peaks and valleys formed on the machined surface. It is closely related to the wear resistance, fatigue strength and contact stiffness of mechanical parts. Microhardness values can be used as important parameters to evaluate the mechanical properties of mechanical parts. In general, the smaller the grain size, the higher the hardness value. After a sample is treated via USP, a thin layer of grain refinement will be formed on its surface. The degree of plastic deformation hardening can be obtained by studying the change in its hardness value.
Figure 7 shows the surface roughness and microhardness of the samples USPed for different lengths of time. The surface roughness and microhardness of the samples increased significantly with the increase in USP time. Before the USP, the surface of the sample was polished with 80# sandpaper, and the surface roughness of the un-USPed sample was 0.994 μm. After 50 s of USP treatment, some pits were left on the surface, and the roughness increased sharply. As the USP time increased, the pits on the surface were further deepened, and the roughness increased. At the same time, the microhardness of the USPed samples increased. As the USP treatment time increased, the impact of steel balls on the surface of the samples increased, resulting in remarkable working hardening and microhardness increases. When the USP time reached 200 s, the increment in the hardness value became stable. When the USP treatment time continued to increase, the grains of the sample were further refined, and the plastic deformation of the sample surface gradually tended to be saturated, resulting in the hardness value tending to be flat.
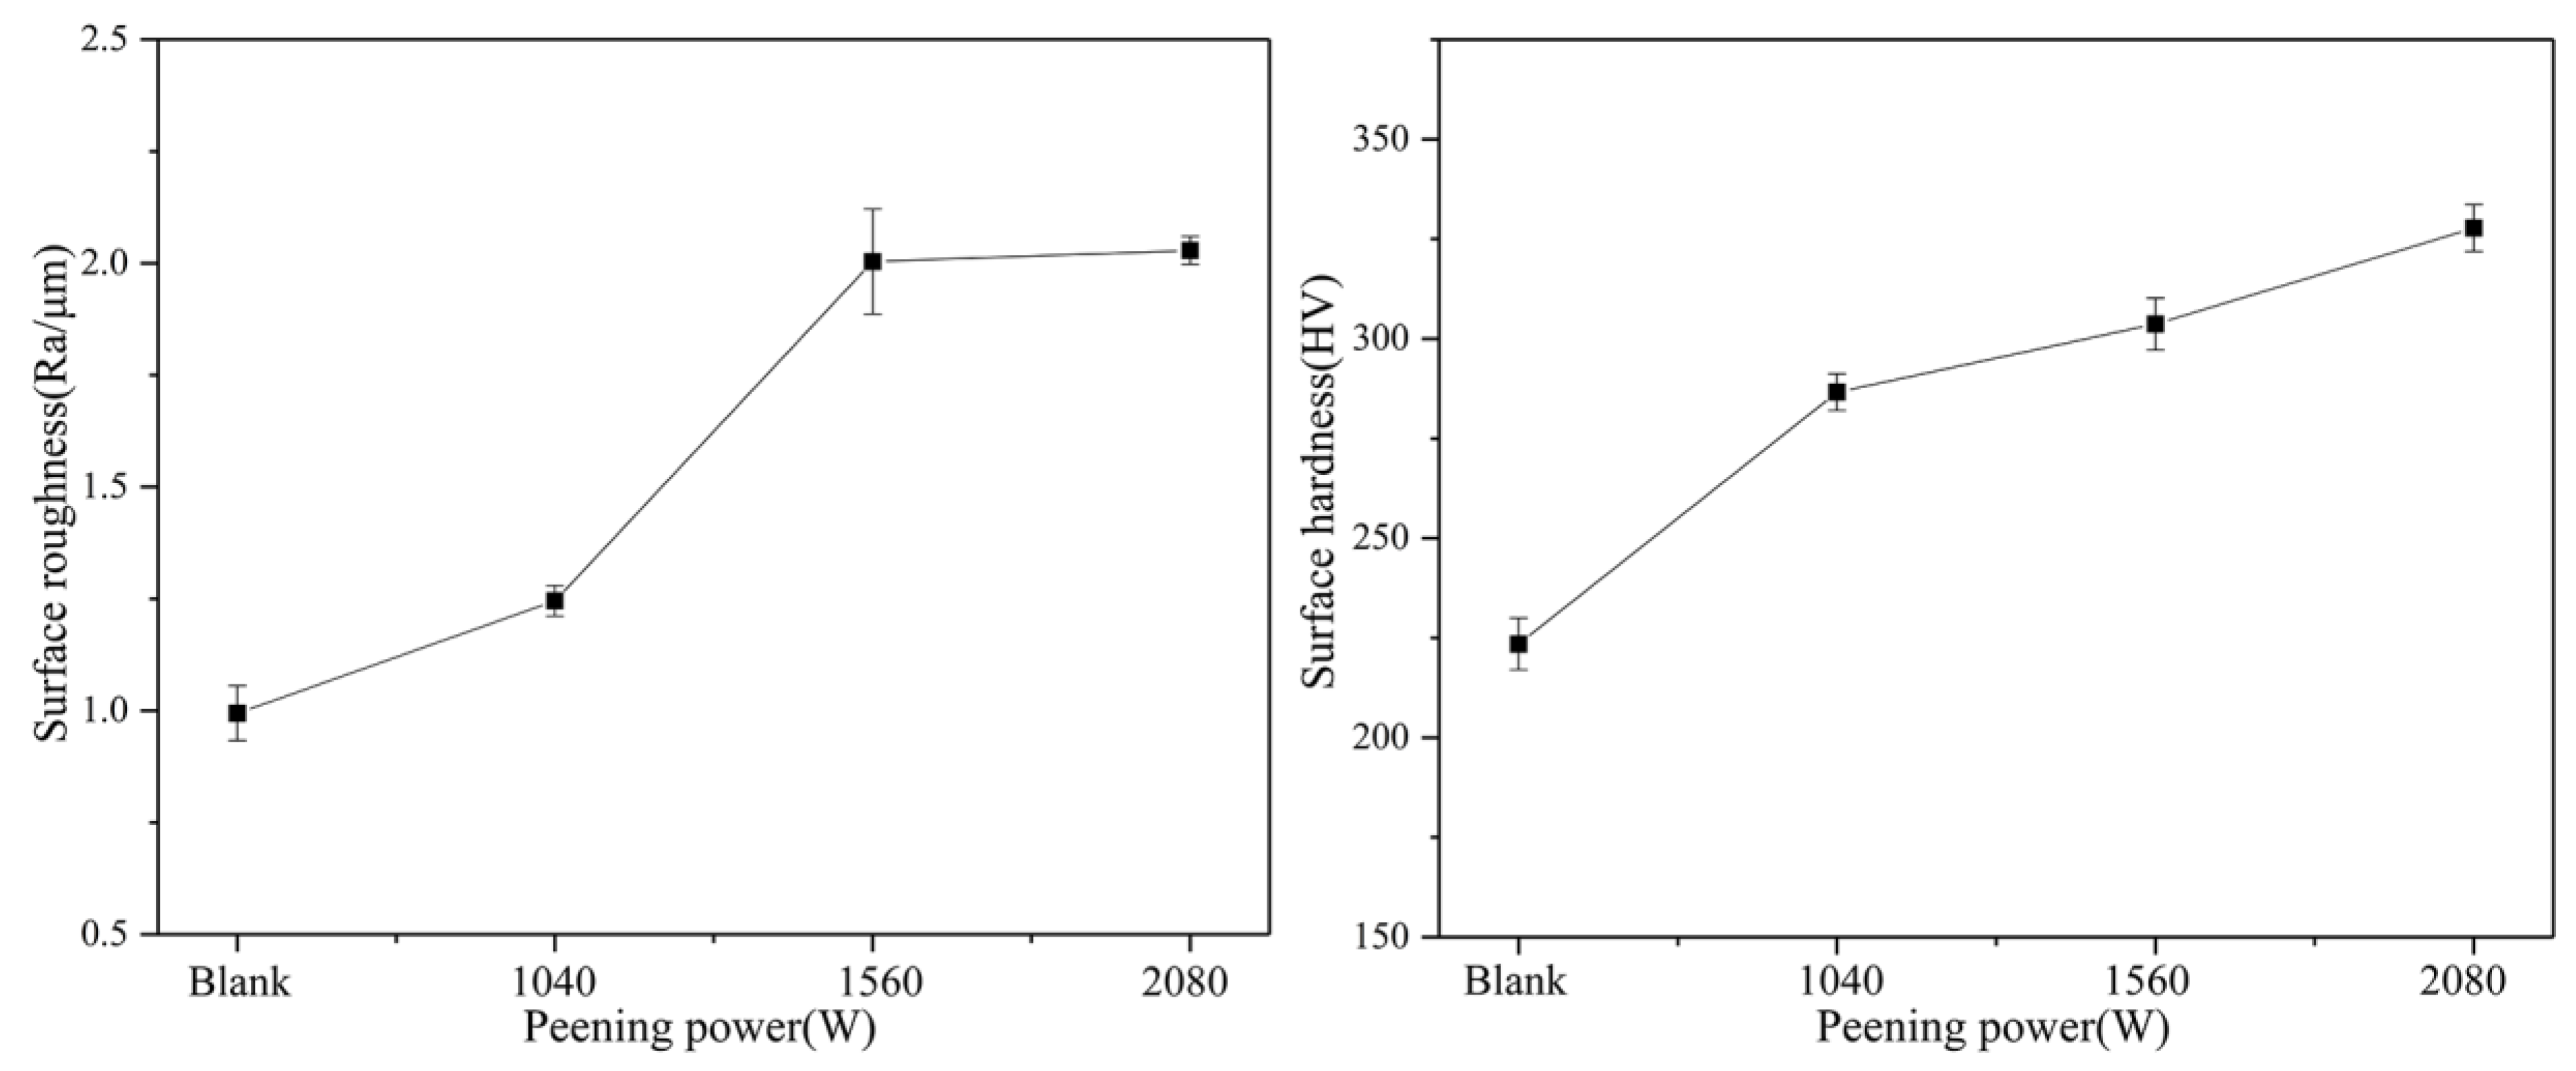
Figure 8 shows the surface roughness and microhardness of the USPed samples with different levels of power. With the increase in USP power, the microhardness of the samples increased steadily; however, the surface roughness increased first and then fell with slow growth. The peening power was increased from 1040 W to 1560 W, and the roughness was increased by 61% from 1.245 μm to 2.004 μm. There was no obvious difference between the surface roughness values of the samples after USP treatment under 1560 W and 2080 W power. The hardness of the samples continued to increase with the increase in the shot peening power. Higher USP power provided higher energy for the steel ball, meaning the shot had a higher impact speed and energy. Higher energy caused more severe plastic deformation on the surface of the samples, resulting in larger and deeper deformation zones on the surface. This enlarged the roughness and hardness of the samples’ surfaces.
Figure 9 shows the surface roughness and microhardness of the USPed samples with different distances. Comparing the two graphs, it can be seen that the increasing trends of roughness and hardness were similar. With the decrease in the USP distance, the surface roughness and hardness of the samples increased. Small USP distances made the impact frequency and energy of the steel balls delivered to the samples increase, resulting in the plastic deformation becoming serious and the surface roughness and hardness rising.
After the USP treatment, the surface hardness of the samples increased. This is because, after severe plastic deformation, the grain size of the sample surface was refined, that is, the grain size was reduced, the grain boundary was increased, the path of the dislocation movement was smaller, the resistance was greater and the slip was more difficult to transfer from one grain to another grain [28,29,30,31]. In short, the material was harder to deform, that is, the hardness value became greater.

3.3. Corrosion Behavior

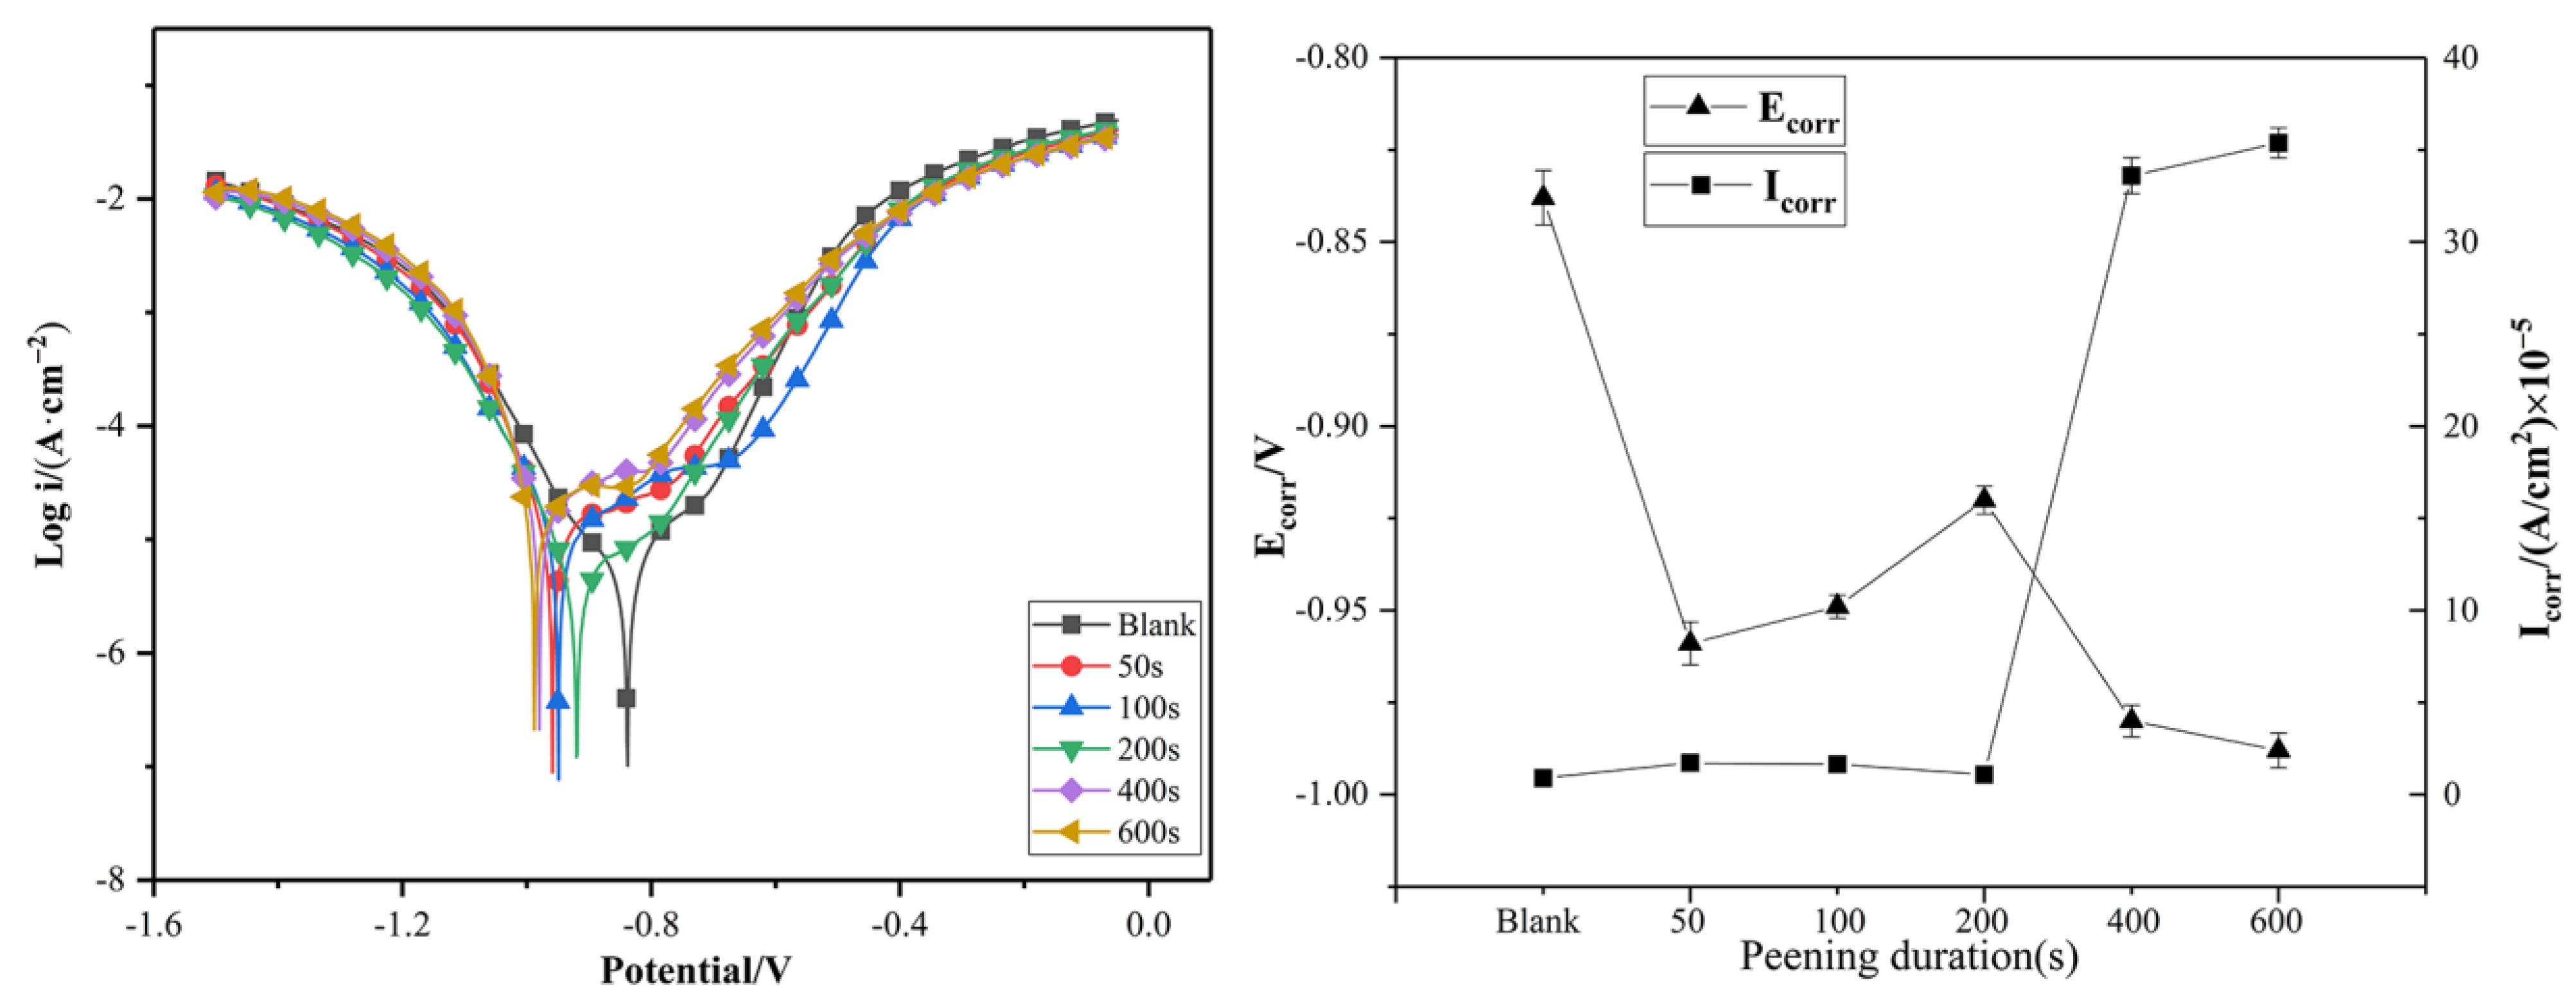
Electrochemical tests and surface immersion studies need to be linked [32]. Electrochemistry is a form of theoretical data processing, and surface morphology characterization represents the actual corrosion situation; the two are closely linked. Figure 10 shows the electrochemical test polarization curves and a line plot of the corrosion potential and the corrosion current of samples with different lengths of USP times. The values of the fitting parameters derived from the polarization curves of the steel are summarized in Table 5. During the first 100 s, the corrosion current density of the samples increased, and the corrosion potential of the sample shifted in the negative direction. When the USP time increased to 200 s, the corrosion current density decreased, and the corrosion potential of the samples shifted in the positive direction. This was possibly because the USP time was relatively short, the hardening layer of the sample was shallow and the hardness had not improved enough. When the USP time increased to 200 s, the hardened layer reached the appropriate thickness, and the grain was finer. However, after 400 s of USP treatment, an interesting phenomenon appeared. The corrosion current density of the samples increased again, while the corrosion potential of the samples decreased. This may have been due the USP treatment being too long, which caused more cracks, and stress appeared on the surface of the specimens.
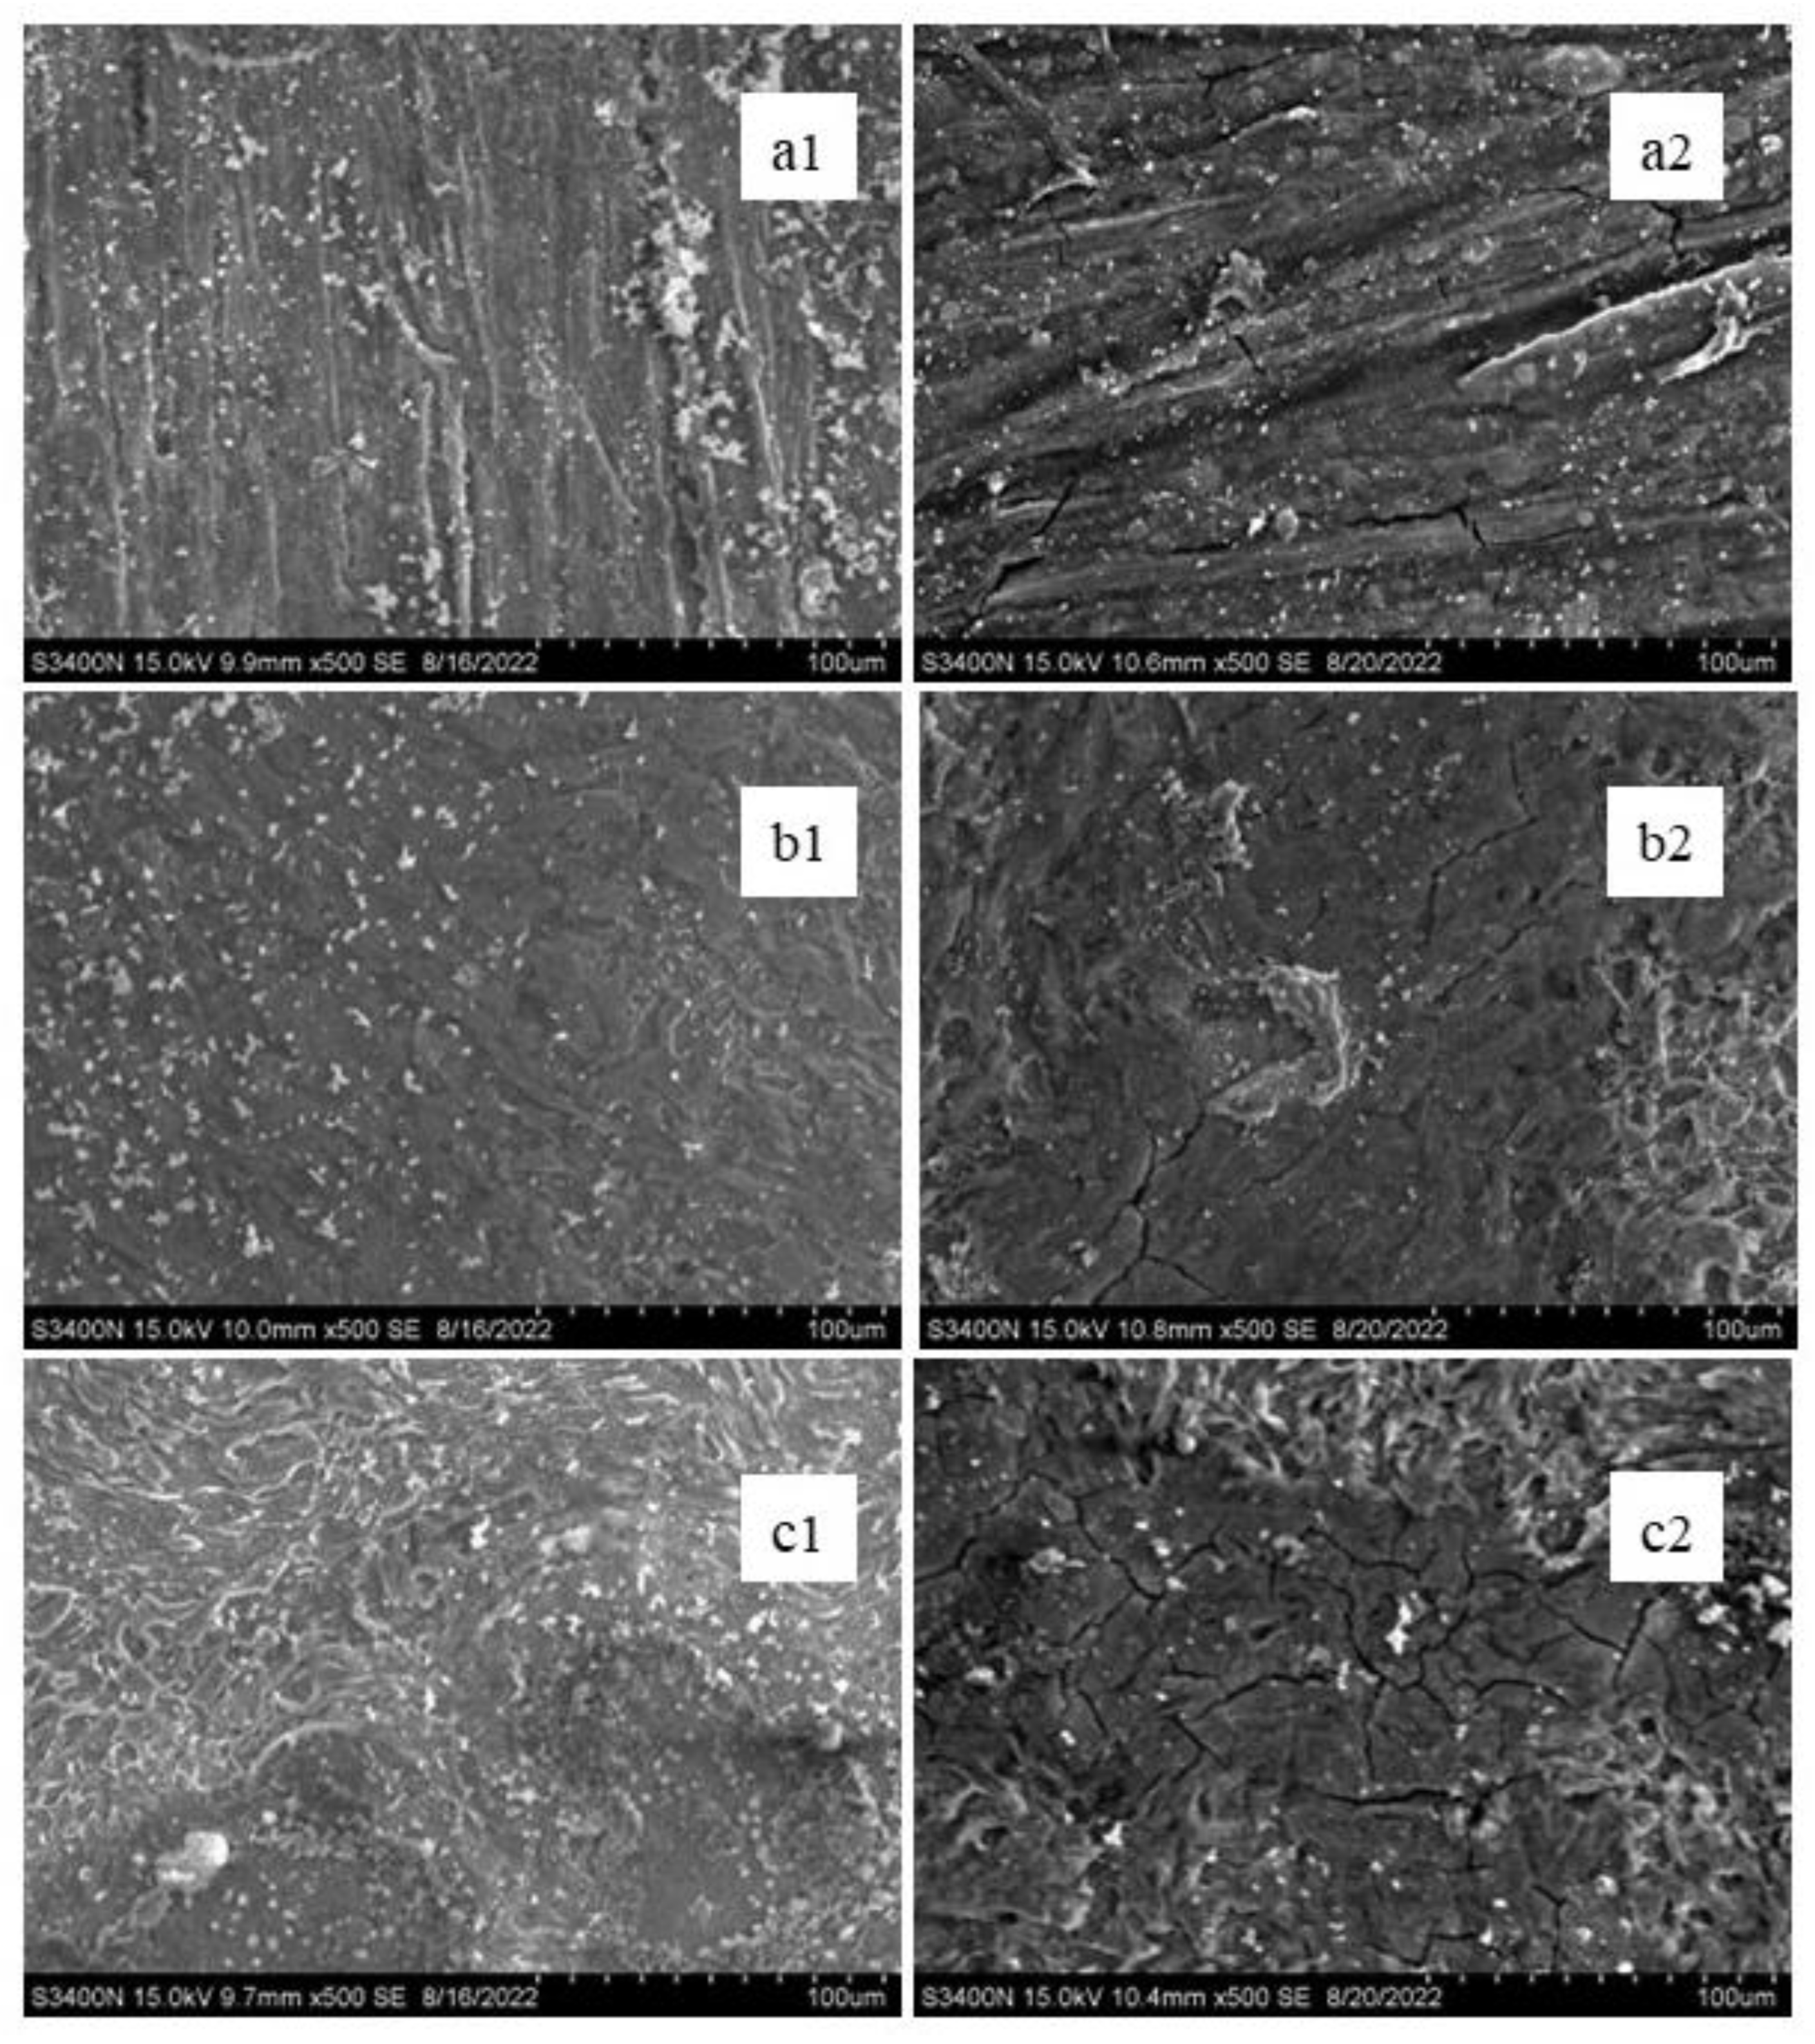
Figure 11 shows the SEM micro-morphology characteristics of Q345B steel in 3.5 wt.% NaCl solution for 3 days and 7 days with different lengths of USP time. The surface morphologies of the samples with or without USP treatment were quite different. As the un-USPed samples were derusted with 80# sandpaper, there were still abrasive traces on the corroded surface. More serious corrosion appeared on the rougher surfaces. Although the surface roughness of the USPed samples was higher, their corroded surfaces were more uniform. Minor exfoliation corrosion occurred on the USPed surfaces after the 3 d immersion test. However, when the USP treatment time increased to 600 s, serious corrsion occurred on the surface, and corrugated corrosion appeared. After the 7 d immersion test, cracks appeared, and corrosion became much more serious, while more exfoliation corrosion occurred on the USPed surface. More cracks appeared and more serious corrosion occurred on the surface of the samples with high USP time.
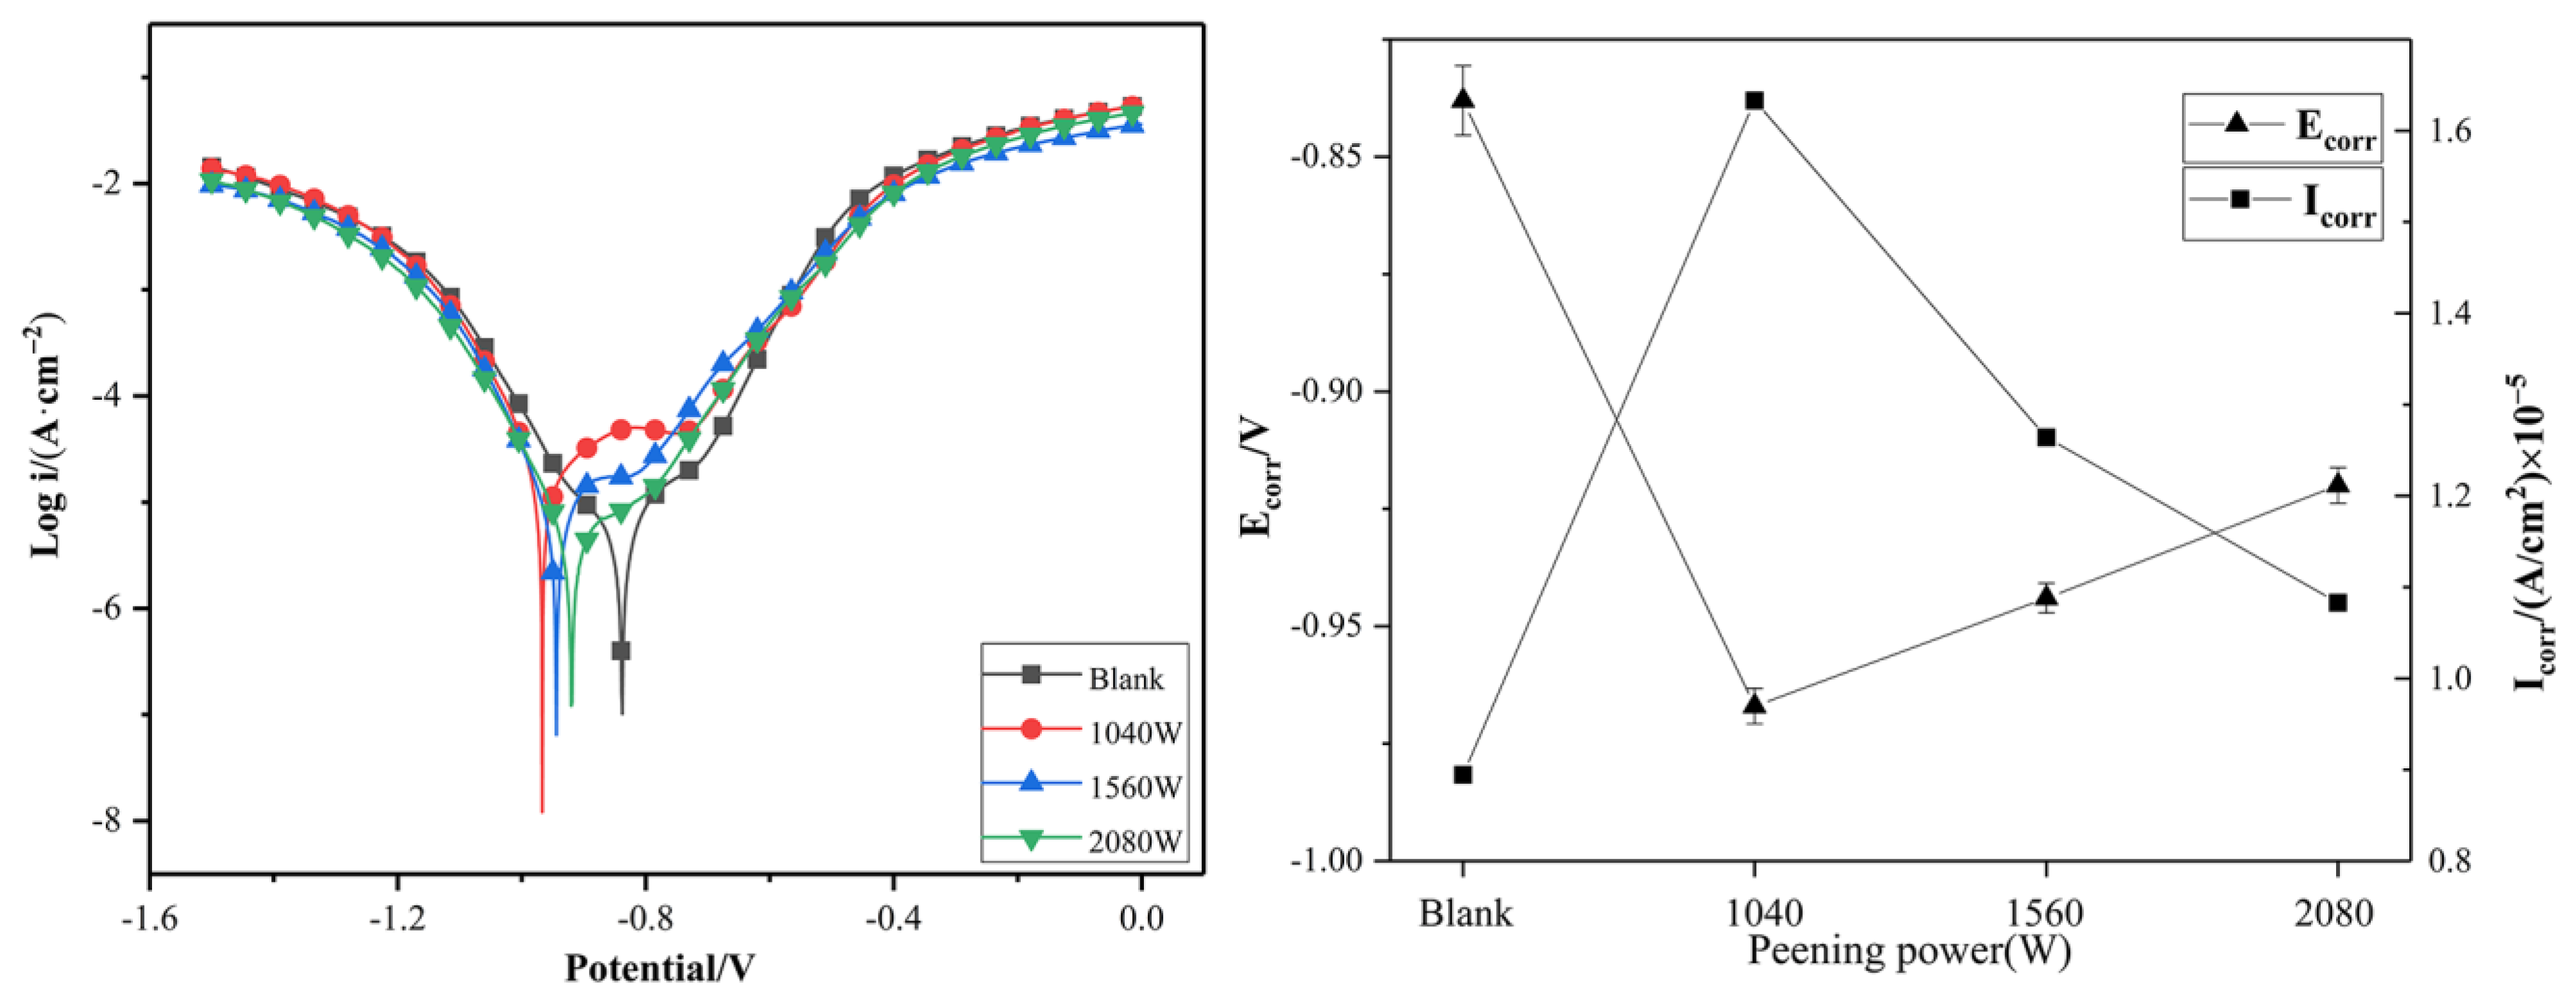
Figure 12 shows the electrochemical test polarization curves and a line plot of the corrosion potential and corrosion current of samples with different levels of USP power. The values of fitting parameters derived from the polarization curves of the steel are summarized in Table 6. With the increase in the USP power, the electrochemical corrosion current density values of the samples decreased, while the corrosion potential values of the samples increased correspondingly. This meant that the corrosion resistance of the Q345B steel increased as the USP power increased.
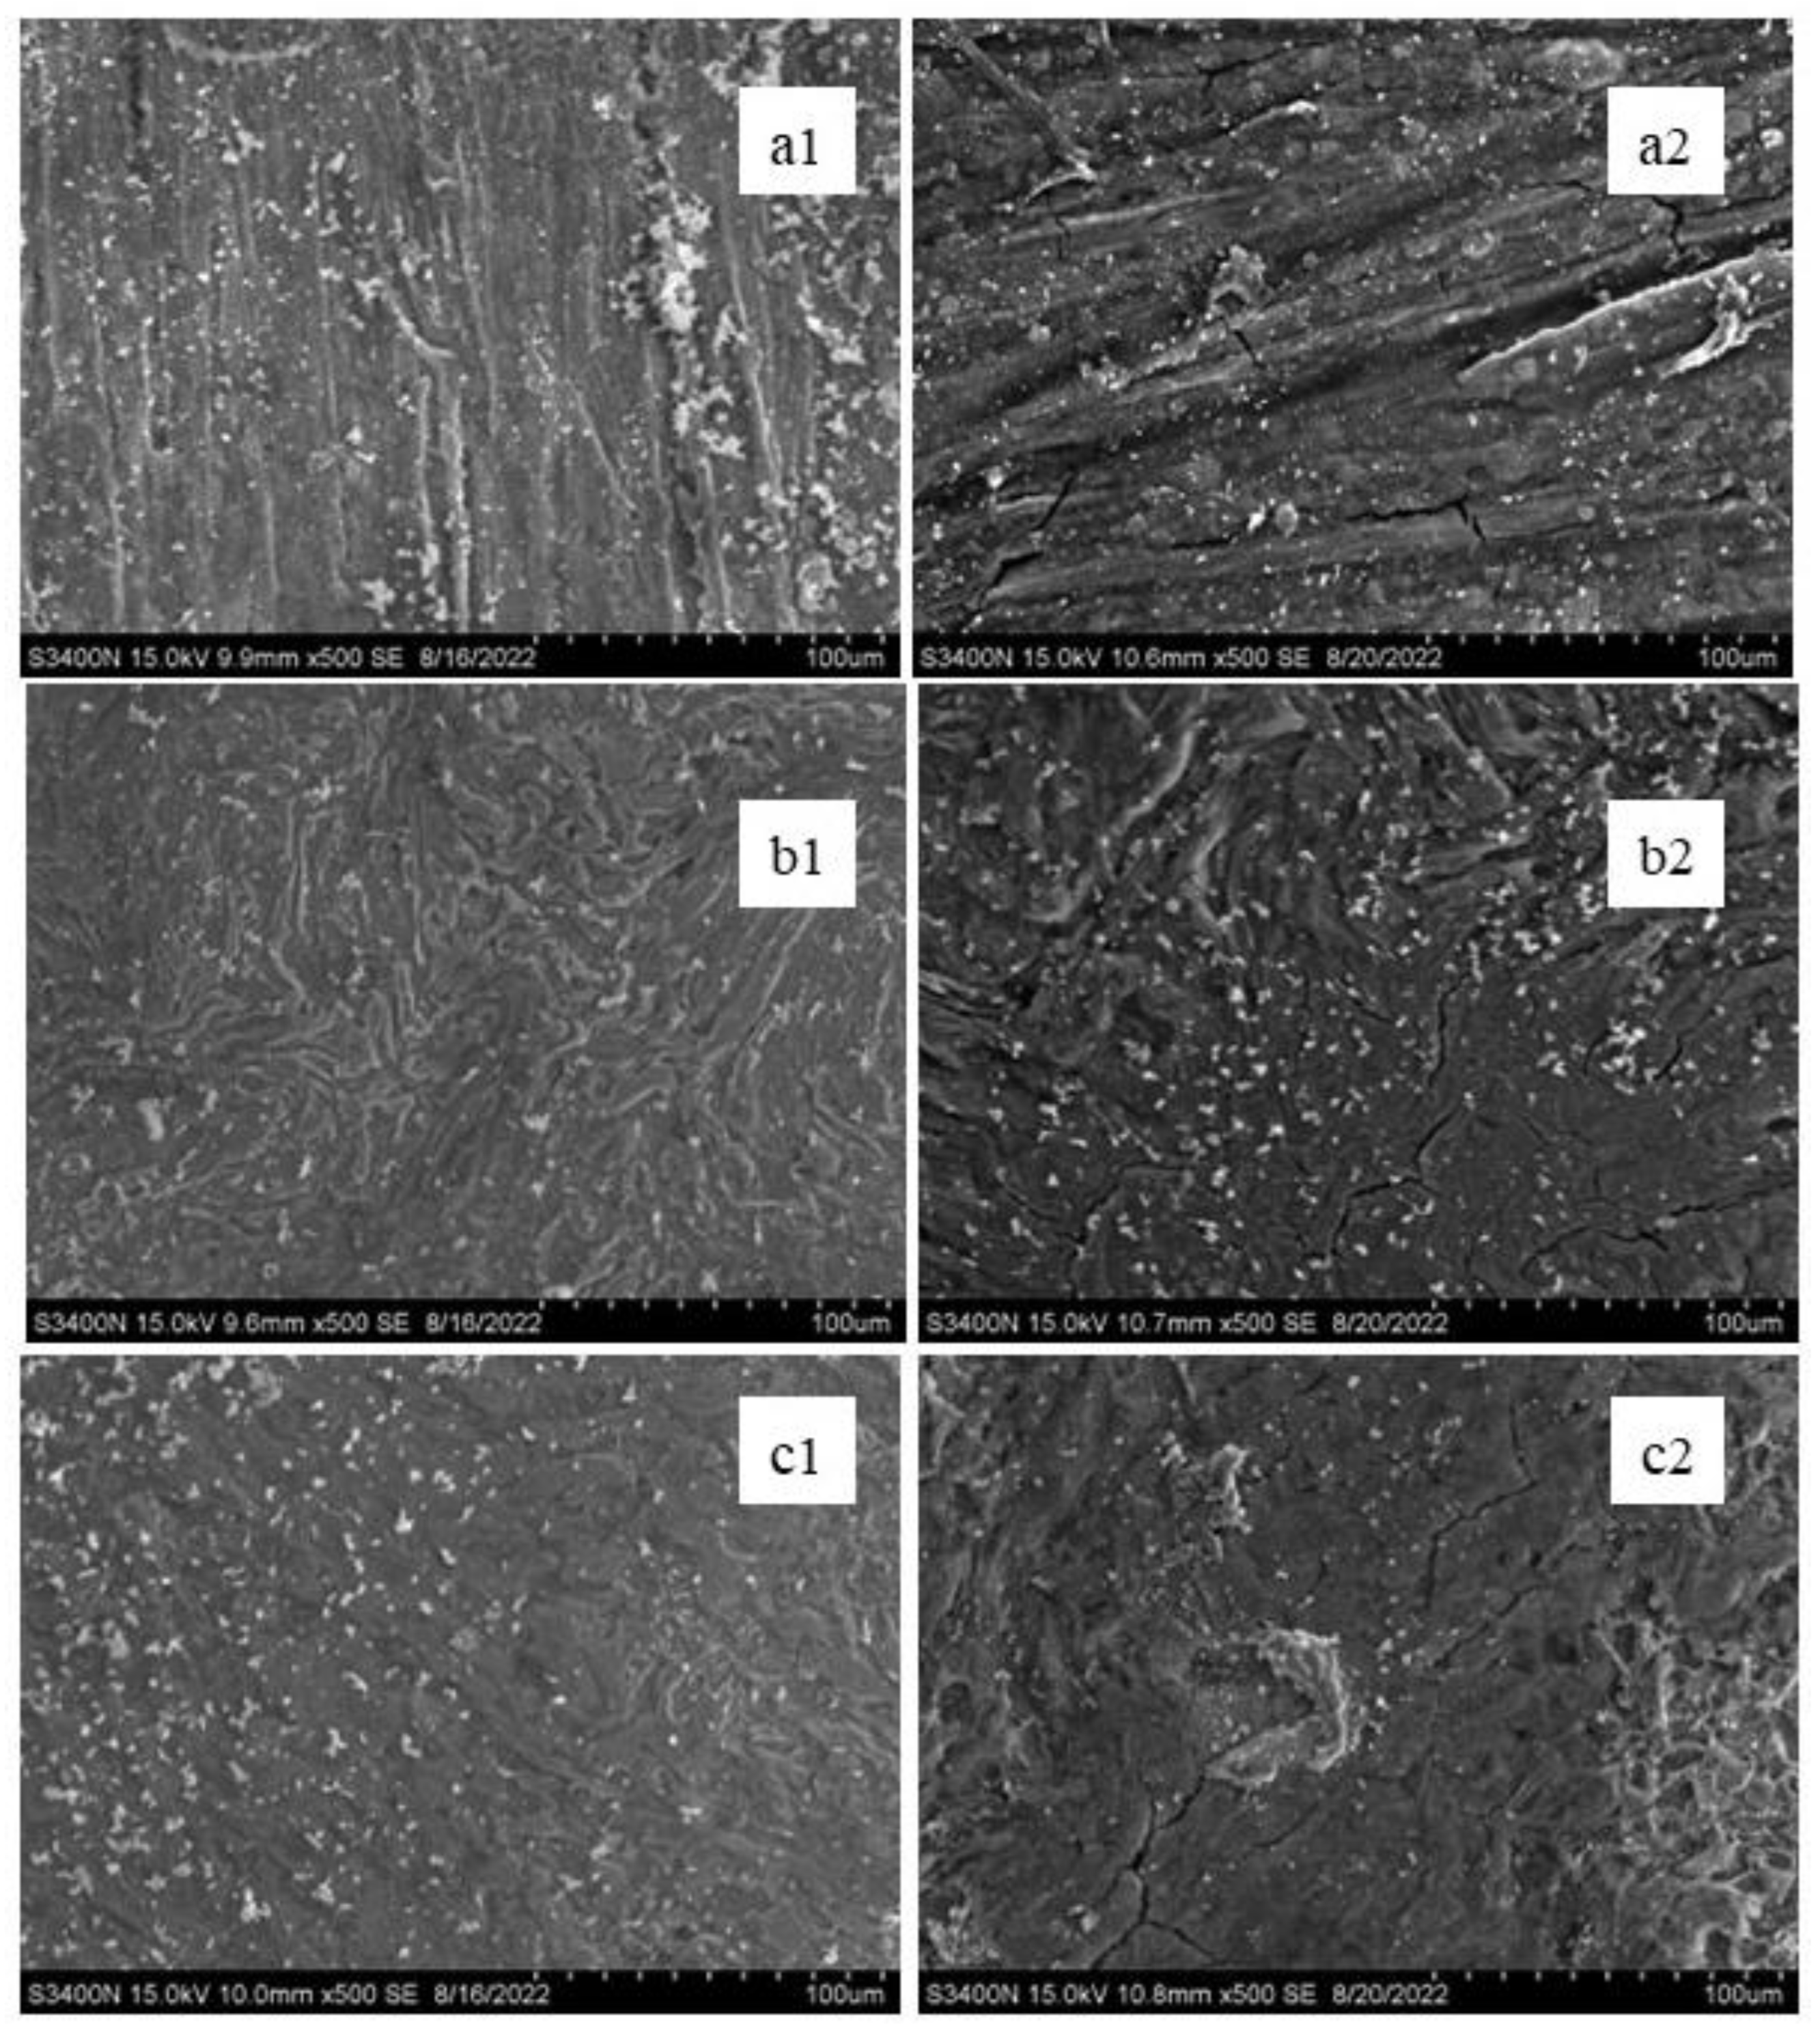
Figure 13 shows the SEM micro-morphology characteristics of Q345B steel in 3.5 wt.% NaCl solution for 3 days and 7 days with different levels of USP power. When the USP power increased from 1040 W to 2080 W, the corrosion on the surface of the samples became lighter. Higher USP power provided higher peening intensity and induced a thicker hardening layer and finer grains, resulting in the improvement of the corrosion performance.
Figure 14 shows the electrochemical test polarization curves and a line plot of the corrosion potential and corrosion current of samples with different USP distances. The values of the fitting parameters derived from the polarization curves of the steel are summarized in Table 7. As the USP distance decreased, the electrochemical corrosion current density of the samples decreased first and then increased. Meanwhile, the corrosion potential of the samples increased first and then decreased correspondingly. A longer USP distance resulted in lower peening energy acting on the surface of the samples, and better surface quality was obtained. When the USP distance was reduced to 8 mm, the excessive energy led to cracks on the surface.
Figure 15 shows the SEM micro-morphology characteristics of Q345B steel in 3.5 wt.% NaCl solution for 3 days and 7 days with different distances. When the USP distance decreased from 11 mm to 8 mm, the corrosion on the surface became more serious. The reduction in the USP distance provided higher peening intensity, and more stress and cracks appeared on the surface of the samples, resulting in the corrosion becoming more serious. Many cracks appeared on the surface of the samples after the 7 d immersion test.
Generally speaking, the corrosion resistance of the samples became worse after USP treatment, which may have been because the surface roughness of the samples increased after collision, resulting in pits and impurities on the surface of the samples. The SEM images observed in the immersion experiment were consistent with the results of the electrochemical corrosion experiment. A longer USP time and a shorter USP distance caused spalling and cracks on the substrate surface, resulting in the corrosion becoming more serious. As a result, appropriate USP parameters should be used to obtain surfaces with better corrosion resistance.
4. Conclusions

In this work, a Q345B steel plate was treated by USP with different parameters, and the following conclusions were obtained:
(1)
With the increase in the USP time and USP power and with the decrease in the USP distance, the surface roughness, the thickness of the deformed layer and the microhardness of the samples increased first and then tended to stabilize.
(2)
After the USP treatment, the cross-section of the sample was stratified, and element segregation occurred. The oxygen content and silicon content near the surface increased compared with that in the matrix.
(3)
A longer USP time and a shorter USP distance caused spalling and cracks on the substrate surface, resulting in the corrosion becoming more serious. However, with the increase in the USP power, the corrosion resistance of the sample was better. As a result, appropriate USP parameters should be used to obtain surfaces with better corrosion resistance.
(4)
An optimal technological parameter for improving both the strength and the corrosion resistance of the material was not obtained. When the process parameters were 200 s-2080 W-11 mm, the corrosion resistance was close to that of the untreated sample, but the strength was much improved.

Author Contributions

Methodology, J.T. and X.Z.; software, J.T.; formal analysis, H.W. and Y.Z.; investigation, J.T. and L.H.; data curation, J.T.; writing—original draft preparation, J.T.; writing—review and editing, J.T. and X.Z.; supervision, Z.W.; project administration, L.W. All authors have read and agreed to the published version of the manuscript.

Funding

This research was funded by the Open Fund of Jiangsu Technical Center for Wind Energy Engineering (ZK22-03-08).

Data Availability Statement

The data of this research are available from the first author upon request.

Conflicts of Interest

The authors declare no conflict of interest.

References

  1. Tao, N.R.; Sui, M.L.; Lu, J.; Lu, K. Surface nanocrystallization of iron induced by ultrasonic shot peening. Nanostruct. Mater. 1999, 11, 433–440. [Google Scholar] [CrossRef]
  2. Mordyuk, B.N.; Prokopenko, G.I.; Milman, Y.V.; Iefimov, M.O.; Sameljuk, A.V. Enhanced fatigue durability of Al–6Mg alloy by applying ultrasonic impact peening: Effects of surface hardening and reinforcement with AlCuFe quasicrystalline particles. Mater. Sci. Eng. A 2013, 563, 138–146. [Google Scholar] [CrossRef]
  3. Tao, N.R.; Wang, Z.B.; Tong, W.P.; Sui, M.L.; Lu, J.; Lu, K. An investigation of surface nanocrystallization mechanism in Fe induced by surface mechanical attrition treatment. Acta Mater. 2002, 50, 4603–4616. [Google Scholar] [CrossRef]
  4. Zhang, Q.; Xu, S.; Zhang, Z.Q.; Zhang, X.J.; Wang, J.B. Residual stress and microhardness evolution induced by conventional and ultrasonic shot peening. Mater. Sci. Technol. MST Publ. Inst. Met. 2022, 38, 436–443. [Google Scholar] [CrossRef]
  5. Chui, P.; Sun, K.; Sun, C.; Yang, X.; Shan, T. Effect of surface nanocrystallization induced by fast multiple rotation rolling on hardness and corrosion behavior of 316L stainless steel. Appl. Surf. Sci. 2011, 257, 6787–6791. [Google Scholar] [CrossRef]
  6. Sun, Q.Q.; Liu, X.T.; Han, Q.Y.; Li, J.; Xu, R.; Zhao, K.J. A comparison of AA2024 and AA7150 subjected to ultrasonic shot peening: Microstructure, surface segregation and corrosion. Surf. Coat. Technol. 2018, 337, 552–560. [Google Scholar] [CrossRef]
  7. Dong, Z.; Wang, F.; Qian, D.; Wang, H.; Wang, X.; Hu, S.; Chi, J. Enhanced Wear Resistance of the Ultrastrong Ultrasonic Shot-Peened M50 Bearing Steel with Gradient Nanograins. Metals 2022, 12, 424. [Google Scholar] [CrossRef]
  8. Yue, X.; Hu, S.; Wang, X.; Liu, Y.; Yin, F.; Hua, L. Understanding the nanostructure evolution and the mechanical strengthening of the M50 bearing steel during ultrasonic shot peening. Mater. Sci. Eng. A 2022, 836, 142721. [Google Scholar] [CrossRef]
  9. Kumar, P.; Mahobia, G.S.; Mandal, S.; Singh, V.; Chattopadhyayet, K. Enhanced corrosion resistance of the surface modified Ti-13Nb-13Zr alloy by ultrasonic shot peening. Corros. Sci. 2021, 189, 109597. [Google Scholar] [CrossRef]
  10. Mordyuk, B.N.; Prokopenko, G.I.; Vasylyev, M.A.; Iefimov, M.O. Effect of structure evolution induced by ultrasonic peening on the corrosion behavior of AISI-321 stainless steel. Mater. Sci. Eng. A 2007, 458, 253–261. [Google Scholar] [CrossRef]
  11. Jelliti, S.; Richard, C.; Retraint, D.; Roland, T.; Chemkhi, M.; Demangel, C. Effect of surface nanocrystallization on the corrosion behavior of Ti–6Al–4V titanium alloy. Surf. Coat. Technol. 2013, 224, 82–87. [Google Scholar] [CrossRef]
  12. Kumar, S.; Chattopadhyay, K.; Singh, V. Effect of surface nanostructuring on corrosion behavior of Ti–6Al–4V alloy. Mater. Charact. 2016, 121, 23–30. [Google Scholar] [CrossRef]
  13. Laleh, M.; Kargar, F. Effect of surface nanocrystallization on the microstructural and corrosion characteristics of AZ91D magnesium alloy. J. Alloys Compd. 2011, 509, 9150–9156. [Google Scholar] [CrossRef]
  14. Li, Y.; Wang, F.; Liu, G. Grain size effect on the electrochemical corrosion behavior of surface nanocrystallized low-carbon steel. Corrosion 2004, 60, 891–896. [Google Scholar] [CrossRef]
  15. Ye, Z.Y.; Liu, D.X.; Li, C.Y.; Zhang, X.M.; Yang, Z.; Lei, M.X. Effect of shot peening and plasma electrolytic oxidation on the intergranular corrosion behavior of 7A85 aluminum alloy. Acta Metall. Sin. 2014, 27, 705–713. [Google Scholar] [CrossRef]
  16. Pandey, V.; Singh, J.K.; Chattopadhyay, K.; Santhi Srinivas, N.C.; Singh, V. Influence of ultrasonic shot peening on corrosion behavior of 7075 aluminum alloy. J. Alloys Compd. 2017, 725, 826–840. [Google Scholar] [CrossRef]
  17. Ramos, R.; Ferreira, N.; Ferreira, J.A.M.; Capela, C.; Batista, A.C. Improvement in fatigue life of Al 7475-T7351 alloy specimens by applying ultrasonic and microshot peening. Int. J. Fatigue 2016, 92, 87–95. [Google Scholar] [CrossRef]
  18. Zhu, L.H.; Guan, Y.J.; Wang, Y.J.; Xie, Z.D.; Lin, J.; Zhai, J.Q. Influence of process parameters of ultrasonic shot peening on surface roughness and hydrophilicity of pure titanium. Surf. Coat. Technol. 2017, 317, 38–53. [Google Scholar] [CrossRef]
  19. Öner, E.; Yaylaci, M.; Birinci, A. Solution of a receding contact problem using an analytical method and a finite element method. J. Mech. Mater. Struct. 2014, 9, 333–345. [Google Scholar] [CrossRef]
  20. Yaylaci, M. Simulate of edge and an internal crack problem and estimation of stress intensity factor through finite element method. Adv. Nano Res. 2022, 12, 405–414. [Google Scholar]
  21. Puskar, A. Surface Strengthening of Steel with Different Grain Size by High-Frequency Loading. Kov. Mater. 1976, 14, 385–398. [Google Scholar]
  22. Hashimoto, Y.; Mizui, M.; Sekine, T. Improvement of the Ratio of Fatigue Limit to Tensile Strength in Hot Rolled Steel Sheets by the Surface Strengthening. Tetsu Hagane 2009, 75, 517–522. [Google Scholar] [CrossRef] [PubMed] [Green Version]
  23. Lu, K.; Lu, J. Nanostructured surface layer on metallic materials induced by surface mechanical attrition treatment. Mater. Sci. Eng. A 2004, 375, 38–45. [Google Scholar] [CrossRef]
  24. Kattoura, M.; Telang, A.; Mannava, S.R.; Qian, D.; Vasudevan, V.K. Effect of ultrasonic nanocrystal surface modification on residual stress, microstructure and fatigue behavior of ATI 718Plus alloy. Mater. Sci. Eng. A 2018, 711, 364–377. [Google Scholar] [CrossRef]
  25. Mohammadpour, E.; Liew, W.Y.H.; Mondinos, N.; Altarawneh, M.; Lee, S.; Radevsk, N.; Minakshi, M.; Amri, A.; Lim, H.N.; Jiang, Z.T. Enhancement of thermal and mechanical stabilities of silicon doped titanium nitride coating by manipulation of sputtering conditions. J. Mater. Res. Technol. 2022, 17, 1122–1131. [Google Scholar] [CrossRef]
  26. Sun, Q.Q.; Han, Q.Y.; Liu, X.T.; Xu, W.; Li, J. The effect of surface contamination on corrosion performance of ultrasonic shot peened 7150 Al alloy. Surf. Coat. Technol. 2017, 328, 469–479. [Google Scholar] [CrossRef]
  27. Pour-Ali, S.; Kiani-Rashid, A.R.; Babakhani, A. Surface nanocrystallization and gradient microstructural evolutions in the surface layers of 321 stainless steel alloy treated via severe shot peening. Vacuum 2017, 144, 152–159. [Google Scholar] [CrossRef]
  28. Li, W.; Vittorietti, M.; Jongbloed, G.; Sietsma, J. The combined influence of grain size distribution and dislocation density on hardness of interstitial free steel. J. Mater. Sci. Technol. 2020, 45, 35–43. [Google Scholar] [CrossRef]
  29. Lehto, P.; Remes, H.; Saukkonen, T.; Hänninen, H.; Romanoff, J. Influence of grain size distribution on the Hall–Petch relationship of welded structural steel. Mater. Sci. Eng. A 2014, 592, 28–29. [Google Scholar] [CrossRef]
  30. Cong, Z.H.; Murata, Y. Dislocation Density of Lath Martensite in 10Cr-5W Heat-Resistant Steels. Mater. Trans. 2011, 52, 2151–2154. [Google Scholar] [CrossRef]
  31. Zeng, R.C.; Ke, W.; Han, E.H. Influence of load frequency and ageing heat treatment on fatigue crack propagation rate of as-extruded AZ61 alloy. Int. J. Fatigue 2009, 31, 463–467. [Google Scholar] [CrossRef]
  32. Delgado, D.; Minakshi, M.; Senanayake, G.; Kim, D.J. Modified electrolytic manganese dioxide (MEMD) for oxygen generation in alkaline medium. J. Solid State Electrochem. 2015, 19, 1133–1142. [Google Scholar] [CrossRef]
Figure 1. Ultrasonic shot peening equipment diagram.
Crystals 13 00299 g001
Figure 2. The cross-sectional SEM microstructure images of the 3 mm-2080 W-11 mm sample: (a) 50 s; (b) 100 s; (c) 200 s; (d) 400 s; (e) 600 s. (f) The thickness statistics of the shot peening deformation layer with different lengths of time.
Crystals 13 00299 g002
Figure 3. The cross-sectional SEM microstructure images of the 3 mm-200 s-11 mm sample: (a) 1040 W; (b) 1560 W; (c) 2080 W. (d) The thickness statistics of the shot peening deformation layer with different levels of power.
Crystals 13 00299 g003
Figure 4. The cross-sectional SEM microstructure of the 3 mm-200 s-2080 W sample: (a) 14 mm; (b) 11 mm; (c) 8 mm. (d) The thickness statistics of the shot peening deformation layer with different distances.
Crystals 13 00299 g004
Figure 5. The cross-sectional SEM image and EDS analysis of the sample after 3 mm-2080 W-11 mm-400 s USP treatment.
Crystals 13 00299 g005
Figure 6. XRD patterns and enlarged images of samples with different shot peening times.
Crystals 13 00299 g006
Figure 7. Surface roughness and microhardness evolutions of the USPed samples with different lengths of time.
Crystals 13 00299 g007
Figure 8. Surface roughness and microhardness evolutions of USPed samples with different levels of power.
Crystals 13 00299 g008
Figure 9. Surface roughness and microhardness evolutions of USPed samples with different distances.
Crystals 13 00299 g009
Figure 10. Electrochemical test polarization curves and line plot of the corrosion potential and corrosion current of samples with different lengths of USP time.
Crystals 13 00299 g010
Figure 11. SEM macro-morphology characteristics of Q345B steel in 3.5 wt.% NaCl solution for 3 days: (a1) un-USPed; (b1) 200 s-2080 W-11 mm; (c1) 600 s-2080 W-11 mm; for 7 days: (a2) un-USPed; (b2) 200 s-2080 W-11 mm; (c2) 600 s-2080 W-11 mm.
Crystals 13 00299 g011
Figure 12. Electrochemical test polarization curves and line plot of the corrosion potential and corrosion current of samples with different levels of USP power.
Crystals 13 00299 g012
Figure 13. SEM macro-morphology characteristics of Q345B steel in 3.5 wt.% NaCl solution for 3 days: (a1) un-USPed; (b1) 200 s-1040 W-11 mm; (c1) 200 s-2080 W-11 mm; for 7 days: (a2) un-USPed; (b2) 200 s-1040 W-11 mm; (c2) 200 s-2080 W-11 mm.
Crystals 13 00299 g013
Figure 14. Electrochemical test polarization curves and line plot of the corrosion potential and corrosion current of samples with different USP distances.
Crystals 13 00299 g014
Figure 15. SEM macro-morphology characteristics of Q345B steel in 3.5 wt.% NaCl solution for 3 days: (a1) un-USPed; (b1) 200 s-2080 W-8 mm; (c1) 200 s-2080 W-11 mm; for 3 days: (a2) un-USPed; (b2) 200 s-2080 W-8 mm; (c2) 200 s-2080 W-11 mm.
Crystals 13 00299 g015
Table 1. Main chemical element composition of Q345B steel (mass fraction, wt.%).
ElementCMnSiCuNiTiCrPS
Composition≤0.20≤1.70≤0.50≤0.30≤0.50≤0.20≤0.30≤0.035≤0.035
Table 2. The mechanical property parameter of Q345B steel.
ParameterYield Strength/MPaTensile Strength/MPaElastic Modulus/GPaPoisson’s RatioDensity/(kg·m3)
Q345B steel345450–6302060.307850
Table 3. Ultrasonic shot peening experimental parameters.
Sample No.Time t/sPower P/WDistance d/mm
Blank///
150208011
2100208011
3200208011
4400208011
5600208011
6200156011
7200104011
820020808
9200208014
Table 4. Element content (%) of spectrums 1–4, as measured via EDS.
ElementSpectrum 1Spectrum 2Spectrum 3Spectrum 4
C6.979.006.963.22
O5.994.741.000.57
Si3.741.440.320.12
Mn1.041.371.471.61
Fe82.2683.4490.2494.49
Table 5. The parameters of the equivalent elements in the equivalent circuit of the samples with different lengths of USP time.
USP TimeIcorr/(A/cm2)Ecorr/V
Blank8.946 × 10−6−0.838
3 mm-2080 W-11 mm-50 s1.723 × 10−5−0.959
3 mm-2080 W-11 mm-100 s1.646 × 10−5−0.949
3 mm-2080 W-11 mm-200 s1.083 × 10−5−0.920
3 mm-2080 W-11 mm-400 s3.360 × 10−4−0.980
3 mm-2080 W-11 mm-600 s3.538 × 10−5−0.988
Table 6. The parameters of the equivalent elements in the equivalent circuit of the samples with different levels of USP power.
USP TimeIcorr/(A/cm2)Ecorr/V
Blank8.946 × 10−6−0.838
3 mm-1040 W-11 mm-200 s1.633 × 10−5−0.967
3 mm-1560 W-11 mm-200 s1.264 × 10−5−0.944
3 mm-2080 W-11 mm-200 s1.083 × 10−5−0.920
Table 7. The parameters of the equivalent elements in the equivalent circuit of the samples with different USP distances.
USP TimeIcorr/(A/cm2)Ecorr/V
Blank8.946 × 10−6−0.838
3 mm-2080 W-8 mm-200 s5.778 × 10−5−0.975
3 mm-2080 W-11 mm-200 s1.083 × 10−5−0.920
3 mm-2080 W-14 mm-200 s1.254 × 10−5−0.945
Disclaimer/Publisher’s Note: The statements, opinions and data contained in all publications are solely those of the individual author(s) and contributor(s) and not of MDPI and/or the editor(s). MDPI and/or the editor(s) disclaim responsibility for any injury to people or property resulting from any ideas, methods, instructions or products referred to in the content.