Article

Effect of Thermal Exposure on Mechanical Properties of Al-Si-Cu-Ni-Mg Aluminum Alloy

School of Mechanical Engineering, Jiangsu Ocean University, Lianyungang 222005, China
*
Authors to whom correspondence should be addressed.
Crystals 2023, 13(2), 236; https://doi.org/10.3390/cryst13020236
Submission received: 3 January 2023 / Revised: 19 January 2023 / Accepted: 20 January 2023 / Published: 30 January 2023

Abstract

:
The microstructure morphology and evolution of mechanical properties are investigated in this study. The results show that the phases displayed no clear change after thermal exposure at 250 °C for 200 h. The tensile strength of the as-cast alloy showed a downward trend in different degrees with the increase in the tensile temperature, while the influence of elongation was opposite to the tensile strength. In addition, the tensile strength tended to be stable after thermal exposure at 250 °C for 100 h. The main creep mechanism of the as-cast alloy at a low temperature and low stress (T ≤ 250 °C; σ ≤ 40 MPa) is grain-boundary creep. The Monkman–Grant empirical formula was used to fit the relationship between the creep life and the minimum creep rate, and the fitting results are:   t r · ε ˙ m i n 0.95 = 0.207 .

1. Introduction

Because of its good specific strength and excellent mechanical properties, heat-resistant aluminum alloys have been widely used in aerospace engineering, vehicle engineering, and marine engineering. Al-Si-Cu-Ni-Mg alloy is a typical cast heat-resistant aluminum alloy, which is used to produce engine pistons. Therefore, the alloy usually works at a high temperature and alternating load. The service life of the piston is determined by the high-temperature endurance performance of the alloy [1,2,3,4,5].
With the increase in engine power, new challenges are presented to the high-temperature stability and endurance strength of piston materials. The development of a heat-resistant aluminum alloy with better high-temperature performance is imminent [6,7]. Thermal exposure experiments have been widely used by domestic and foreign scholars to verify the high-temperature stability of heat-resistant aluminum alloys. For instance, the eutectic silicon and Al3Ni phases of Al3Zr/Al-8Si-2Ni composites were spheroidized after being exposed at 450 °C for 150 h. The elongation of the Al3Zr/Al-8Si-2Ni composites was positively correlated with the heat exposure time, and the tensile strength tended to stabilize after decreasing [8]. A study reported that the average number of fatigue cycles before failure of the alloy was 2.24 × 10⁷ after thermal exposure at 425 °C/100 h, which was 3 times higher than the 8.21 × 10⁶ fatigue life of T6 heat treatment. The δ-Al3CuNi phase and γ-Al7Cu4Ni were thermally stable intermetallic compounds, which significantly improved the high-temperature fatigue life of Al-Si piston alloys [9]. Zhang et al. [10] observed that the steady-state creep rate of the studied alloy decreased threefold when the loading changed from 70 MPa to 90 MPa with a constant temperature of 90 °C. Under a constant stress of 90 MPa, the steady creep rate of the studied alloy increased from 1.94 × 10⁻⁷ to 1.48 × 10⁻⁶ with the temperature rising from 90 °C to 150 °C. The grain size was basically unchanged under different compressive creep stresses. Zhao et al. [11] reported that the increase in YS was attributed to the precipitation of β″, Q′, and θ′ nanophases in an α-Al matrix after aging at 175 °C for 4 h. After thermal exposure at 350 °C for 100 h, the nanophases were mainly dissolved in the α-Al matrix, and the ultra-fine eutectic silicon network was fractured and coarsened, resulting in the hardness of the alloy decreasing from 110 HV to 61 HV and the YS dropping to 117 MPa. The current literature reports that the high-temperature mechanical properties after thermal exposure are positively correlated with Ti and Cu content, which is attributed to the increase in the number of precipitated particles. The high strength value of the alloy after thermal exposure at 350 °C for 0.5 h is attributed to the number of nano sizes. The high heat resistance of T(Al20Cu2Mn3) and Fe(Al15(FeMn)3Si2) makes the strength stable after 100 h thermal exposure [12].
At present, the research on the high-temperature endurance strength of heat-resistant aluminum alloys mainly focuses on fatigue failure, and high-temperature creep performance is another key factor in the high-temperature service life of alloys [13,14,15,16,17]. Therefore, the aim of this study is to find out the thermal stability of the high-temperature endurance strength of Al-Si-Cu-Ni-Mg piston alloys, including the change law of the creep properties of the alloys when exposed to high temperature, and then guide subsequent study of heat-resistant aluminum alloy.
In this work, the microstructures of the cast alloy before and after thermal exposure were characterized using optical microscopy and scanning electron microscopy. The different temperature tensile properties of the cast alloy were investigated. The evolution law of the tensile strength during thermal exposure, as well as the creep mechanism of the alloy before and after thermal exposure, were investigated in this study. This study provides a basis for subsequent study on the influence of the high-temperature properties of Al-Si-Cu-Ni-Mg alloy.

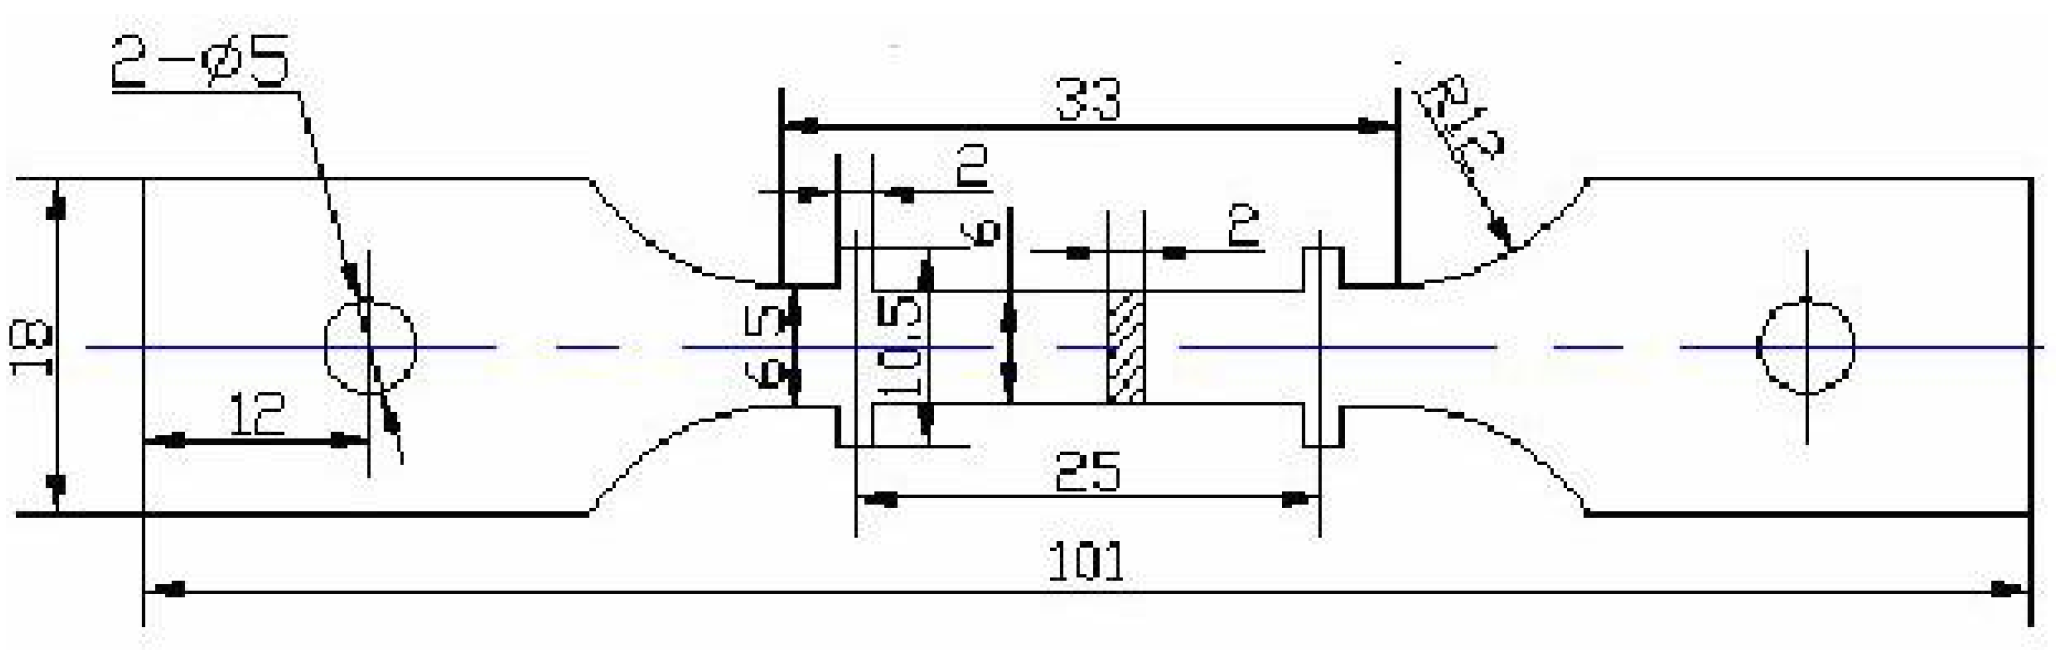
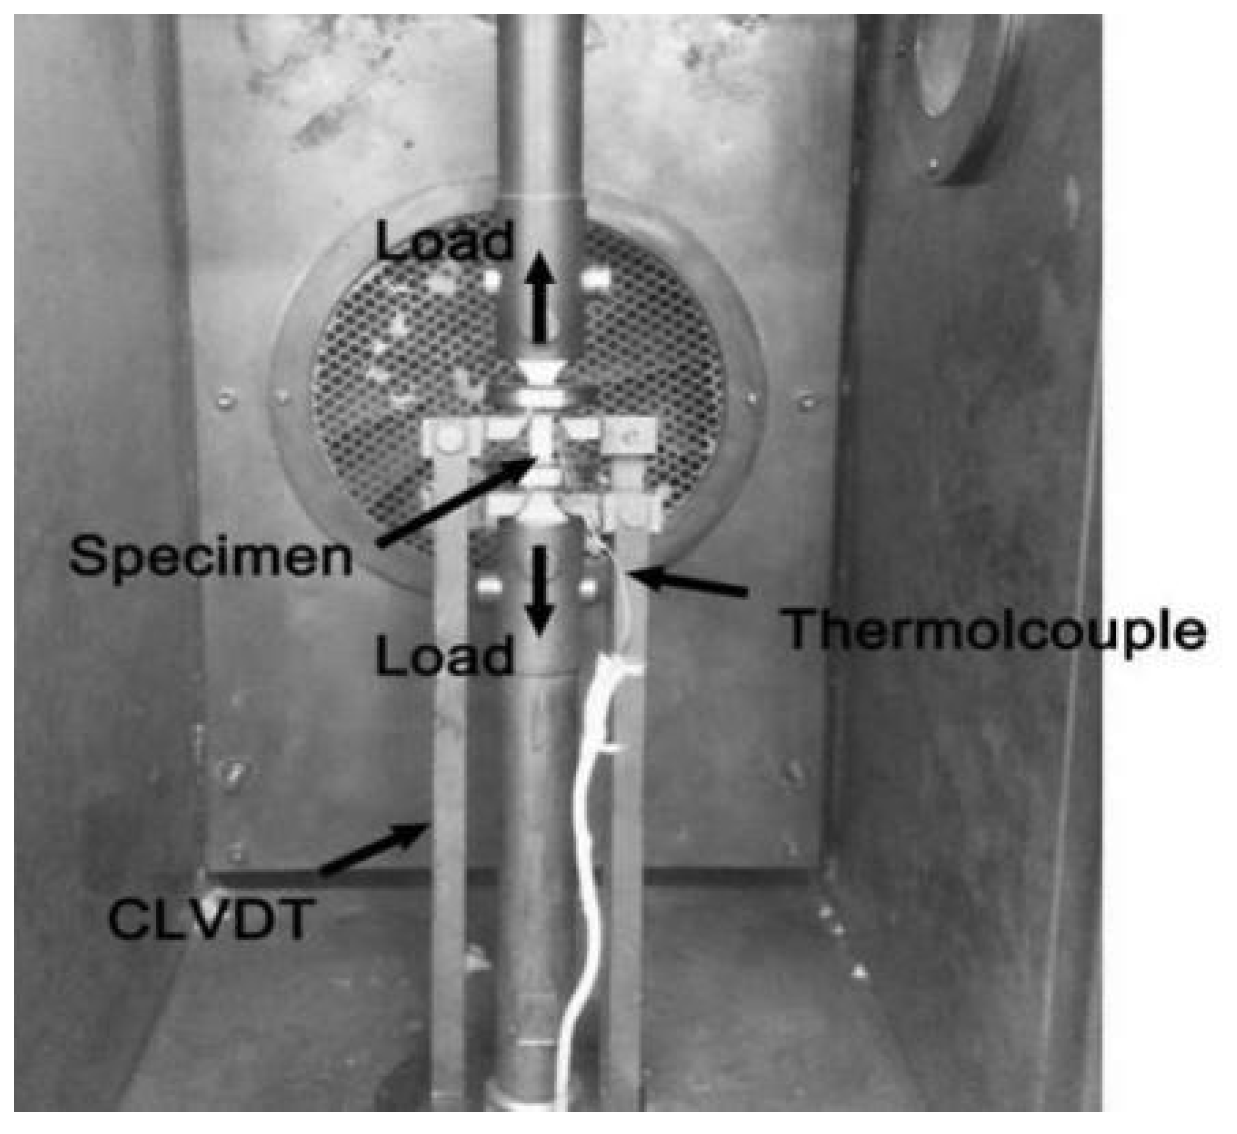
2. Experimental Procedures

The chemical composition of the designed alloys is shown in Table 1. The alloys were prepared by melting pure Mg, Al, and Al-20Si (wt. %), Al-50Cu (wt. %), and Al-10Ni (wt. %) master alloys in an electric smelting furnace. Before melting the alloy, the crucible and mold were kept at 200 °C for 2 h. The Al-50Cu and Al-10Ni were kept at 150 °C for 2 h to remove moisture in the raw materials. First, pure Al and master alloys were added to the crucible and melted at 740 °C. Then pure Mg wrapped in aluminum foil was added to the melt at approximately 720 °C. The melt was refined using the refining agent C2Cl6 at 740 °C. During the process of refining, the melt was stirred to ensure the refining effect and homogeneous chemical composition.
The metallographic samples were ground with different levels of sandpapers, polished with a PG-2B metallographic polishing machine for final polishing, and then etched with Keller’s reagent (a mixed solution of 2.5%HNO3, 1.5%HCl, 1%HF, and 95% H2O) for 10 s. The fracture surface of the tensile specimen was observed with NOVA NanoSEM 230 scanning electron microscopy (Hong Kong, China). The tensile test was carried out on a WDW-10S (Jinan, China) universal tensile testing machine with a tensile rate of 0.4 mm/min at room temperature or 250 °C. The thermal exposure experiment was carried out in a tubular furnace with a temperature error of ± 2 °C. The thermal exposure temperature was set at 250 °C, and the time was 0~200 h. Each sample was measured after holding for 15 min at the set temperature, and the results are the average value of three parallel samples. The creep test was carried out on a CSS-3902 creep testing machine (Nanjing, China). The test temperature was 200–300 °C, and the stress was 20 MPa and 28 MPa. The sample was kept at the preset temperature for 1 h before loading. Two creep samples were tested for each condition, and no repeatability test was carried out if there was no abnormality. The geometric sizes of the tensile creep sample and the creep testing device are shown in Figure 1 and Figure 2, respectively.

3. Results and Discussion

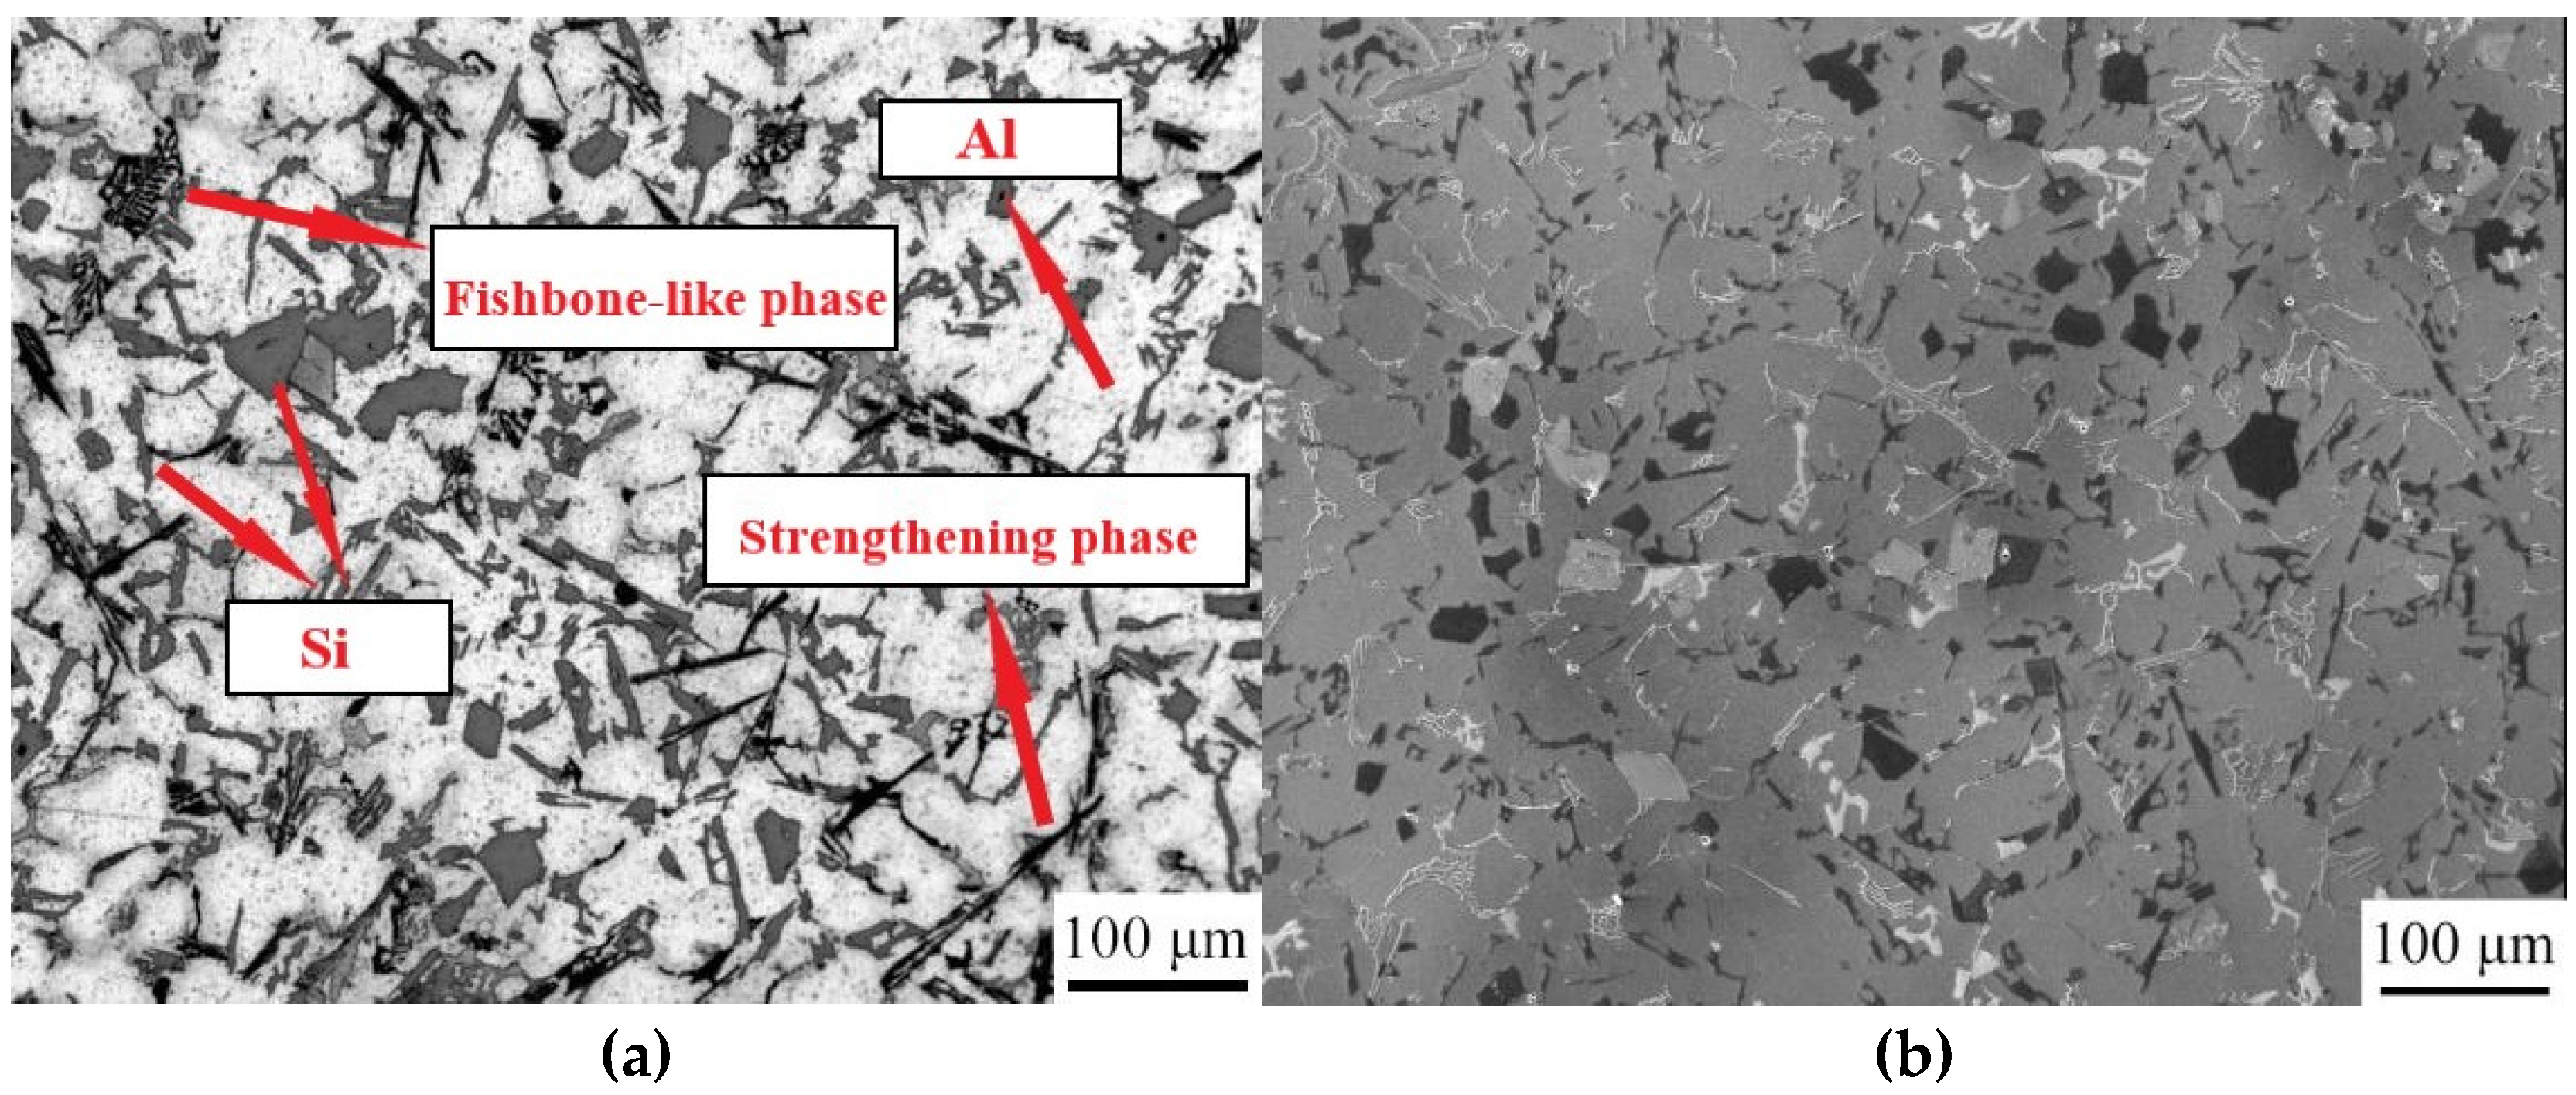
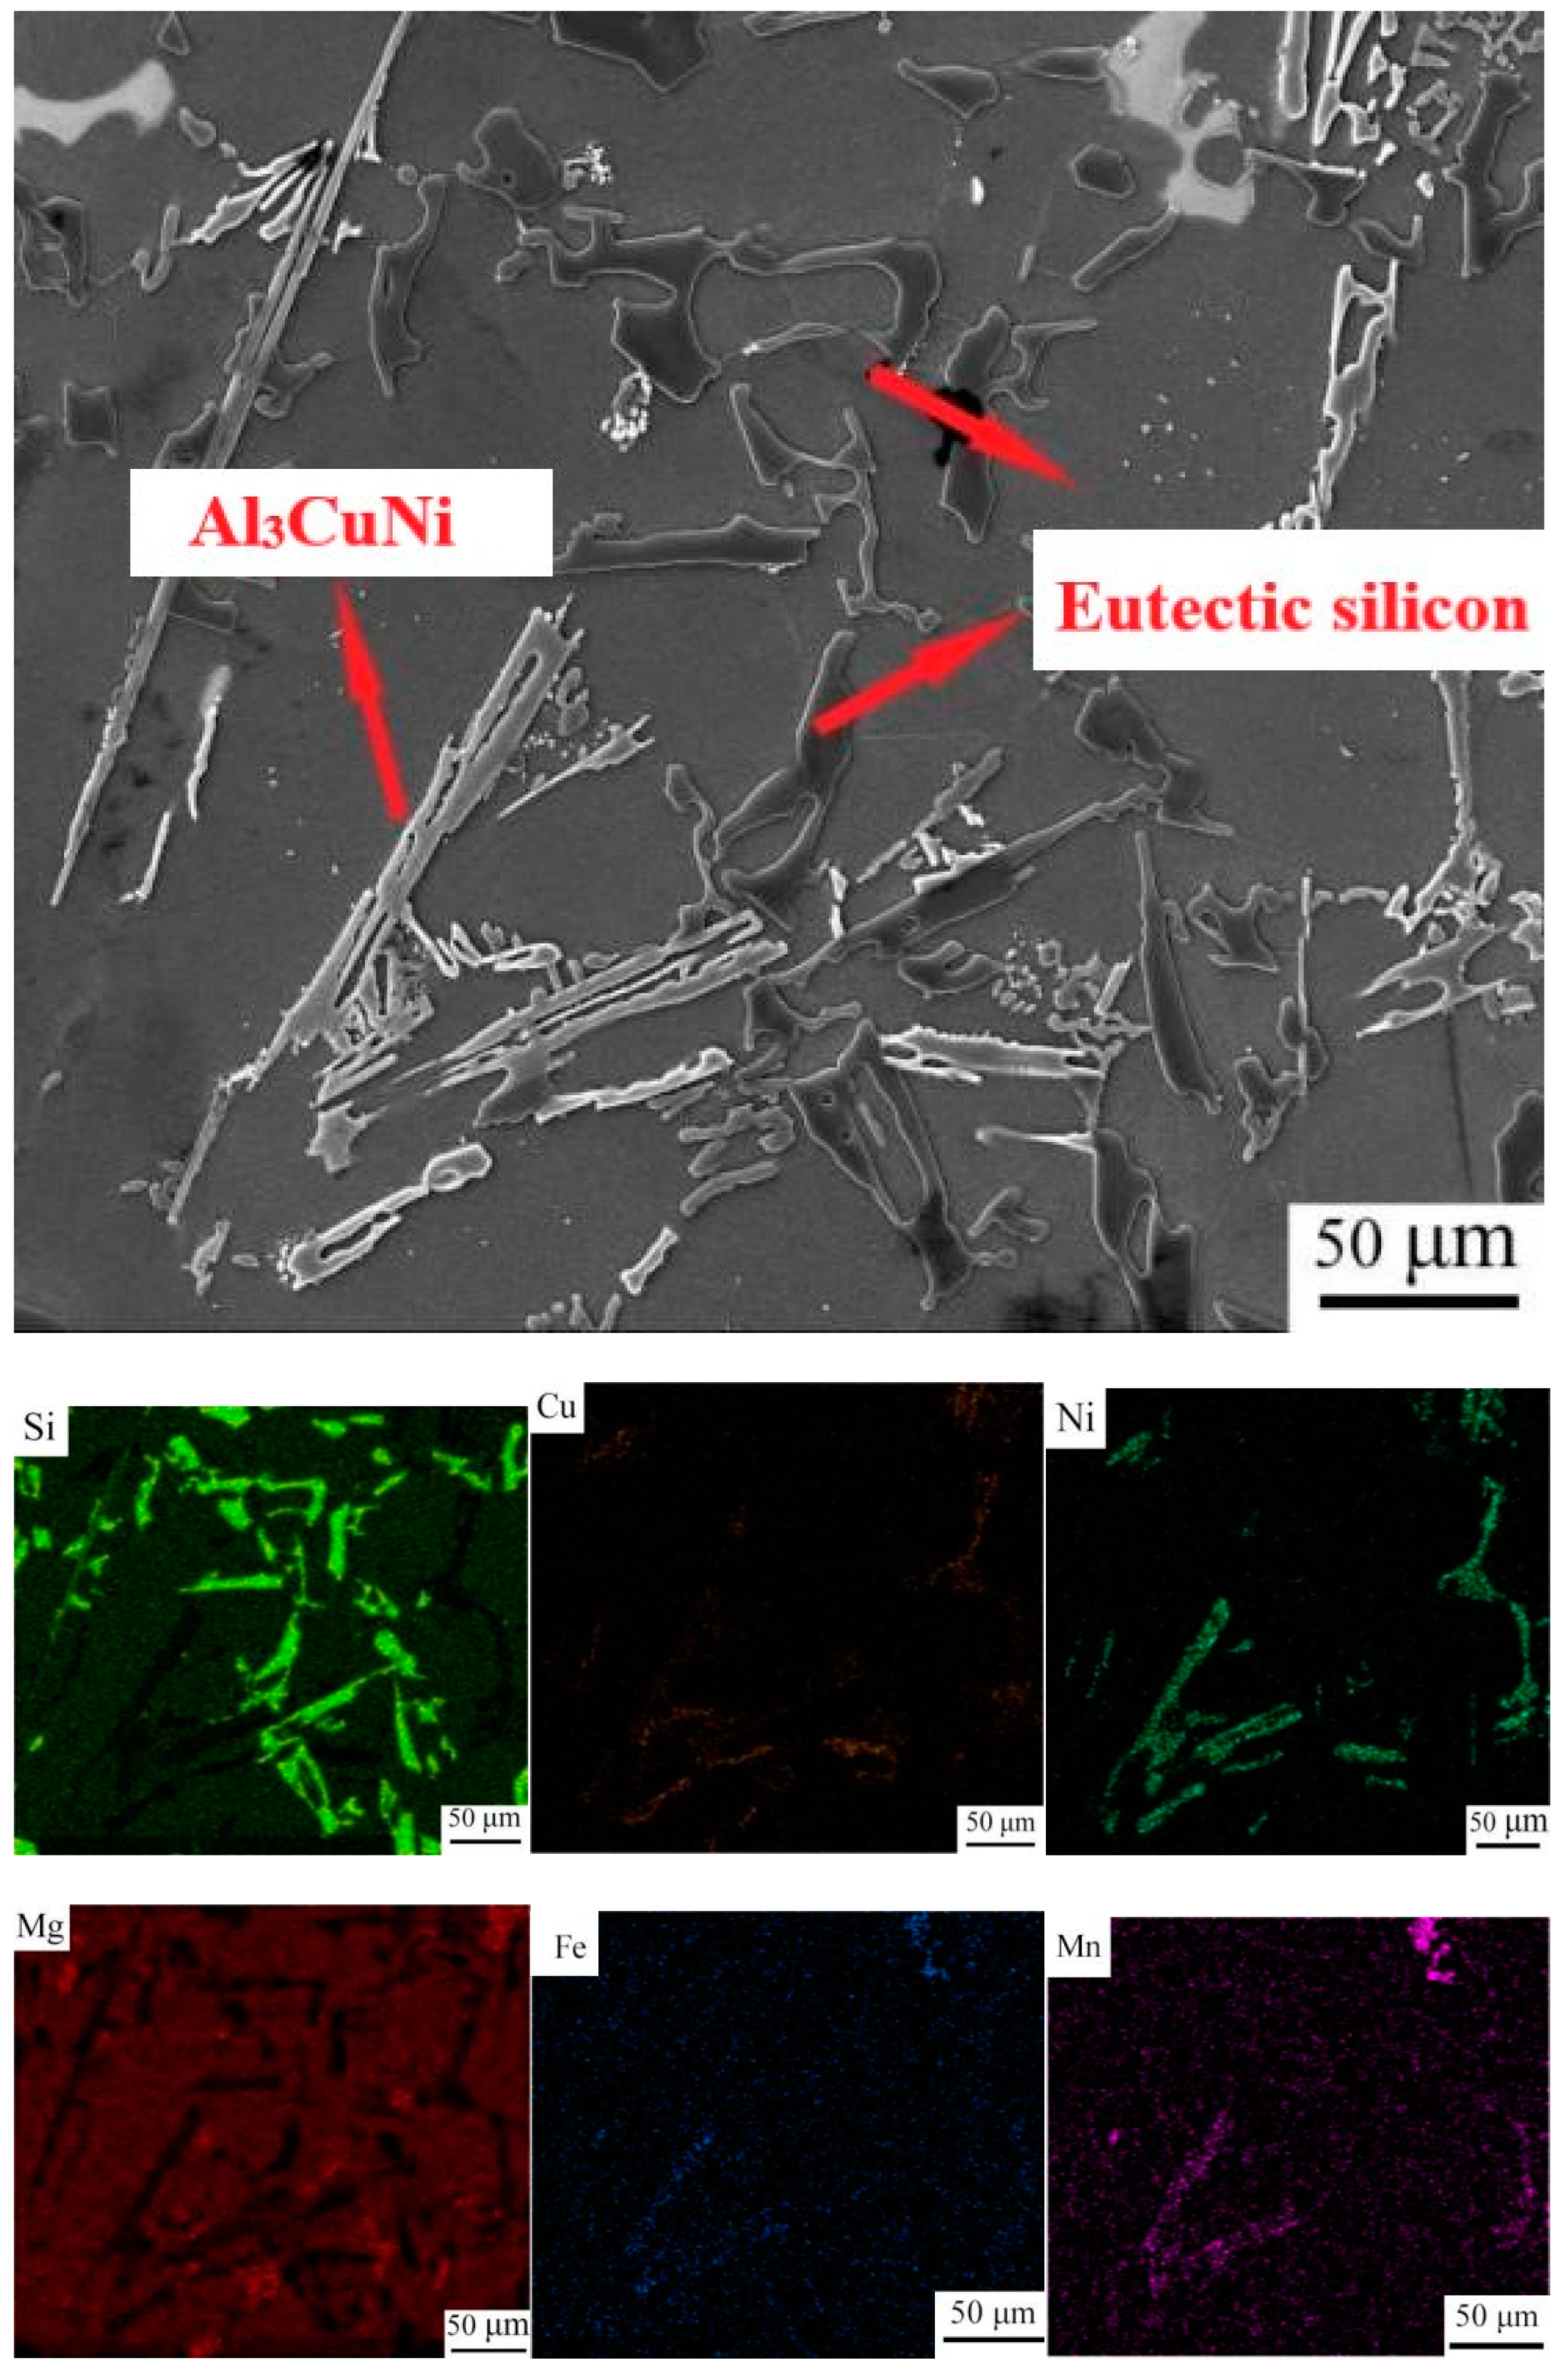
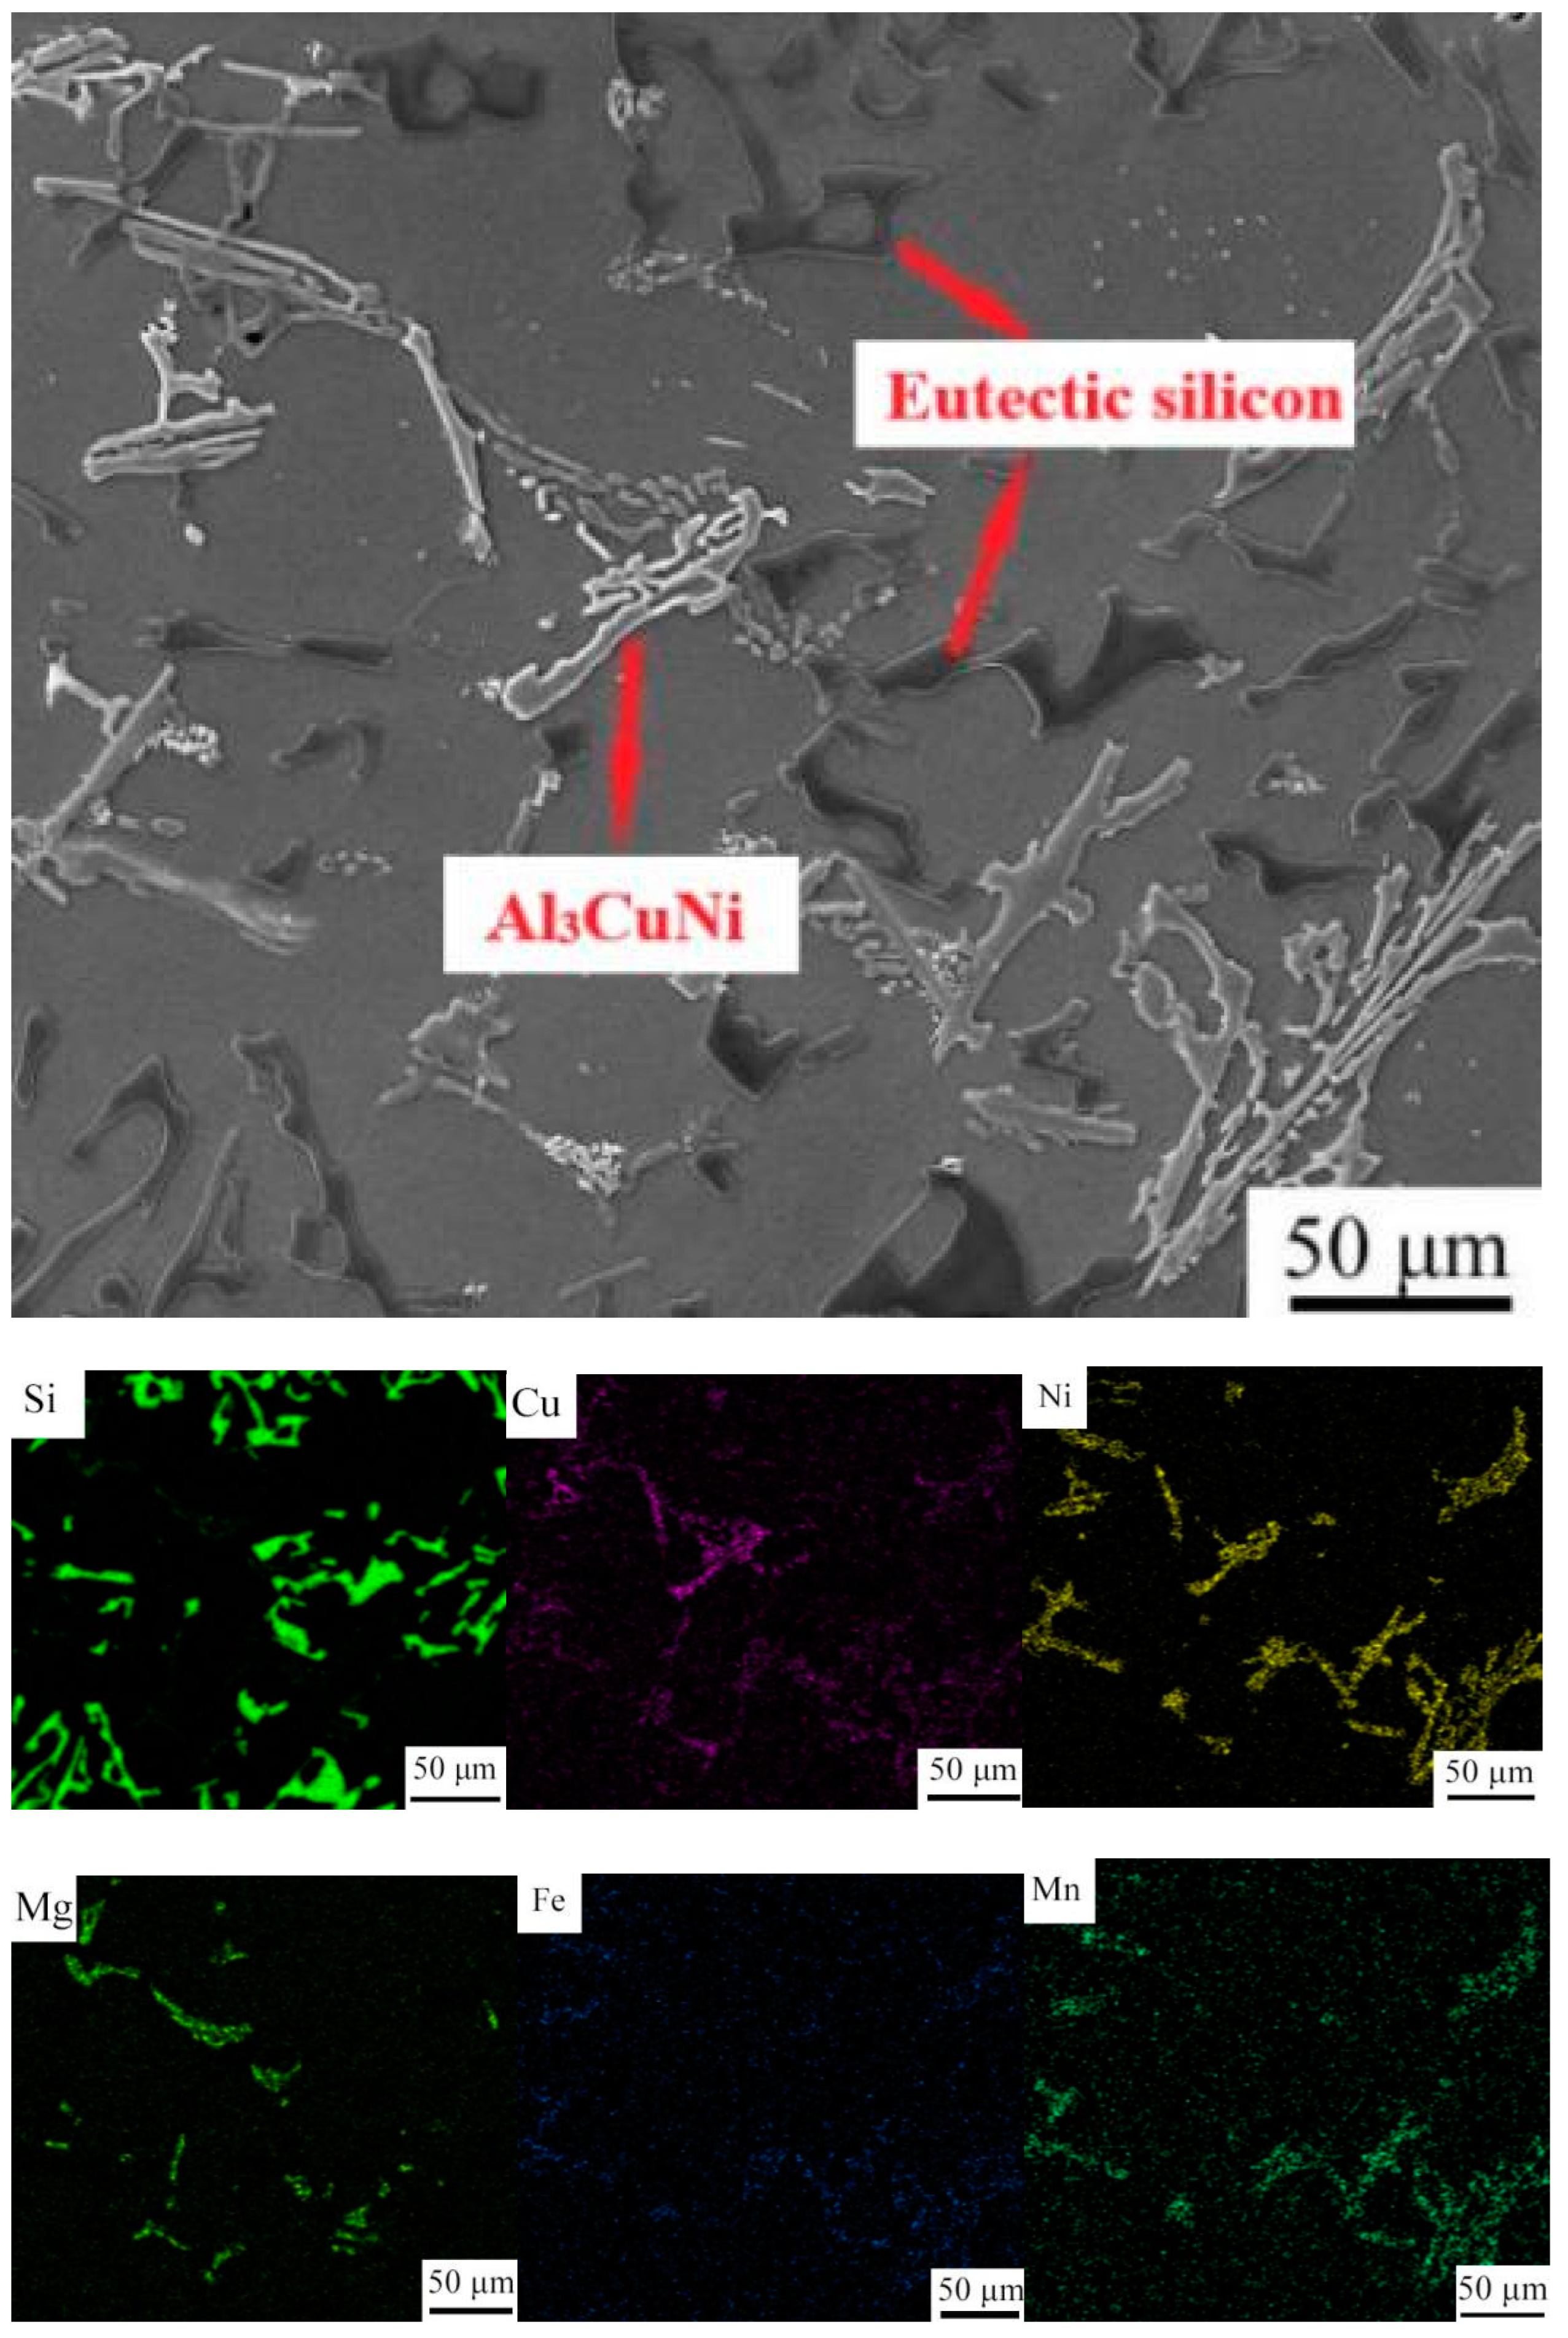
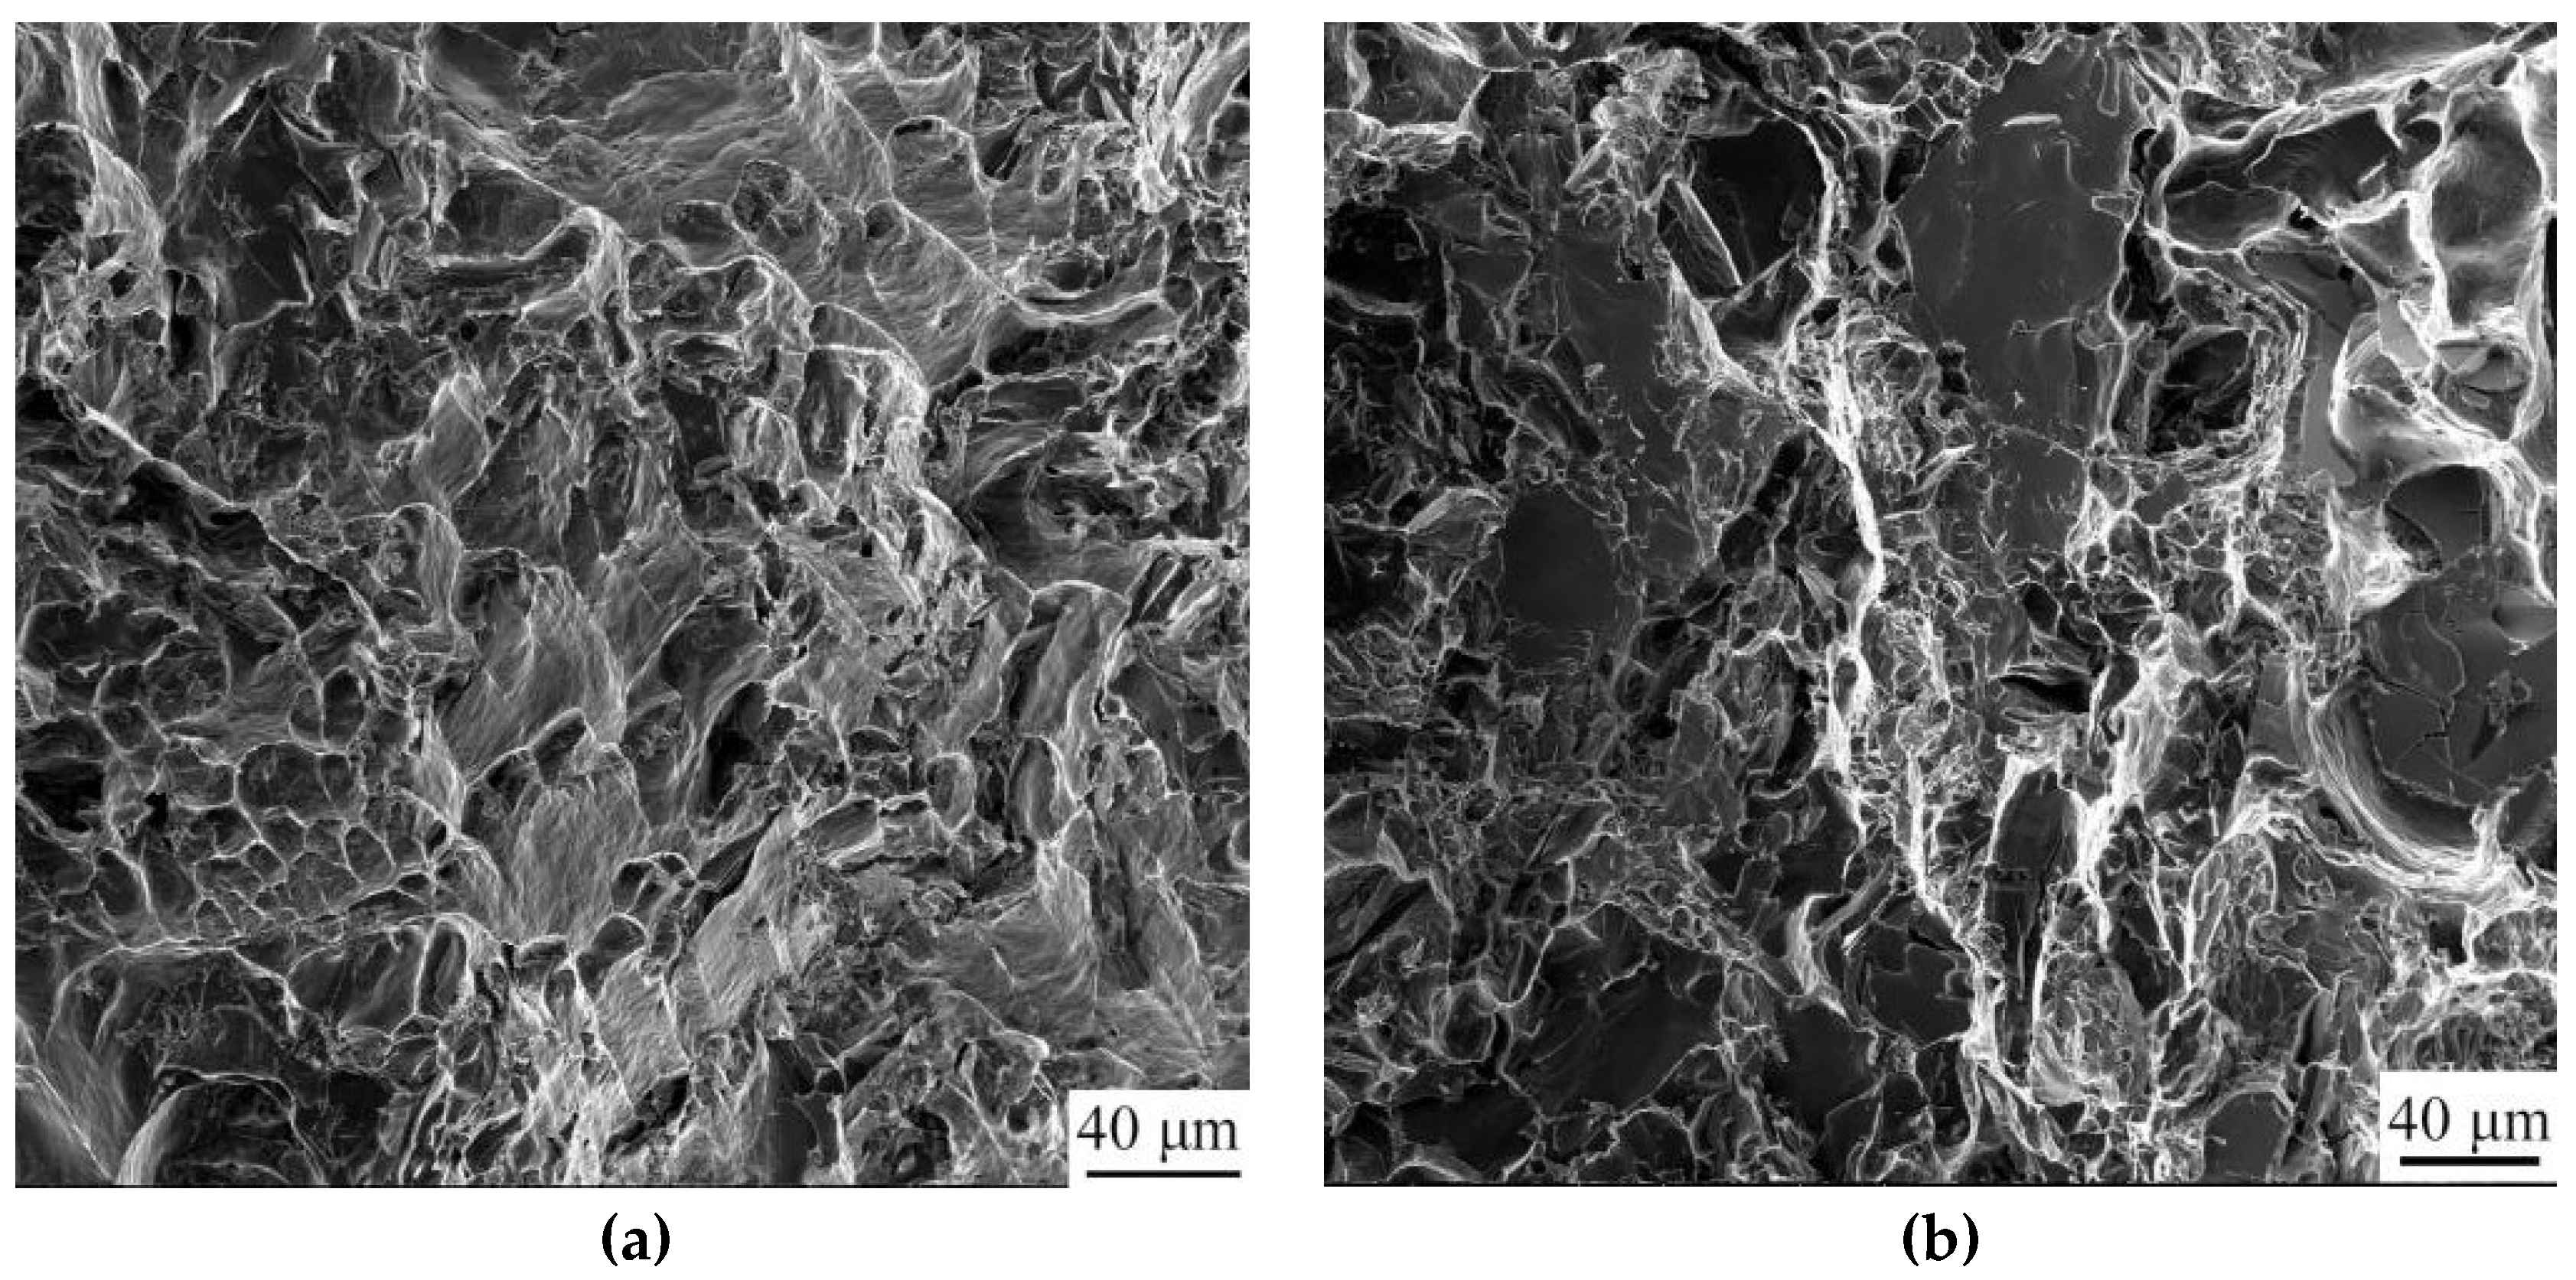
3.1. Microstructure and Morphology of Alloys in Different States

Figure 3 depicts the microstructure morphology of Al-Si-Cu-Ni-Mg alloy under different characterization methods. Figure 3a shows that the α-Al was in the form of coarse dendrites, and most of the eutectic silicon was in the shape of short rods. Uniformly distributed black needle-like strengthening phases and some fishbone-like AlSiFeNiCu phases were detected. The characteristics of the fishbone-like phases were consistent with those reported in the related literature [19]. Figure 3b presents that primary silicon and eutectic silicon were randomly distributed on the Al matrix. The fishbone-like phase is observable in Figure 3a, and the network-like precipitation phase can be found in Figure 3b.
Compared with the as-cast alloy in Figure 4, the elements in the thermal exposed alloy occurred with different degrees of segregation and aggregation as shown in Figure 5. With the temperature increase, the solute atoms of the precipitation phase diffused, which promoted the nucleation and growth of Q-Al5Cu2Mg8Si6, displayed with the Mg element obviously aggregated. The distribution of Cu and Ni elements was more uniform, whereas there was an increase in the distribution of slightly roughened rod-shaped eutectic Si. In conclusion, after 200 h thermal exposure at 250 °C, the microstructures at the micro scale demonstrated no significant changes.

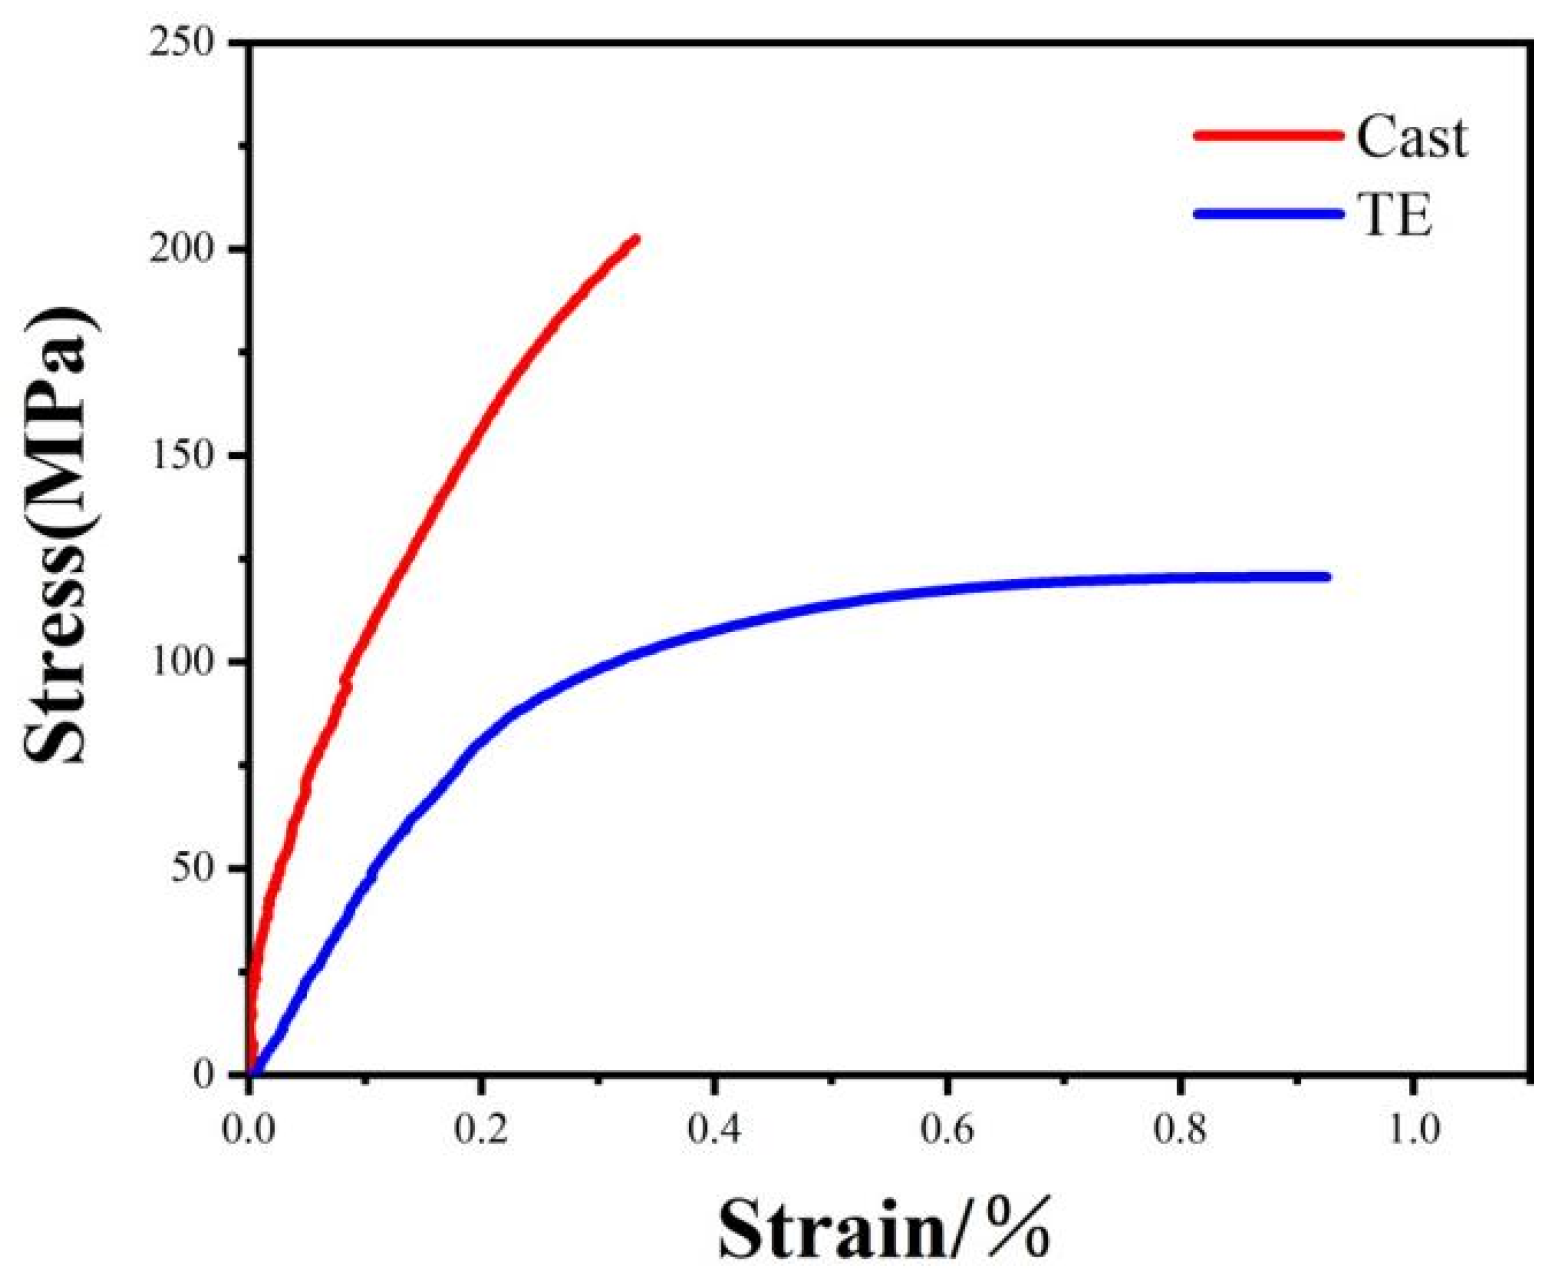
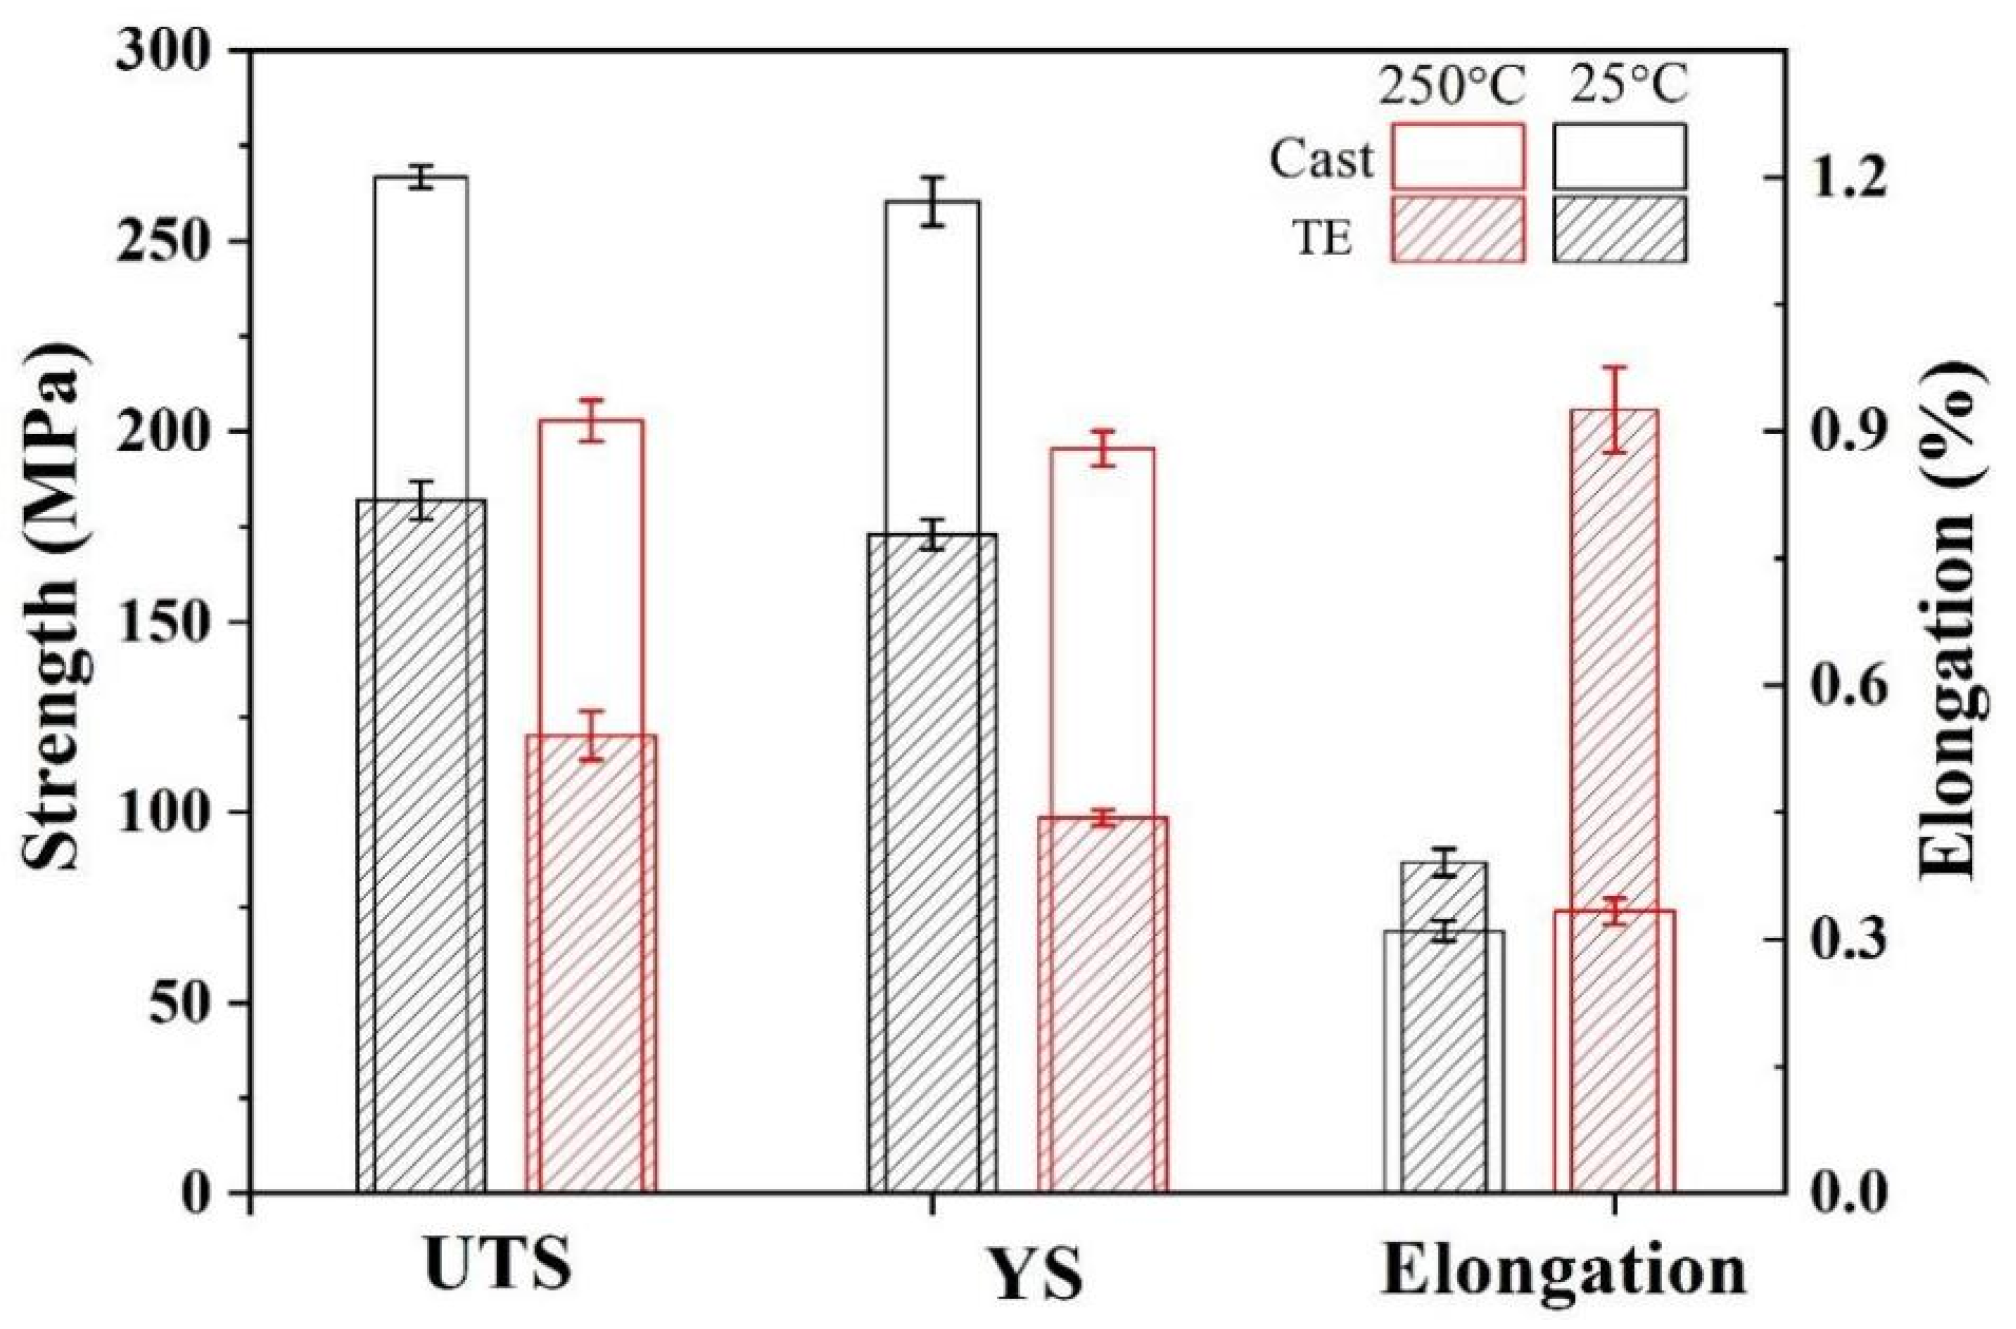
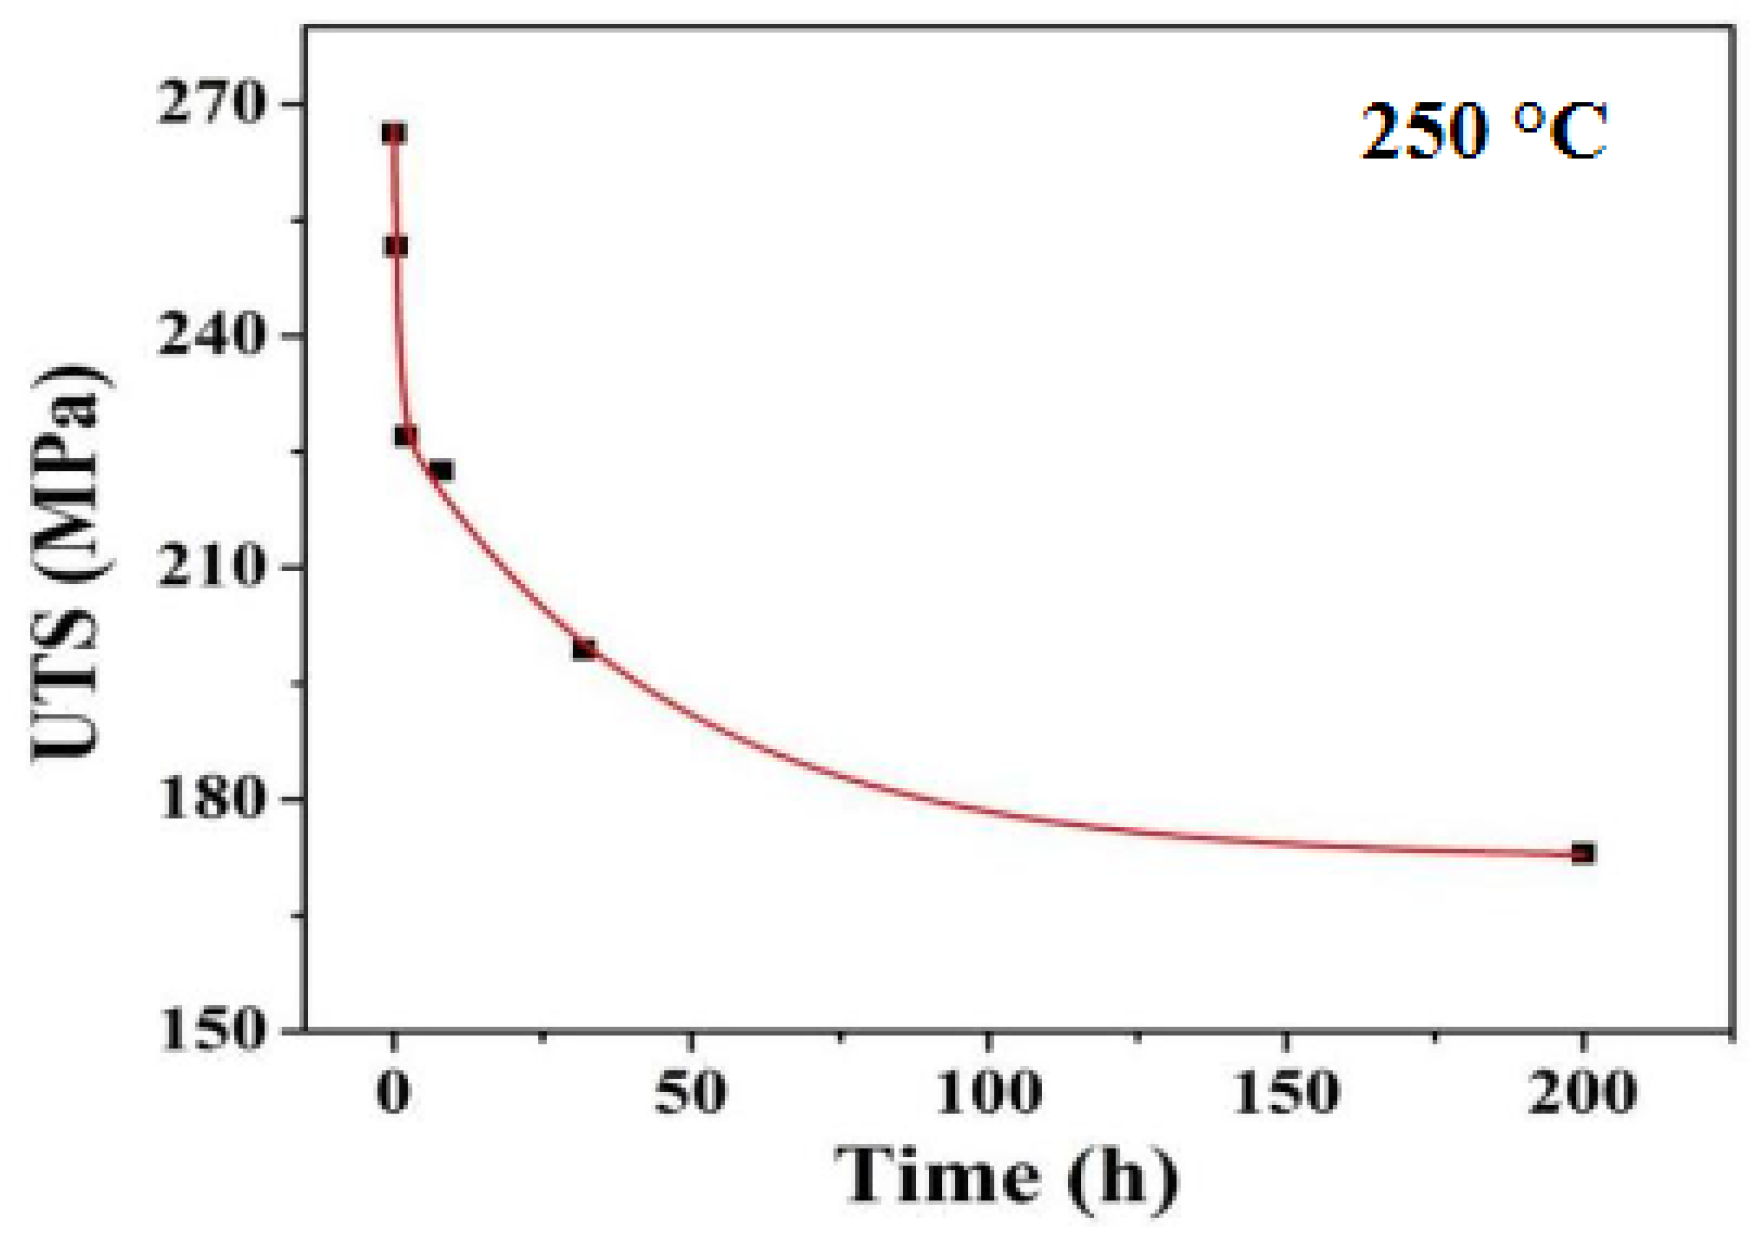
3.2. Evolution of Tensile Properties during Thermal Exposure

Figure 6 shows the typical stress–strain curves of the Al-Si-Cu-Ni-Mg alloy under different conditions tested at 250 °C. The ultimate tensile strength (UTS) of the alloy measured at 250 °C decreased from 202.8 MPa to 120.2 MPa after thermal exposure at 250 °C for 200 h, which is a 40.7% decrease. The elongation of the alloy measured at 250 °C increased from 0.33% to 0.95% after thermal exposure.
The tensile properties of the alloy with different states measured at different temperatures are displayed in Figure 7. The UTS of the as-cast alloy decreased from 266.8 MPa to 202.8 MPa when the temperature was increased from 25 °C to 250 °C, which is a drop of about 24%. The UTS of the TE alloy decreased from 266.8 MPa to 170.2 MPa at room temperature, with a decrease of about 36.2%. The elongation of the as-cast alloy increased slightly when the temperature was increased from 25 °C to 250 °C.
The UTS of the TE alloy dropped from 170.2 MPa to 120.2 MPa when the temperature was increased from 25 °C to 250 °C, which is a significant drop of 29.4%. The elongation of the TE alloy increased greatly from 0.39% to 0.92% when the temperature was increased from 25 °C to 250 °C. With a test temperature of 250 °C, dislocations can climb to a certain extent under the action of stress, which provides more possibilities for alloy cross-slip and reduces the resistance of the cross-slip process. The climbing of a dislocation leads to a decrease in mechanical properties, as can be seen in the tensile strength decreasing accordingly.
As illustrated in Figure 8, the UTS of the alloy was tested at room temperature after thermal exposure at 250 °C for different times. The UTS of the studied alloys decreased greatly in the initial stage and then basically tended to be stable when the exposure temperature reached 32 h [12]. The UTS of the alloy was 173 MPa after thermal exposure at 250 °C for 200 h. Compared with the as-cast alloy, the UTS decreased by about 35%. The relation between the UTS (σ) at room temperature and the thermal exposure time (t) at 250 °C fitted using ExpAssoc is shown as follows:
σ t 250 = σ 0 250 38 1 E x p t 0.84 56.8 1 E x p t 45.2 ,   R 2   =   0.98

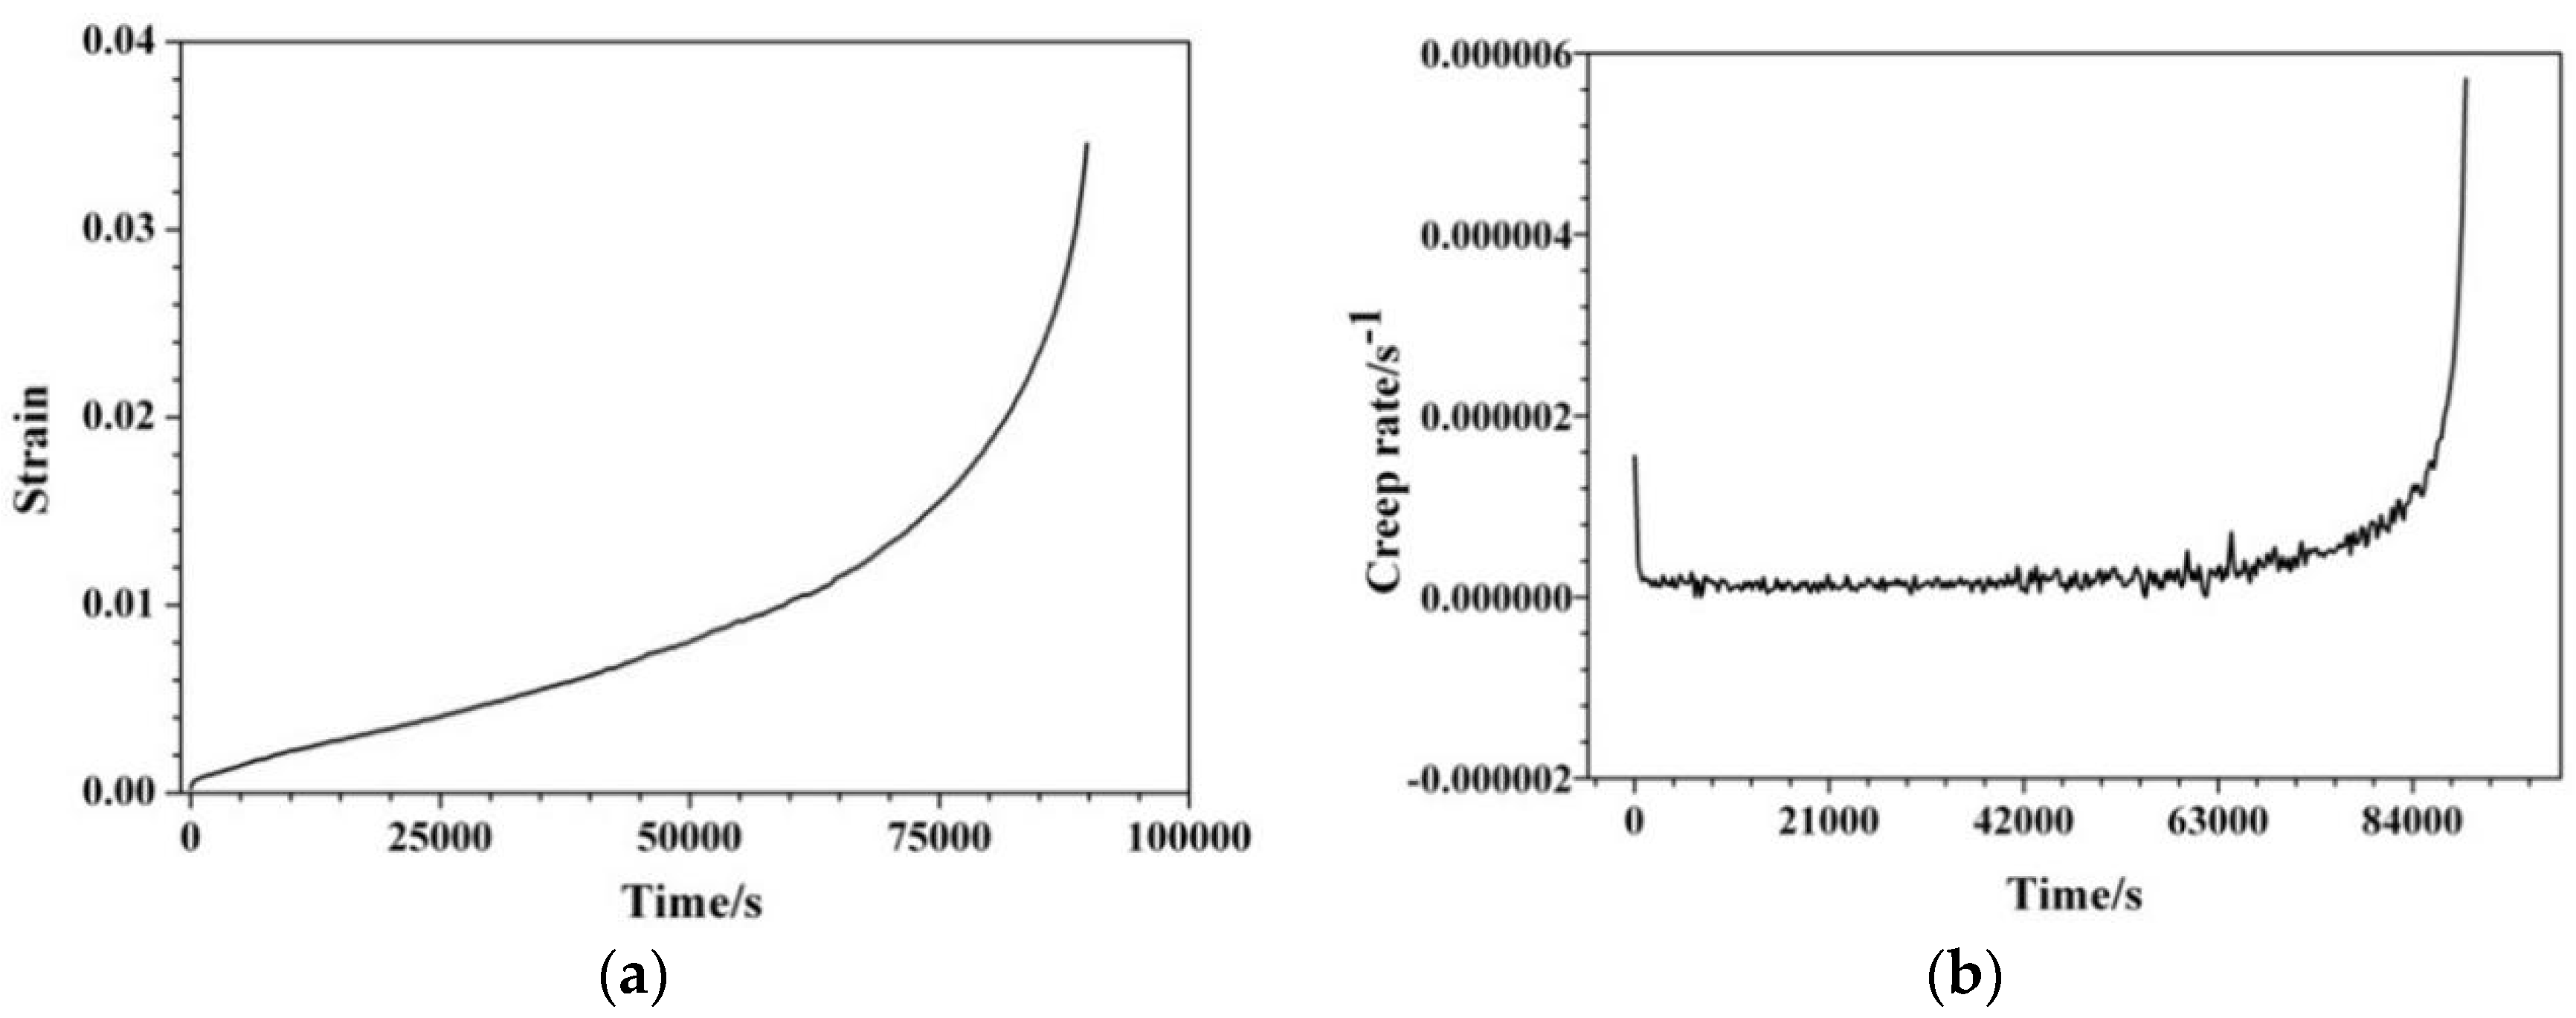
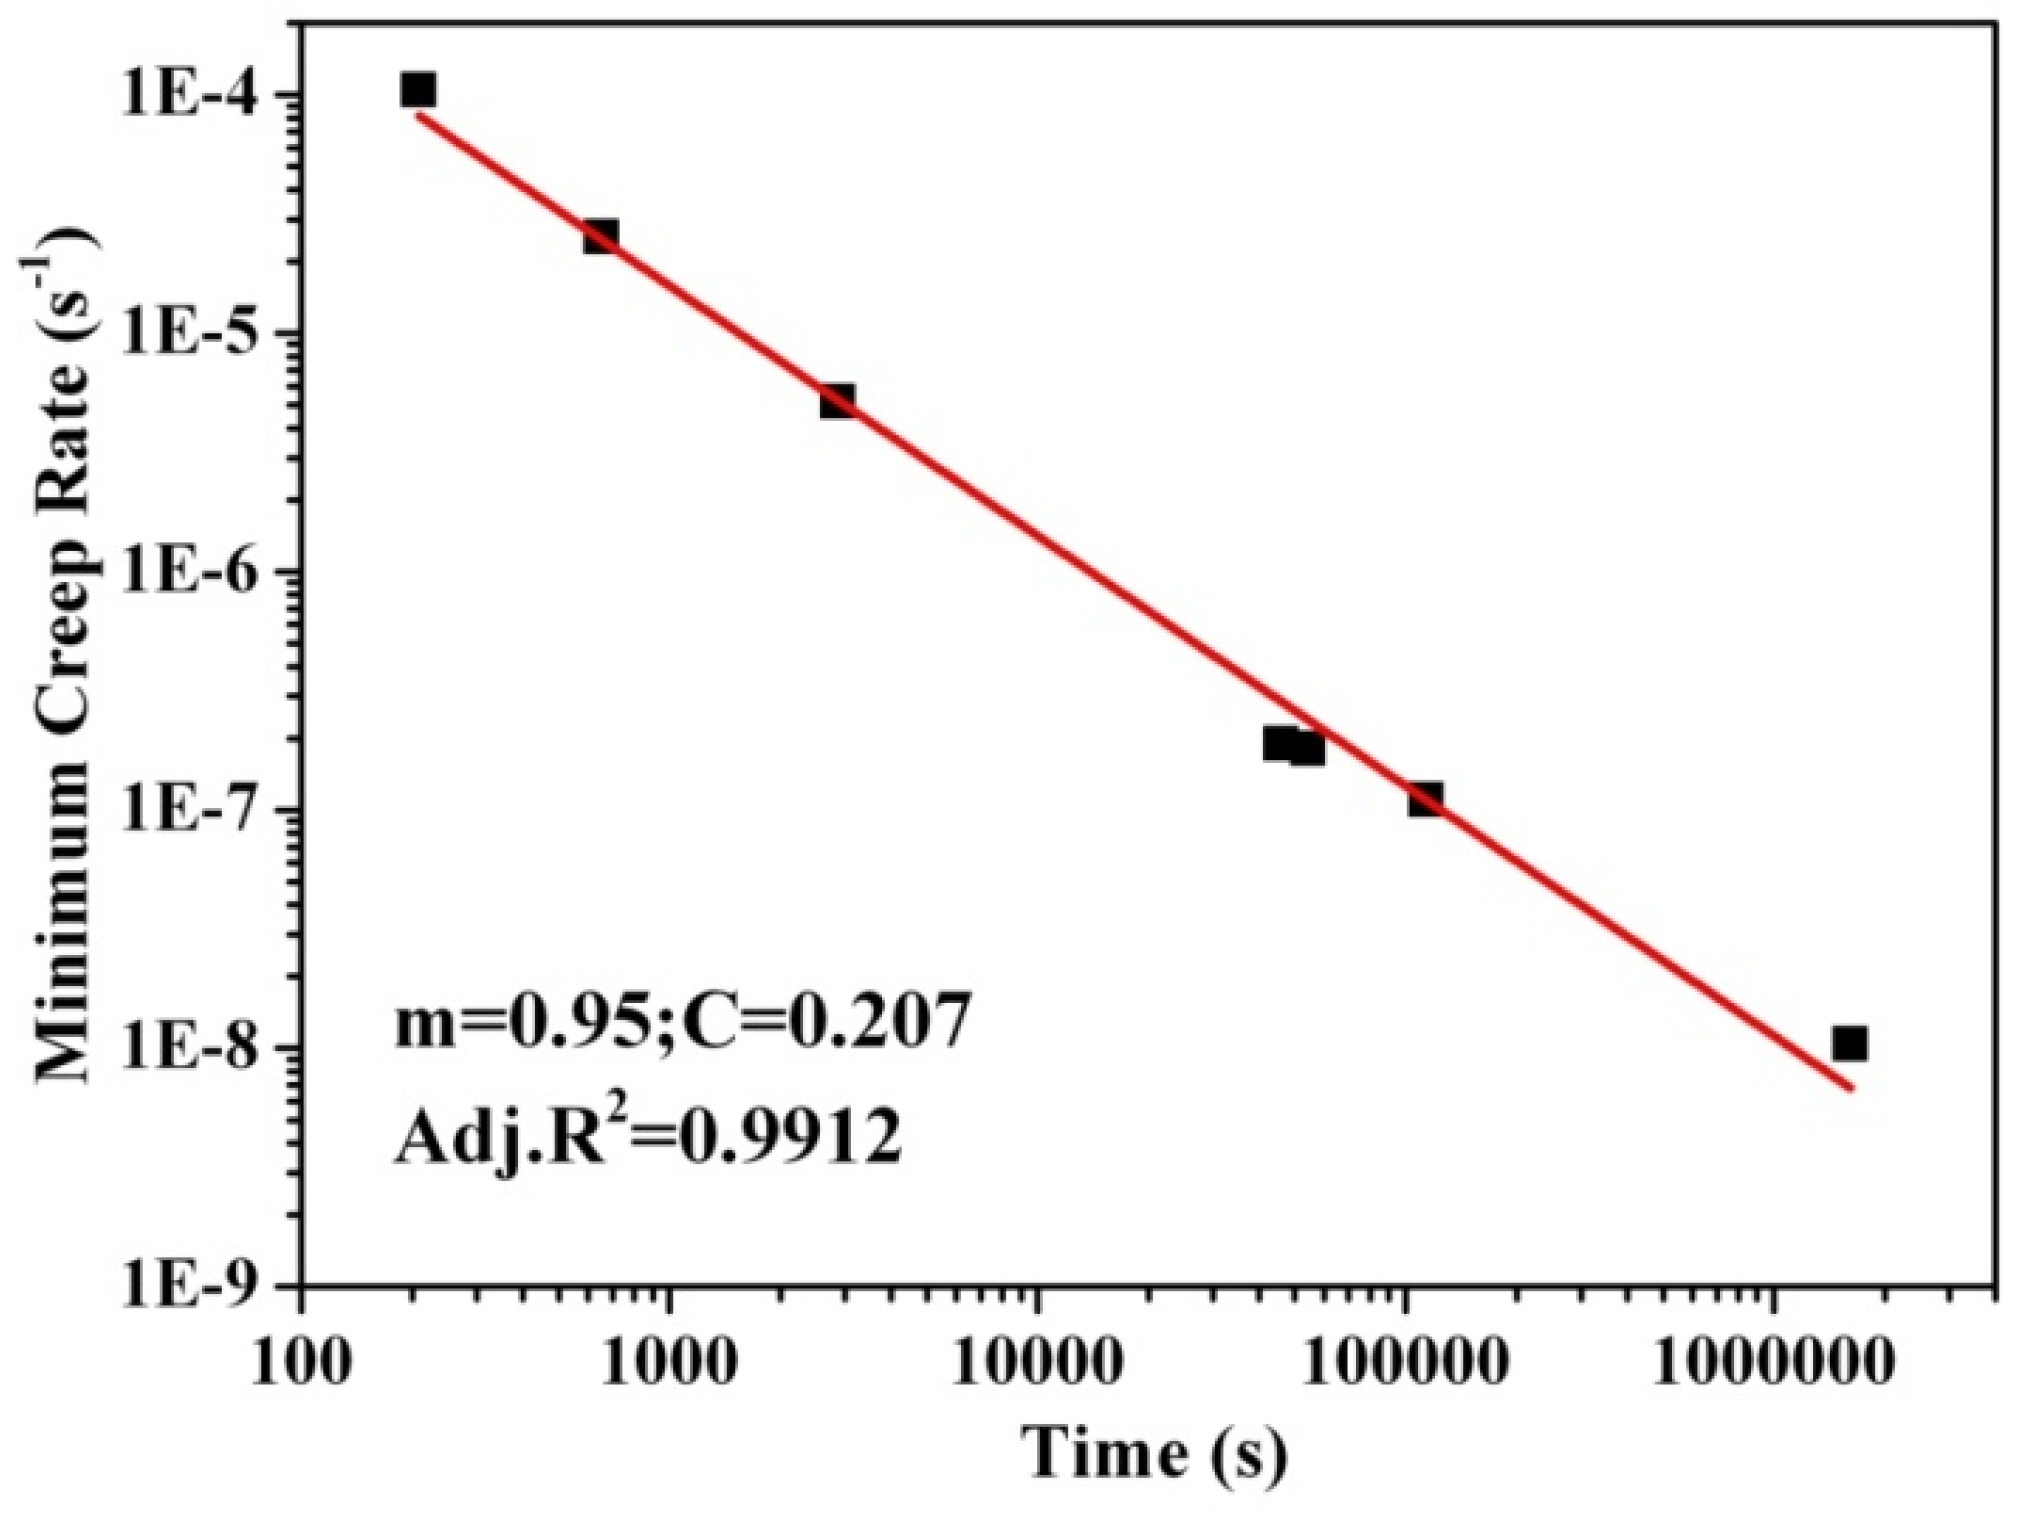
3.3. Creep Behavior before and after Thermal Exposure

The typical creep curve and creep-rate curve of the alloy are displayed in Figure 9. The creep rate decreased sharply in the first stage as a result of the work-hardening phenomenon. The creep stage where work hardening and dynamic recovery were in equilibrium was called the second stage of creep. The main feature of this stage was that the creep rate was constant and minimum. The creep rate of the material increased rapidly until fracturing, called the accelerated creep stage.
The minimum creep rates of the alloys at different states are presented in Table 2. As shown in Table 2, the minimum creep rates of the as-cast and thermally exposed alloys were similar at 250 °C. However, the minimum creep rate increased by almost an order of magnitude when the creep stress increased from 20 MPa to 28 MPa at the same temperature.
Table 2 also displays the minimum creep rate of the alloy after thermal exposure at 250 °C for 200 h. At 20 MPa/250 °C, the minimum creep rate of the alloy was around 10−9·s−1. However, the minimum creep rate of the alloy under the same conditions was lower than the minimum creep rate of the as-cast state, indicating that the creep resistance of the alloy at a low temperature was slightly improved after the thermal exposure. Compared with the minimum creep rate of the as-cast alloy, the minimum creep rate of the thermal exposed alloy was increased by an order of magnitude, in which the creep stress increased from 20 MPa to 28 MPa. Therefore, the creep resistance of the alloy significantly deteriorated.
The creep fracture morphology of the alloy at 20 MPa and 28 MPa is displayed in Figure 10. In contrast with Figure 10a, the quantity of dimples in Figure 10b significantly decreases. Apparently, Figure 10b has almost no dimples and a large area of cleavage planes.
Owing to the interactions of dislocation creating long-range stress fields in the alloy, the dislocations relied on shear stress to overcome these stress fields and move. Hence, the alloy with the higher applied stress load had a faster creep rate and worse creep resistance. The applied load condition of 28 MPa offered a larger shear stress, which provided more possibilities for the dislocation of the alloy. The larger applied load made the high-strength, hard and brittle phase more prone to brittle fracture, and the α-Al was less stressed. The large-scale precipitates had already initiated cracks and led to cracking when plastic deformation occurred, so a mass of dimples formed after plastic deformation, which is observable in Figure 10a but not in Figure 10b. Under the interaction of the stress field and high temperature, the strengthening phases shown in Figure 10b became globular more rapidly than those shown in Figure 10a, and the ability to deform was also decreased, which is explained by the phenomenon of a large-area cleavage surface occurring and no dimples forming after fracturing.
With 20 MPa of applied stress loaded, dislocation was hindered as a result of less shear stress distribution, and the tendency of stress concentration was less. The forces distributed in the α-Al and strengthening phase were relatively balanced. Compared with 28 MPa, the coarsening rate of the strengthening phase was lower with the combined action of the small stress field and temperature. The deformation performance declined slowly, and the strengthening phase reached the stress limit only after the plastic deformation of the α-Al produced cracks, manifesting as plenty of dimples and the cleavage surface being small. This could explain why the creep resistance deteriorated signally with the creep stress increasing from 20 MPa to 28 MPa at the same creep temperature.
The minimum creep rate and creep stress of materials are closely related to the creep temperature, and their corresponding relationship is expressed by the classical power law Equation (2) [16]:
ε ˙ = A · σ n · exp Q R T
where ε ˙ is the minimum creep rate, A is the materials constant, σ is the creep stress, R is the gas constant (R = 8.31 J/mol), T is the absolute temperature, n is the creep stress exponent, and Q is the creep activation energy. Stress exponent n and activation energy Q are often used to infer the creep mechanism of alloys. The creep mechanism corresponding to stress exponent n and activation energy Q are summarized simply as follows: When the grain-boundary creep n ≤ 2, which is divided into grain-boundary diffusion and grain-boundary slip, the creep activation energy Q corresponding to this creep mechanism is 82 kJ/mol. When N ≈ 3, this indicates the dislocation slip mechanism. When n is 4–6, this indicates a dislocation climbing mechanism, and the minimum creep rate is related to the diffusion of vacancy.
Using Equation (2), the creep stress exponent of the alloy at different temperatures was obtained. Figure 11 displays that the creep stress exponent of the as-cast alloy was about 1–2, and it is speculated that the creep mechanism of the material under this creep condition was grain-boundary creep. After thermal exposure at 250 °C for 200 h, the creep stress exponent of the alloy at 250 °C was 1.54, so the creep mechanism was grain-boundary creep.
With the condition of invariable stress, the creep activation energy of the material at a temperature of 250 °C was obtained by changing the creep temperature; the result is shown in Figure 11b. Figure 11b displays that the creep activation energy of the alloy at 250 °C is 83.1 kJ/mol, which is very close to the theoretical grain-boundary diffusion activation energy of 82 kJ/mol. It also illustrates that the creep mechanism of the Al-Si-Cu-Ni-Mg alloy at 250 °C is grain-boundary creep.
After the steady-state creep, the accelerated creep stage occurred until the final failure of the material. The Monkman–Grant model is the most widely used among many material creep failure prediction models, which are summarized as the following Equation (3):
t r · ε ˙ m i n m = C
where t r is the creep life, ε ˙ min is the minimum creep rate, and m and C are both material constants. In order to further understand the influence of material constants m and C on the creep life of the material, let the minimum creep rate = 1.10 × 10⁻⁸ s−1, and the results of the influence of the material constants m and C on the creep life are presented in Figure 12.
As shown in Figure 12, under the condition of constant m, creep life and material constant C increase linearly, and the increase is inconspicuous, while under the condition of constant C, creep life and material constant m increase exponentially, and the closer the m value is to 1, the more obvious its effect on creep life is.
The fitting results are displayed in Figure 13, showing that the data fitting degree is as high as 99.12%, and the material constant m is also close to 1, indicating the good creep resistance of the material to a certain extent. The Monkman–Grant Equation (4) is written as follows:
t r · ε ˙ m i n 0.95 = 0.207
From Equation (4), it was calculated that for the creep life to reach 1000 h, the minimum creep rate should be lower than 2.4 × 10⁻⁸ s−1. The relationship between the specific creep life and the corresponding minimum creep rate limit value are shown in Table 3.

4. Conclusions

The effect of thermal exposure on the mechanical properties of Al-Si-Cu-Ni-Mg aluminum alloy has been investigated in the present work. The main conclusions of this work are summarized as follows:
  • The main phases at the micro scale of the Al-Si-Cu-Ni-Mg alloy were stable during thermal exposure at 250 °C.
  • The UTS of the studied alloys decreased greatly in the initial stage and then basically tended to be stable after thermal exposure at 250 °C for about 100 h.
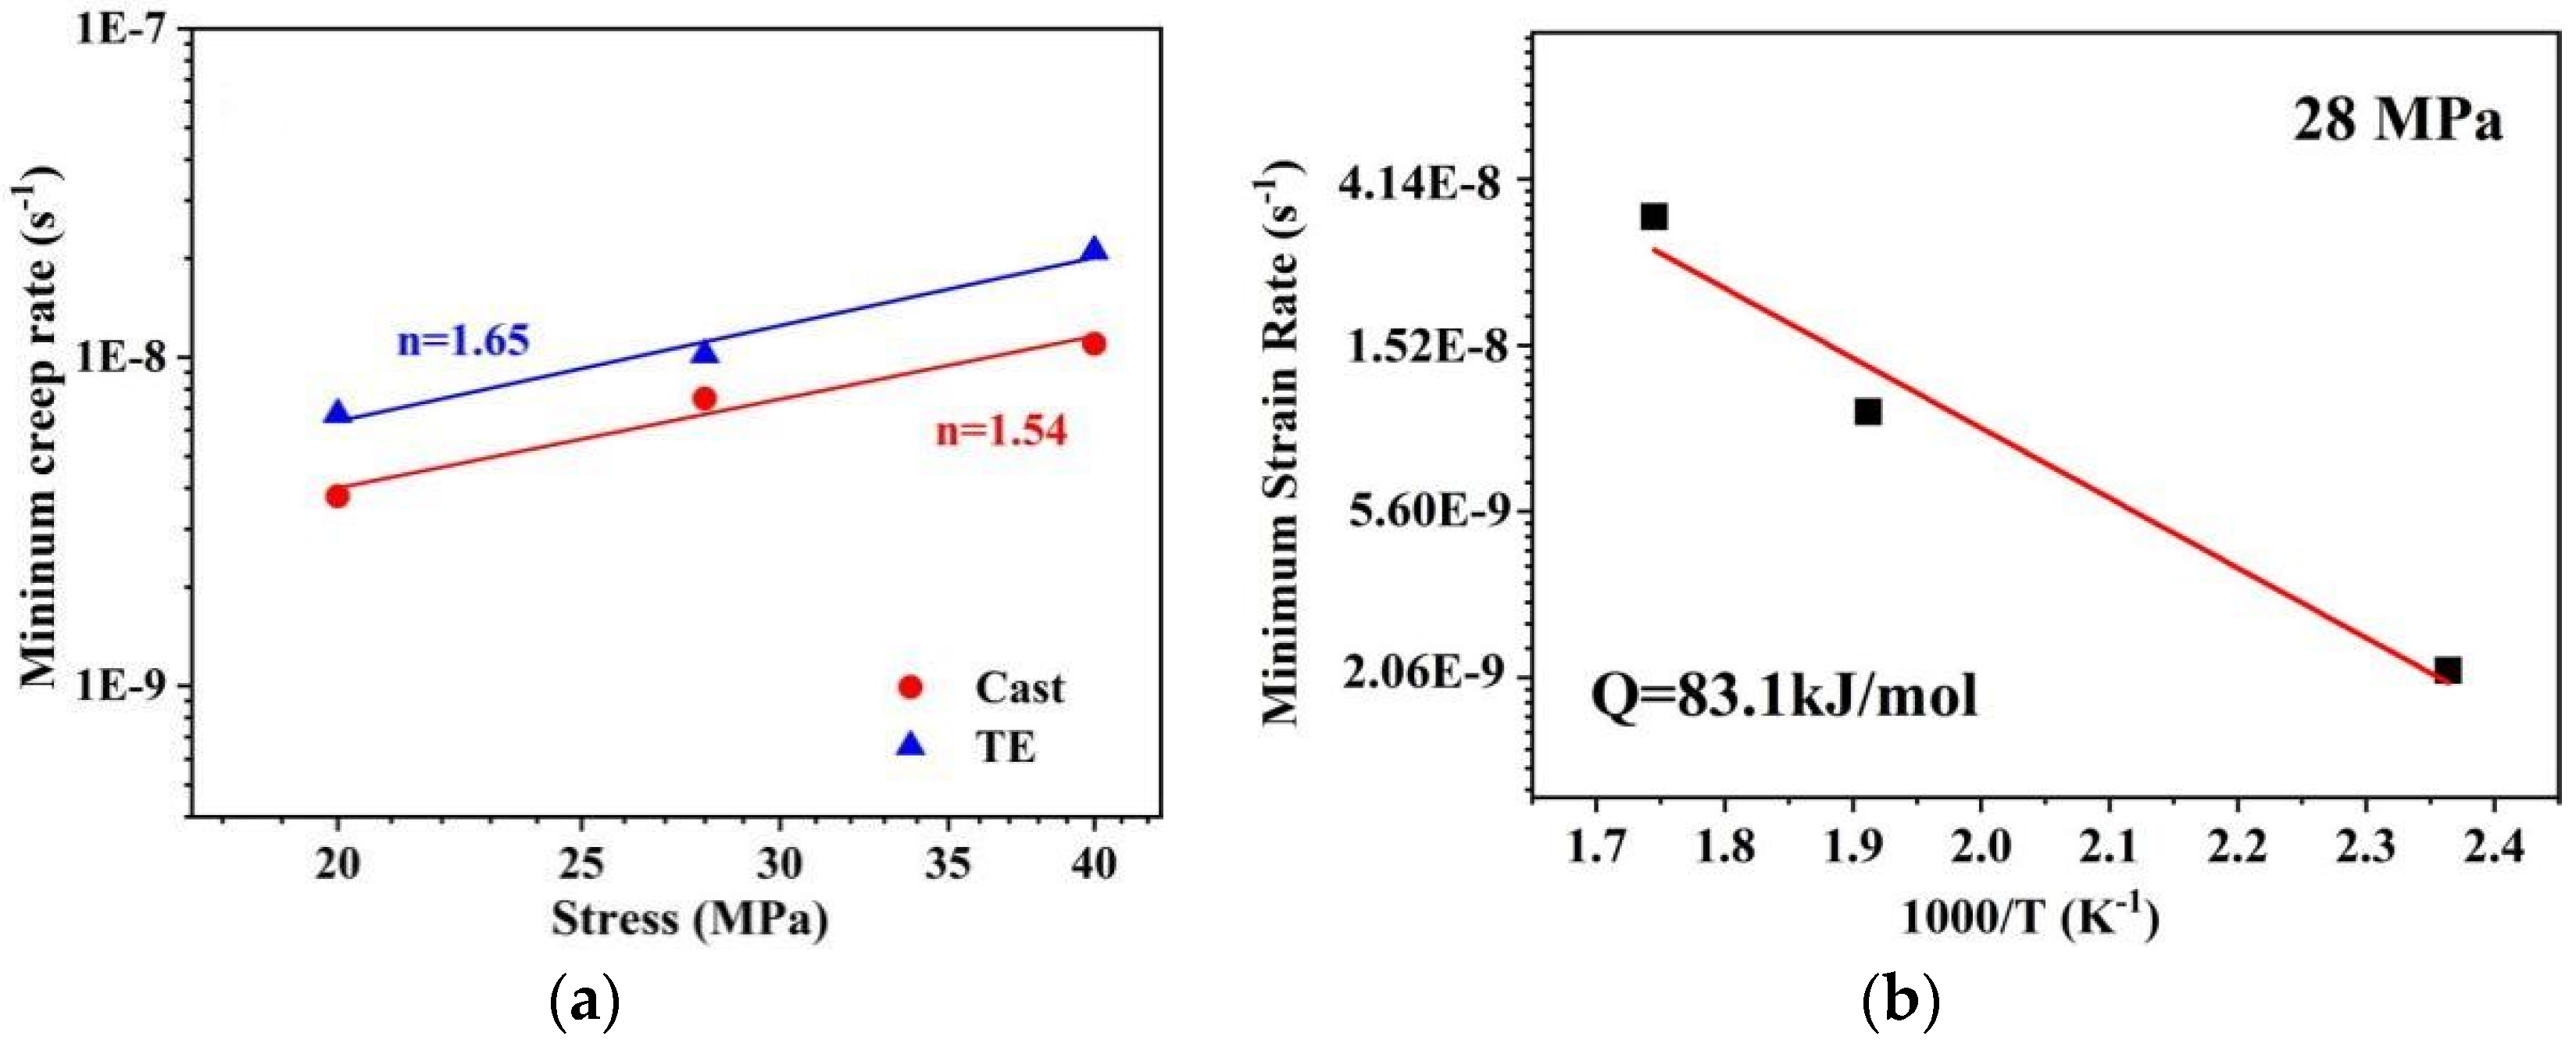
  • The creep resistance deteriorated signally when the creep stress was increased from 20 MPa to 28 MPa at the same creep temperature.
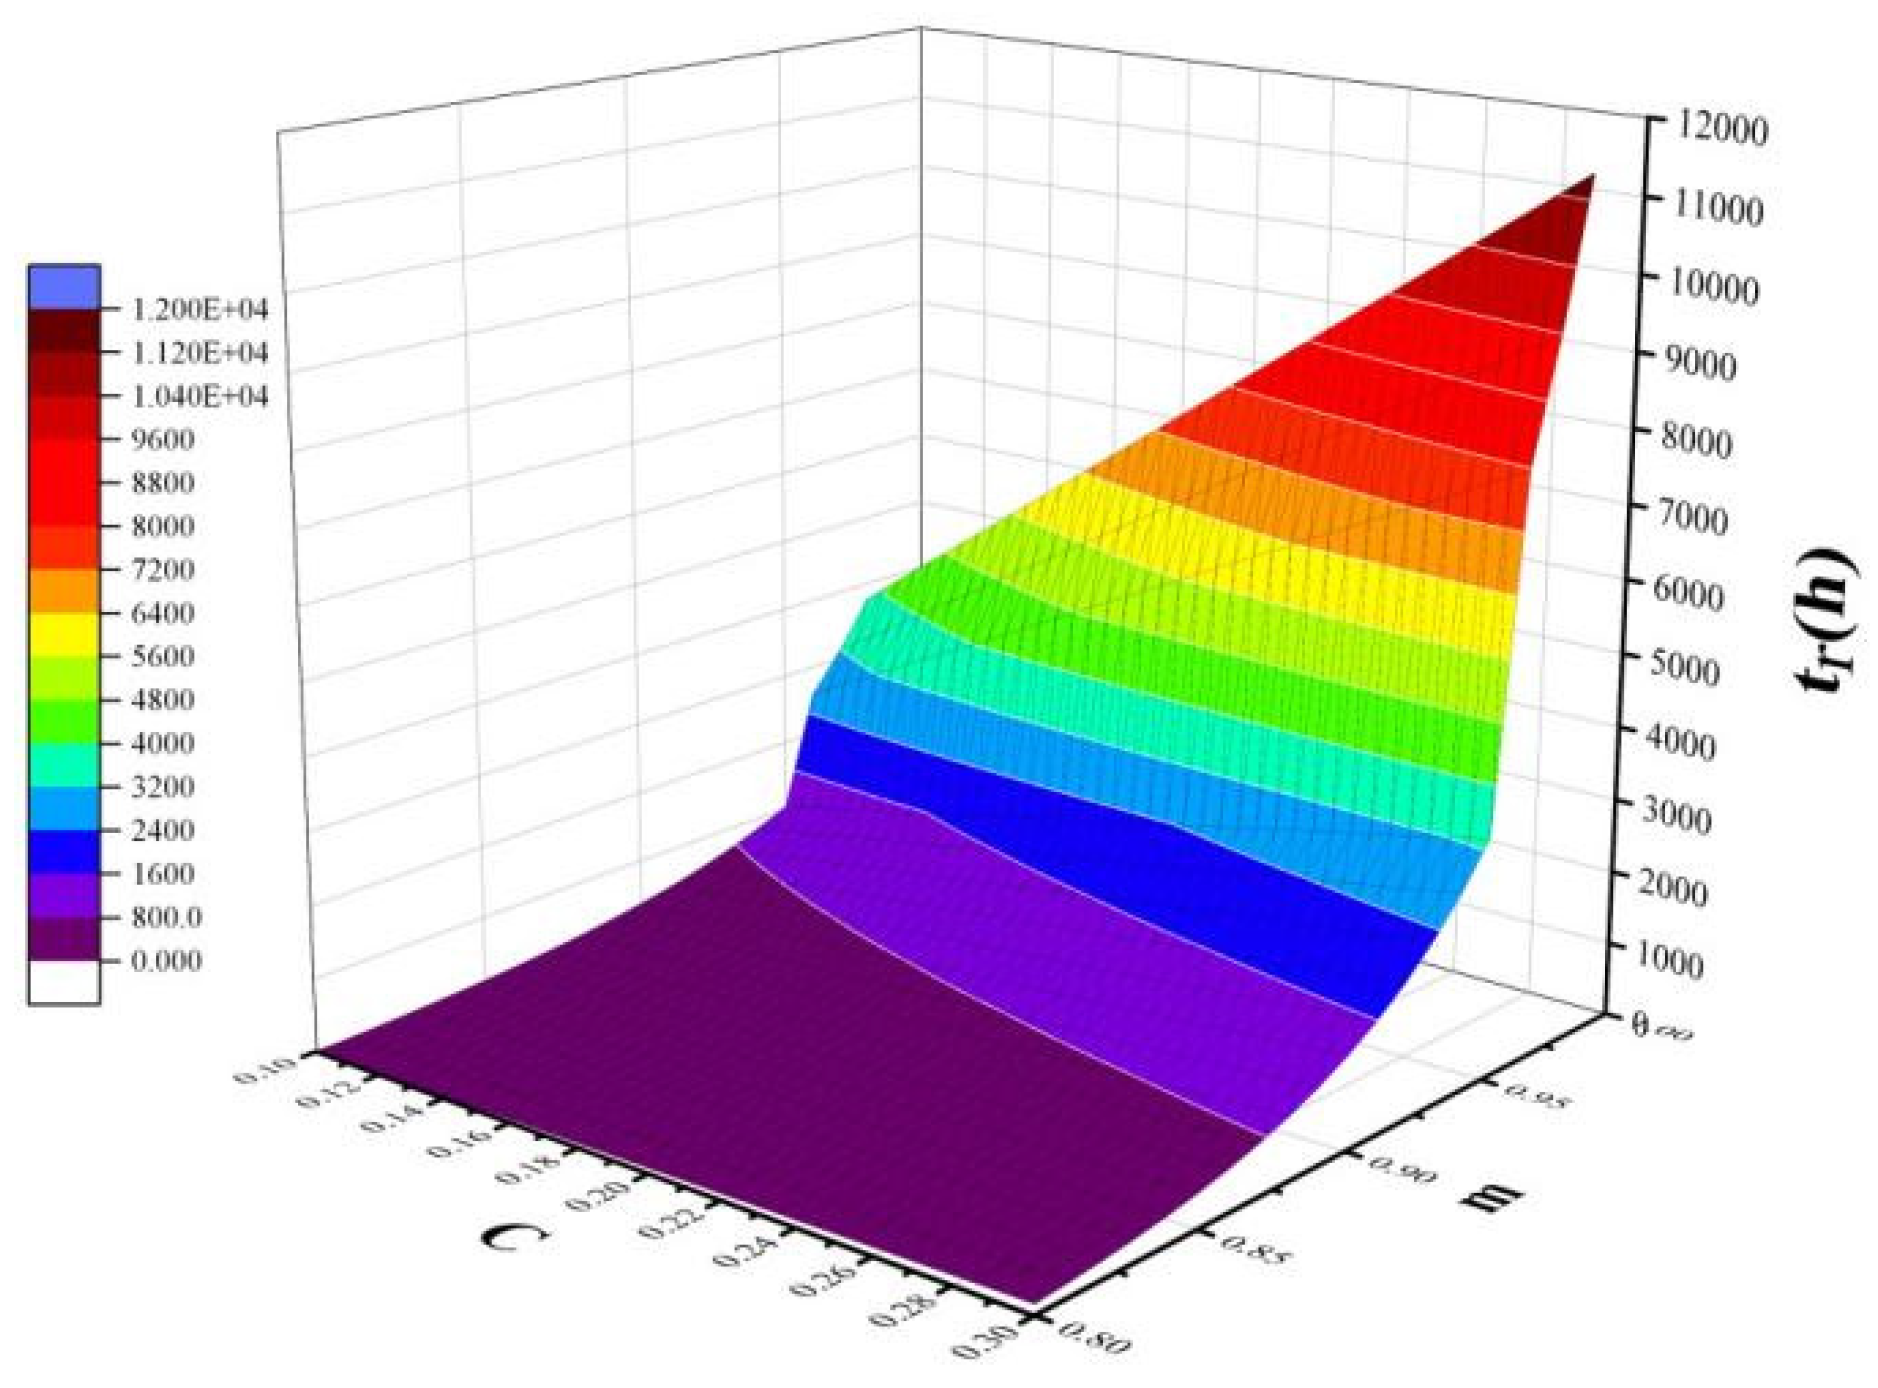
  • The main creep mechanism of the as-cast Al-Si-Cu-Ni-Mg alloy at a low temperature and low stress (T ≤ 250 °C; σ ≤ 40 MPa) was grain-boundary creep. The Monkman–Grant empirical formula was used to fit the relationship between the creep life and the minimum creep rate of the cast Al-Si-Cu-Ni-Mg alloy, and the fitting results were: t r · ε ˙ m i n 0.95 = 0.207 .

Author Contributions

Conceptualization, F.C.; methodology, C.L.; software, L.Z.; validation, Z.W.; formal analysis, Y.H.; investigation, K.D.; resources, Z.W.; data curation, L.Z.; writing—original draft preparation, G.L.; writing—review and editing, F.C.; visualization, W.H.; supervision, L.Z.; project administration, L.Z.; funding acquisition, Y.H. All authors have read and agreed to the published version of the manuscript.

Funding

This research was funded by the Natural Science Foundation of the Jiangsu Higher Education Institutions of China (Grant No. 20KJB430015) and the Natural Science Foundation of Jiangsu Province (Grant No. BK20201467).

Data Availability Statement

Not applicable.

Acknowledgments

This work was supported by the Natural Science Foundation of the Jiangsu Higher Education Institutions of China (Grant No. 20KJB430015). This work was supported by the Natural Science Foundation of Jiangsu Province (Grant No. BK20201467).

Conflicts of Interest

The authors declare no conflict of interest.

References

  1. Mikhaylovskaya, A.V.; Kishchik, A.A.; Tabachkova, N.Y.; Kotov, A.D.; Cheverikin, V.V.; Bazlov, A.I. Microstructural Characterization and Tensile Properties of Al-Mg-Fe-Ce Alloy at Room and Elevated Temperatures. JOM 2020, 72, 1619–1626. [Google Scholar] [CrossRef]
  2. Hu, K.; Xu, Q.; Ma, X.; Sun, Q.; Gao, T.; Liu, X. A novel heat-resistant Al-Si-Cu-Ni-Mg base material synergistically strengthened by Ni-rich intermetallics and nano-AlNp microskele-tons. Mater. Sci. Technol. 2019, 35, 306–312. [Google Scholar] [CrossRef]
  3. Mahmoud, E.R.; Shaharoun, A.; Gepreel, M.A.; Ebied, S. Microstructure and Mechanical Properties of Fe-Mn-Ni-Cr-Al-Si High Entropy Alloys. Metals 2022, 12, 1164. [Google Scholar] [CrossRef]
  4. Silva, C.; Barros, A.; Vida, T.; Garcia, A.; Cheung, N.; Reis, D.A.; Brito, C. Assessing Microstructure Tensile Properties Relationships in Al-7Si-Mg Alloys via Multiple Regression. Metals 2022, 12, 1040. [Google Scholar] [CrossRef]
  5. Zhang, J.; Feng, J.; Zuo, L.; Ye, B.; Kong, X.Y.; Jiang, H.; Ding, W. Effect of Sc microalloying addition on microstructure and mechanical properties of as-cast Al-12Si alloy. Mater. Sci. Eng. 2019, 766, 138343.1–138343.4. [Google Scholar] [CrossRef]
  6. Liu, H.Q.; Pang, J.C.; Wang, M.; Li, S.X.; Zhang, Z.F. Effect of temperature on the mechanical properties of Al-Si-Cu-Mg-Ni-Ce alloy. Mater. Sci. Eng. A 2021, 3, 141762. [Google Scholar] [CrossRef]
  7. Shlyaptseva, A.D.; Petrov, I.A.; Ryakhovsky, A.P.; Medvedeva, E.V.; Tcherdyntsev, V.V. Complex Structure Modification and Improvement of Properties of Aluminium Casting Alloys with Various Silicon Content. Metals 2021, 11, 1946. [Google Scholar] [CrossRef]
  8. Sui, Y.; Wang, Q.; Liu, T.; Ye, B.; Jiang, H.; Ding, W. Influence of Gd content on microstructure and mechanical properties of cast Al-12Si-4Cu-2Ni-0.8Mg alloys. J. Alloy. Compd. 2015, 622, 572–579. [Google Scholar] [CrossRef]
  9. Herve, E.; Dendievel, R.; Bonnet, G. Steady-state power-law creep in “inclusion matrix” composite materials. Acta Metall. 1995, 43, 4027–4034. [Google Scholar] [CrossRef] [Green Version]
  10. Zhang, J.; Fan, J.; Chen, L.; Li, Y. Compressive creep aging behavior and microstructure evolution in extruded Al-Mg-Si alloy under different temperature and stress levels. Mater. Today Commun. 2022, 33, 104722. [Google Scholar] [CrossRef]
  11. Zhao, B.; Ye, B.; Wang, L.; Bai, Y.; Yu, X.; Wang, Q.; Yang, W. Effect of ageing and thermal exposure on microstructure and mechanical properties of a HPDC Al–Si–Cu–Mg alloy. Mater. Sci. Eng. A 2022, 849, 143463. [Google Scholar] [CrossRef]
  12. Lin, B.; Li, H.; Xu, R.; Zhao, Y.; Xiao, H.; Tang, Z.; Li, S. Thermal exposure of Al-Si-Cu-Mn-Fe alloys and its contribution to high temperature mechanical properties. J. Mater. Res. Technol. 2020, 9, 1856–1865. [Google Scholar] [CrossRef]
  13. Yuan, J.; Wang, Q.; Yin, D.; Wang, H.; Chen, C.; Ye, B. Creep behavior of Mg-9Gd-1Y-0.5Zr (wt.%) alloy piston by squeeze casting. Mater. Charact. 2013, 78, 37–46. [Google Scholar] [CrossRef]
  14. Dong, Z.-Q.; Wang, J.-G.; Guan, Z.-P.; Ma, P.-K.; Zhao, P.; Li, Z.-J.; Lu, T.-S.; Yan, R.-F. Effect of Short T6 Heat Treatment on the Thermal Conductivity and Mechanical Properties of Different Casting Processes Al-Si-Mg-Cu Alloys. Metals 2021, 11, 1450. [Google Scholar] [CrossRef]
  15. Ning, Z.L.; Yi, J.Y.; Qian, M.; Sun, H.C.; Cao, F.Y.; Liu, H.H.; Sun, J.F. Microstructure and elevated temperature mechanical and creep properties of Mg-4Y-3Nd-0.5Zr alloy in the product form of a large structural casting. Mater. Des. 2014, 60, 218–225. [Google Scholar] [CrossRef]
  16. Zafar, H.; Khushaim, M.; Ravaux, F.; Anjum, D.H. Scale-Dependent Structure-Property Correlations of Precipitation-Hardened Aluminum Alloys: A Review. JOM 2022, 74, 361–380. [Google Scholar] [CrossRef]
  17. Kaja, S.S.T.; Gangadasari, P.R.; Ayyagari, K.P.R. Extending the Tolerance of Iron in Cast Al-Si Alloy. JOM 2021, 73, 2652–2657. [Google Scholar] [CrossRef]
  18. ISO 204:2009; Metallic Materials—Uninterrupted Materials Uniaxial Creep Testingin Tension—Method of Test. International Organization for Standardization: Geneva, Switzerland, 2009.
  19. Zuo, L.; Ye, B.; Feng, J.; Kong, X.; Jiang, H.; Ding, W. Effect of Q-Al5Cu2Mg8Si6 phase on mechanical properties of Al-Si-Cu-Mg alloy at elevated temperature. Mater. Sci. Eng. A 2017, 693, 26–32. [Google Scholar] [CrossRef]
Figure 1. The geometric dimensions of tensile creep samples [18].
Crystals 13 00236 g001
Figure 2. The tension creep testing setup.
Crystals 13 00236 g002
Figure 3. Microstructure of Al-Si-Cu-Ni-Mg alloy under (a) metallography and (b) scanning electron microscopy.
Crystals 13 00236 g003
Figure 4. SEM morphology of as-cast Al-Si-Cu-Ni-Mg alloy and distribution of alloy constituent elements.
Crystals 13 00236 g004
Figure 5. SEM morphology of thermally exposed Al-Si-Cu-Ni-Mg alloy and the distribution of alloy constituent element.
Crystals 13 00236 g005
Figure 6. The typical stress–strain curves of Al-Si-Cu-Ni-Mg alloy under different conditions measured at 250 °C (TE represents thermal exposure at 250 °C for 200 h).
Crystals 13 00236 g006
Figure 7. Tensile properties of the Al-Si-Cu-Ni-Mg alloy measured at different states (TE represents thermal exposure at 250 °C for 200 h).
Crystals 13 00236 g007
Figure 8. The ultimate tensile strength of the Al-Si-Cu-Ni-Mg alloy at room temperature fitted with exposure time at 250 °C for different times.
Crystals 13 00236 g008
Figure 9. Typical creep curve (a) and creep-rate curve (b) of Al-Si-Cu-Ni-Mg alloy.
Crystals 13 00236 g009
Figure 10. The creep fracture morphology of Al-Si-Cu-Ni-Mg alloy at (a) 20 MPa/250 °C and (b) 28 MPa/250 °C.
Crystals 13 00236 g010
Figure 11. Al-Si-Cu-Ni-Mg alloy (a) creep stress exponent and (b) creep activation energy (TE represents thermal exposure at 250 °C for 200 h).
Crystals 13 00236 g011
Figure 12. The influence of C and m constants in the Monkman–Grant model on the fracture life under the condition of constant minimum creep rate.
Crystals 13 00236 g012
Figure 13. Monkman–Grant fitting of creep life of Al-Si-Cu-Ni-Mg alloy.
Crystals 13 00236 g013
Table 1. Composition of cast Al-Si-Cu-Ni-Mg alloy.
ElementsSiCuNiMgMnZnTiFeCeAl
wt. %12.343.811.970.790.530.260.230.180.23Bal
Table 2. Part of the minimum creep rate of Al-Si-Cu-Ni-Mg alloy before and after heat exposure under different creep conditions.
Alloy StateTemperatureCreep Rate (s−1)
20 MPa28 MPa
As-cast alloy250 °C6.69 × 10−91.02 × 10⁻⁸
Thermal exposed alloy250 °C3.78 × 10−91.10 × 10⁻⁸
Table 3. Correspondence table of creep life and minimum creep rate.
t r  (h)101001000
ε ˙  (s−1)3.0 × 10−62.7 × 10−72.4 × 10⁻⁸
Disclaimer/Publisher’s Note: The statements, opinions and data contained in all publications are solely those of the individual author(s) and contributor(s) and not of MDPI and/or the editor(s). MDPI and/or the editor(s) disclaim responsibility for any injury to people or property resulting from any ideas, methods, instructions or products referred to in the content.

