Abstract
Among the emerging photovoltaic technologies, perovskite solar cells (PSCs) are the most promising ones with efficiencies close to crystalline silicon. However, stability and reliability issues are still a limit for future applications of this technology. This manuscript investigates the intrinsic instability of PSCs by focusing on the role of the hole-blocking layer (HBL). PSCs were fabricated employing SnOX and bathocuproine (BCP) as an HBL, and their performances were monitored in time. The two architectures show initial similar performances; hence, they are good candidates for comparison, but they feature different instability phenomena. It is shown that cells fabricated with SnOX present larger instabilities mainly ascribable to open-circuit voltage fluctuations (variations in the short-circuit current are negligible). In contrast, the BCP-based cells are more stable with a marginal increase in their power conversion efficiency that follows the increase in the short-circuit current (while the open-circuit voltage does not change).
1. Introduction
With a record efficiency above 25% [1], perovskite solar cells (PSCs) are the most interesting photovoltaic technology [2]. The combination of power conversion efficiency, which are comparable to the state-of-the-art monocrystalline silicon cells, with low-cost materials and processes makes PSCs a strategic technology with a potentiality of reaching the Shockley–Queisser limit (e.g., tandem configuration) [3].
Despite their outstanding performances, PSCs still suffer from short- and long-term instability affecting characterization reproducibility [4,5] and measurement-induce degradation [6]. In this scenario, the choice of the proper hole-blocking layer (HBL) plays a crucial role, not only to achieve high power conversion efficiencies but also to enhance the device stability [7,8].
Among several HBL materials, TiO2 is one of the most common materials used in PSCs thanks to the proper energetic levels, allowing for the fabrication of high-efficiency cells [9,10]. However, the performance of TiO2-based cells is still limited by the low TiO2 n-type conductivity (electron transport layer) and the overall device stability. For this reason, alternative HBL materials were investigated [11,12]. Many alternatives have been proposed to overcome this limitation, such as doping the TiO2 layer with Sn or Na2S [13,14], or substituting TiO2 with other metal oxide materials [15]. Among the others, and are two commonly adopted solutions used in substitution of TiO2 (for a comprehensive review, the reader may refer to [16,17]). can provide improved efficiency thanks to a higher electron mobility as well as stability by preventing perovskite contamination and phase separation [18]. Moreover, in this configuration, can act as a barrier layer for the sputtered ITO to further improve the stability of the device [19]; whereas, bathocuproine () is used to improve a devices performance by eliminating the charge accumulation and by reducing interface recombination [20].
In this work, we analyzed and by fabricating PSCs differing only in the HBL and comparing the intrinsic stability of the devices by monitoring the cells parameters over time, which is a priority in order to understand a device’s behavior during characterization and reliability studies. We observed that even though the two architectures are characterized by similar figures of merit, using as a HBL allows for a larger current conversion efficiency and an improved device stability.
2. Materials and Methods
2.1. Materials
The following were use in this study: poly[bis(4-phenyl)(2,4,6-trimethylphenyl)amine] (PTAA) (Solaris Chem), [6,6]-phenyl-C61-butyric acid methyl ester (PCBM-99%-Solenne), bathocuproine (-96%-Sigma-Aldrich), ink (N31-Avantama), methylammonium bromide (MABr-99.99%-Greatcell solar), (FAI-99.99%-Greatcell solar), cesium iodide (CsI-99.99%-Sigma-Aldrich), lead bromide (PbBr2-TCI), lead iodide (PbI2-TCI), 1-butyl-3-methylimidazolium tetrafluoroborate (BMITFB-98%-ACROS), dimethylformamide (DMF-anhydrous-Sigma-Aldrich), dimethyl sulfide (DMSO-anhydrous-Sigma-Aldrich), toluene (anhydrous-Sigma-Aldrich), chlorobenzene (CB-anhydrous-Sigma-Aldrich), and dichlorobenzene (DCB-anhydrous-Sigma-Aldrich).
2.2. Devices Fabrication
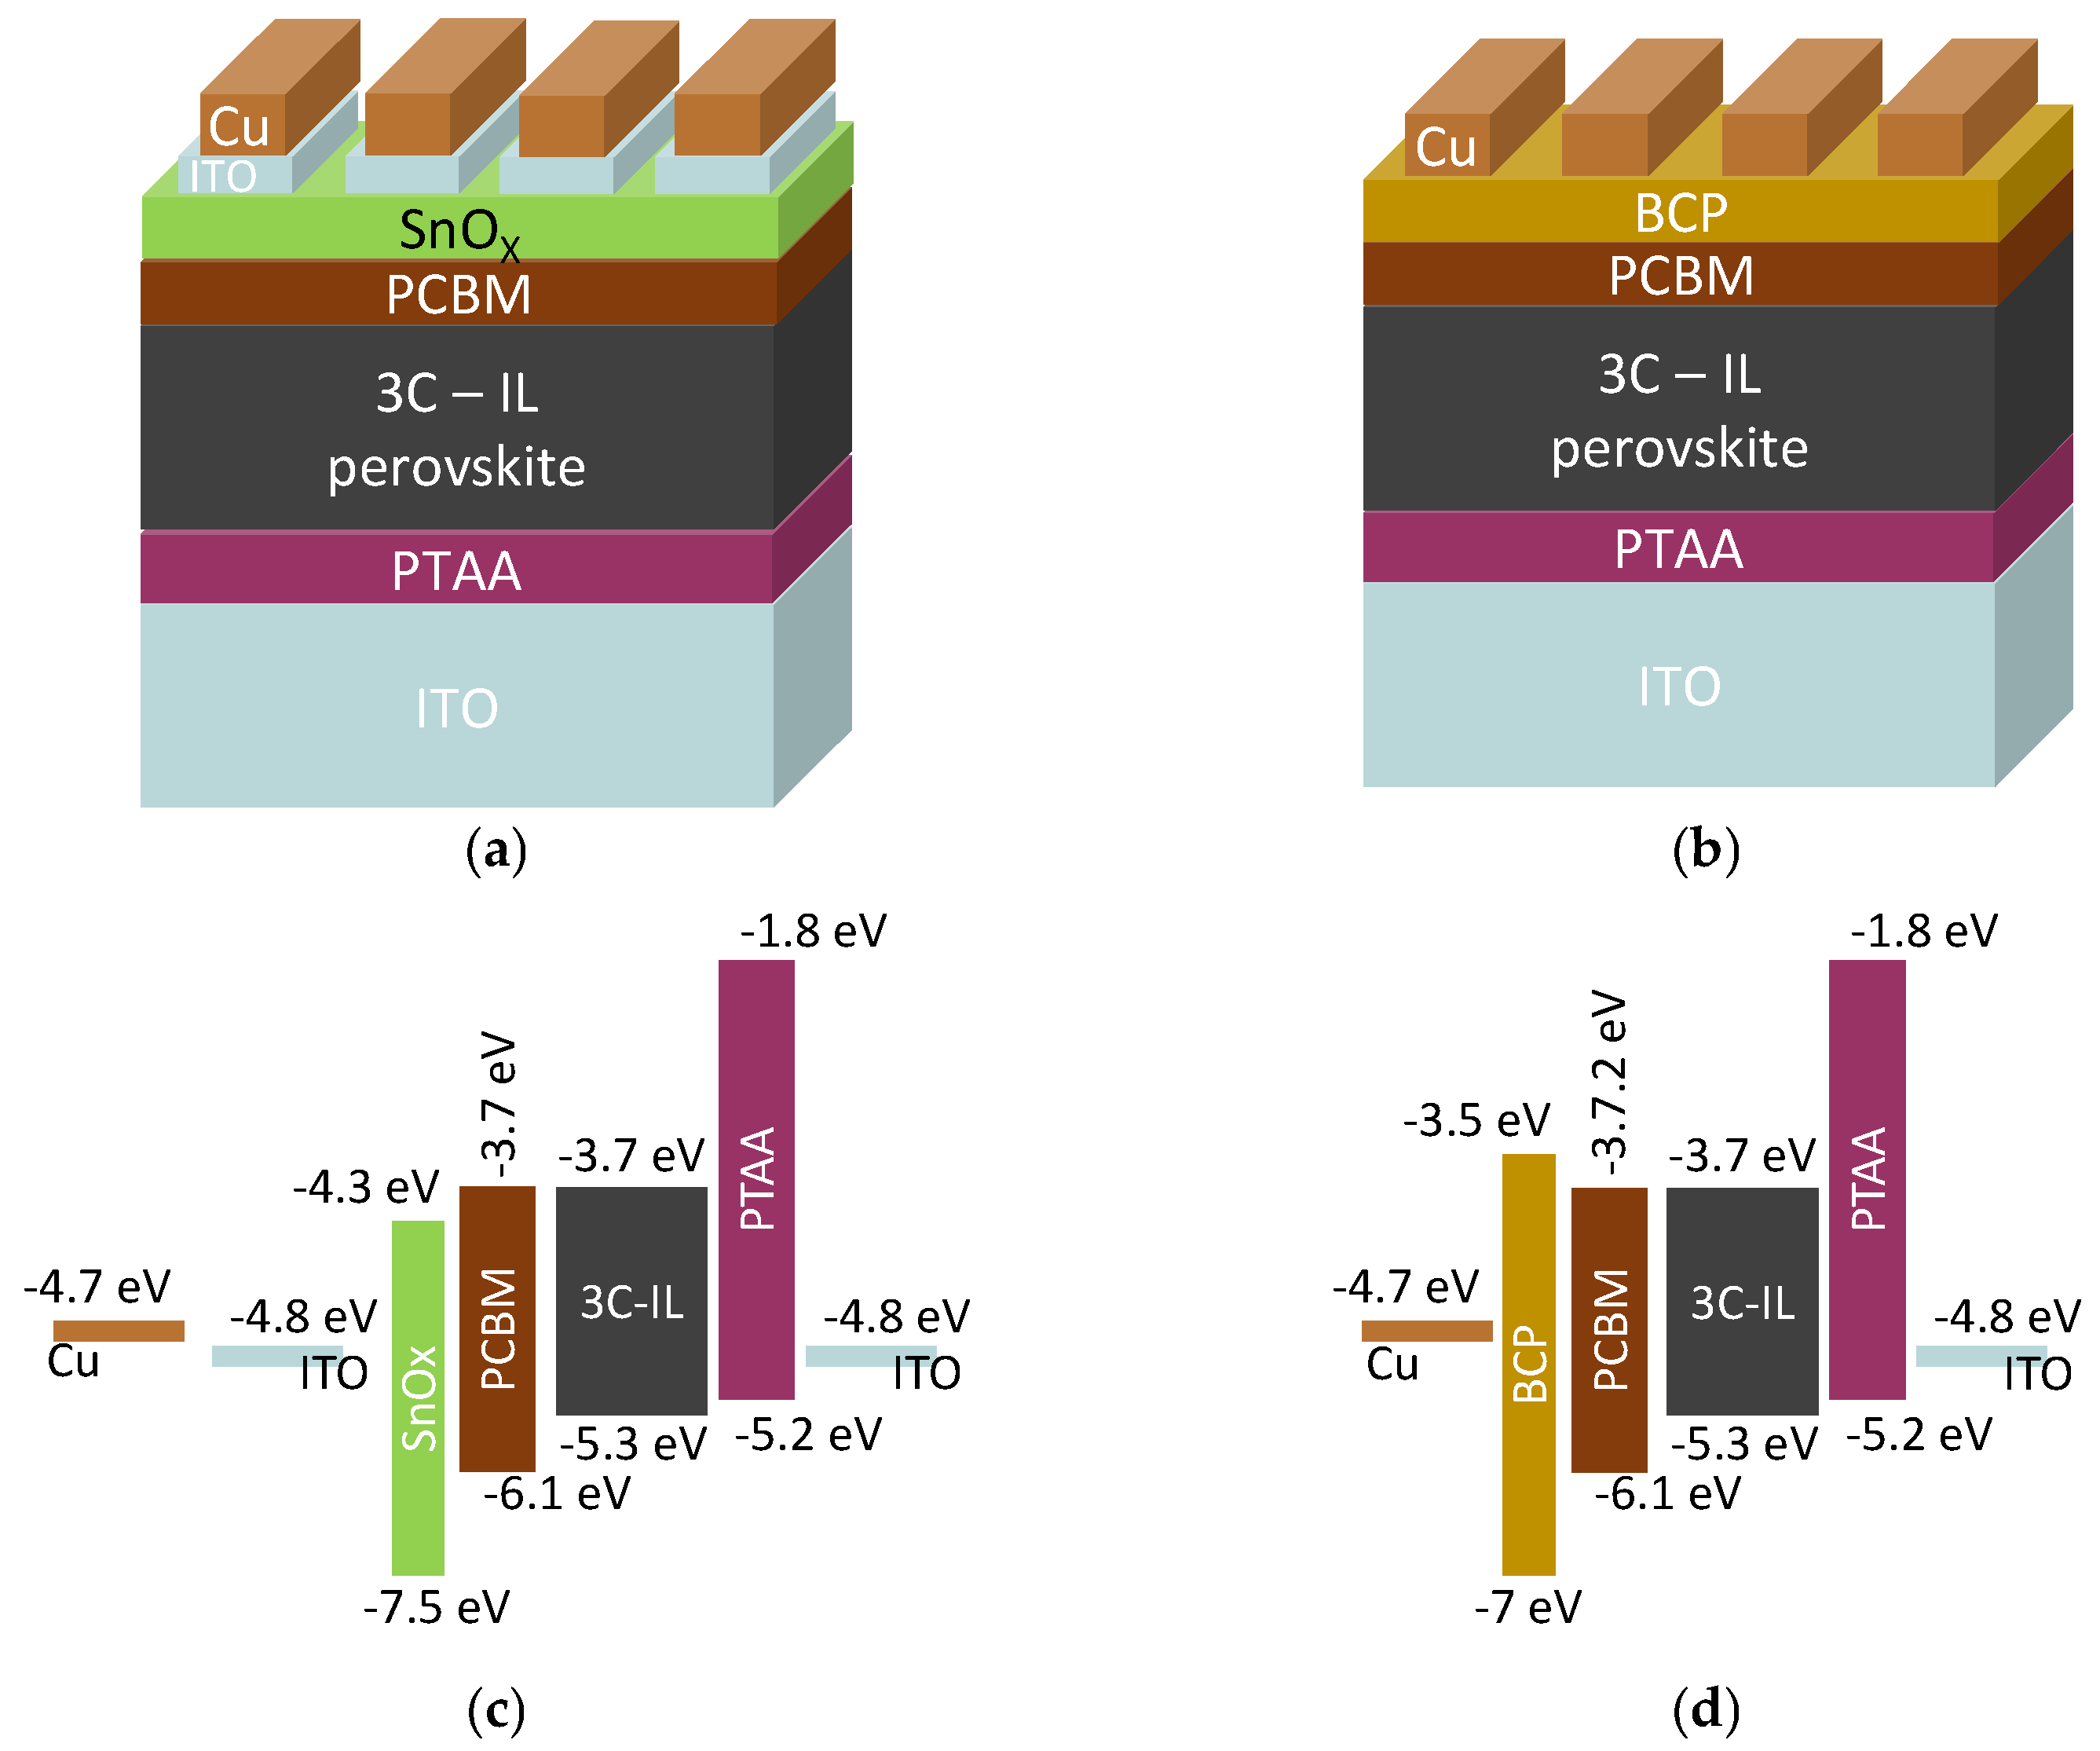
Figure 1 reports the devices architecture and band diagram for both the -based PSCs (Figure 1a,c) and the -based PSCs (Figure 1b,d). The ITO/glass substrates (15 Ω/sq, 2.5 × 2.5 cm2) were etched using a UV nanosecond laser (Spectraphysics—Andover, MA, USA). The ablation was carried out from the top side of the substrate at a repetition rate of 80 kHz, with a scanning speed of 195 mm s−1. The optimal fluence per pulse (amount of energy of a single laser pulse divided for the area of the laser spot) was 280 mJ cm−1. The measured insulation resistance between the subsequent photo-anodes was higher than the detection limit of our instrument (Keithley 2420, >200 MΩ), providing a full isolation. The patterned substrates were cleaned in an ultrasonic bath with a detergent solution (2% Hellmanex in deionized water) followed by deionized water, acetone, and 2-propanol, each for 15 min. After drying, they were treated for 15 min in a UV/O3 tool (Novasonic). PTAA (2 mg/mL) in toluene was spun at 5000 rpm for 30 s before being annealed at 100 °C for 10 min. After cooling, the samples were exposed to UV light for 5 min to improve the surface wettability of the PTAA. The solar cells active material is a triple cation (3C) perovskite with BMIM-BF4 as an ionic liquid (IL) additive. The perovskite precursor with the molecular formula Cs0.05MA0.14FA0.81PbI2.7Br0.3 (1.4M) in DMF:DMSO 3.16:1 was spin-coated at 4000 rpm for 35 s before dropping 180 μL of CB after 20 s [19,21]. The film was annealed for 10 min at 100 °C. The PCBM was spun at 1700 rpm for 30 s before being annealed at 100 °C for 5 min. The (0.5 mg/mL) in isopropanol was spun at 4000 rpm for 30 s. Following that, 100 nm of Cu was evaporated defining the cell active area of 0.18 cm2. For -based devices, nanoparticle dispersions (2.5 wt% suspension in butanol, acquired from Avantama AG) were filtered with a PVDF 0.45 m filter and spun at 5000 rpm for 35 s before being annealed at 120 °C for 20 min. After that, the devices were sputtered with ITO in the Kenosistic (KS400) sputtering machine with a tin-doped indium oxide target (304.8 mm × 76.2 mm, 90% In2O3–10% ) using a low-temperature RF magnetron sputtering with a base pressure of 5·10−6 mbar, a working pressure of 1.1 μbar, a power density of 0.258 W·cm−2, and a precursor argon flow at 40 sccm. The samples were placed onto a pallet and moved parallel to the target at a speed of 120 cm/min. Following this, 100 nm of copper was evaporated to finish the cells, which have an active area of 0.24 cm2.
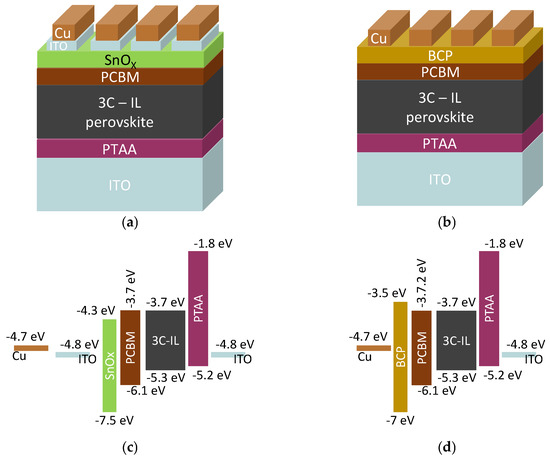
Figure 1.
Architecture of the solar cells used in this work: These perovskite solar cells are based on a triple cation perovskite layer with nominal composition Cs0.05FA0.81MA0.14PbI2.7Br0.3 along with BMIM-BF4 ionic liquid additives, labeled as 3C-IL (a) is used as a hole-blocking layer; (b) is used as a hole-blocking layer; (c) and (d) are the qualitative band diagram for the and architectures, respectively.
To collect enough data to model the solar cells intrinsic instability, we prepared 9 -based cells and 11 -based cells. To prevent cell degradation due to the exposure of oxygen and ambient humidity, all the samples were encapsulated in a nitrogen atmosphere using a capping glass glued to the ITO/glass substrate.
2.3. Characterization Procedure
To monitor their stability over time, the cells were periodically characterized in light conditions by scanning the voltage from 0 V to 1.2 V while recording their photo-generated current. During the measurements the cells were illuminated using a white LED whose intensity was calibrated in agreement with the International Electrochemical Commission standard IEC 60904-7-2019 [22].
The cell characterization was performed in a logarithmic time scale for a total time of 105 s (we observed that the parameters of most of the cells stabilize within this time). The cells were kept in dark conditions between consecutive characterizations. All the experiments were performed in an ambient atmosphere at a room temperature of 23 °C.
3. Results and Discussion
In this work, we are studying two solar cell architectures differing only in the hole-blocking layer (either or ). Despite sharing the same photoactive and hole-transport materials, the performance of the two architectures is visibly different.
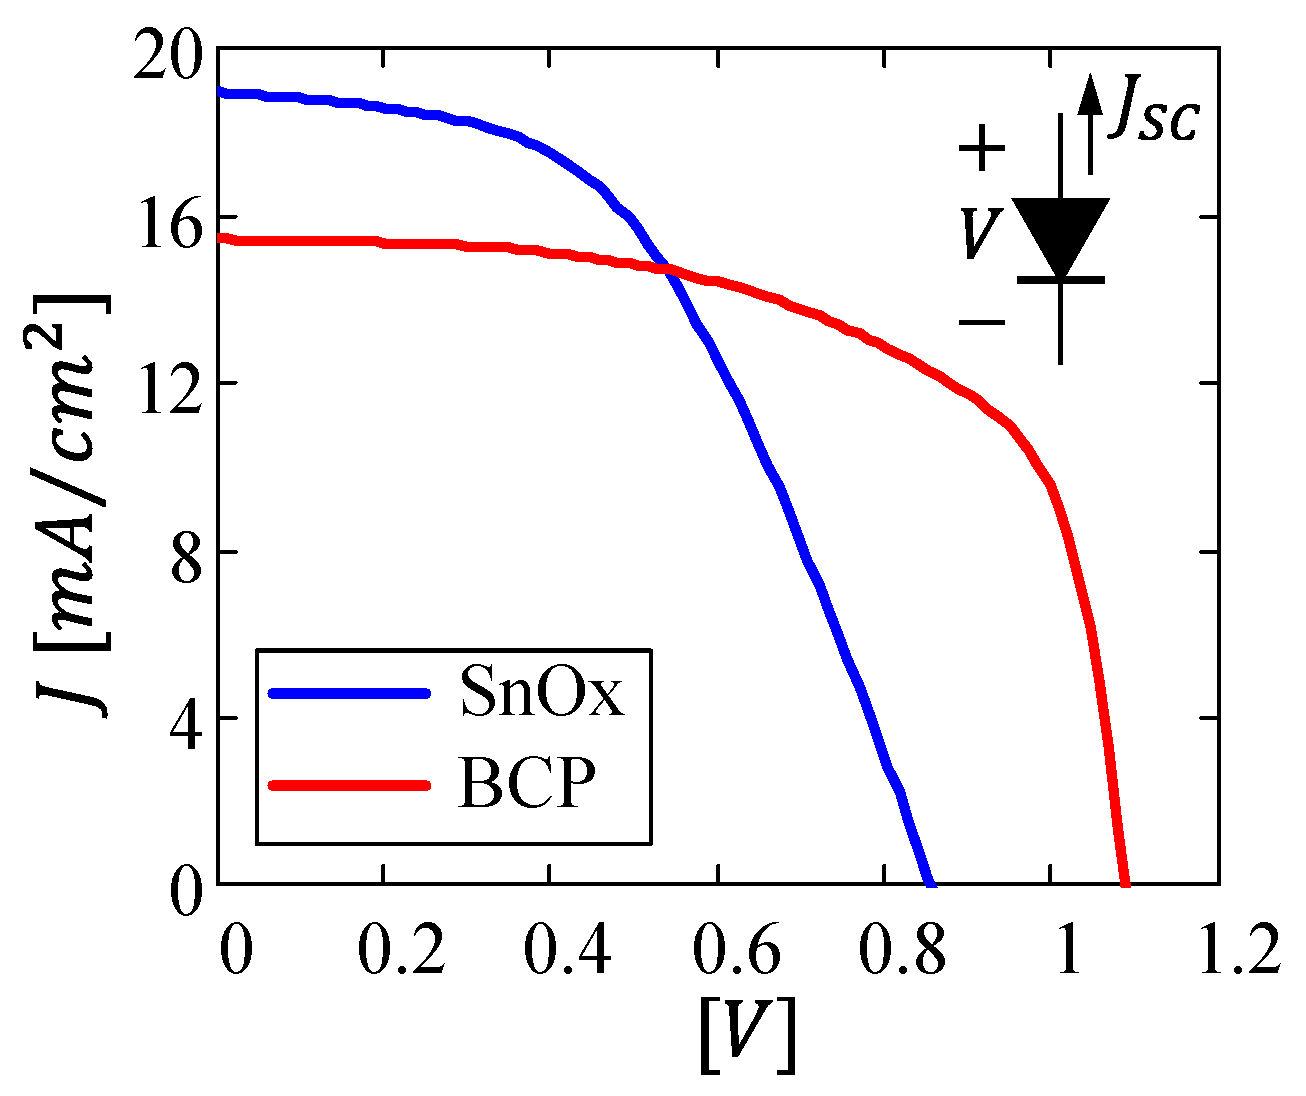
In particular, Figure 2 reports the photo-generated current density as a function of the applied voltage for both the architecture (blue line) and the architecture (red line) measured at the beginning of the characterization procedure. As reported in Table 1, the architecture is characterized by a larger short-circuit current , likely due to the large electron mobility of (in the order of 10 to 100 cm2V−1s−1 [23,24]; compared to 10−2 cm2V−1s−1 [25] of PCBM and to 10−7 cm2V−1s−1 of BCP [26]) that promotes an efficient extraction of the photo-generated electrons [27]. However, the architecture provides the highest power conversion efficiency thanks to the larger fill-factor and the larger open-circuit voltage . It is important to notice that, among the three figures of merit (, , and ) contributing to cell efficiency, is the one featuring the largest difference between the two architectures, confirming that the buffer layer is beneficial in preventing interfacial recombination by reducing the voltage drop across the PCBM layer and, in turn, enhancing the built-in voltage of the device [28].
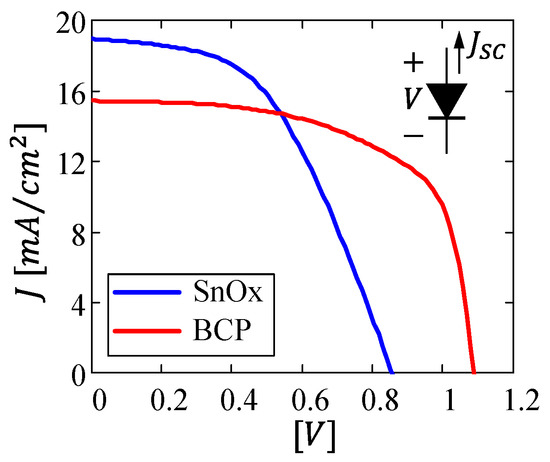
Figure 2.
Illuminated current vs voltage characteristics for the (blue line) and (red line) architectures measured at the beginning of the characterization procedure.

Table 1.
Solar cell figures of merit extrapolated at the beginning of the characterization procedure.
Another important difference between - and -based solar cells is their intrinsic instability that can be observed during subsequent characterizations over a prolonged time. However, it is important to remark that both architectures are stable during the short-term maximum power point-tracking experiment, as shown in Supplementary Figure S1.
In the following, we will analyze the figures of merit of the cells as a function of time while comparing the two architectures.
3.1. Short-Circuit Current
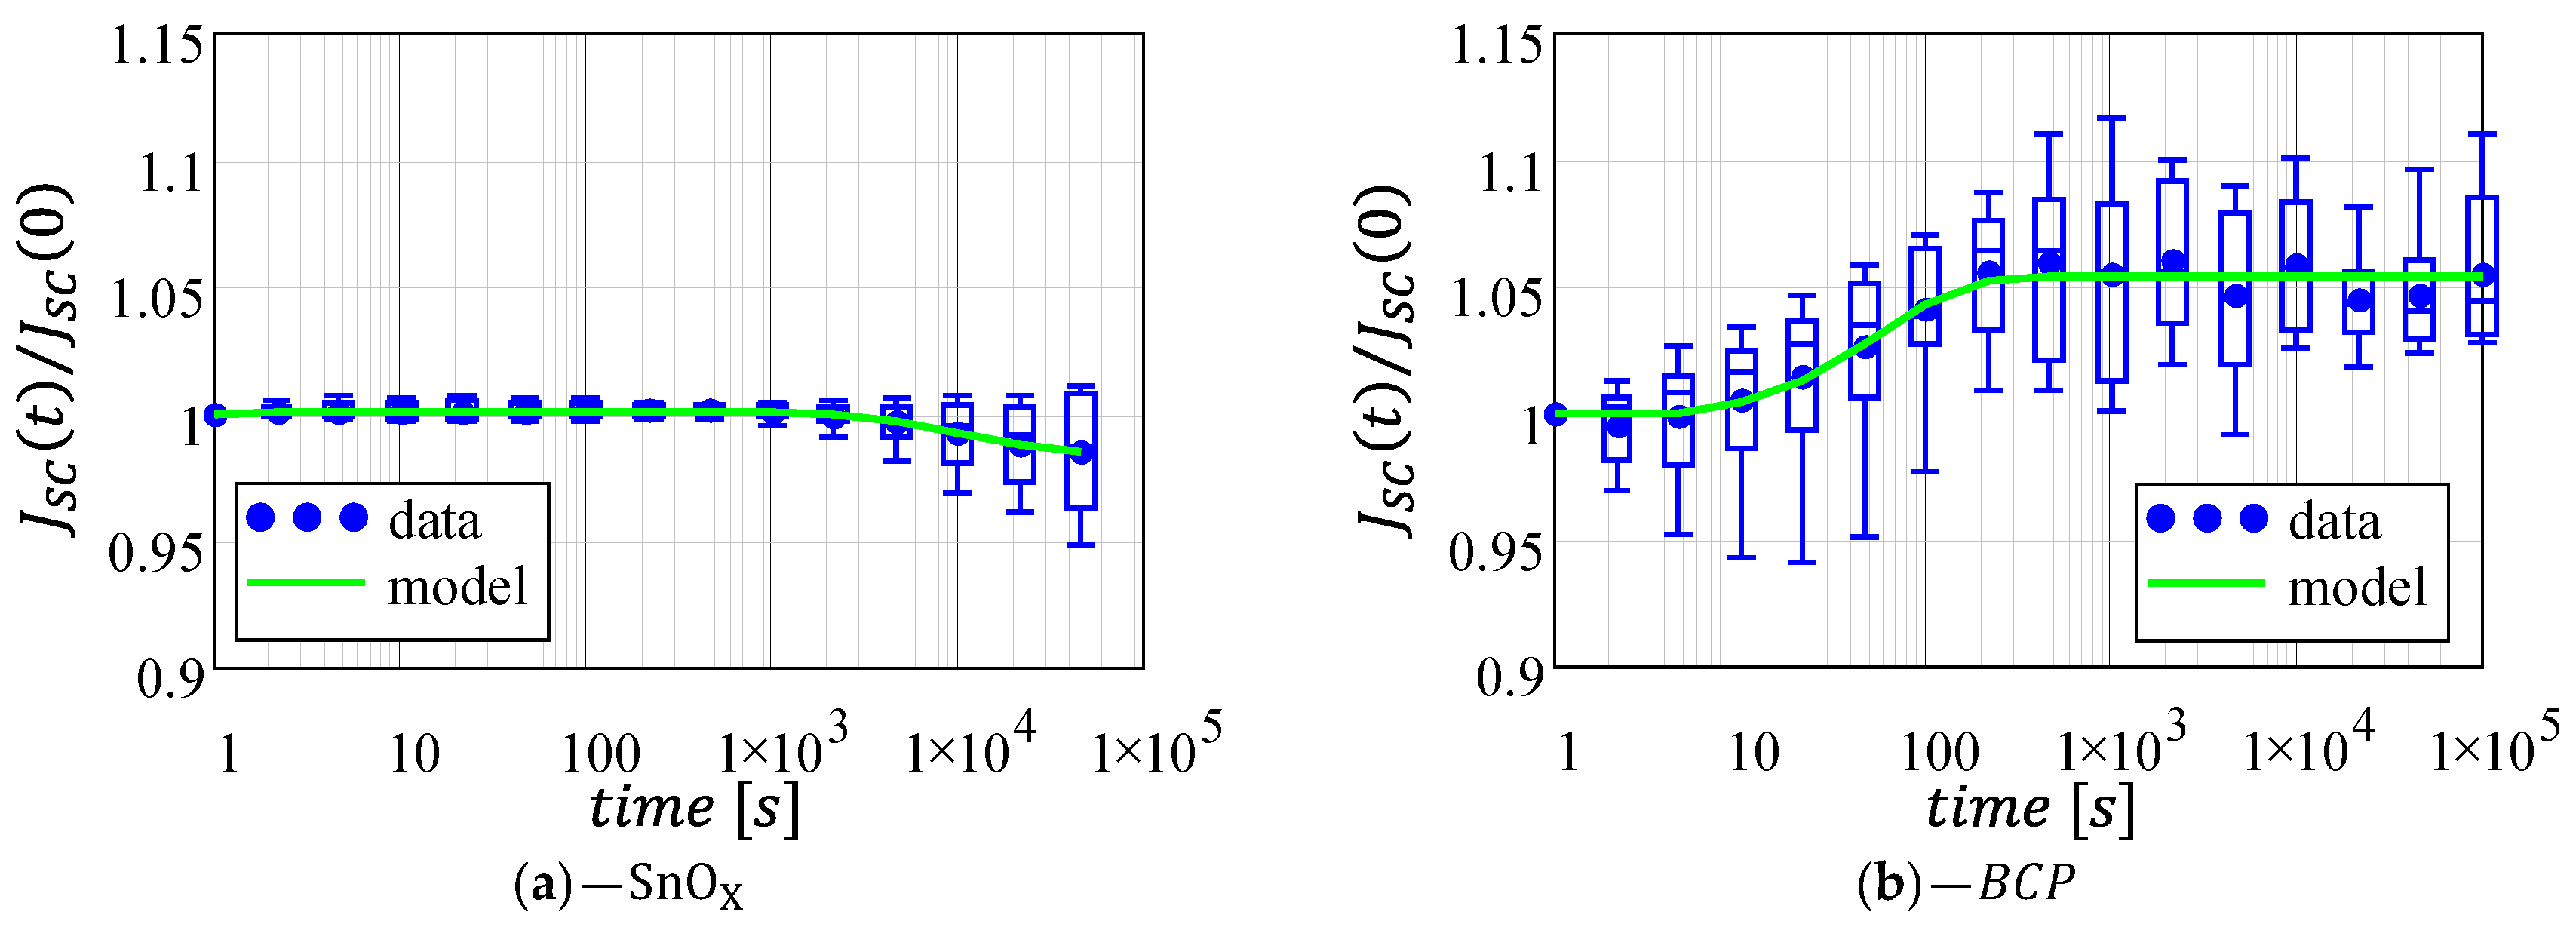
Figure 3 reports the normalized short-circuit current variation for the two architectures. The -based cells feature an almost constant of up to 103 s, followed by a very small degradation (less than 0.5%). The architecture instead is characterized by a much larger variability (highlighted by the wider whiskers in the box-plot chart), with a short-circuit current that increases after few seconds from the first characterization and stabilizing after 200 s with a total average increase of 5%.
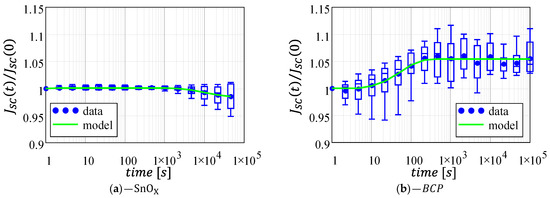
Figure 3.
Normalized short-circuit current as a function of time for the two architectures under analysis: (a) -based cells; (b) -based cells. Data fitting (green line) was computed using the mean values (blue circles) as a data-set. Plots are reported with the same axis for a direct comparison. Full-scale axes are reported in Supplementary Figure S2.
In agreement with the degradation kinetics discussed by J.W. McPherson in his book [29], the instability for the architecture can be described by two decaying exponentials, one to account for the degradation after 103 s, and one to account for the slight increase occurring at the beginning of the experiments (see the full-scale plot in Supplementary Figure S2):
where , , and are empirical parameters. In particular, is the magnitude of the observed instability (which can be used to predict the maximum variation), is the exponential decay rate (which is a material dependent parameter describing the speed of the instability), is a time delay denoting the beginning of the instability process, and is the step function defined as:
In principle, Equation (1) may be used for the architecture too. However, the BCP-based cells do not display any degradation during the time span of the experiments (hindering the extrapolation of parameters , , and ). Therefore, Equation (1) can be simplified by assuming = 0 s−1, which is the equivalent of using a single decaying exponential to describe the monotonous current increase:
As reported in Figure 3, Equations (1) and (3) perfectly capture the JSC behavior for the - and the -based solar cells, respectively; the corresponding fitting parameters are reported in Table 2. Notably, this model can be used to estimate the value of JSC after the long-term instability of the devices are fully dissipated (i.e., ). For the architecture, this value corresponds to parameter , that in our case leads to a 5.4% increase in . For the architecture, the current variation at regime can be estimated as , leading to a cumulative reduction of 1.5% with respect to its initial value. Comparing instead parameter for the two architectures, we observe that for the -based cells is the one order of magnitude which is larger than the -based cells. This indicates that, even though () displays a small variation, such variation occurs much faster in the architecture rather that in the architecture. A similar reasoning can be performed when considering the decay rate , which we can assume is equal to 0 s−1 for the -based cells, suggesting that the architecture is more stable than the architecture.

Table 2.
Short-circuit current fitting parameters.
3.2. Open-Circuit Voltage
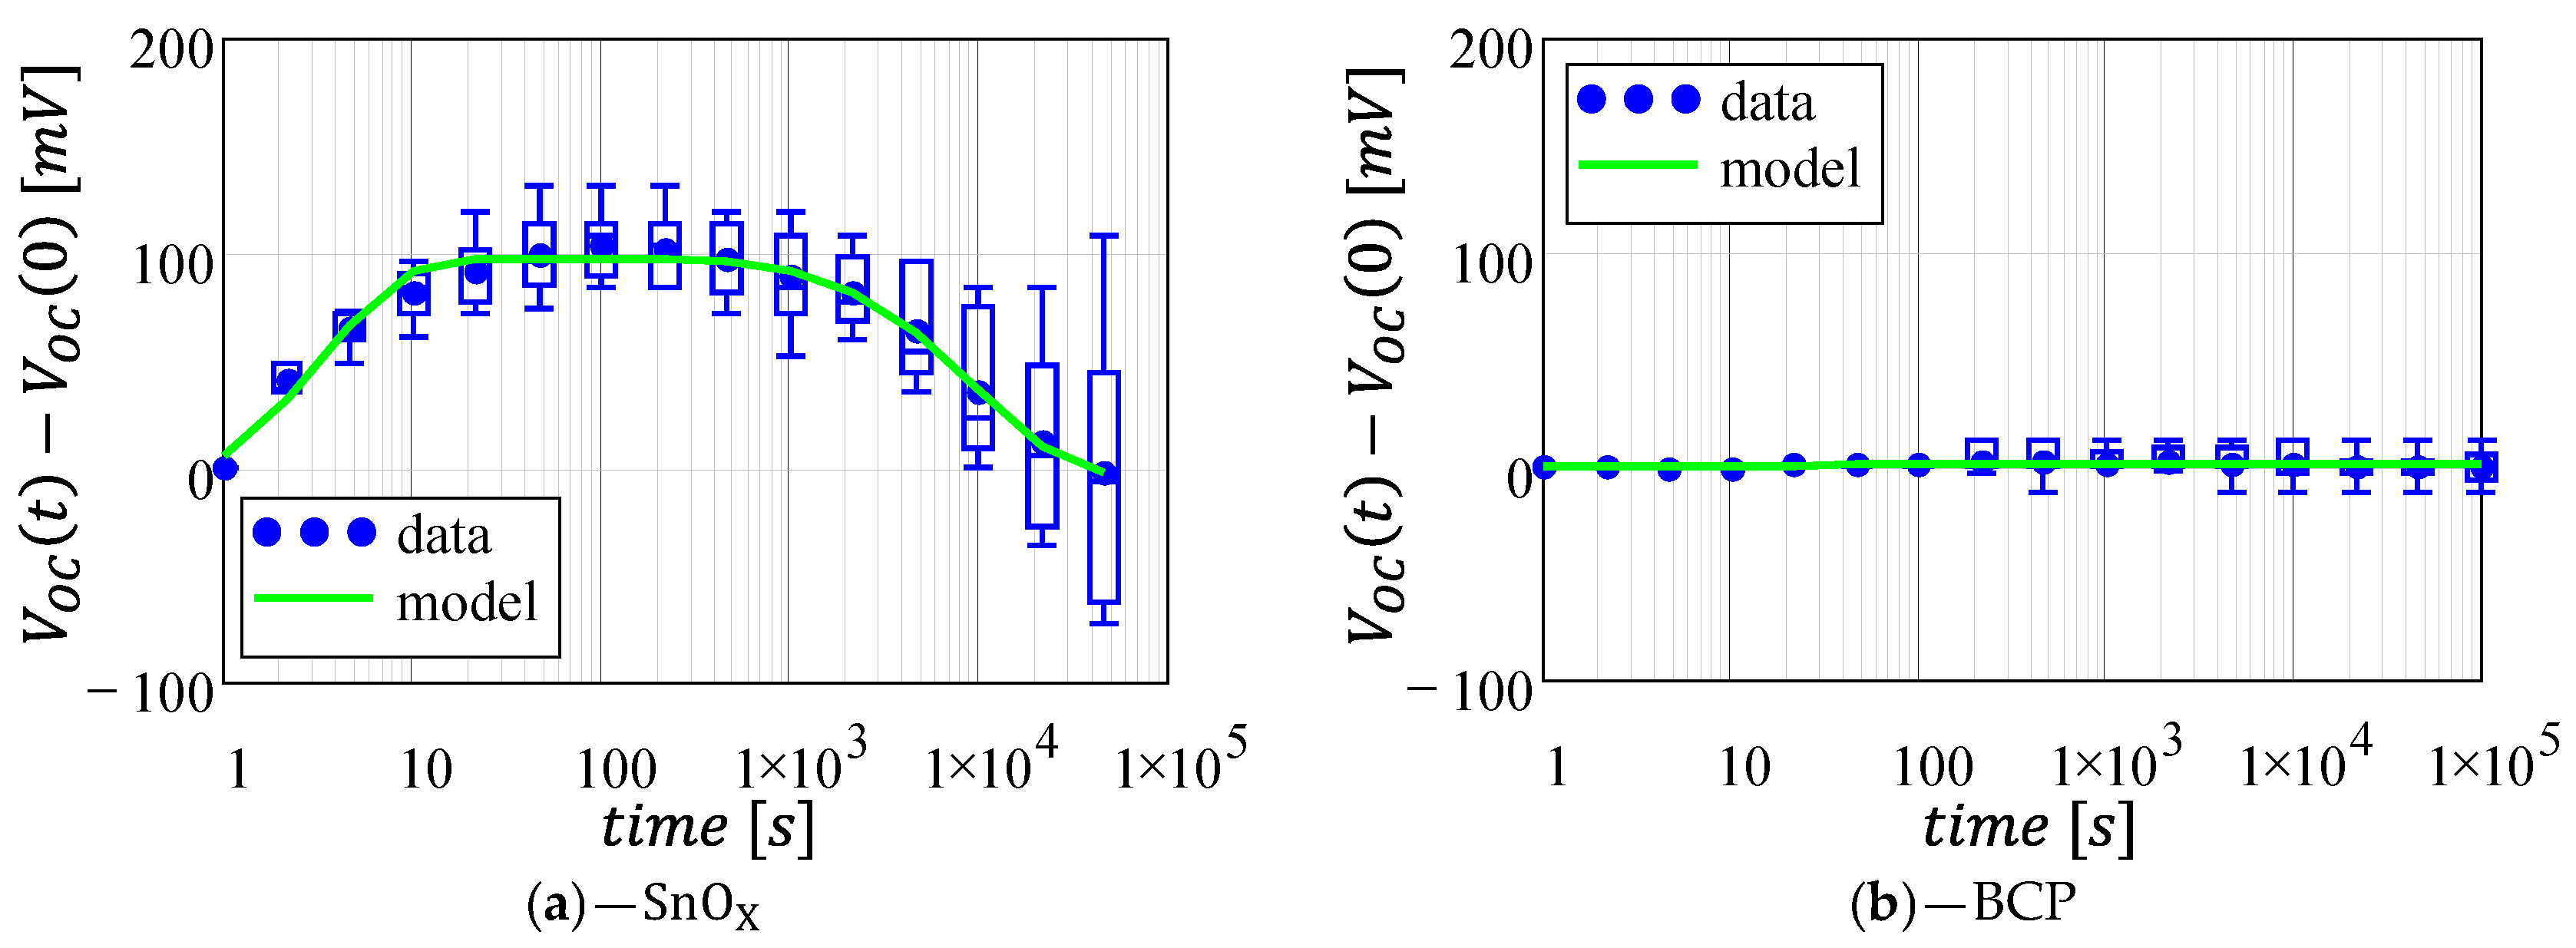
Conversely to , present the largest variability for the architecture. Figure 4 shows the direct comparison between the and architectures, highlighting that the -based solar cells are much more stable than their counterparts, which feature variations of up to 100 mV when compared to an average of a few mV for the architecture (see Supplementary Figure S3b).
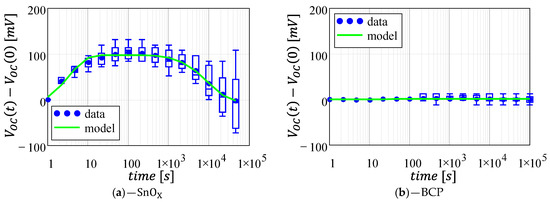
Figure 4.
Normalized open-circuit voltage as a function of time for the two architectures under analysis: (a) -based cells; (b) -based cells. Data fitting (green line) was computed using the mean values (blue circles) as a data-set. Plots are reported with the same axis for a direct comparison. Full-scale axes are reported in Supplementary Figure S3.
The architecture displays an initial improvement in the open-circuit voltage, which is followed, however, by a slow degradation that reduces the VOC down to its initial value. Therefore, following the same approach used in Section 3.1, we can describe the instability with a two-decaying exponential model, whereas a single decaying exponential can be used for the instability:
Table 3 shows the parameters used to fit the data in Figure 4 remarking the high stability of the architecture, whereas we predict a small reduction of 2.5 mV () for the architecture after an initial variation of 100 mV (). However, it is important to remark that this is an average value, and in the worst-case scenario, VOC may display a degradation larger than 50 mV. The larger stability of the architecture is confirmed also by the decay rate , which is one order of magnitude smaller than the cells.

Table 3.
Open-circuit voltage fitting parameters.
3.3. Fill-Factor
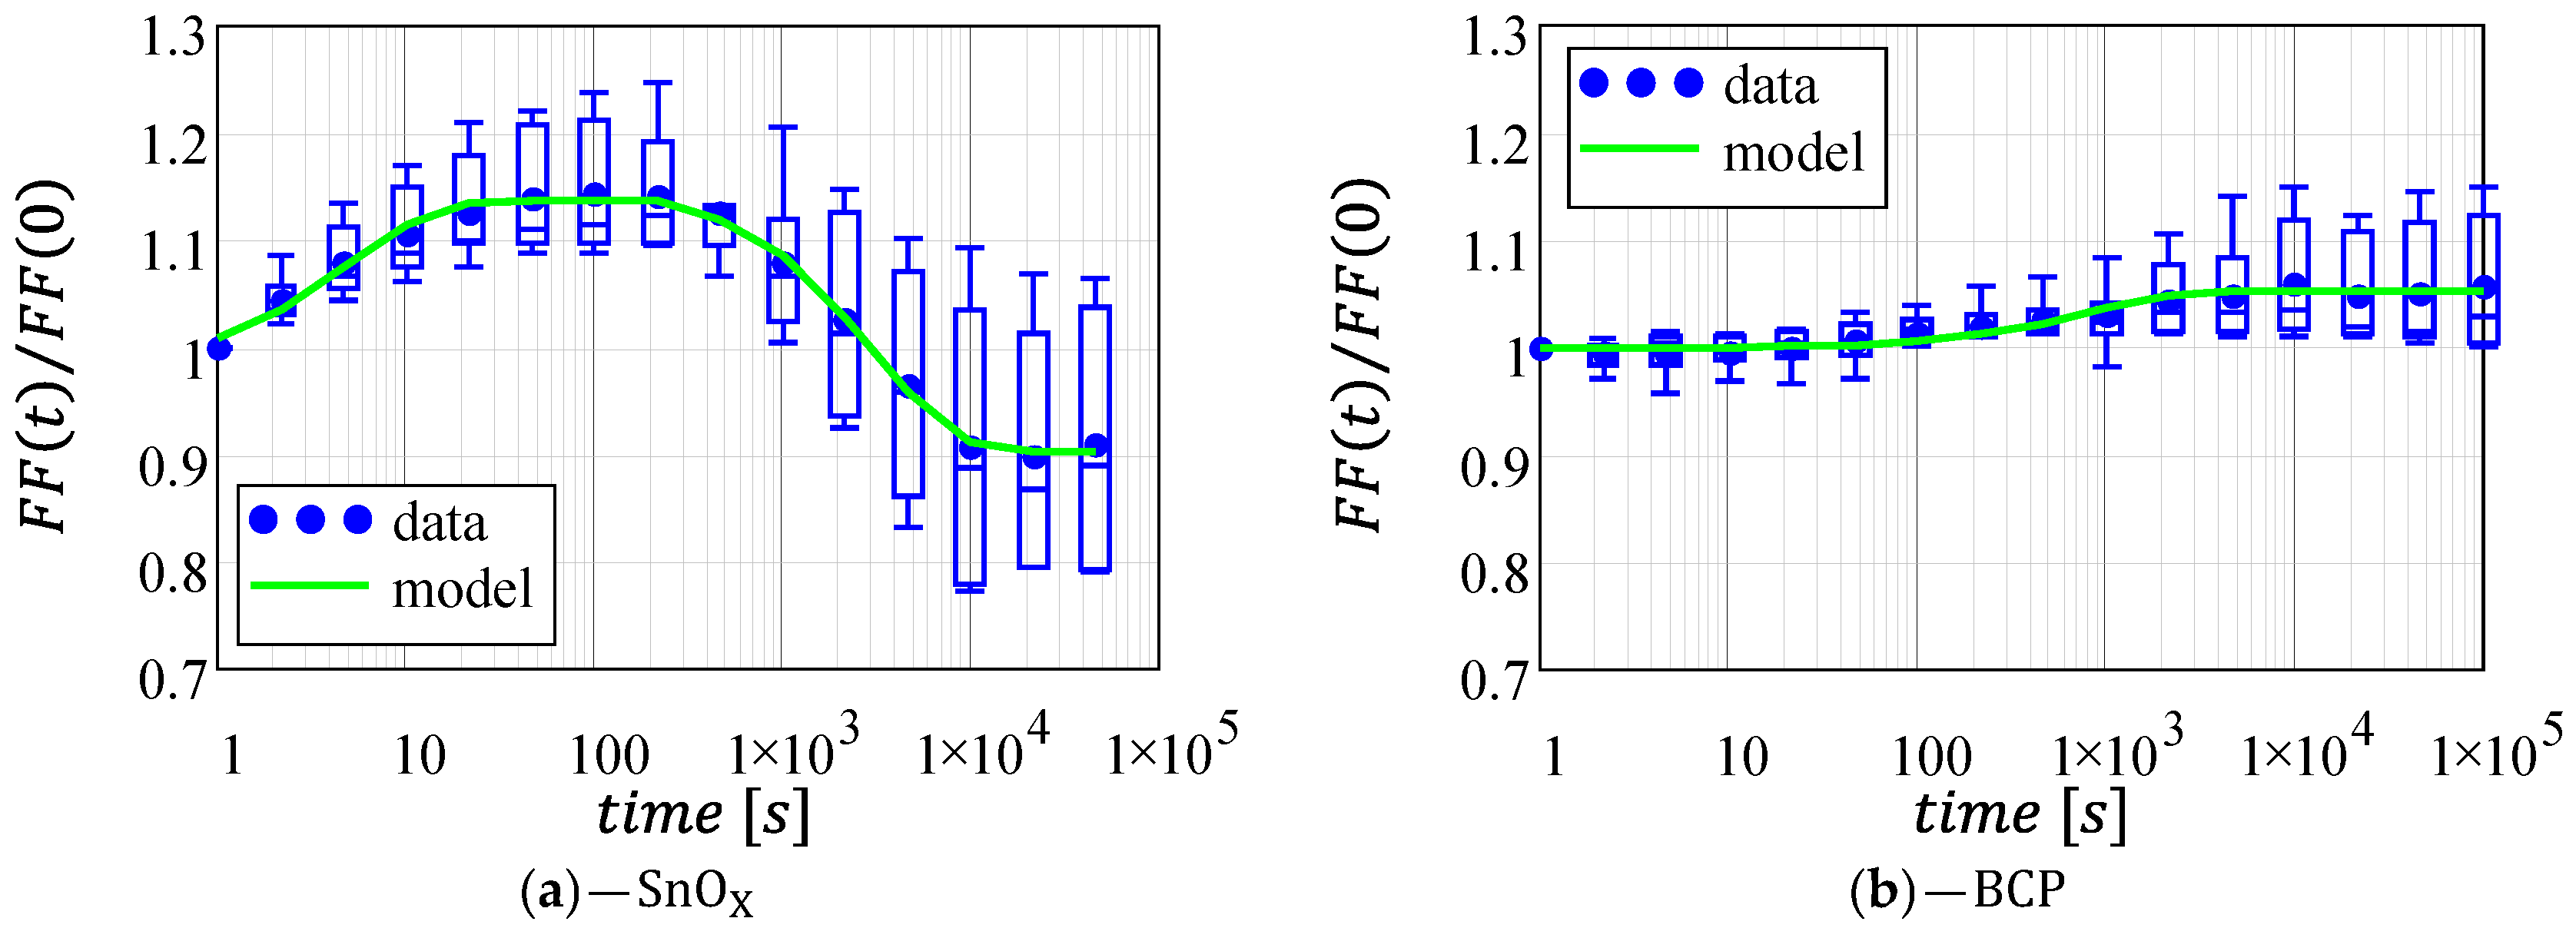
Figure 5 shows the variation in the fill-factor for the two architectures. Conversely to what was observed for the short-circuit current, the fill-factor for the architecture is the one presenting the larger instability, with the variations within ±20% (compared to +10% for the architecture). Despite this difference, for both architectures the fill-factor displays the same behavior reported for , even though it is much more marked in the architecture.
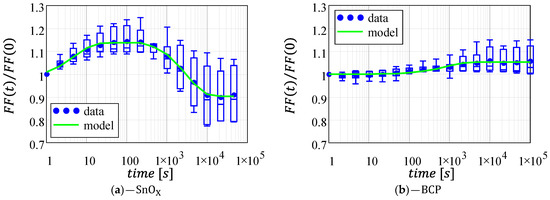
Figure 5.
Normalized fill-factor as a function of time for the two architectures under analysis: (a) -based cells; (b) -based cells. Data fitting (green line) was computed using the mean values (blue circles) as a data-set. Plots are reported with the same axis for a direct comparison. Full-scale axes are reported in Supplementary Figure S4.
The -based architecture features an initial increase in FF, followed by a degradation with respect to its initial value (around 10% degradation); whereas, the FF in the architecture slightly increases and stabilizes to a +5% value.
Accordingly, the same exponential decaying models used in (1) and (3) can be used to describe the fill-factor for - and -based solar cells, respectively:
The green lines in Figure 5 show the agreement between Equations (6) and (7) and the experimental data; whereas, the corresponding fitting parameters are summarized in Table 4. Comparing Table 2 with Table 4 we observe that for the -based devices the decay rate () of FF is much faster than the degradation of JSC; moreover, the FF reduction is twice its initial increase, leading to a final 9.7% loss of performance. Instead, for the architecture JSC and FF have similar magnitudes (around 5%) and similar time delays (2 and 4 s), but the FF increases with a much slower decay rate than the JSC ( = 1.3·10−3 s−1 compared to 17·10−3 s−1) because of the high stability in the open-circuit voltage (see Section 3.2).

Table 4.
Fill-factor fitting parameters.
3.4. Power Conversion Efficiency
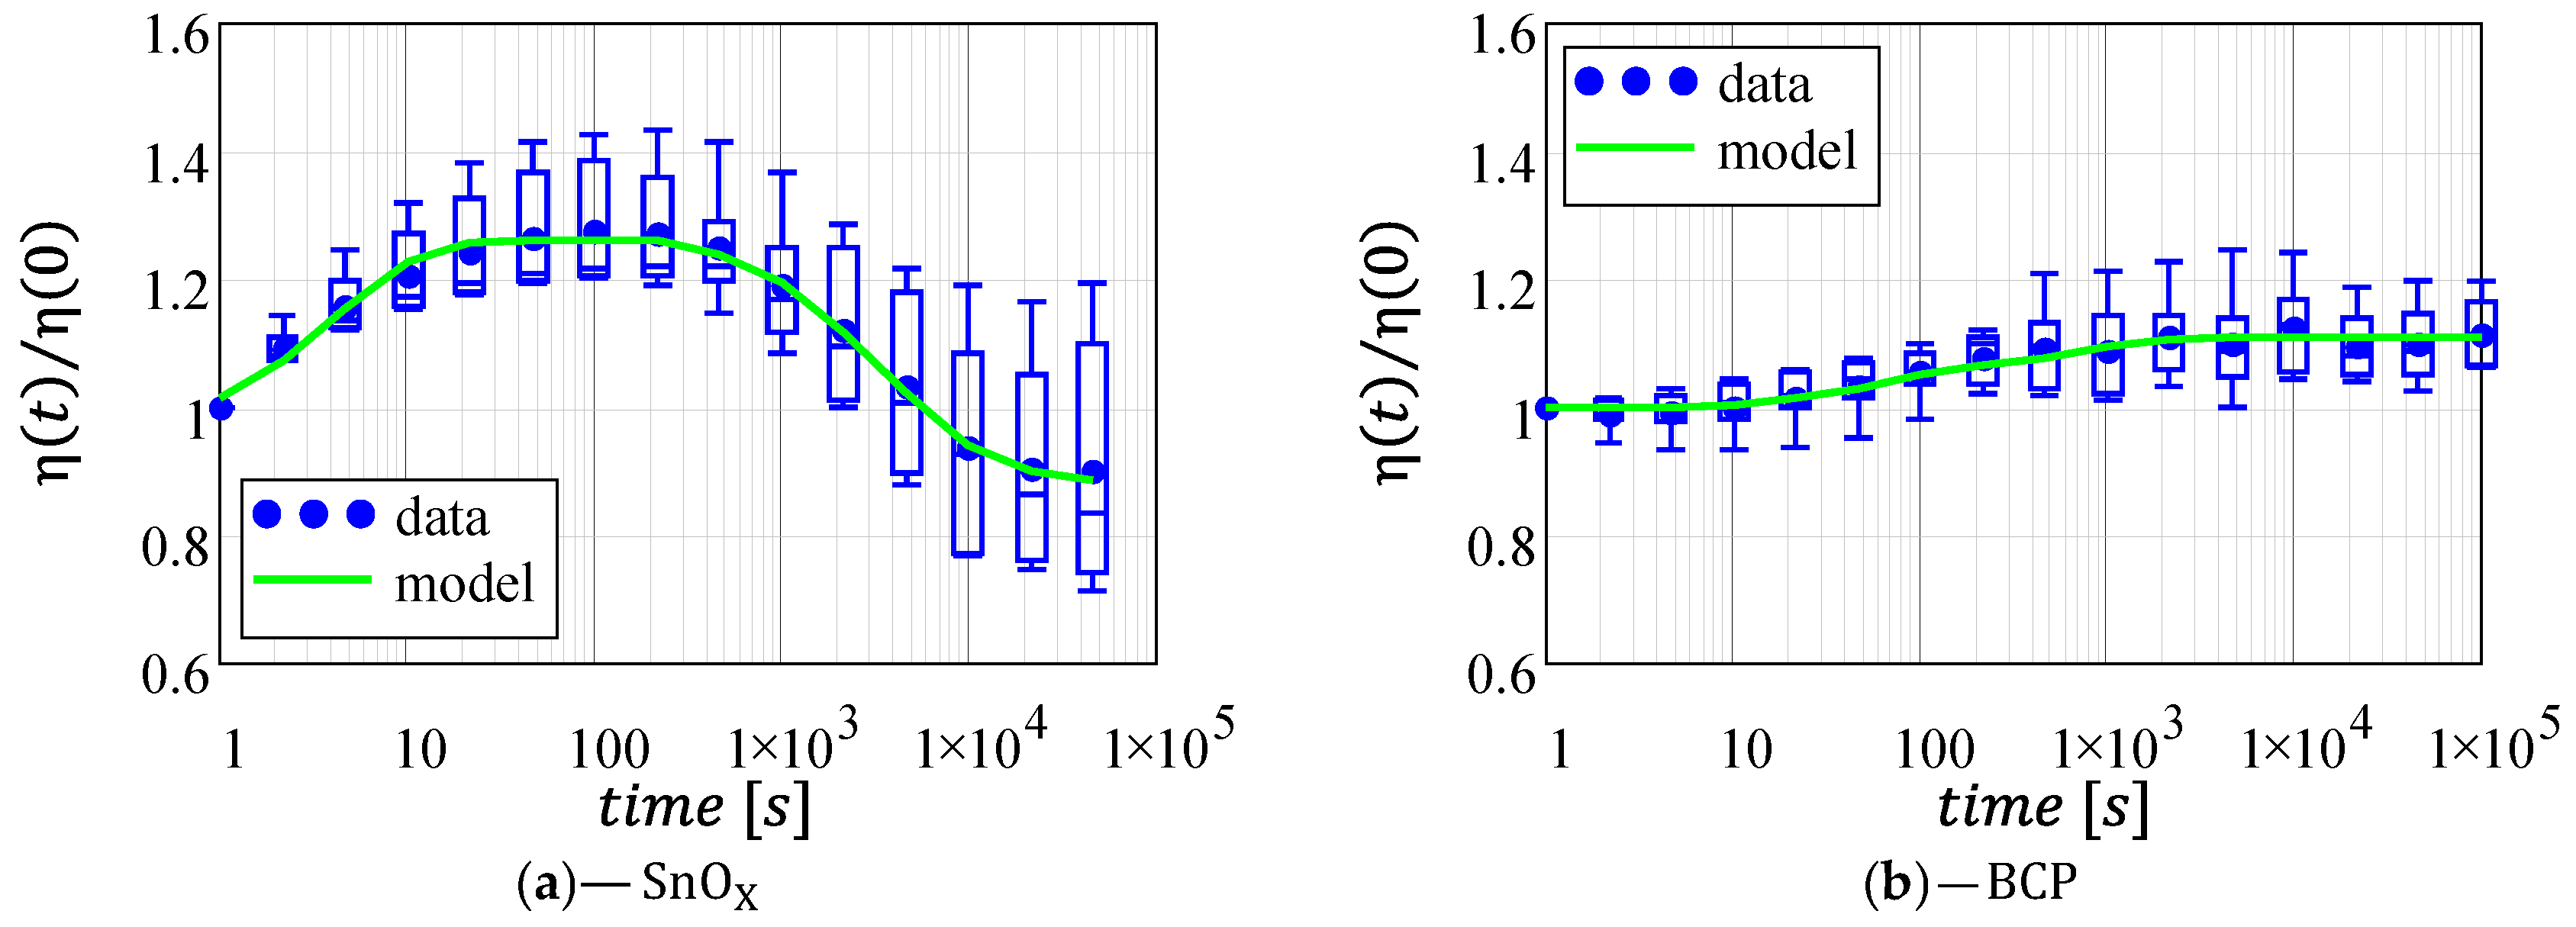
Finally, Figure 6 reports the power conversion efficiency for the two architectures whose behavior can be predicted combining the model described in the previous subsections:
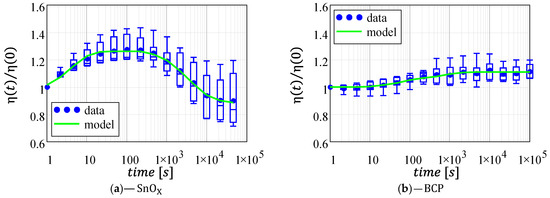
Figure 6.
Normalized power conversion efficiency as a function of time for the two architectures under analysis: (a) -based cells; (b) -based cells. Data fitting (green line) was computed using the mean values (blue circles) as a data-set. Plots are reported with the same axis a direct comparison. Full-scale axes are reported in Supplementary Figure S5.
The two expressions take into account that in the previous subsections we considered the percentage variation in and normalized to the pre-test value (); whereas, we considered the incremental variation in (with respect to the pre-test value).
As expected, the efficiency reflects the instability of the previously investigated figures of merit (namely, , , and ). In particular, the efficiency of the cells initially increases following the increase in FF and VOC, but this improvement is followed by an irreversible degradation of the overall performance as observed for all the other figures of merit (, , and ). We believe that the commercial dispersing agents in the N31-Avantama ink might be responsible for this degradation [19]. In contrast, the efficiency instability of the -based cells is dominated by and , while can be assumed constant, thus a total 10% increase in efficiency is observed (5% due to the short- circuit current and 5% due to the fill-factor).
4. Conclusions
In this work, we investigated the intrinsic instability of two perovskite solar cells differing only in the hole-blocking layer ( vs ). The overall performance of the two architectures is similar, with cells featuring slightly larger short-circuit currents and -cells featuring slightly larger efficiency (larger and larger ).
Comparing the stability of the devices, we observed two different dynamics for - and -based architectures. In particular, the cells show an initial efficiency increase (27% increase after 100s) followed by a sensible decrease, leading to a cumulative 11% efficiency degradation. Conversely, the -based cells are characterized by a monotonous increase in performance by up to 10% with respect to their initial value. Therefore, under shelf-life conditions, the cells are more stable than their counterpart; moreover, the cell instability is not a detrimental phenomenon since it leads to a stable increase in performance after an initial settling time.
By analyzing separately the other figures of merit, namely , , and , we observed that the power efficiency instability originates mainly from one or two parameters. The cell instability is caused mostly by variations, whereas the instability in the -cells is observed only in and . This particular behavior suggests that to monitor PSCs, time-dependent stability is sufficient to monitor the behavior of the open-circuit voltage for -based cells, and the behavior of the short-circuit current for the -based cells.
This manuscript provides useful insights into the intrinsic instability of perovskite solar cells that are not limited to the devices used in this work. In fact, is currently employed for record efficacy perovskite solar cells (certified efficiency of 25.7%) [30]. Therefore, we believe that the results of this work can be an important aid to investigate degradation phenomena of high-performance solar cells.
Supplementary Materials
The following supporting information can be downloaded at: https://www.mdpi.com/article/10.3390/cryst13020185/s1, Figure S1: Maximum power point tracking; Figure S2: Normalized short-circuit current; Figure S3: Normalized open-circuit voltage; Figure S4: Normalized fill-factor; Figure S5: Normalized power conversion efficiency.
Author Contributions
Conceptualization, N.L.; methodology, N.L. and A.P.; software, N.L.; validation, N.L. and A.P.; formal analysis, N.L.; investigation, A.P.; resources, S.H.R. and A.D.C.; data curation, A.P.; writing—original draft preparation, N.L.; writing—review and editing, N.L. and S.H.R.; visualization, N.L.; supervision, A.C.; project administration, A.C. and A.D.C.; funding acquisition, A.C. and A.D.C. All authors have read and agreed to the published version of the manuscript.
Funding
This research received support from the Italian Ministry for Universities and Research through the project “Bifacial Efficient Solar cell Technology with 4 terminal architecture for Utility scale”—BEST4U (grant agreement no. ARS01_00519) and European Union’s Horizon 2020 research and innovation programme under the Marie Sklodowska-Curie grant agreement no. 764787.
Data Availability Statement
The data that support the findings of this study are available on request from the corresponding author.
Conflicts of Interest
The authors declare no conflict of interest.
References
- Best Research-Cell Efficiency Chart|Photovoltaic Research | NREL. Available online: https://www.nrel.gov/pv/cell-efficiency.html (accessed on 12 January 2023).
- Bati, A.S.R.; Zhong, Y.L.; Burn, P.L.; Nazeeruddin, M.K.; Shaw, P.E.; Batmunkh, M. Next-Generation Applications for Integrated Perovskite Solar Cells. Commun. Mater. 2023, 4, 2. [Google Scholar] [CrossRef]
- Kim, J.Y.; Lee, J.W.; Jung, H.S.; Shin, H.; Park, N.G. High-Efficiency Perovskite Solar Cells. Chem. Rev. 2020, 120, 7867–7918. [Google Scholar] [CrossRef] [PubMed]
- Kang, D.H.; Park, N.G. On the Current–Voltage Hysteresis in Perovskite Solar Cells: Dependence on Perovskite Composition and Methods to Remove Hysteresis. Adv. Mater. 2019, 31, 1805214. [Google Scholar] [CrossRef] [PubMed]
- Harshavardhan Reddy, S.; Di Giacomo, F.; Di Carlo, A.; Reddy, S.H.; Di Giacomo, F.; Di Carlo, A. Low-Temperature-Processed Stable Perovskite Solar Cells and Modules: A Comprehensive Review. Adv. Energy Mater. 2022, 12, 2103534. [Google Scholar] [CrossRef]
- Rizzo, A.; Lamberti, F.; Buonomo, M.; Wrachien, N.; Torto, L.; Lago, N.; Sansoni, S.; Pilot, R.; Prato, M.; Michieli, N.; et al. Understanding Lead Iodide Perovskite Hysteresis and Degradation Causes by Extensive Electrical Characterization. Sol. Energy Mater. Sol. Cells 2019, 189, 43–52. [Google Scholar] [CrossRef]
- Wang, W.; Yang, Z.; Ding, J.; Kong, J.; Li, X. Improving Water-Resistance of Inverted Flexible Perovskite Solar Cells via Tailoring the Top Electron-Selective Layers. Sol. Energy Mater. Sol. Cells 2022, 238, 111609. [Google Scholar] [CrossRef]
- Karim, M.A.; Matsuishi, K.; Chowdhury, T.H.; Chowdhury, W.I.; Abdel-shakour, M.; Islam, A. Bathocuproine Interfacial Layer Leads to Solid Improvement of Reproducibility and Stability of Pb-Free CsBi3I10 Based Perovskite Solar Cells. J. Mater. Sci. Mater. Electron. 2022, 33, 8114–8126. [Google Scholar] [CrossRef]
- Wang, P.; Shao, Z.; Ulfa, M.; Pauporté, T. Insights into the Hole Blocking Layer Effect on the Perovskite Solar Cell Performance and Impedance Response. J. Phys. Chem. C 2017, 121, 9131–9141. [Google Scholar] [CrossRef]
- Gagliardi, S.; Rondino, F.; Paoletti, C.; Falconieri, M. On the Morphology of Nanostructured TiO2 for Energy Applications: The Shape of the Ubiquitous Nanomaterial. Nanomaterials 2022, 12, 2608. [Google Scholar] [CrossRef]
- Zhang, T.; He, Q.; Yu, J.; Chen, A.; Zhang, Z.; Pan, J. Recent Progress in Improving Strategies of Inorganic Electron Transport Layers for Perovskite Solar Cells. Nano Energy 2022, 104, 107918. [Google Scholar] [CrossRef]
- Yates, H.M.; Afzaal, M.; Walter, A.; Hodgkinson, J.L.; Moon, S.J.; Sacchetto, D.; Bräuninger, M.; Niesen, B.; Nicolay, S.; McCarthy, M.; et al. Progression towards High Efficiency Perovskite Solar Cells via Optimisation of the Front Electrode and Blocking Layer. J. Mater. Chem. C 2016, 4, 11269–11277. [Google Scholar] [CrossRef]
- Chen, S.H.; Ho, C.M.; Chang, Y.H.; Lee, K.M.; Wu, M.C. Efficient Perovskite Solar Cells with Low J-V Hysteretic Behavior Based on Mesoporous Sn-Doped TiO2 Electron Extraction Layer. Chem. Eng. J. 2022, 445, 136761. [Google Scholar] [CrossRef]
- Sun, H.; Xie, D.; Song, Z.; Liang, C.; Xu, L.; Qu, X.; Yao, Y.; Li, D.; Zhai, H.; Zheng, K.; et al. Interface Defects Passivation and Conductivity Improvement in Planar Perovskite Solar Cells Using Na2S-Doped Compact TiO2 Electron Transport Layers. ACS Appl. Mater. Interfaces 2020, 12, 22853–22861. [Google Scholar] [CrossRef]
- Cao, Z.; Li, C.; Deng, X.; Wang, S.; Yuan, Y.; Chen, Y.; Wang, Z.; Liu, Y.; Ding, L.; Hao, F. Metal Oxide Alternatives for Efficient Electron Transport in Perovskite Solar Cells: Beyond TiO2 and SnO2. J. Mater. Chem. A 2020, 8, 19768–19787. [Google Scholar] [CrossRef]
- Jiang, Q.; Zhang, X.; You, J.; Jiang, Q.; Zhang, X.; You, J. SnO2: A Wonderful Electron Transport Layer for Perovskite Solar Cells. Small 2018, 14, 1801154. [Google Scholar] [CrossRef]
- Ferguson, V.; Silva, S.R.P.; Zhang, W. Carbon Materials in Perovskite Solar Cells: Prospects and Future Challenges. Energy Environ. Mater. 2019, 2, 107–118. [Google Scholar] [CrossRef]
- Xiong, L.; Guo, Y.; Wen, J.; Liu, H.; Yang, G.; Qin, P.; Fang, G.; Xiong, L.B.; Guo, Y.X.; Liu, H.R.; et al. Review on the Application of SnO2 in Perovskite Solar Cells. Adv. Funct. Mater. 2018, 28, 1802757. [Google Scholar] [CrossRef]
- Reddy, S.H.; Di Giacomo, F.; Matteocci, F.; Castriotta, L.A.; Di Carlo, A. Holistic Approach toward a Damage-Less Sputtered Indium Tin Oxide Barrier Layer for High-Stability Inverted Perovskite Solar Cells and Modules. ACS Appl. Mater. Interfaces 2022, 14, 51438–51448. [Google Scholar] [CrossRef]
- Chen, C.; Zhang, S.; Wu, S.; Zhang, W.; Zhu, H.; Xiong, Z.; Zhang, Y.; Chen, W. Effect of BCP Buffer Layer on Eliminating Charge Accumulation for High Performance of Inverted Perovskite Solar Cells. RSC Adv. 2017, 7, 35819–35826. [Google Scholar] [CrossRef]
- Di Giacomo, F.; Castriotta, L.A.; Kosasih, F.U.; Di Girolamo, D.; Ducati, C.; Di Carlo, A. Upscaling Inverted Perovskite Solar Cells: Optimization of Laser Scribing for Highly Efficient Mini-Modules. Micromachines 2020, 11, 1127. [Google Scholar] [CrossRef]
- IEC 60904–7:2019; Photovoltaic Devices—Part 7: Computation of the Spectral Mismatch Correction for Measurements of Photovoltaic Devices. BSI Standards Limited: London, UK, 2019; ISBN 978-0-580-97364-2.
- Mun, H.; Yang, H.; Park, J.; Ju, C.; Char, K. High Electron Mobility in Epitaxial SnO2−x in Semiconducting Regime. APL Mater. 2015, 3, 076107. [Google Scholar] [CrossRef]
- Wang, D.; Muhammad, R.; Hussain, F.; Li, Z.; Graziosi, P.; Neophytou, N. Electron and Hole Mobility of SnO2 from Full-Band Electron–Phonon and Ionized Impurity Scattering Computations. Crystals 2022, 12, 1591. [Google Scholar] [CrossRef]
- Devižis, A.; Hertel, D.; Meerholz, K.; Gulbinas, V.; Moser, J.E. Time-Independent, High Electron Mobility in Thin PC61BM Films: Relevance to Organic Photovoltaics. Org. Electron. 2014, 15, 3729–3734. [Google Scholar] [CrossRef]
- Mu, H.; Reddy, I.; Hunt, J.; Severs, P.; Patil, S. Electron Mobility Characterization in OLEDs from Ac Small Signal Optical Modulation. J. Phys. D Appl. Phys. 2010, 43, 195103. [Google Scholar] [CrossRef]
- Jiang, Q.; Zhang, L.; Wang, H.; Yang, X.; Meng, J.; Liu, H.; Yin, Z.; Wu, J.; Zhang, X.; You, J. Enhanced Electron Extraction Using SnO2 for High-Efficiency Planar-Structure HC(NH2)2PbI3-Based Perovskite Solar Cells. Nat. Energy 2016, 2, 16177. [Google Scholar] [CrossRef]
- Liu, D.; Wang, G.; Luo, K.; He, X.; Ye, Q.; Liao, C.; Mei, J. Understanding the Role of the Electron-Transport Layer in Highly Efficient Planar Perovskite Solar Cells. ChemPhysChem 2017, 18, 617–625. [Google Scholar] [CrossRef]
- McPherson, J.W. Reliability Physics and Engineering: Time-to-Failure Modeling, 3rd ed.; Springer International Publishing: Cham, Switzerland, 2019; ISBN 978-3-319-93682-6. [Google Scholar]
- Min, H.; Lee, D.Y.; Kim, J.; Kim, G.; Lee, K.S.; Kim, J.; Paik, M.J.; Kim, Y.K.; Kim, K.S.; Kim, M.G.; et al. Perovskite Solar Cells with Atomically Coherent Interlayers on SnO2 Electrodes. Nature 2021, 598, 444–450. [Google Scholar] [CrossRef]
Disclaimer/Publisher’s Note: The statements, opinions and data contained in all publications are solely those of the individual author(s) and contributor(s) and not of MDPI and/or the editor(s). MDPI and/or the editor(s) disclaim responsibility for any injury to people or property resulting from any ideas, methods, instructions or products referred to in the content. |
© 2023 by the authors. Licensee MDPI, Basel, Switzerland. This article is an open access article distributed under the terms and conditions of the Creative Commons Attribution (CC BY) license (https://creativecommons.org/licenses/by/4.0/).

