Article

Low-Cycle Fatigue Behavior of Hot V-Bent Structural Components Made of AZ31B Wrought Magnesium Alloy

Competence Center for Lightweight Design (LLK), Faculty of Mechanical Engineering, University of Applied Sciences Landshut, 84036 Landshut, Germany
*
Author to whom correspondence should be addressed.
Crystals 2023, 13(2), 184; https://doi.org/10.3390/cryst13020184
Submission received: 28 December 2022 / Revised: 17 January 2023 / Accepted: 18 January 2023 / Published: 20 January 2023

Abstract

:
Recent studies have shown the change of microstructure during hot-bending in uniaxial specimens made of AZ31B alloy. They also investigated the influence of the changed microstructure on the quasi-static and cyclic material behavior under uniaxial stress states. However, studies on the fatigue behavior of hot-bent structural components in which a multiaxial inhomogeneous stress state occurs are still lacking. For this purpose, a novel hot-bent V-shaped specimen was developed, of which three different variants, each with a different bending radius, were fabricated and investigated. Microstructural analyses reveal that band-like accumulations of twinned grains are already formed in the compressively stressed area of the specimen during the bending process. Force-controlled low-cycle fatigue tests were performed to investigate the twinning evolution after cyclic loading. Subsequent microstructure analyses show that bands of twinned grains are no longer visible but also that the occurrence of twins is evenly distributed. Due to the specimen shape, the specimens are subjected to a multiaxial stress state. During LCF tests, the strain was measured using 3D digital image correlation and fatigue life was modeled successfully with the application of the concept of highly strained volume.

1. Introduction

Lightweight construction is becoming increasingly important for reducing climate-damaging greenhouse gas emissions. A suitable material for this purpose is magnesium (Mg), which is used in the automotive and aircraft industry due to its higher strength-weight ratio, ductility and castability compared with aluminum and steel [1,2]. In particular, alloys with zinc (Zn) content are used in industry since Zn has a high solubility in Mg and helps the material to maintain the material characteristics due to its solid strengthening and age strengthening action [3]. To take advantage of the mechanical properties of Mg alloys, a deep knowledge of mechanical and fatigue behavior is required.
During the manufacturing process of twin-roll cast AZ31B sheets, the c-axes of the hexagonal lattice align perpendicularly to the sheet plane resulting in a strong basal texture [4,5,6]. This favors the formation of { 10 1 ¯ 2 } tension twins when a compressive load is applied parallel to the sheet plane [7]. On the other hand, tensile stresses acting in the rolling direction (RD) or transversal direction (TD) cause dislocation slip as the main mechanism of plastic deformation [8]. Uniaxial compression tests in the RD and TD of the sheet result in the formation of macroscopic bands of twinned grains (BTGs), in which the compressive strain is significantly higher than in the adjacent areas [9,10,11,12]. Previous studies show that the BTGs also occur in compressively loaded hot-bent uniaxial specimens [13] and in quasi-static V-bent sheet strips on the compressively loaded side [14,15].
In order to effectively use the material in the industry, fatigue models are required that can estimate the lifetime of the magnesium structures. There are studies that have already successfully developed these models for planar twin-roll cast magnesium alloy sheets [16,17,18,19] and hot-extruded Mg alloys [20,21,22]. Because common fatigue parameters are higher when evaluated in the BTG than outside of the BTG [9,12], Denk et al. proposed the concept of highly strained volume (CH ε V) in [23] to model the fatigue life of Mg alloys. It is shown in [9,12] that the CH ε V can be used to model the fatigue life of uniaxial unnotched, uniaxial notched and bending specimens. Furthermore, it can be used to estimate the lifetime of hot-bent uniaxial specimens [13].
However, studies on the fatigue behavior of hot-bent structural components made of planar twin-roll cast AZ31B, which are subjected to an inhomogeneous and multiaxial stress state, are still lacking. It has not yet been investigated if the CH ε V can be applied to model the fatigue life of hot-bent structural components made of twin-roll cast AZ31B. Moreover, there are a lack of studies covering the evolution of twinning in hot-bent structural components after cyclic loading.
A novel hot-bent V-shaped structural component specimen was developed to investigate the evolution of the microstructure both directly after the bending process and after cyclic loading, as well as the cyclic material behavior. In addition, three variants, with different bending radii, of the specimens were investigated to determine the influence of the degree of deformation on the fatigue life. Because of the geometry of the specimen, a multiaxial inhomogeneous stress state occurs in the gauge area when loaded with uniaxial compression or tension. In order to estimate the lifetime of the V-bent structural components efficiently, it is investigated whether models developed using the CH ε V together with experimental data from cyclic tests with uniaxial specimens are suitable.

2. Materials and Methods

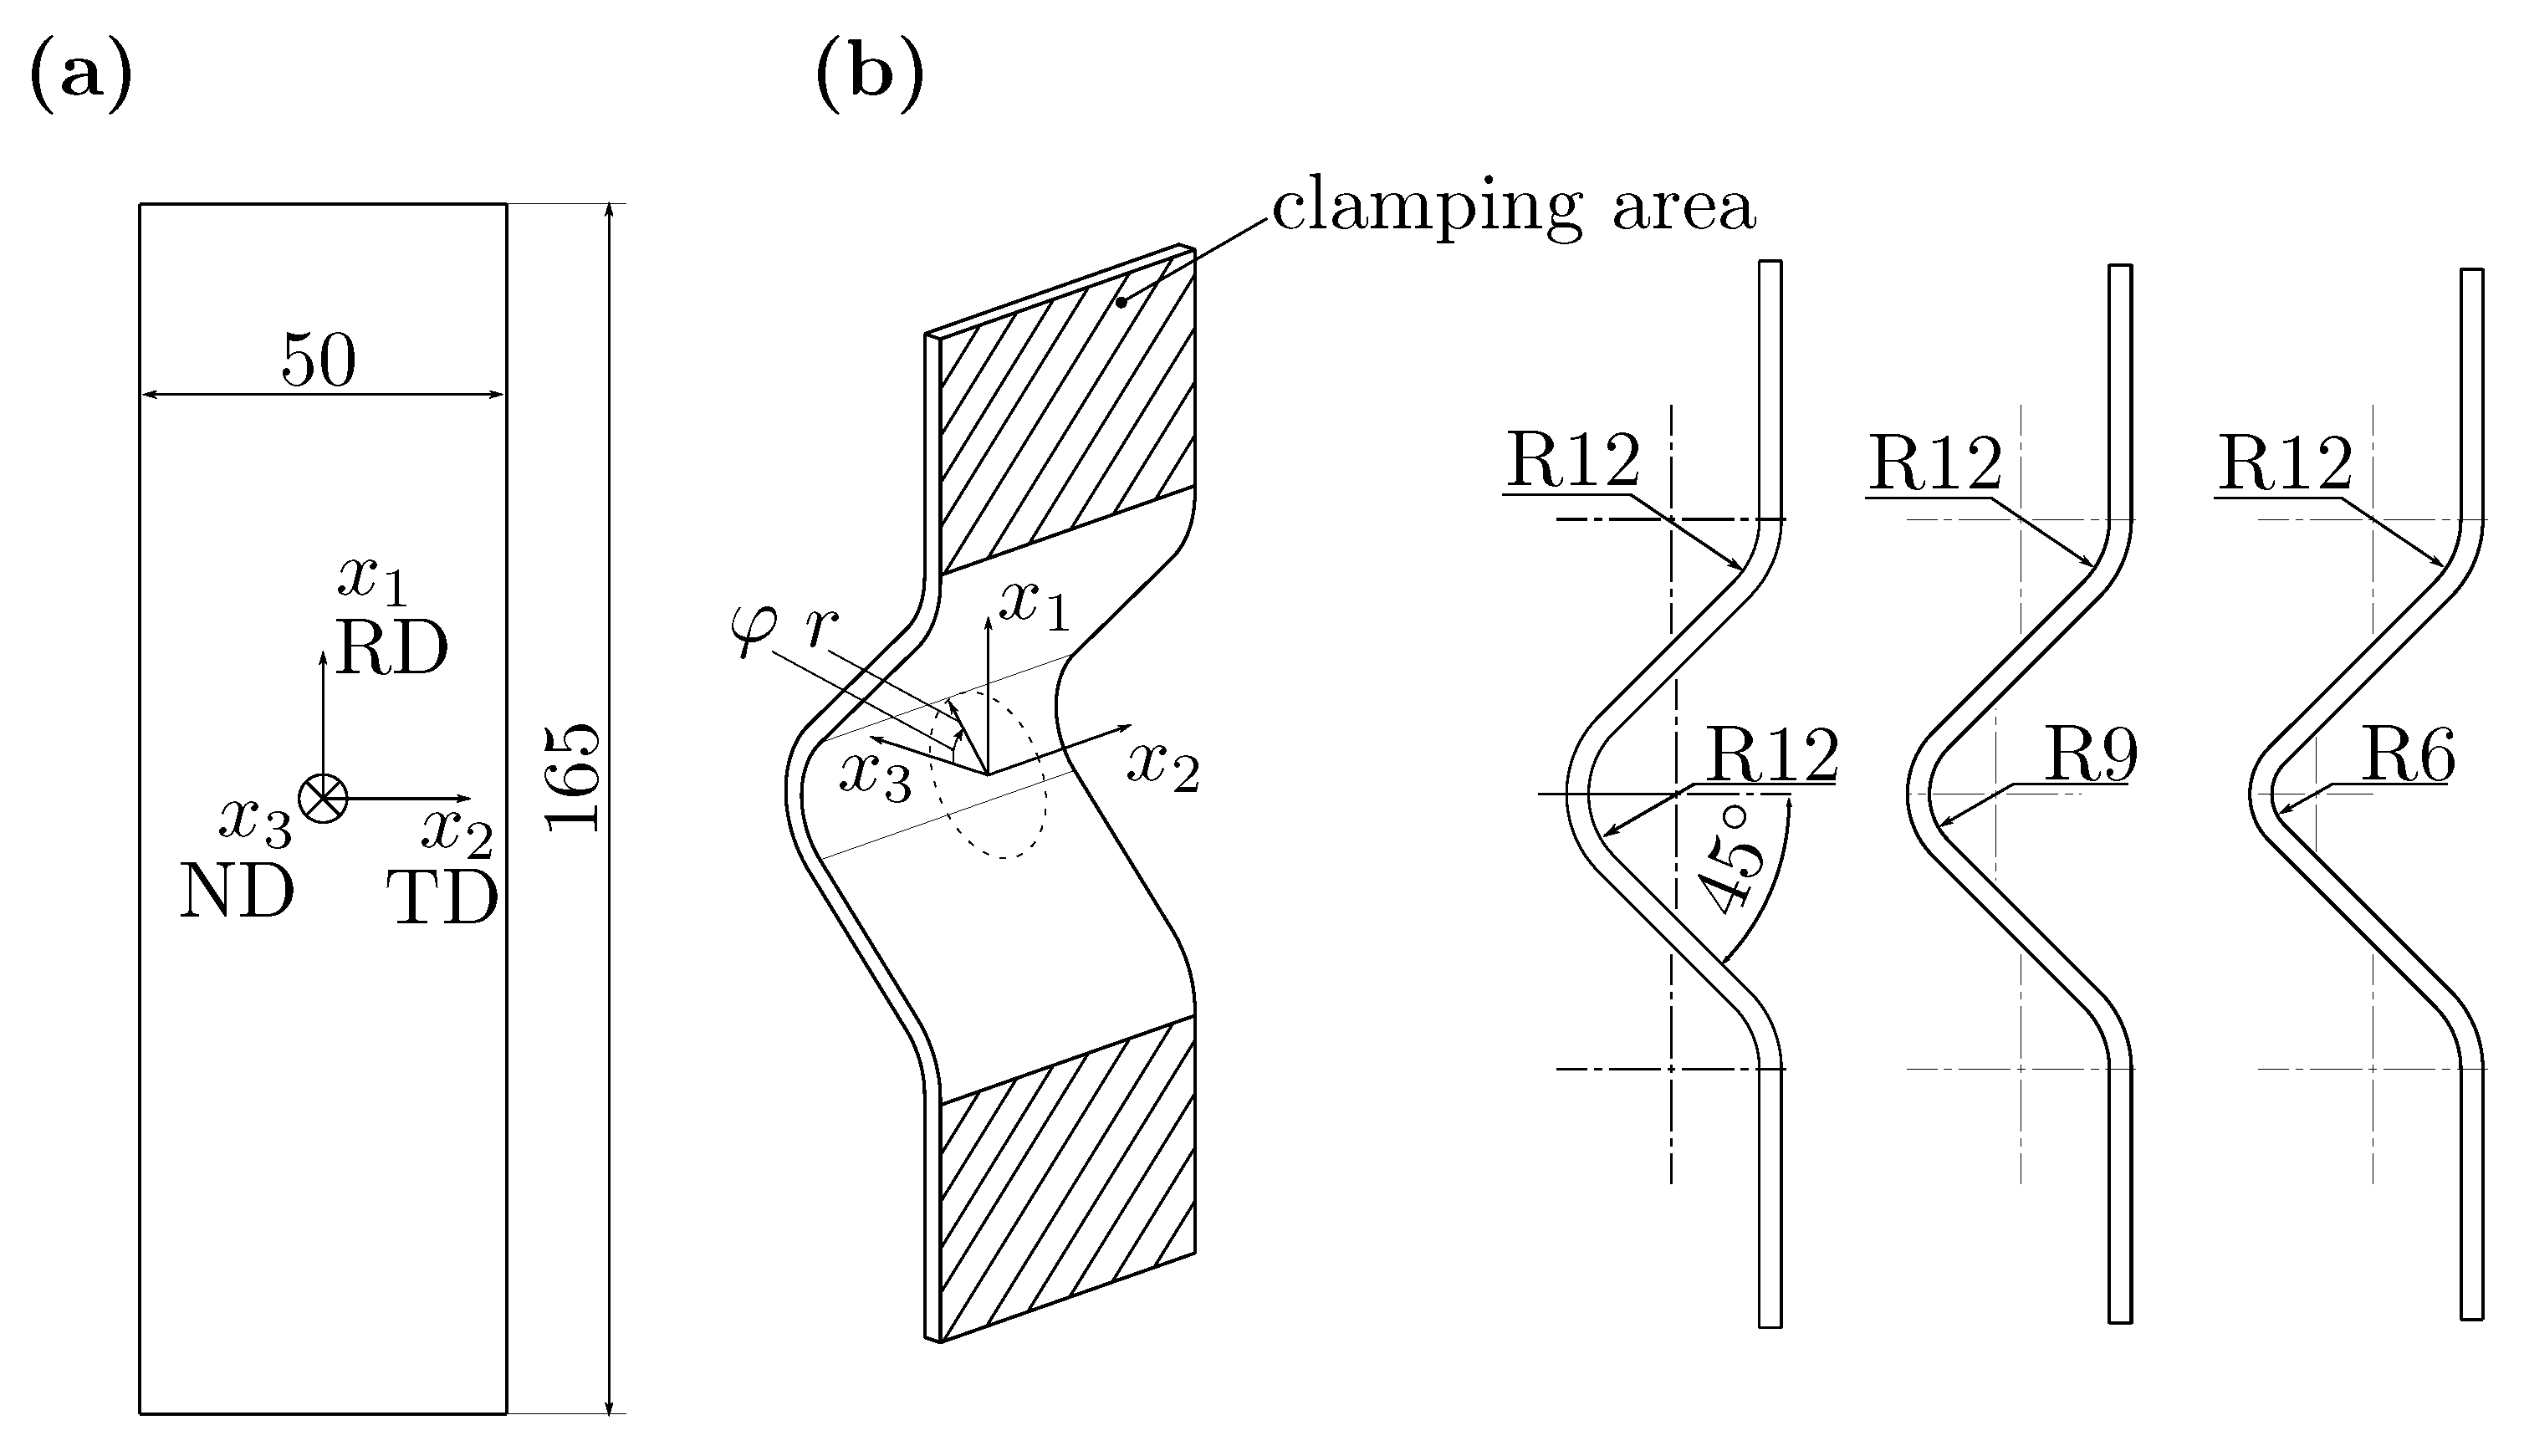
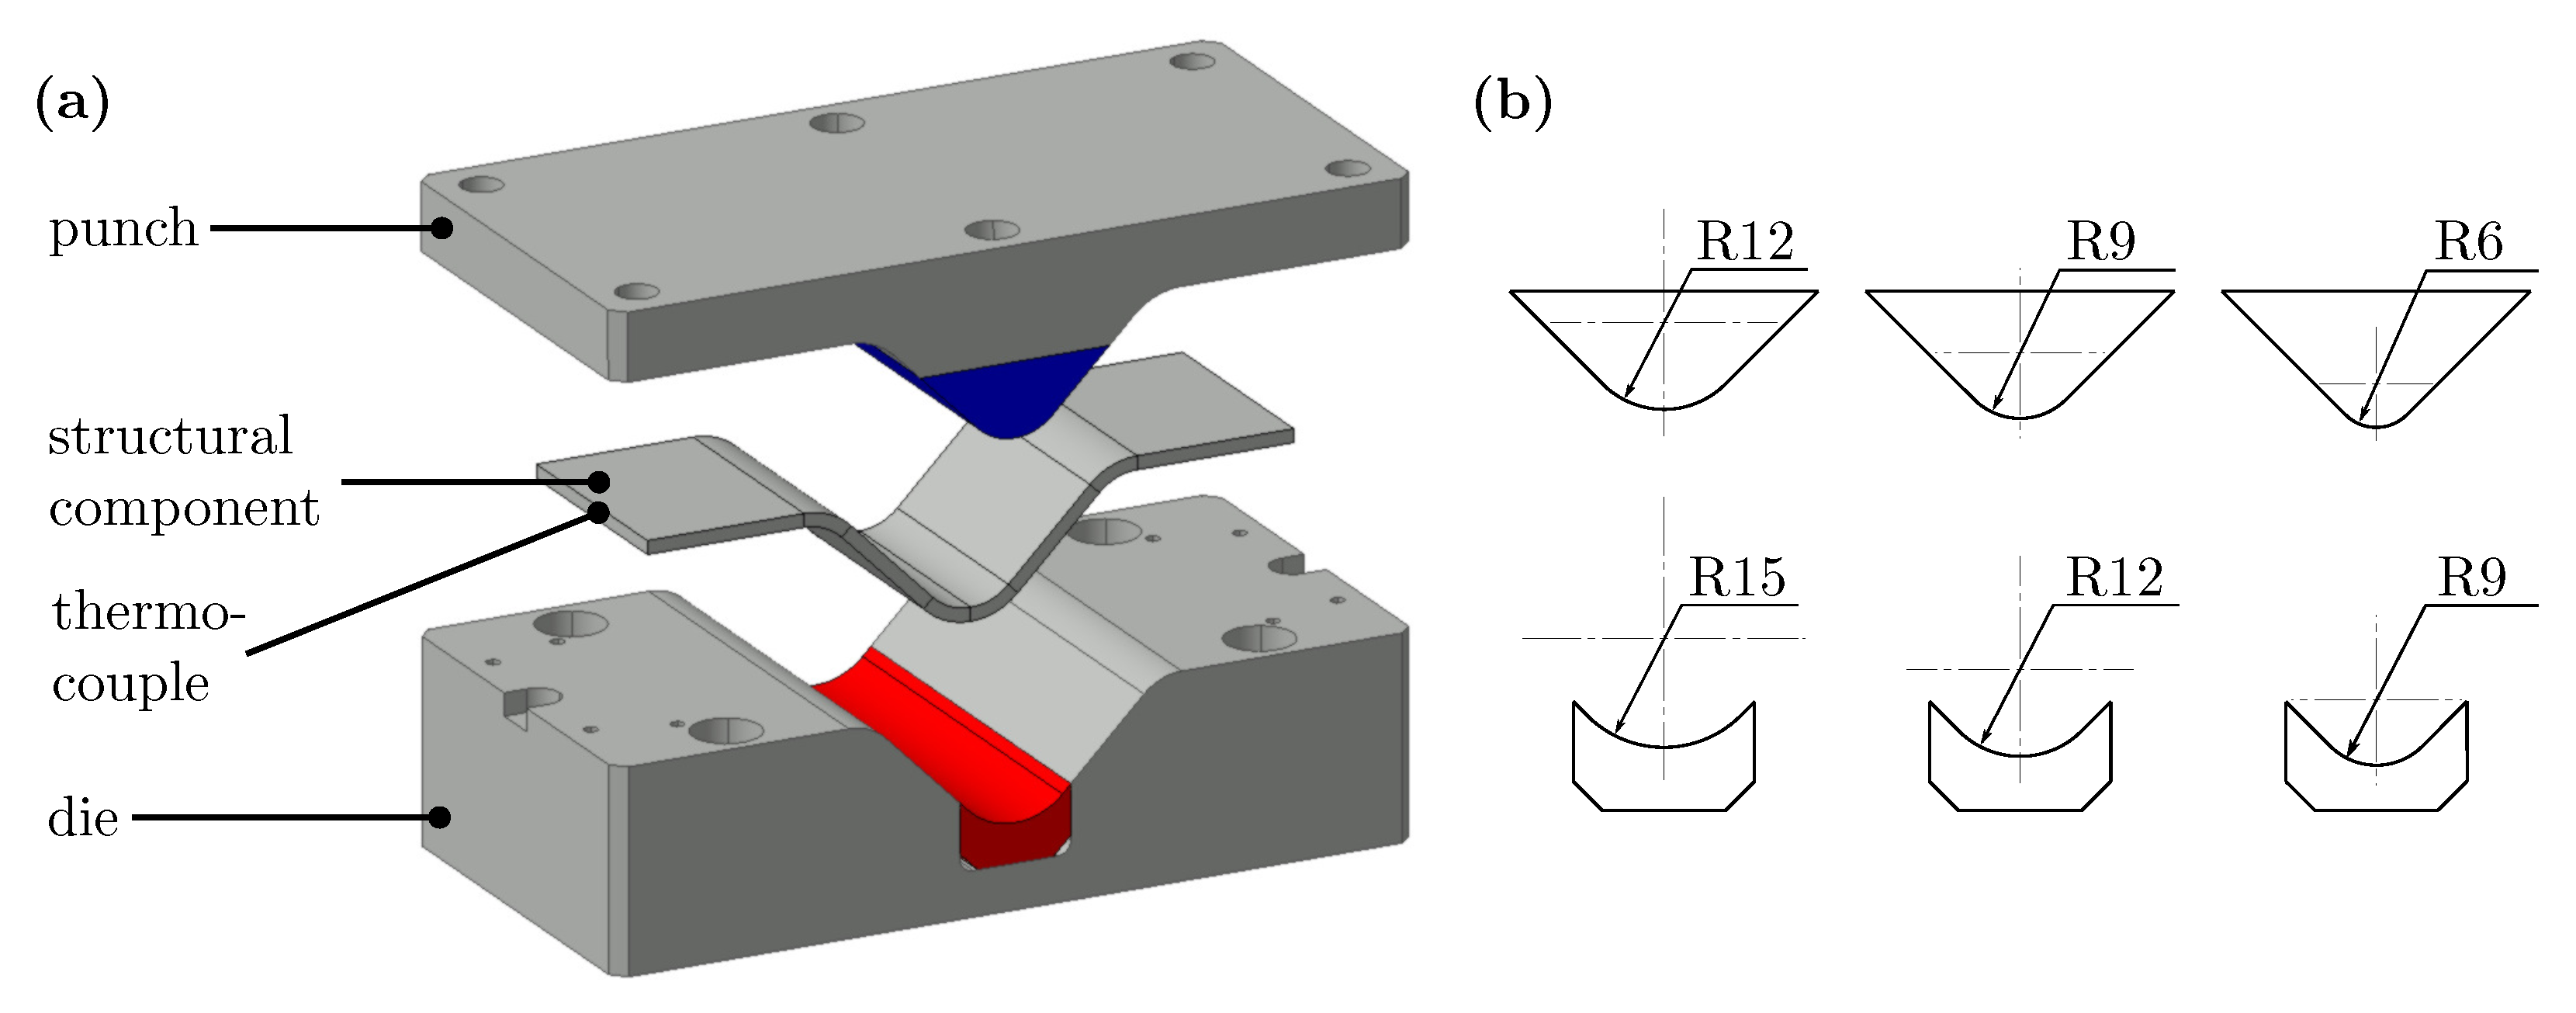
2.1. Hot Bending Process

V-shaped structural components were made from a 3 m m thick planar twin-roll cast AZ31B magnesium sheet. The as-received material with the chemical composition given in Table 1 was produced by Magnesium Flachprodukte GmbH, Freiberg, Germany.
To fabricate the blanks of the structural components shown in Figure 1a, 165   m m × 50   m m (length × width) sheet metal strips were cut from the planar twin-roll cast AZ31B magnesium sheet. To investigate different degrees of deformation, the three variants of the structural component specimen shown in Figure 1b were produced, which differ in the gauge area by the respective bending radius R BS 6 = 6   m m , R BS 9 = 9   m m and R BS 12 = 12   m m . Here, the abbreviation BS stands for bent specimen, and the following number for the respective bending radius of the specimen variant. The gauge area corresponds to the concave surface on the inside of the specimens. To describe the field quantities within the gauge area, the cylindrical coordinate system ( r , φ , x 2 ) shown in Figure 1b is defined. The radial coordinate r describes the normal direction, the angular coordinate φ the rolling direction and x 2 the transverse direction of the sheet. Due to the specimen geometry, which corresponds to a quarter-tube element, the field quantities evaluated in this coordinate system are valid only for 45 φ 45 .
To create the V-shaped specimens, the blanks were hot-bent using a Langzauner LZT-OK-50-L heating press. For this purpose, the forming tool shown in Figure 2 was developed and manufactured. To produce the respective specimen geometry, the parts of the punch and die shown in blue and red are modularly exchangeable. The blanks were provided with a hole for a thermocouple on one end face, as indicated in Figure 2. First, the heating press including the forming tool was heated to the bending temperature, T B = 230   C ; then, a blank was inserted. After the blank reached T B , the bending process was carried out at a feed rate of v f = 5   m m   s 1 .

2.2. Microstructural Investigations

Microstructural investigations were carried out to study the influence of the bending process on the microstructure and the evolution of the microstructure after cyclic loading. For specimen preparation, the gauge area to be examined was first separated from the rest of the specimen and cut into 12.5   m m large pieces with respect to the x 2 dimension. Subsequently, the sample parts were embedded with the 2-component cold embedding material CEM3070 from the manufacturer Cloeren Technology GmbH (Wegberg, Germany). This was followed by several grinding and polishing steps, for which the grinder and polisher Struers RotoPol-11 was used in combination with the specimen mover RotoForce-1.
The specimen preparation for the microstructural investigations with the light microscope was divided into four different grinding and polishing processes. In the first step, the specimens were ground with a P1200 grit SiC abrasive paper for one minute with a contact force F cf = 25   N , a rotational speed of 300 min 1 and the use of deionized water as a lubricant and coolant. Subsequently, another grinding step was performed with a Struers MD-Largo fine grinding wheel at a contact force F cf = 40   N for three minutes, using a diamond suspension as a lubricant with a particle size of 9 μ m . To polish the specimen surfaces, the MD-Mol polishing cloth was used with a contact force F cf = 25   N and a 3 μ m diamond suspension for a duration of five minutes. The polishing process was completed using the MD-Chem polishing cloth with a contact force of F cf = 15   N , a 0.04   μ m Si-suspension and a duration of 90 s. The last three steps were each performed at a speed of 150 min 1 . During the process, the specimens were cleaned in an ultrasonic bath filled with ethanol at the end of the respective grinding or polishing time.
For light microscope analysis, the sample surfaces were chemically etched. The etchant consisted of a mixture of 40 m L of 4% alcoholic picric acid, 5 m L of 99% acetic acid and 5 m L of distilled water. The etching time was approximately 2–3 s. The digital microscope DVM6 A from the manufacturer Leica Microsystems GmbH was used to acquire microstructure images by light microscopy.
For electron backscatter diffraction (EBSD) analysis, the same samples were used and the surfaces were prepared with the following 3 steps. The specimen were ground with a P4000 SiC abrasive paper for two minutes with the contact force F cf = 5   N , a rotational speed of 150 min 1 and deionized water as lubricant and coolant. In the second step, the samples were treated with the polishing cloth MD-Chem for 2 min, a contact force F cf = 5   N and a rotational speed of 150 min 1 . In this step, a lubricant consisting of 50% 0.04   μ m Si-suspension and 50% deionized water was used. The last step is the same as the previous one, except that a custom-made polishing agent consisting of 99.33% deionized water and 0.66% 0.04   μ m Al 2 O 3 particles was used as lubricant and coolant. Between all steps, the samples were cleaned in an ultrasonic bath filled with deionized water to remove large particles. Subsequently, EBSD measurements were performed using a Zeiss Merlin compact VP scanning electron microscope equipped with an Oxford Instruments EBSD detector (Abingdon, UK). The measurements were carried out with an acceleration voltage of 20   k V and a 120   μ m aperture, and the data were analyzed using the software ATEX© [24].
All microstructural investigations were performed at the center of the structural components at x 2 = 0   m m .

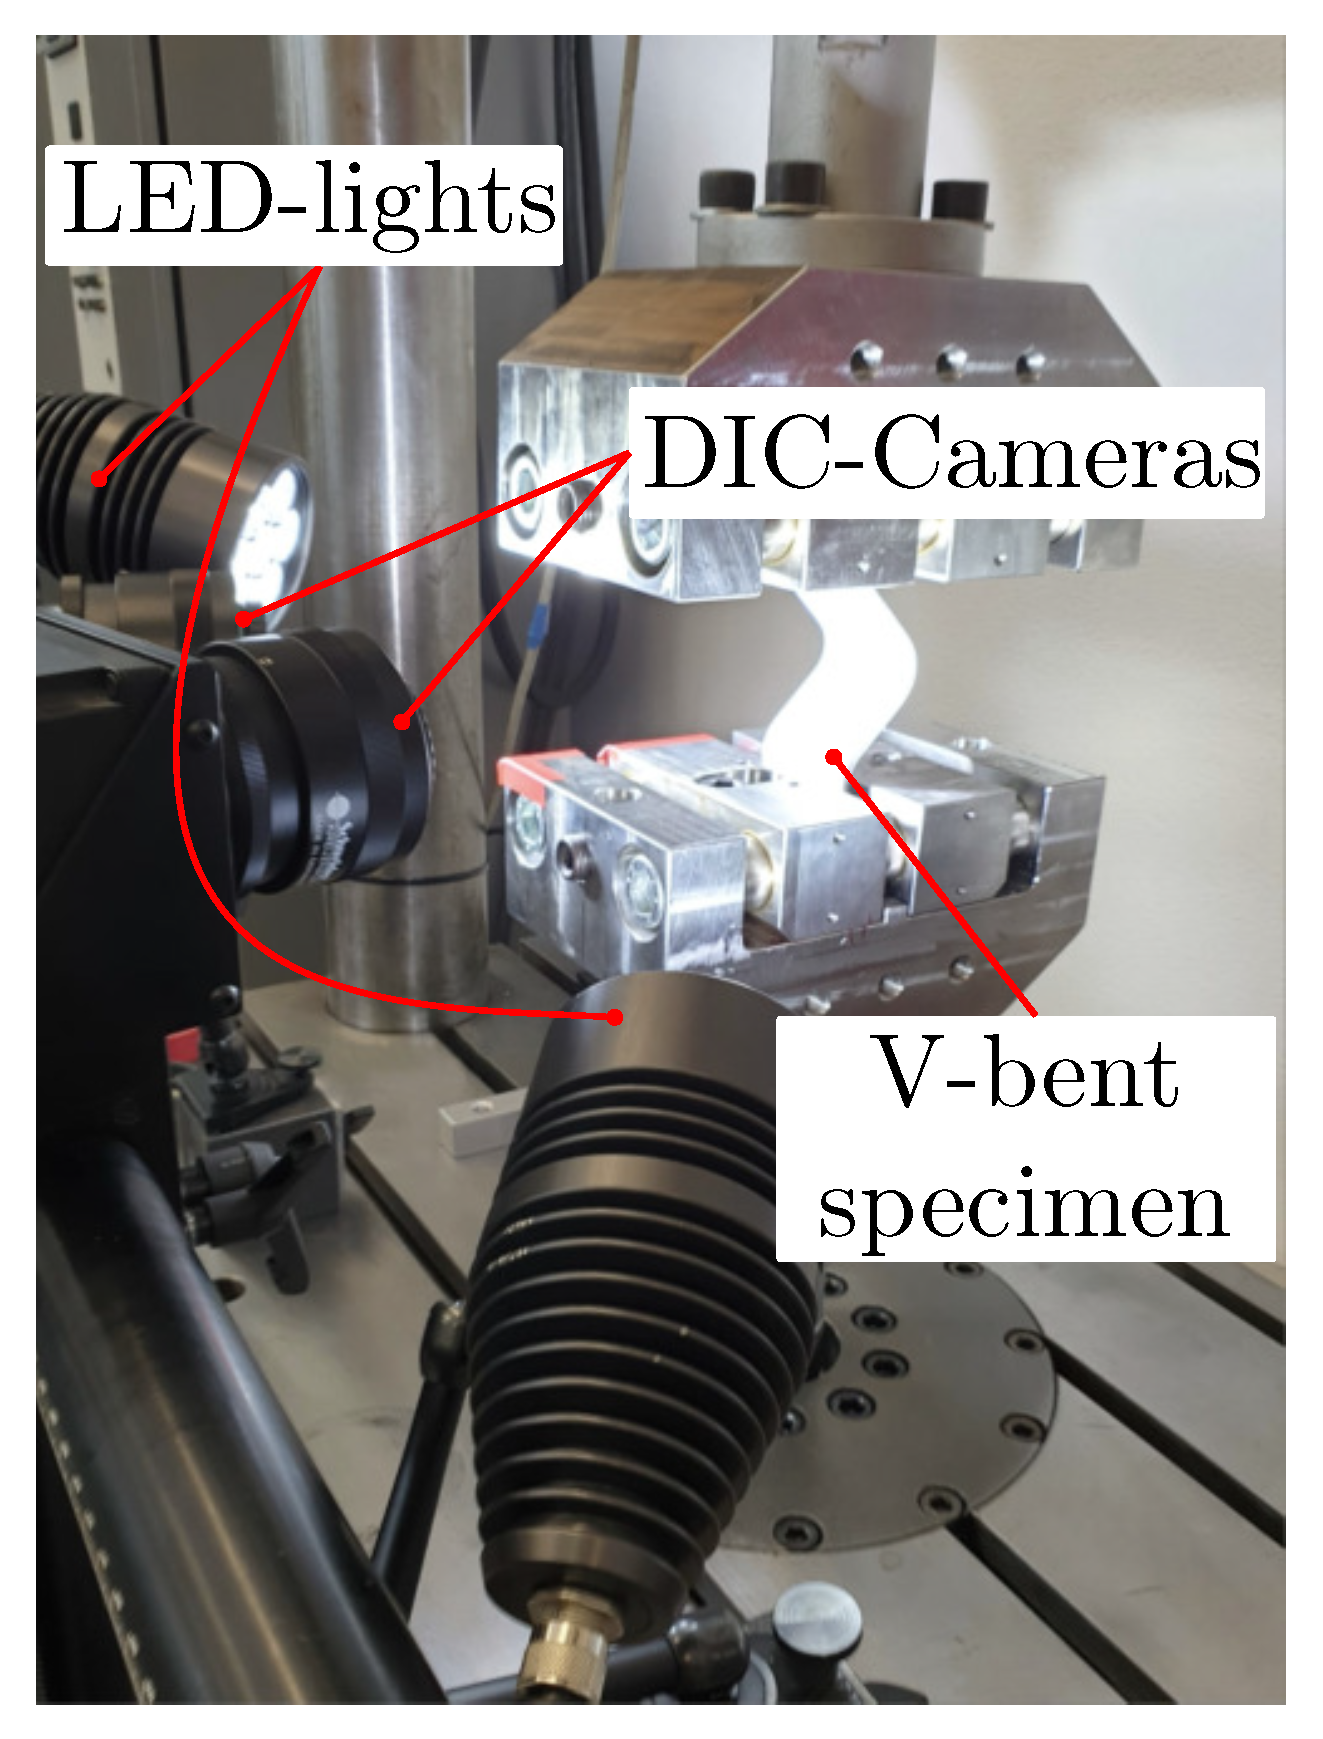
2.3. Low-Cycle Fatigue Tests at Room Temperature

Several low-cycle fatigue tests at room temperature were performed on the hot-bent structural components using a uniaxial servohydraulic test rig, shown in Figure 3. The test rig was equipped with a 25 k N Schenk cylinder and a 25 k N Instron load cell type 2526-804. Since the use of an extensometer is not possible due to the specimen geometry, the cyclic tests were force-controlled at a constant force ratio R F = 1 at three load levels F a per variant. Via 3D digital image correlation (DIC) measurements with the 3D optical measurement system GOM Aramis 12M (Braunschweig, Germany) using two Schneider-Kreuznach Componon-S 2.8/50 m m camera lenses, the strain fields in the upper and lower load levels as well as in the unloaded state of the specimens were calculated during the tests. The generated data were subsequently analyzed for application of the CH ε V with a custom-developed software using Python™ 3.8.10. To determine the number of cycles to failure N f , the initial stiffness of the structural components was calculated using the digital measurement and control system Inova EU3000RTC and continuously compared with the current stiffness. The number of cycles to failure N f corresponds to the number of cycles at which the current stiffness is less than 95% of the initial stiffness.

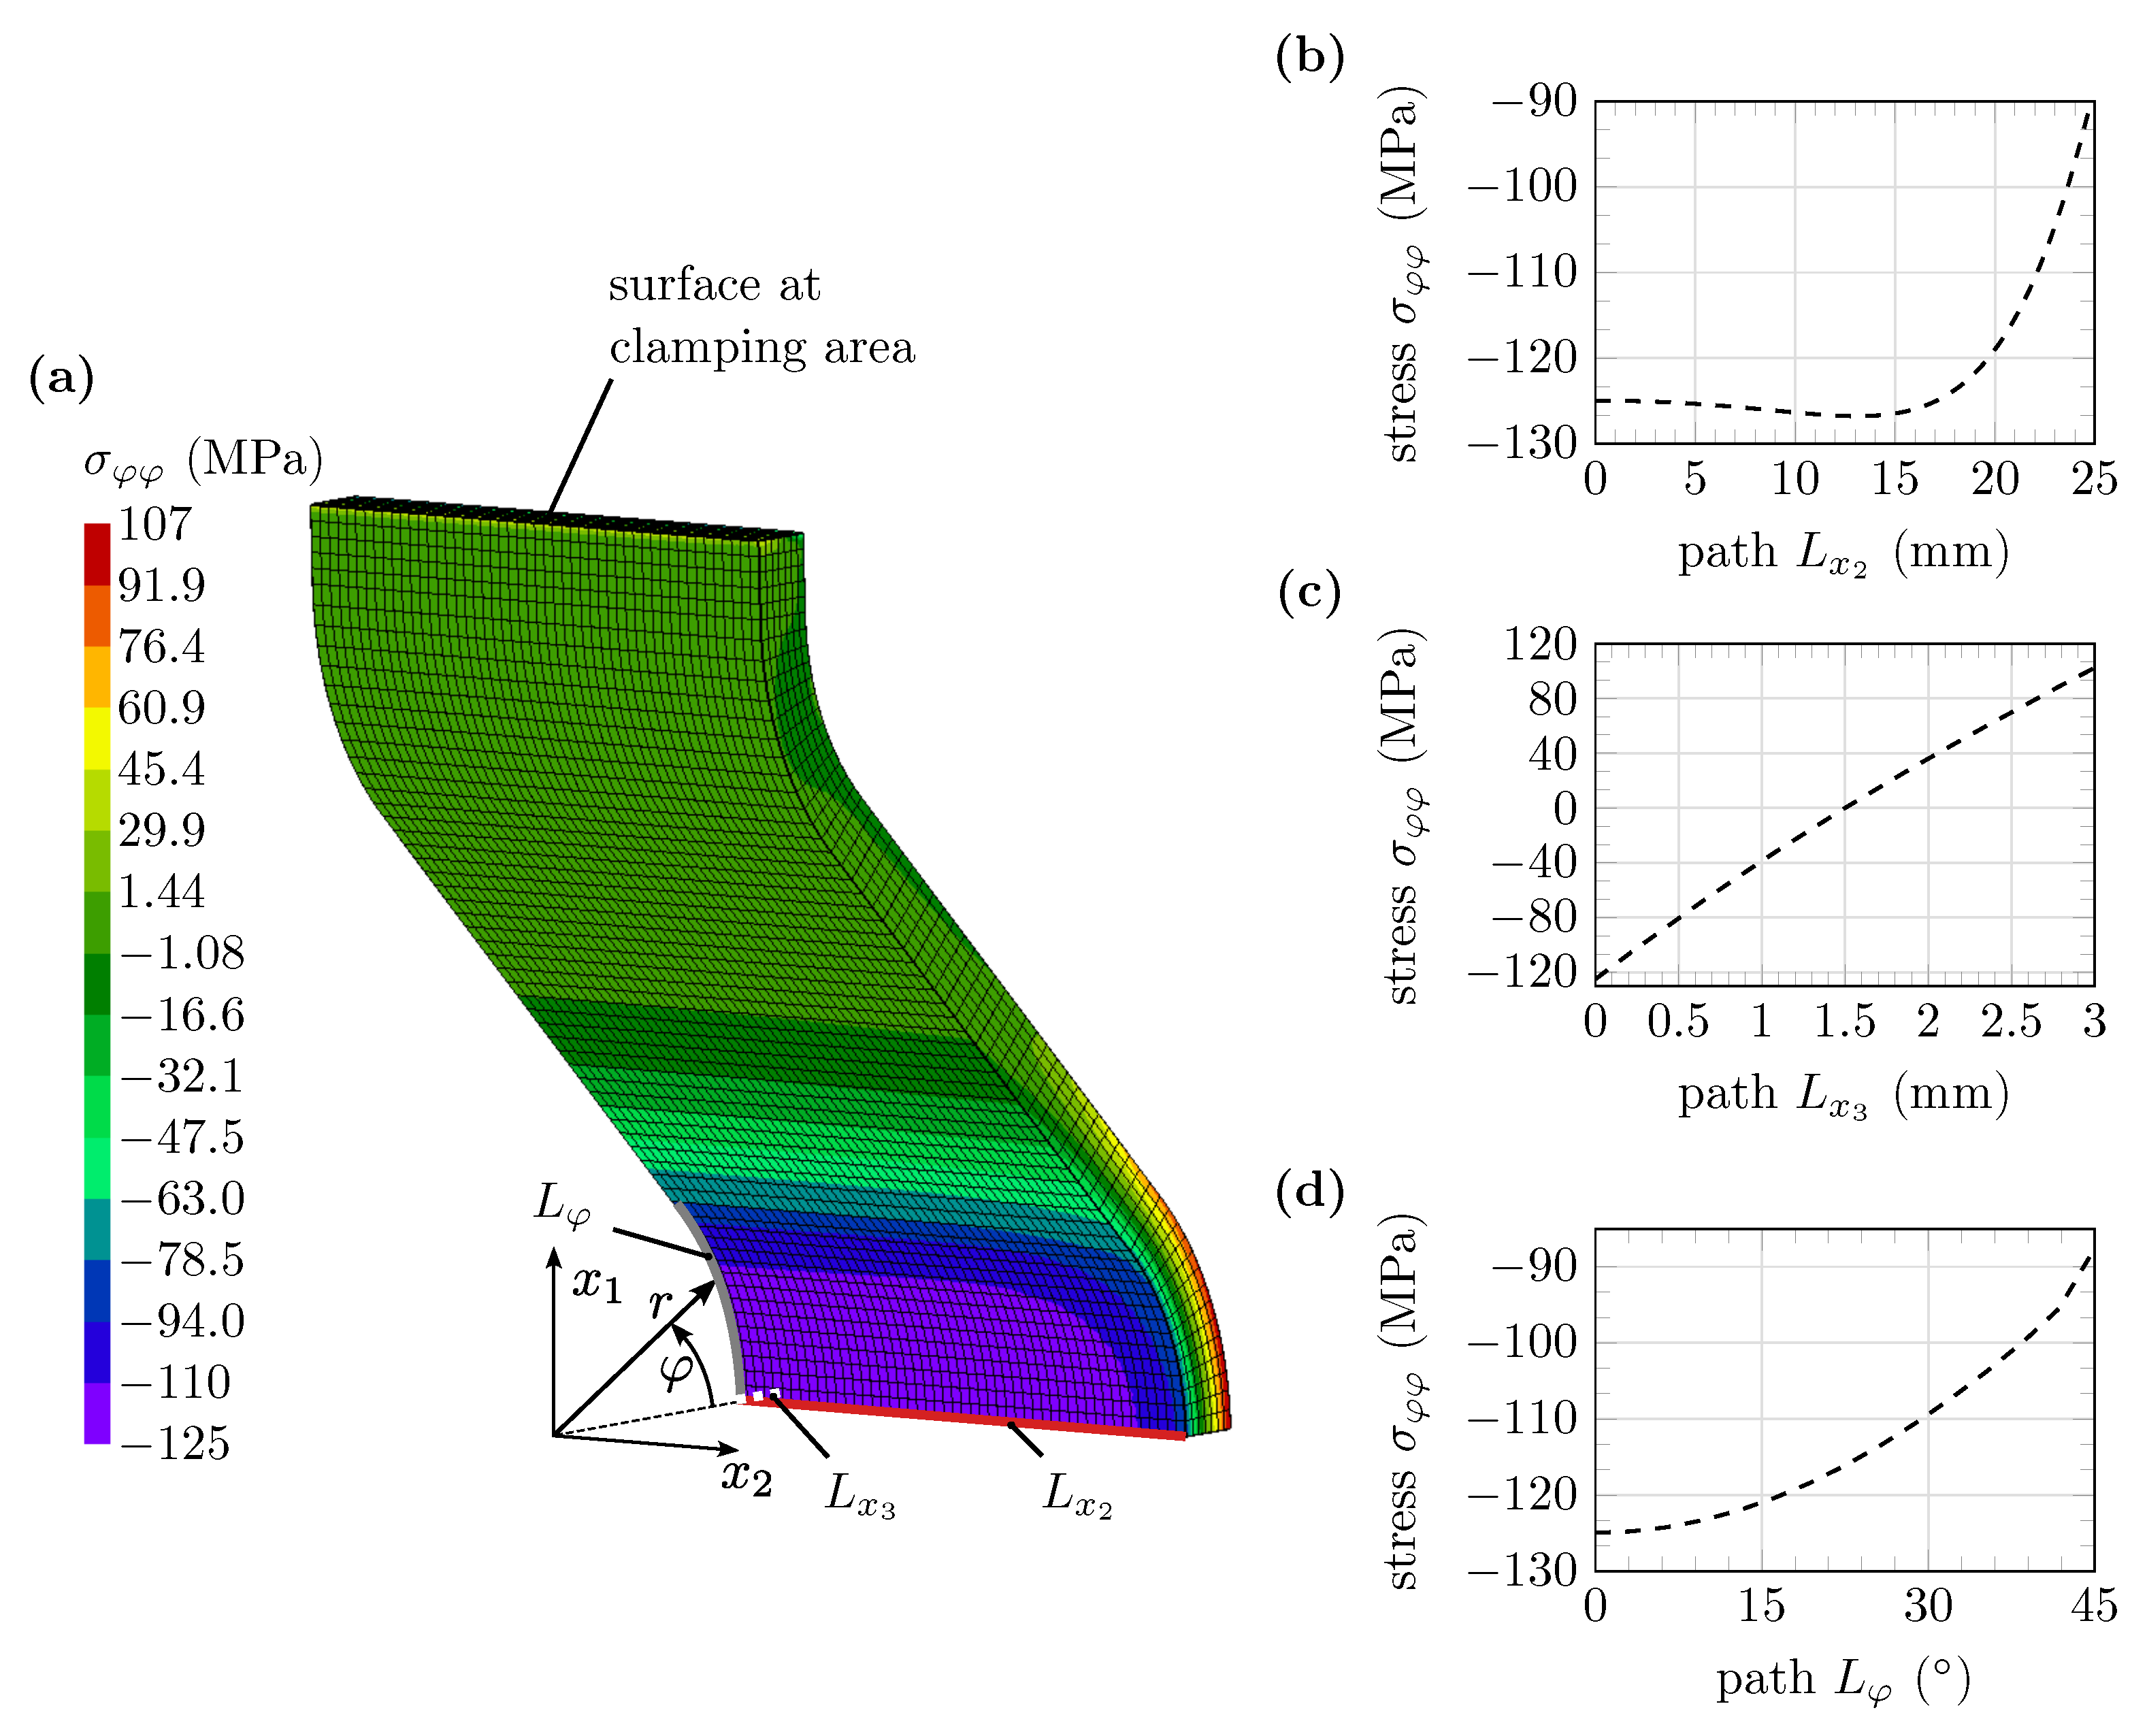
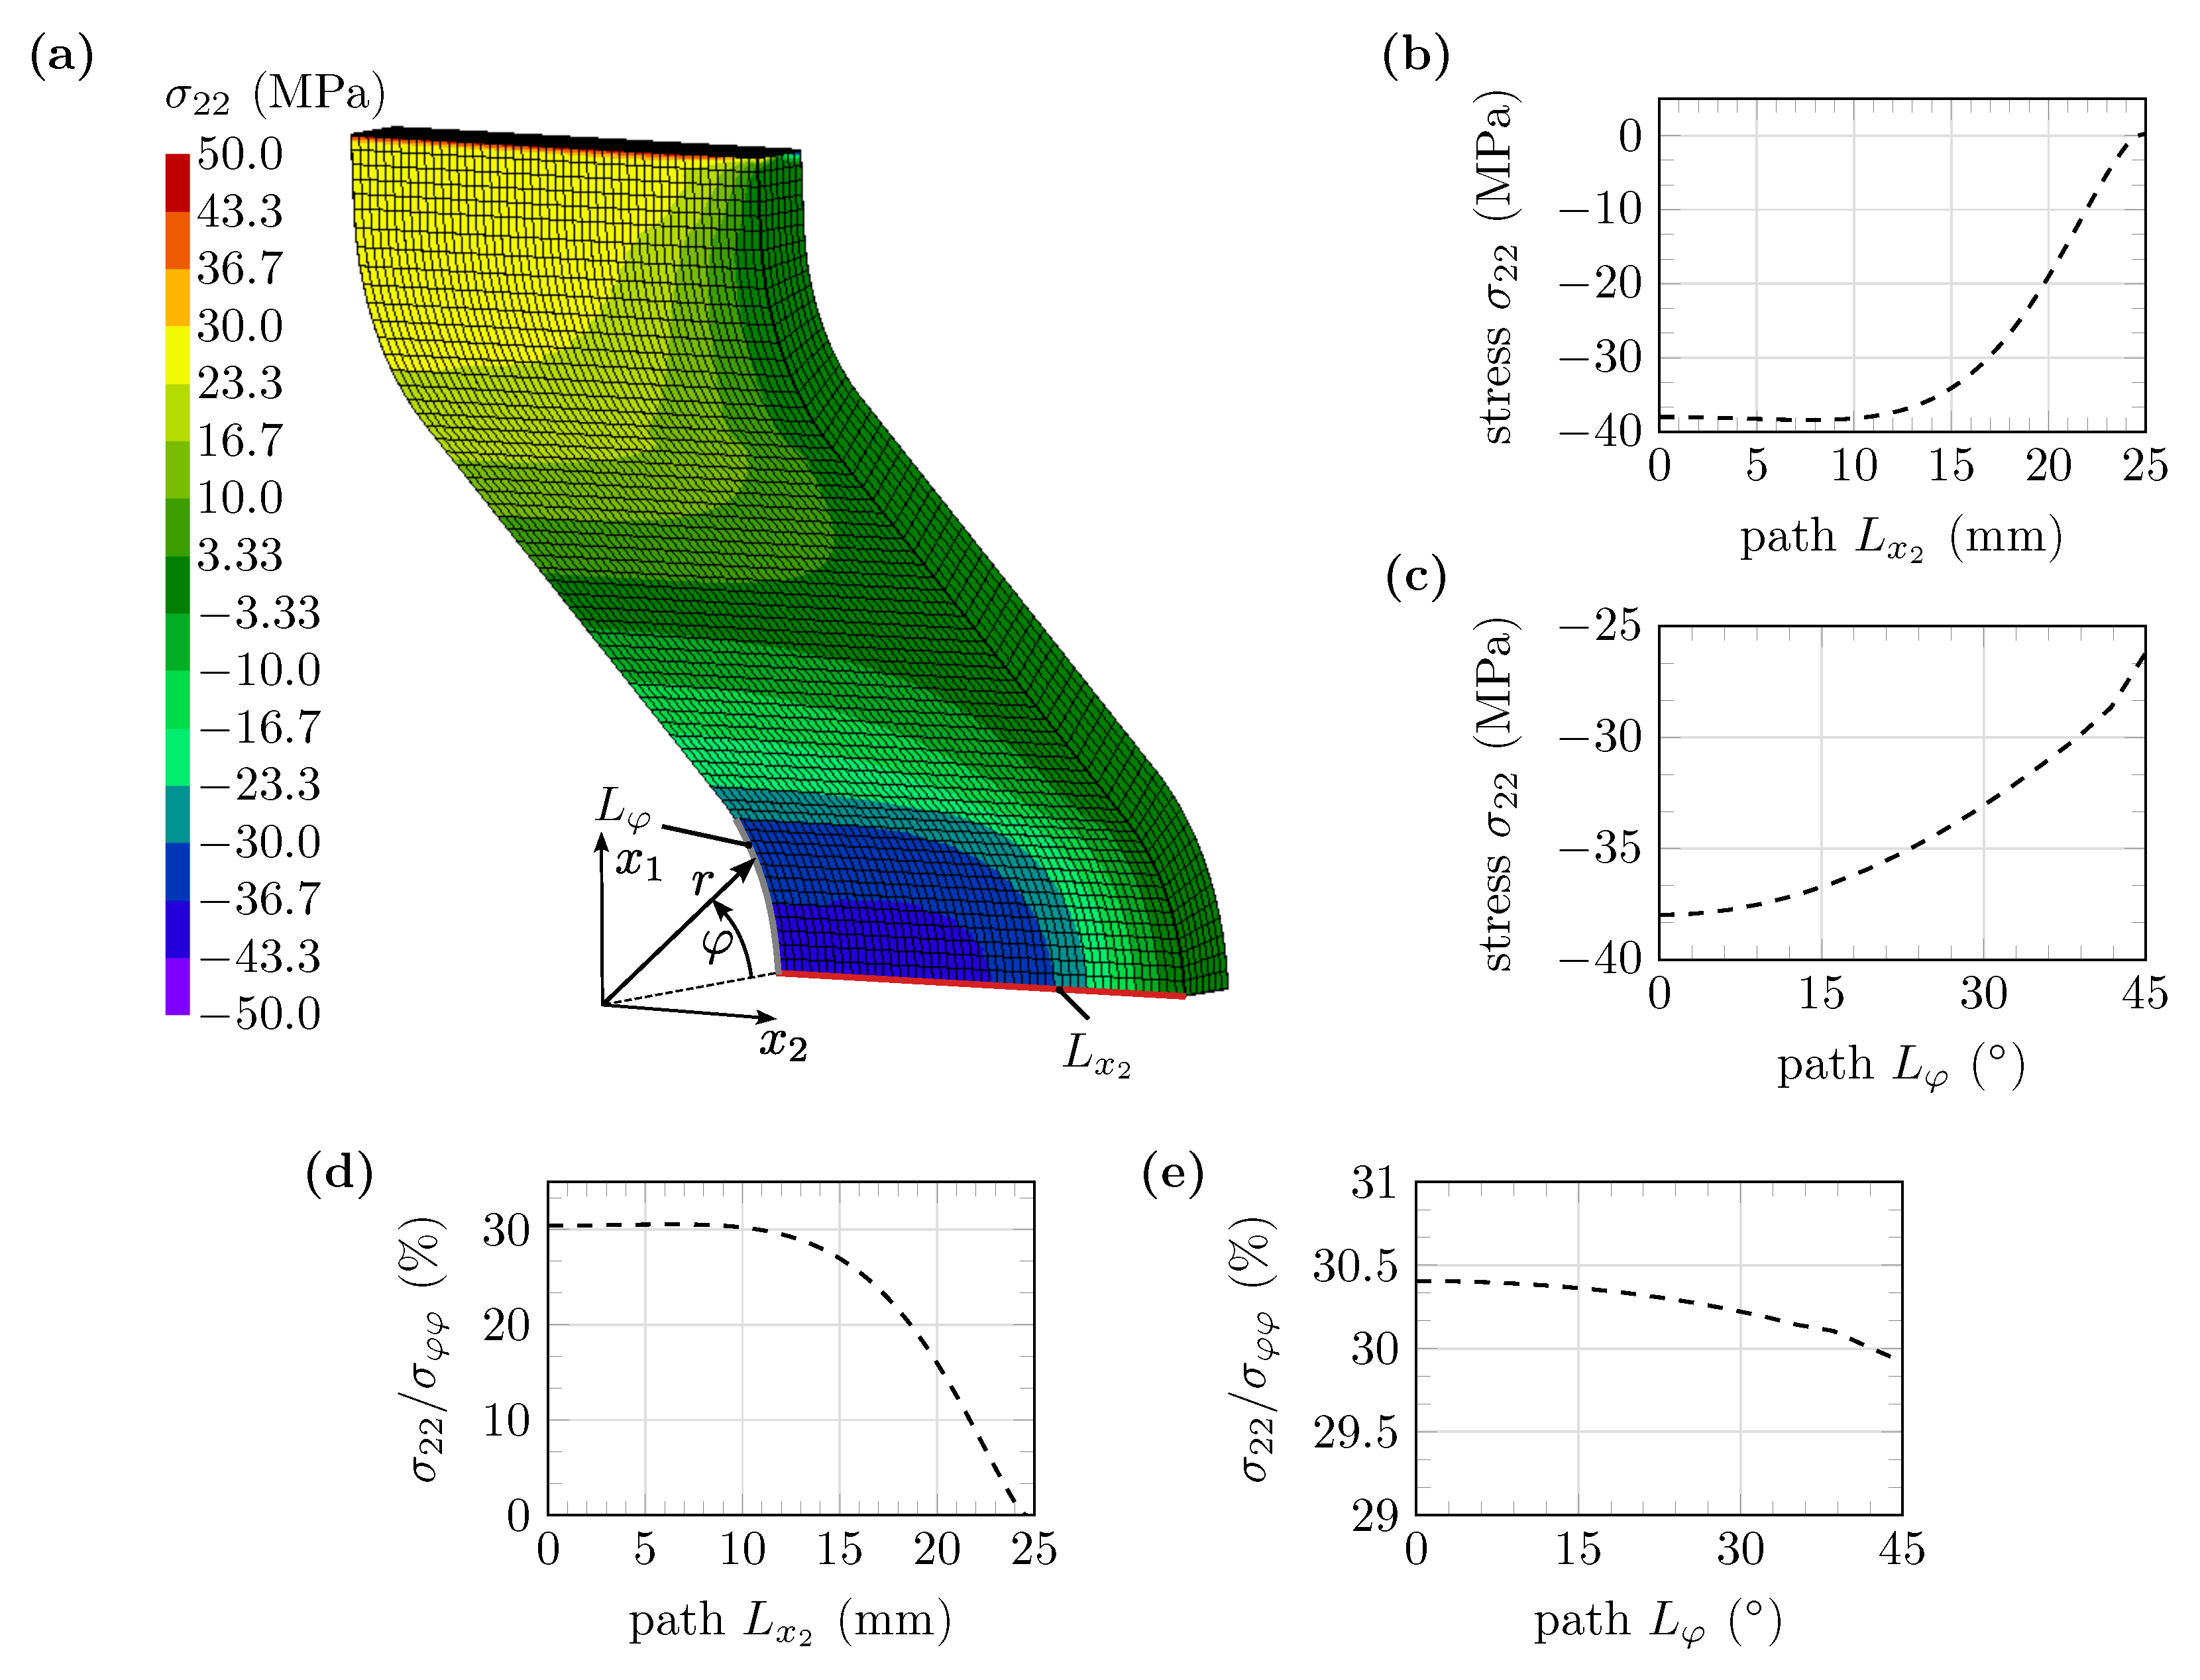
3. Numerical Simulation of the Novel Hot-Bent Structural Component

Due to the specimen geometry, a multiaxial stress state is expected. To analyze this stress state, a finite element method (FEM) simulation was performed with the open-source software CalculiX on a quarter model of a specimen with bending radius R BS 12 = 12   m m shown in Figure 4a, using specimen symmetry in the x 1 x 3 and x 2 x 3 plane. The clamping area of the structural component specimens marked in Figure 1b was not discretized for the simulation. Instead, the nodes of the surfaces at the end of the clamping area, which is perpendicular to the rolling direction of the sheet, were kinematically coupled with a reference node. As boundary conditions, the displacements u 1 in the x 2 x 3 plane and u 2 in the x 1 x 3 plane were set to u 1 ( x 1 = 0   m m , x 2 , x 3 ) = u 2 ( x 1 , x 2 = 0   m m , x 3 ) = 0 . For the reference node, 5 degrees of freedom u i = 0 ( i = 2 , , 6 ) were defined and a compression load F = 275   N in the x 1 direction was applied. For the simulation, a linear–elastic constitutive law with a Young’s modulus E = 41,067 MPa and a Poisson’s ratio ν = 0.3 was used [13], taking geometric nonlinearity into account.
Figure 4a shows the stress field σ φ φ ( r , φ , x 2 ) of the FEM calculation. This shows that a superimposed stress state consisting of compressive stress and bending stress occurs in the gauge area. Figure 4b shows the distribution of the stress σ φ φ along the path L x 2 , which has its origin on the inner surface of the specimen at r = 12   m m , φ = 0 and x 2 = 0   m m . The stress σ φ φ is approximately constant up to L x 2 15   m m . Figure 4c shows the detailed distribution of the stress σ φ φ along the path L x 3 . The absolute value of the stress | σ φ φ ( L x 3 = 0   m m ) | = 124.95   M Pa on the concave side of the specimen is ≈22% larger than the value of the stress σ φ φ ( L x 3 = 3   m m ) = 105.25   M Pa on the convex side since compressive stresses and bending stresses are superimposed here. Figure 4d shows the distribution of σ φ φ along the path L φ where it can be seen that the absolute value of σ φ φ is largest at the center of the sample at φ = 0 .
Figure 5a shows the stress field σ 22 ( r , φ , x 2 ) . Analyzing the stresses σ φ φ and σ 22 along the path L x 2 presented in Figure 4b and Figure 5b, a multiaxial stress state in the gauge area for x 2 < 25   m m can be seen under simulated compressive loading. The stress ratio σ 22 / σ φ φ over the path L x 2 is shown in Figure 5d. It can be seen that up to L x 2 10   m m a constant multiaxial stress state along x 2 prevails. In Figure 5c, the stress σ 22 is plotted over the path L φ , which shows that the absolute value of σ 22 is largest at φ = 0 , similar to σ φ φ in Figure 4d. Furthermore, Figure 5e shows that the stress ratio σ 22 / σ φ φ over the path L φ is largely constant in the entire gauge area. The cyclic tests should be performed in the LCF range. Therefore, the FEM was additionally used to estimate, for each specimen variant, the minimum force amplitude necessary to induce plastic material behavior under compressive loading in the rolling direction of the sheet. It was assumed that plastic deformation occurs when the compressive stress at the center on the inside of the specimen is σ φ φ ( r = R , φ = 0 , x 2 = 0   m m ) 125   M Pa . This value corresponds to the smallest absolute compressive yield stress σ Y of the hot-bent uniaxial specimens in [13]. With this assumption, the respective minimum compressive yield forces for initial yielding F Y , BS 12 = 550   N , F Y , BS 9 = 506   N and F Y , BS 6 = 451   N were determined. Although the yield stress assumption created with data from [13] is the compressive yield stress in TD, the lowest load levels used in the cyclic tests will be at least 36% higher than the respective calculated yield forces. This ensures that each test is within the LCF range.

4. Results and Discussion

4.1. Microstructural Analyses

Figure 6a,b show microstructural images of the structural component specimen BS9-003 with bending radius R BS 9 = 9   m m at the specimen center at x 2 = 0   m m after the hot-bending process. The images were taken by light microscope and the viewing direction corresponds to the x 2 -direction of the Mg-sheet. The bending process induces a tensile load on the convex side and a compressive load on the concave side in RD. In Figure 6a, line-shaped macroscopic bands of twinned grains are visible in the gauge area 45 φ 45 , which spread out at an angle of about 45 to sheet normal in the sheet thickness direction. The reason for this is the compressive stress in RD during the bending process, which favors the formation of { 10 1 ¯ 2 } tension twins [7]. In contrast to [14,15], no bands of twinned grains (BTGs) are formed perpendicular to the visible BTG. Since an inhomogeneous bending stress occurs over the specimen thickness, the BTGs, unlike in [13], do not extend across the entire thickness of the structural component but only extend approximately 1 m m in the sheet thickness direction beginning from the sheet surface on the concave side. Outside the gauge area, only isolated BTGs can be observed on the concave side and their occurrence decreases rapidly with increasing angular coordinate φ . This is another indicator that the occurring compressive bending stress is the cause of the formation of the BTG.
Figure 6b shows a 620   μ m × 450   μ m section of an area where BTGs with an increased density of twinned grains occur. Two twinned areas can be seen in Figure 6c. Similar to the hot-bent uniaxial specimens made of AZ31B investigated in [13], deformed and serrated grain boundaries can be seen due to dynamic recrystallization at low temperatures during the bending process [25]. This effect increases for x 3 * 500   μ m , as can be seen in Figure 6b. The reason for this may be the increasing degree of deformation with increasing x 3 * .
Figure 7a,b show 200   μ m × 282   μ m (ND × RD) EBSD orientation maps of the specimen BS9-003 after the bending process in the compression layer with reference view in ND and in RD, respectively. The working distance in this EBSD measurement was ≈ 17.0   m m . Similar to Figure 6b,d, a BTG is visible in Figure 7a,b, which is formed during the bending process. In addition, it can be seen that the c-axes of the unit cells in this band tilt towards RD. Figure 7d shows the band contrast with detected { 10 1 ¯ 2 } tension twins, which are marked with red lines. As detection criterion, the misorientation angle of 86.3 ± 5.0 is used. The area of high twin density is bounded by two green lines. Outside this region, only scattered twins have been detected. Figure 7c shows a 40   μ m × 65   μ m (ND × RD) orientation map within the BTG with visible twins. Although not all grains are twinned, the majority of the unit cells have changed orientation after the forming process, thus dissolving the initial strong texture. Figure 8b shows the ( 0002 ) pole figure with view in the TD of the EBSD measurements represented in Figure 7a,b,d. For comparison, Figure 8a represents the ( 0002 ) pole figure of the as-received material with view in the ND, in which almost all c-axes of the unit cells point in the ND and the typical { 0002 } ND basal texture can be confirmed with a maximum intensity of ≈ 14.92 [13]. After the bending process, the basal texture has a maximum intensity of ≈ 5.18 , approximately 2.88 times weaker than the basal texture of the as-received material.
Figure 9a shows the gauge area of the structural component BS9-008 with bending radius R BS 9 = 9   m m after cyclic loading with a force amplitude of F a = 1104   N and a force ratio of R F = 1 . The specimens were removed from the testing machine in such a way that the concave side was the last to be subjected to compressive load in RD. Several surface cracks can be seen, which propagate from the concave side to the convex side of the specimen. The largest crack, which developed from the first crack that appeared, is observed in the center of the structural component at φ = 0 . This can be explained by the fact that, at φ = 0 , the absolute values of the two normal stresses σ φ φ and σ 22 are highest.
When comparing Figure 9 with Figure 6a, it is noticeable that neither on the concave nor on the convex side can BTGs be seen. The reason for this is that grains, which are not twinned after the bending process in the area with low twin density, twin during cyclic loading because of compressive stresses in RD. The occurrence of twins distributes evenly after cyclic loading. Figure 9b shows the largest crack in the specimen, with the crack tip and the origin of the crack magnified in Figure 9c,d, respectively. Looking at Figure 9c,d, a high density of twins can be observed. Since the frequency of BTGs in the gauge area is very high, it can be assumed that the first crack occurs in a band of twinned grains. This coincides with the results of Denk et al. in [23], which show that the first crack in cyclic loaded uniaxial non-bent specimens also occurs in BTG. The crack propagation is perpendicular to the largest normal stress σ φ φ .
Figure 10a,b show a 200   μ m × 450   μ m (ND × RD) and a 40   μ m × 65   μ m (ND × RD) EBSD orientation map with view in TD, respectively. The investigated specimen is the structural component specimen BS9-008 after cyclic loading with R F = 1 and F a = 1104   N . The working distance is ≈ 16.0   m m and the observed area is located at approximately 500   μ m in the RD from the center of the crack in the compression layer of the last cycle. Figure 10a shows that the band structure with high and low densities of twins is no longer present after the cyclic loading. The occurrence of twins is evenly distributed across the domain. In Figure 10b, it can be seen that the grain boundaries are highly deformed and serrated throughout the material. To evaluate the orientation of the unit cells, Figure 10c shows a ( 0002 ) pole figure of the specimen BS9-008 after cyclic loading with view in the TD. The material of the hot V-bent structural component specimen after cyclic loading has no distinct basal texture, which is represented by the low maximum intensity of ≈ 3.10 . Compared with the ( 0002 ) pole figure of the as-received material in Figure 8a, the basal texture of the investigated specimen is weakened by a factor of ≈ 4.81 after cyclic loading. The spots on the left and right boundaries of the RD axis of the pole figure in Figure 10c show that { 10 1 ¯ 2 } twins are formed during compressive loading.

4.2. Low-Cycle Fatigue Tests

Earlier studies have shown that the cyclic material behavior of non-bent uniaxial and hot-bent uniaxial specimens under uniaxial loading conditions in RD and TD can be modeled using the concept of highly strained volume (CH ε V) [13,23]. The objective of the new low-cycle fatigue tests is to verify whether the CH ε V can be applied to the investigated V-bent structural components, which are subjected to a multiaxial stress state when loaded uniaxially in RD. For this purpose, structural component variants with different bending radii and, thus, different degrees of deformation were produced. Three different force amplitudes F a were tested on each structural component variant.
The structural components with bending radii R BS 6 = 6   m m and R BS 9 = 9   m m would be exposed to higher stress at the same load compared with the structural components with bending radius R BS 12 = 12   m m due to the geometrically induced stress concentration in the gauge area. In order to achieve a stress level that is as comparable as possible, the force amplitudes to be applied were scaled using the ratios of the yield loads F Y , BS 12 = 550   N , F Y , BS 9 = 506   N and F Y , BS 6 = 451   N calculated with FEM models defined in Section 3. The determination of the load levels is to be explained by means of an example. Starting from the force amplitude F a , BS 12 = 900   N to be used for a structural component BS12, the ratio of the yield forces F Y , BS 9 / F Y , BS 12 = 506   N / 550   N = 0.92 is calculated. This factor is applied to the previous determined force amplitude F a , BS 12 = 900   N , resulting in the force amplitude F a , BS 9 = 0.92 · 900   N = 828   N .
The mean effective strain amplitude ε ¯ ˜ φ φ , a , measured by 3D digital image correlation (DIC) and subsequently calculated, was chosen as the fatigue parameter in the application of the CH ε V. To determine ε ¯ ˜ φ φ , a , the mean values of the strain fields ε ˜ φ φ ( r , φ , x 2 ) | LLL at the lower load level (LLL) and ε ˜ φ φ ( r , φ , x 2 ) | ULL at the upper load level (ULL) within the highly strained volume V ε are calculated. From these two values, the amplitude is formed, which corresponds to the mean effective strain amplitude ε ¯ ˜ φ φ , a . When applying the CH ε V to the V-bent specimens, only those strains were included within the V ε that are not less than 80% of the maximum strain that occurs. For a more detailed description of how to determine the fatigue parameter as well as on the application of the CH ε V, we refer the reader to [12]. The software calc_HepsV_3D.py was developed using Python™, which processes the data of the DIC and uses them to compute the fatigue parameter ε ¯ ˜ φ φ , a and the highly strained Volume V ε . Subsequently, it applies the CH ε V in 3D space. The fatigue parameters V ε and ε ¯ ˜ φ φ , a were determined in the close range around N f / 2 , because stabilized material behavior can be assumed here [11]. To determine the highly strained volume V ε the highly strained area of the specimen surface with high strain amplitudes (HSRA) is multiplied by a thickness parameter t = 1   m m , since the twinned area extends by about 1 m m in the sheet normal direction.
In total, nine force controlled low-cycle fatigue tests were performed at three different load levels on the respective structural component variants at a constant force amplitude ratio of R F = 1 . The respective force amplitudes F a , the test frequency f, the determined highly strained Volume V ε , the calculated fatigue parameter ε ¯ ˜ φ φ , a and the number of cycles to failure N f are given in Table 2.
Figure 11, Figure 12 and Figure 13 show three different fatigue diagrams, developed with the CH ε V, for modeling the fatigue life of uniaxial specimens made of wrought magnesium alloy AZ31B. The experimental data of the fatigue tests of the non-bent as-received material specimens and the hot-bent uniaxial specimens are from [13,23], respectively. These are marked with grey crosses and blue triangles, respectively. The respective regression parameters with which the models were created are also from [13]. The results of the fatigue tests on the structural components were incorporated into these models to assess whether uniaxial models can represent the fatigue life of structural components exposed to a multiaxial loading. The fatigue parameter for the uniaxial specimens ε ¯ ˜ RD , a corresponds to the mean effective strain in RD. Since the angular coordinate φ of the cylindrical coordinate system introduced in Figure 1b follows RD for 45 φ 45 , it holds that ε ¯ ˜ φ φ , a = ^ ε ¯ ˜ RD , a . Because of this linkage, the experimental data can be compared in the fatigue diagrams.
Figure 11 shows the 3D and 2D fatigue diagrams through the application of the CH ε V by using the regression parameters of the as-received specimens. It can be seen that all the data points from the low-cycle fatigue tests on the structural components are within the two 2-times error planes. The Root Mean Square Error (RMSE) is calculated to evaluate the accuracy of the regression for all data included. In the case of the observed fatigue diagram in Figure 11, the value RMSE = 0.076 is calculated, which indicates good modeling of the number of cycles to failure N f of the tested specimens.
In Figure 12, the experimental data of the structural components are included in the model for the hot-bent uniaxial specimens. The structural components that were loaded with the force amplitudes of the highest load level are within the 2-times error planes. However, as the fatigue parameter ε ¯ ˜ RD , a decreases—and thus, the number of cycles to failure increases—the experimental data of the structural components can no longer be adequately described by the model. For quantitative evaluation of the model with respect to all included experimental data, the RMSE = 0.088 is calculated. This value is larger than the RMSE of the model for the as-received material and, thus, indicates lower accuracy of prediction.
Figure 13 shows the model created with the regression parameters from the combined experimental data of the as-received and the hot-bent uniaxial specimens. Since a larger amount of data is used to determine the regression parameters, almost all experimental data points lie within the two 2-times error planes. This is also confirmed by the highest prediction accuracy of RMSE = 0.063 compared with the previous models. The calculated RMSE is presumably so small because 20 data sets of the as-received material specimens and only 10 data sets of the hot-bent uniaxial specimens were used to calculate the regression parameters.
Figure 14 shows a comparison of the calculated and experimentally determined number of cycles to failure N f in the described models. It can be seen that, especially, the model of the as-received uniaxial specimens in Figure 14a and the model of the combined uniaxial data in Figure 14c estimate the number of cycles to failure of the structural components with satisfying accuracy. It is also apparent that all three models tend to underestimate the lifetimes of structural components. It should be noted that, for the modeling of the structural components, a uniaxial quantity in the form of the mean effective strain in the rolling direction of the sheet ε ¯ ˜ RD , a was used. Since the structural components are exposed to a multiaxial stress state, this choice of fatigue parameter may result in a faulty estimation of the number of cycles to failure. As Figure 11, Figure 12, Figure 13 and Figure 14 show, the uniaxial models underestimate the lifetime of the structural components, which results in a conservative numerical estimation of the numbers of cycles to failure N f .

5. Conclusions

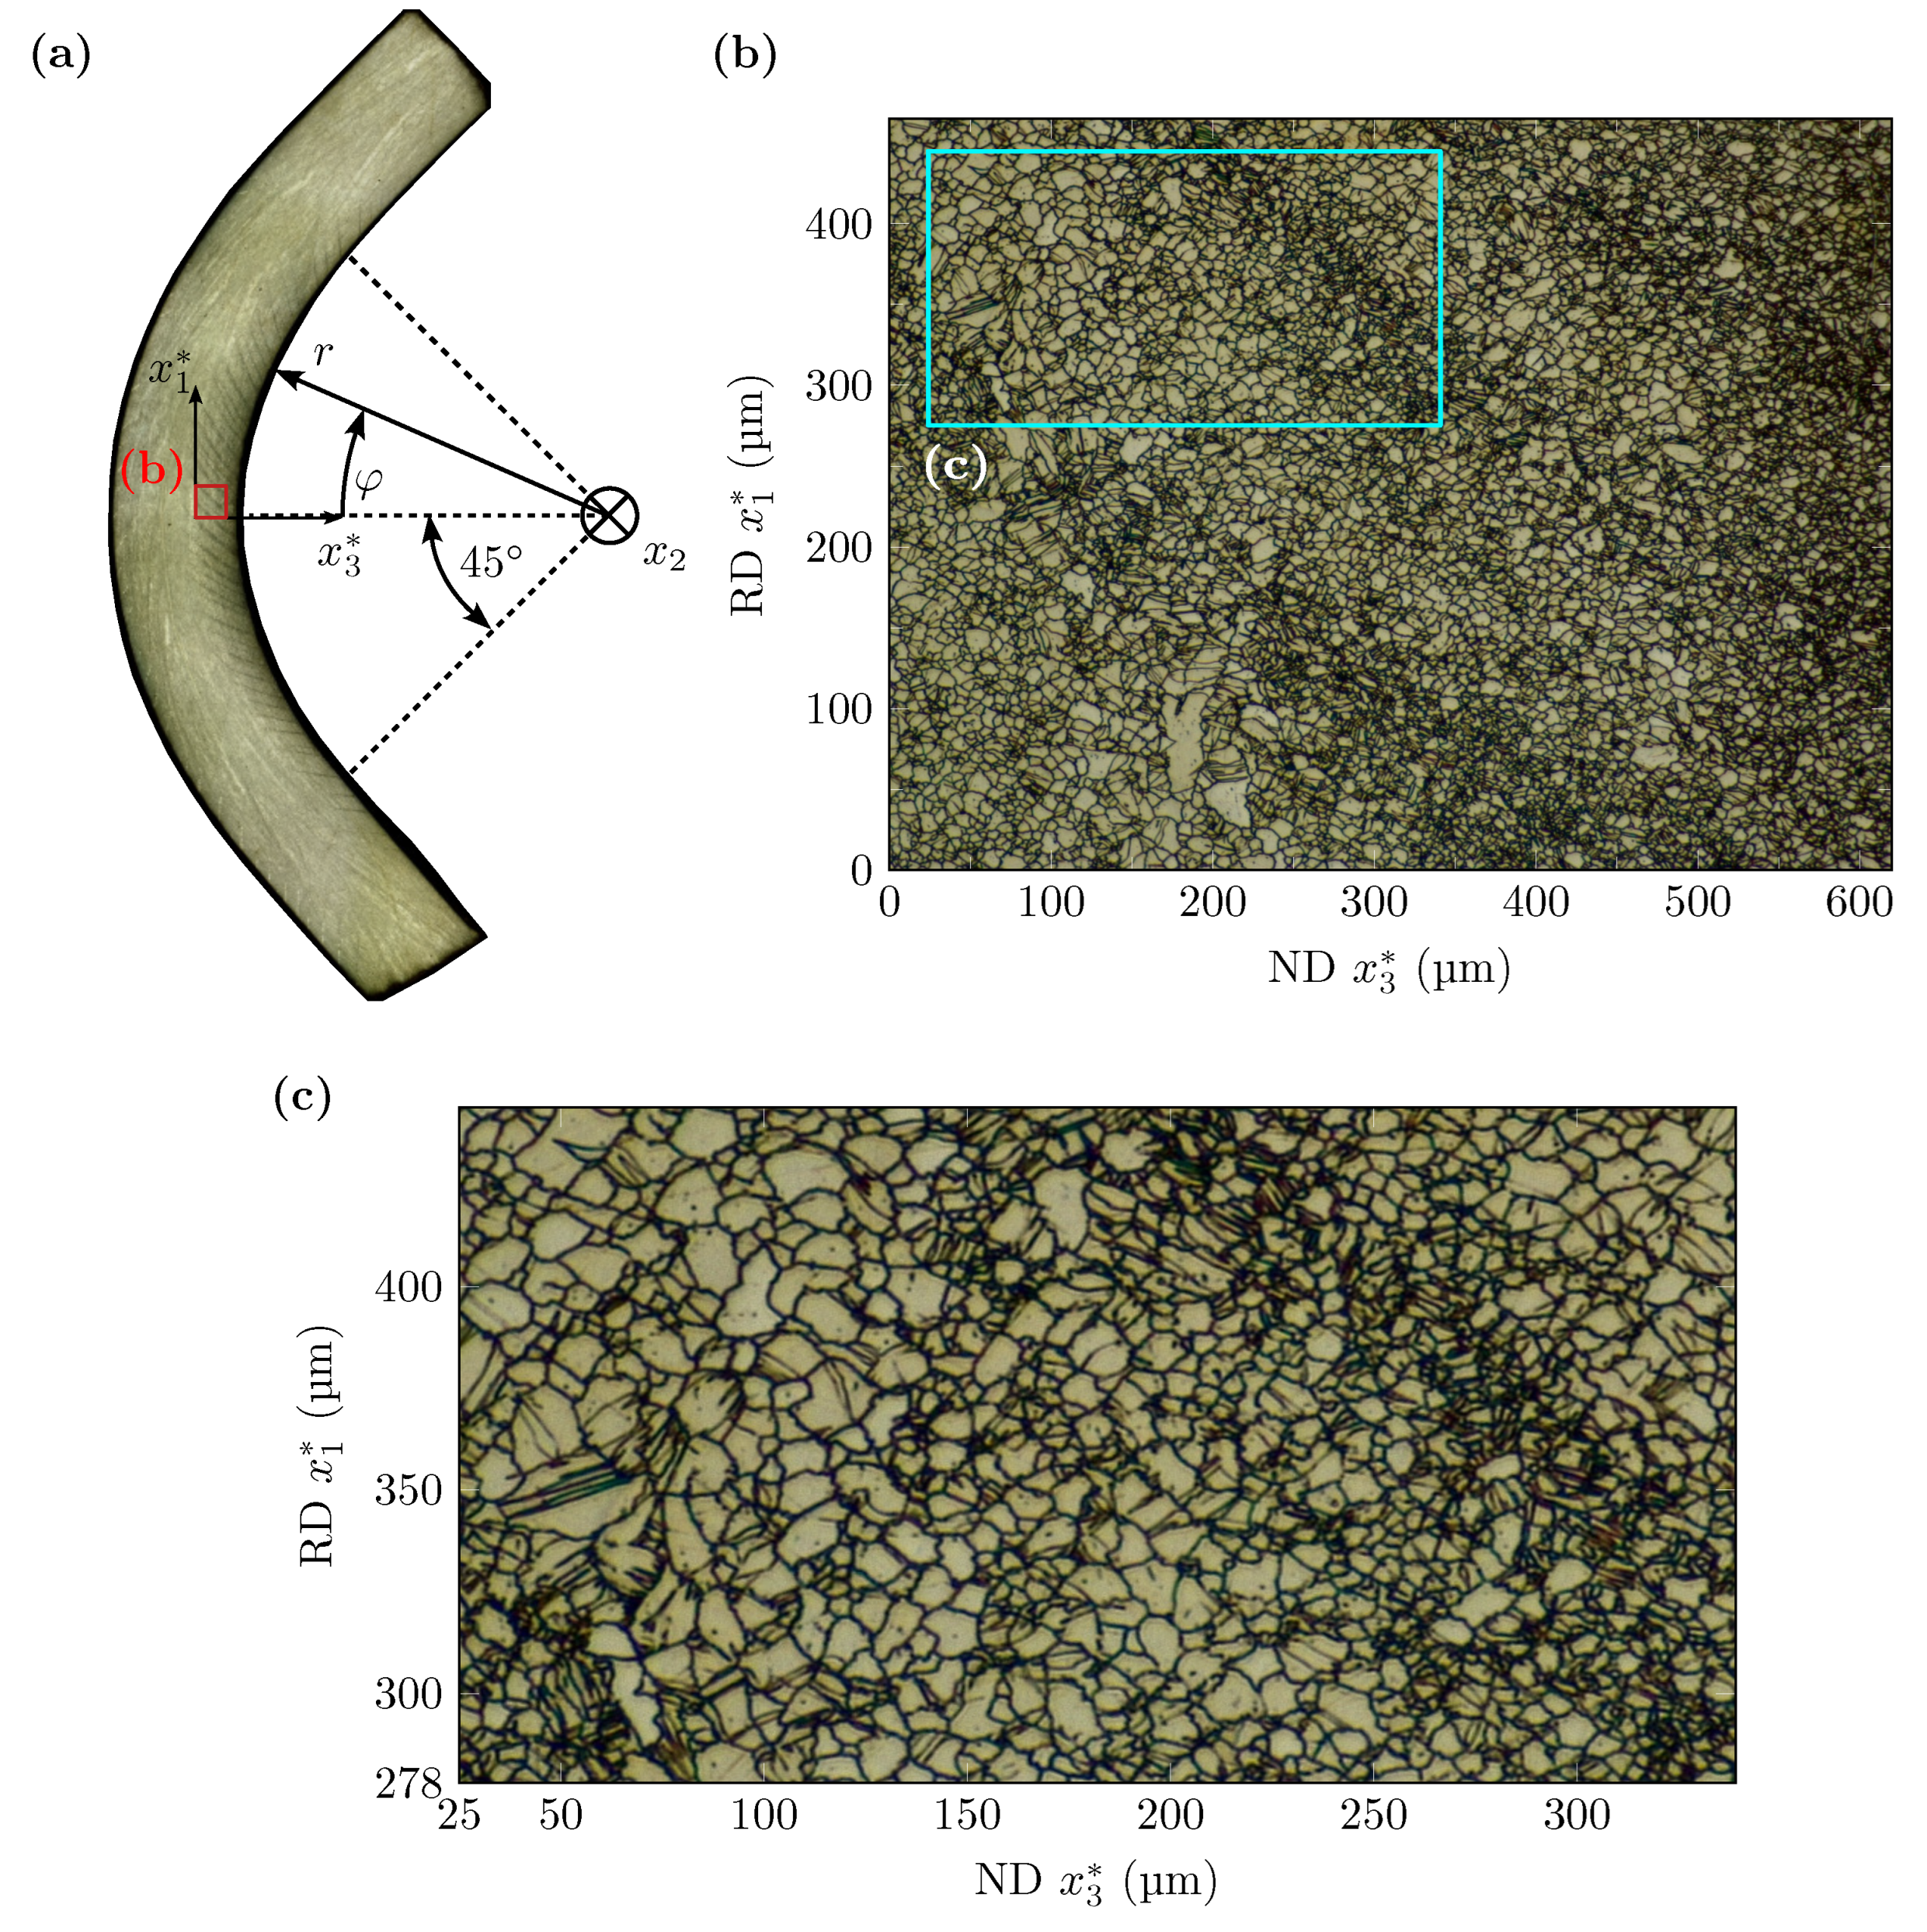
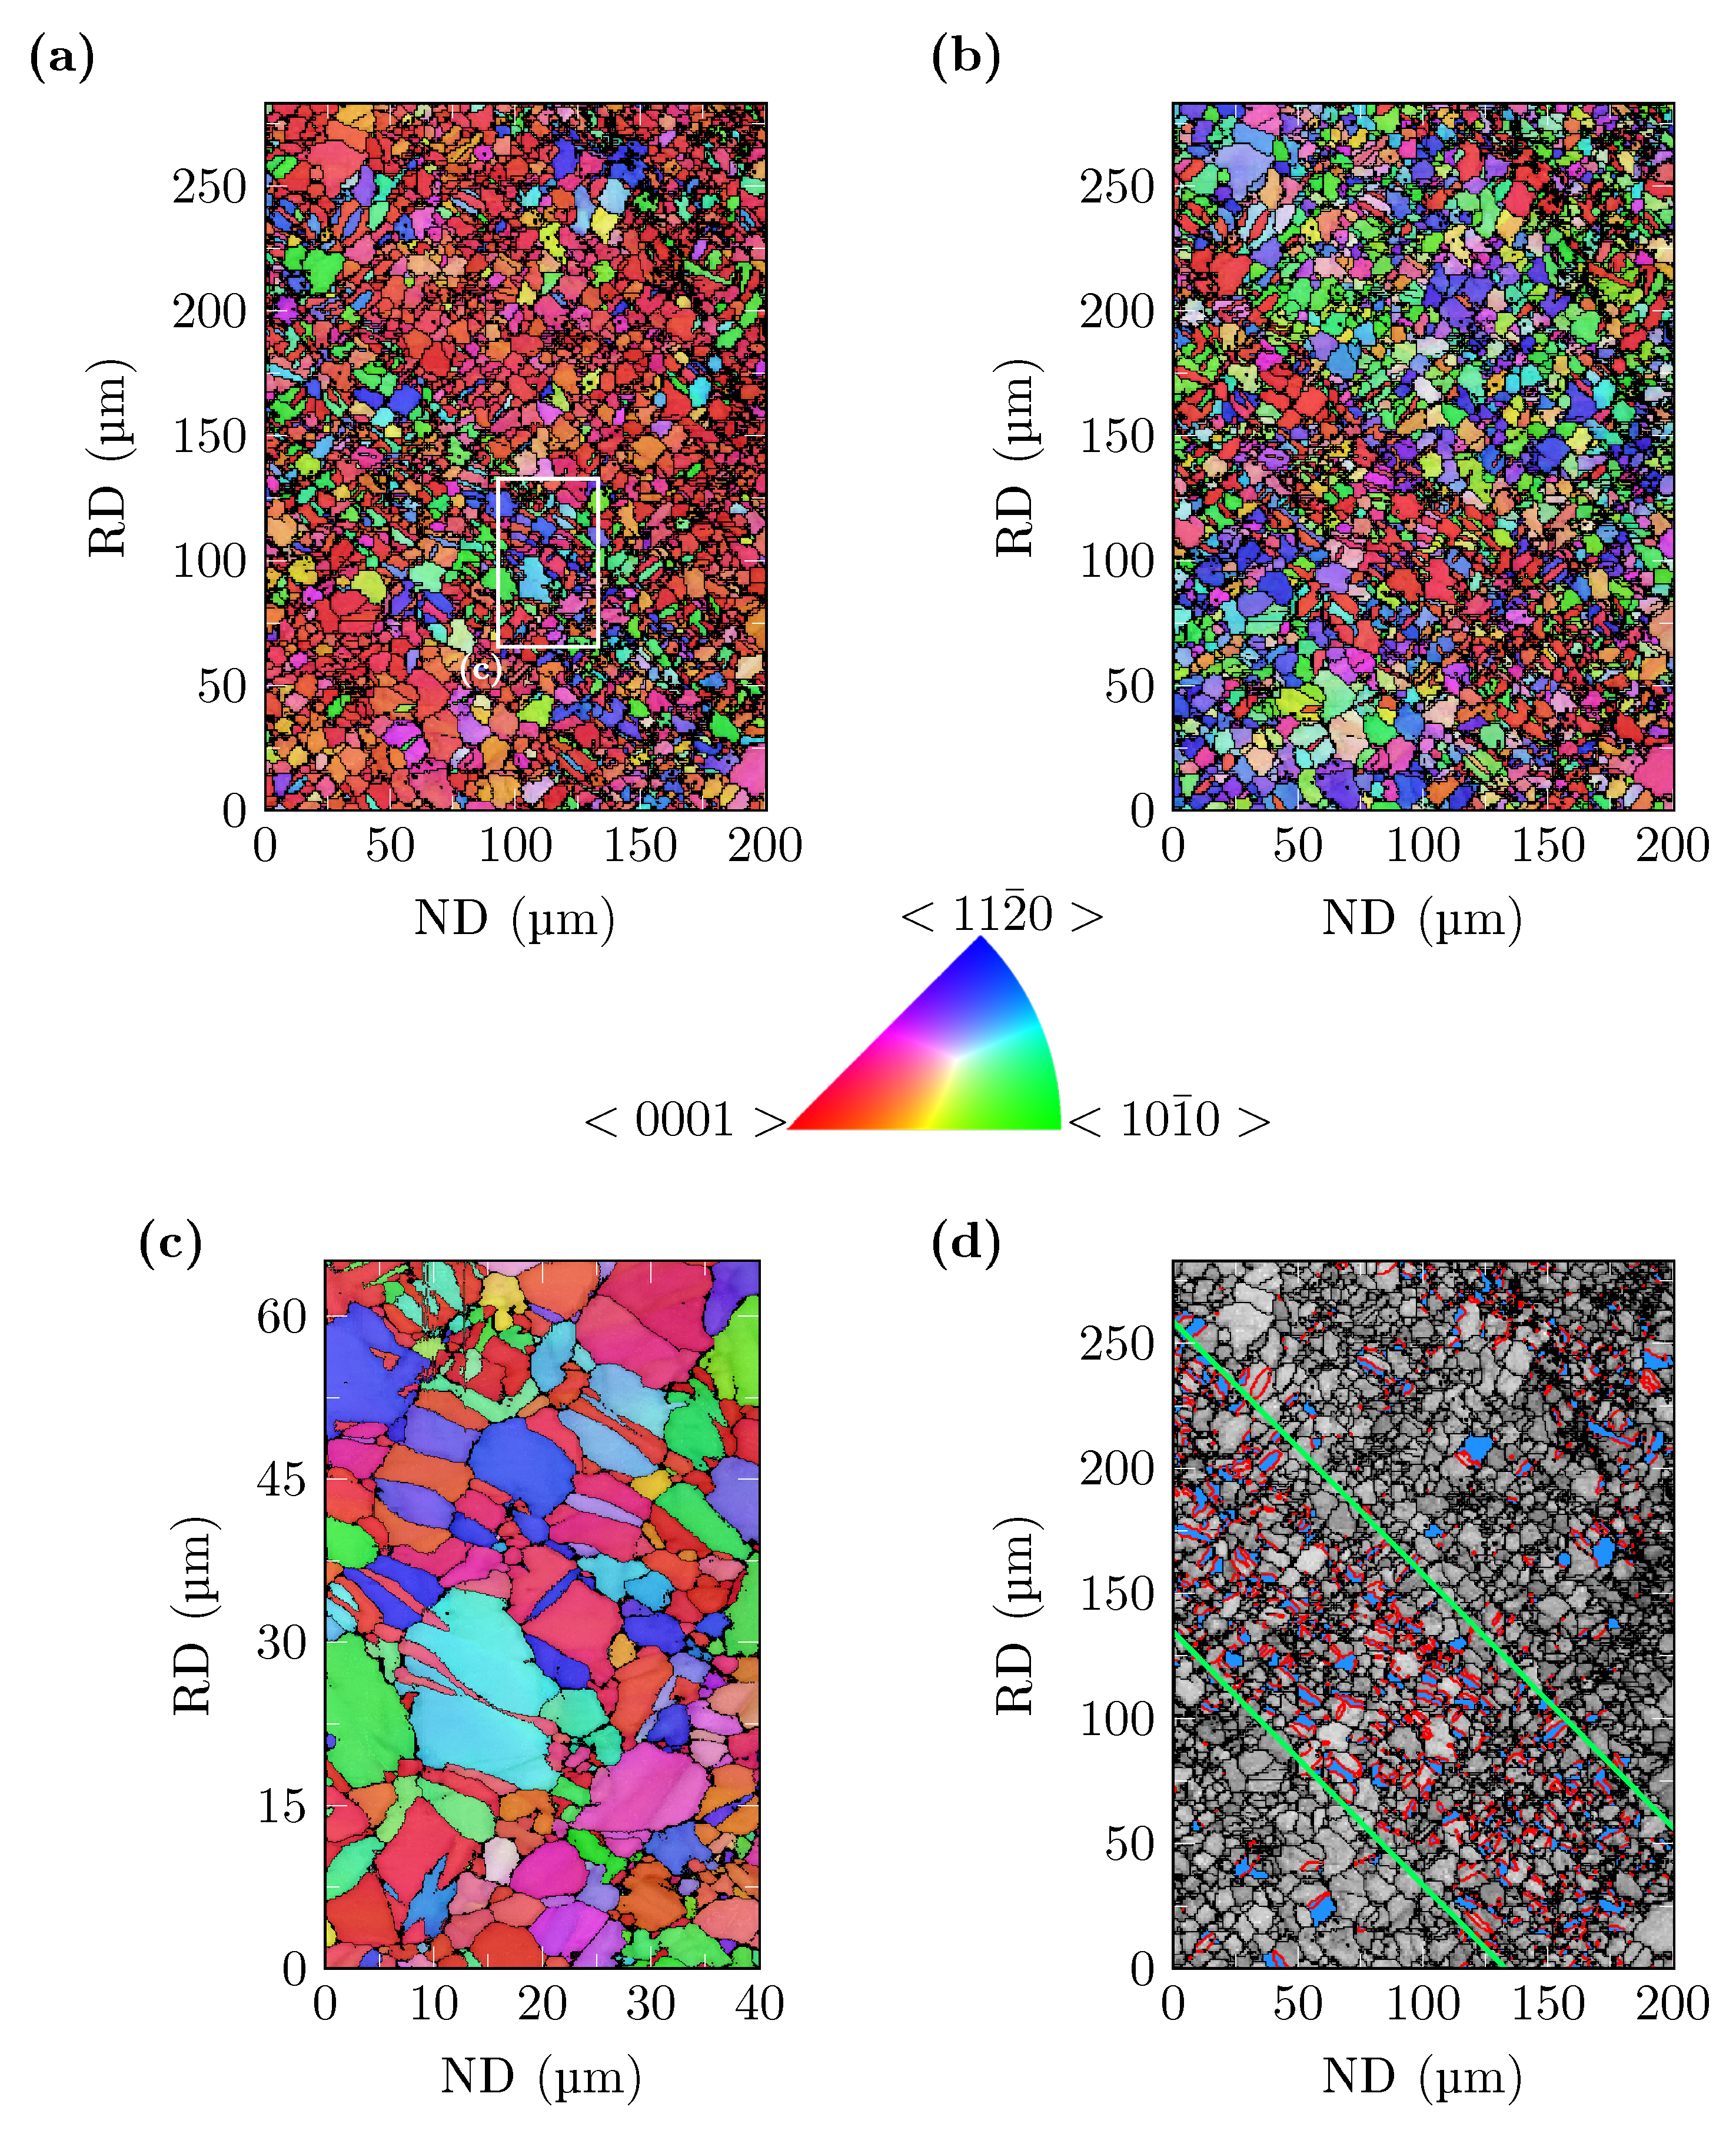
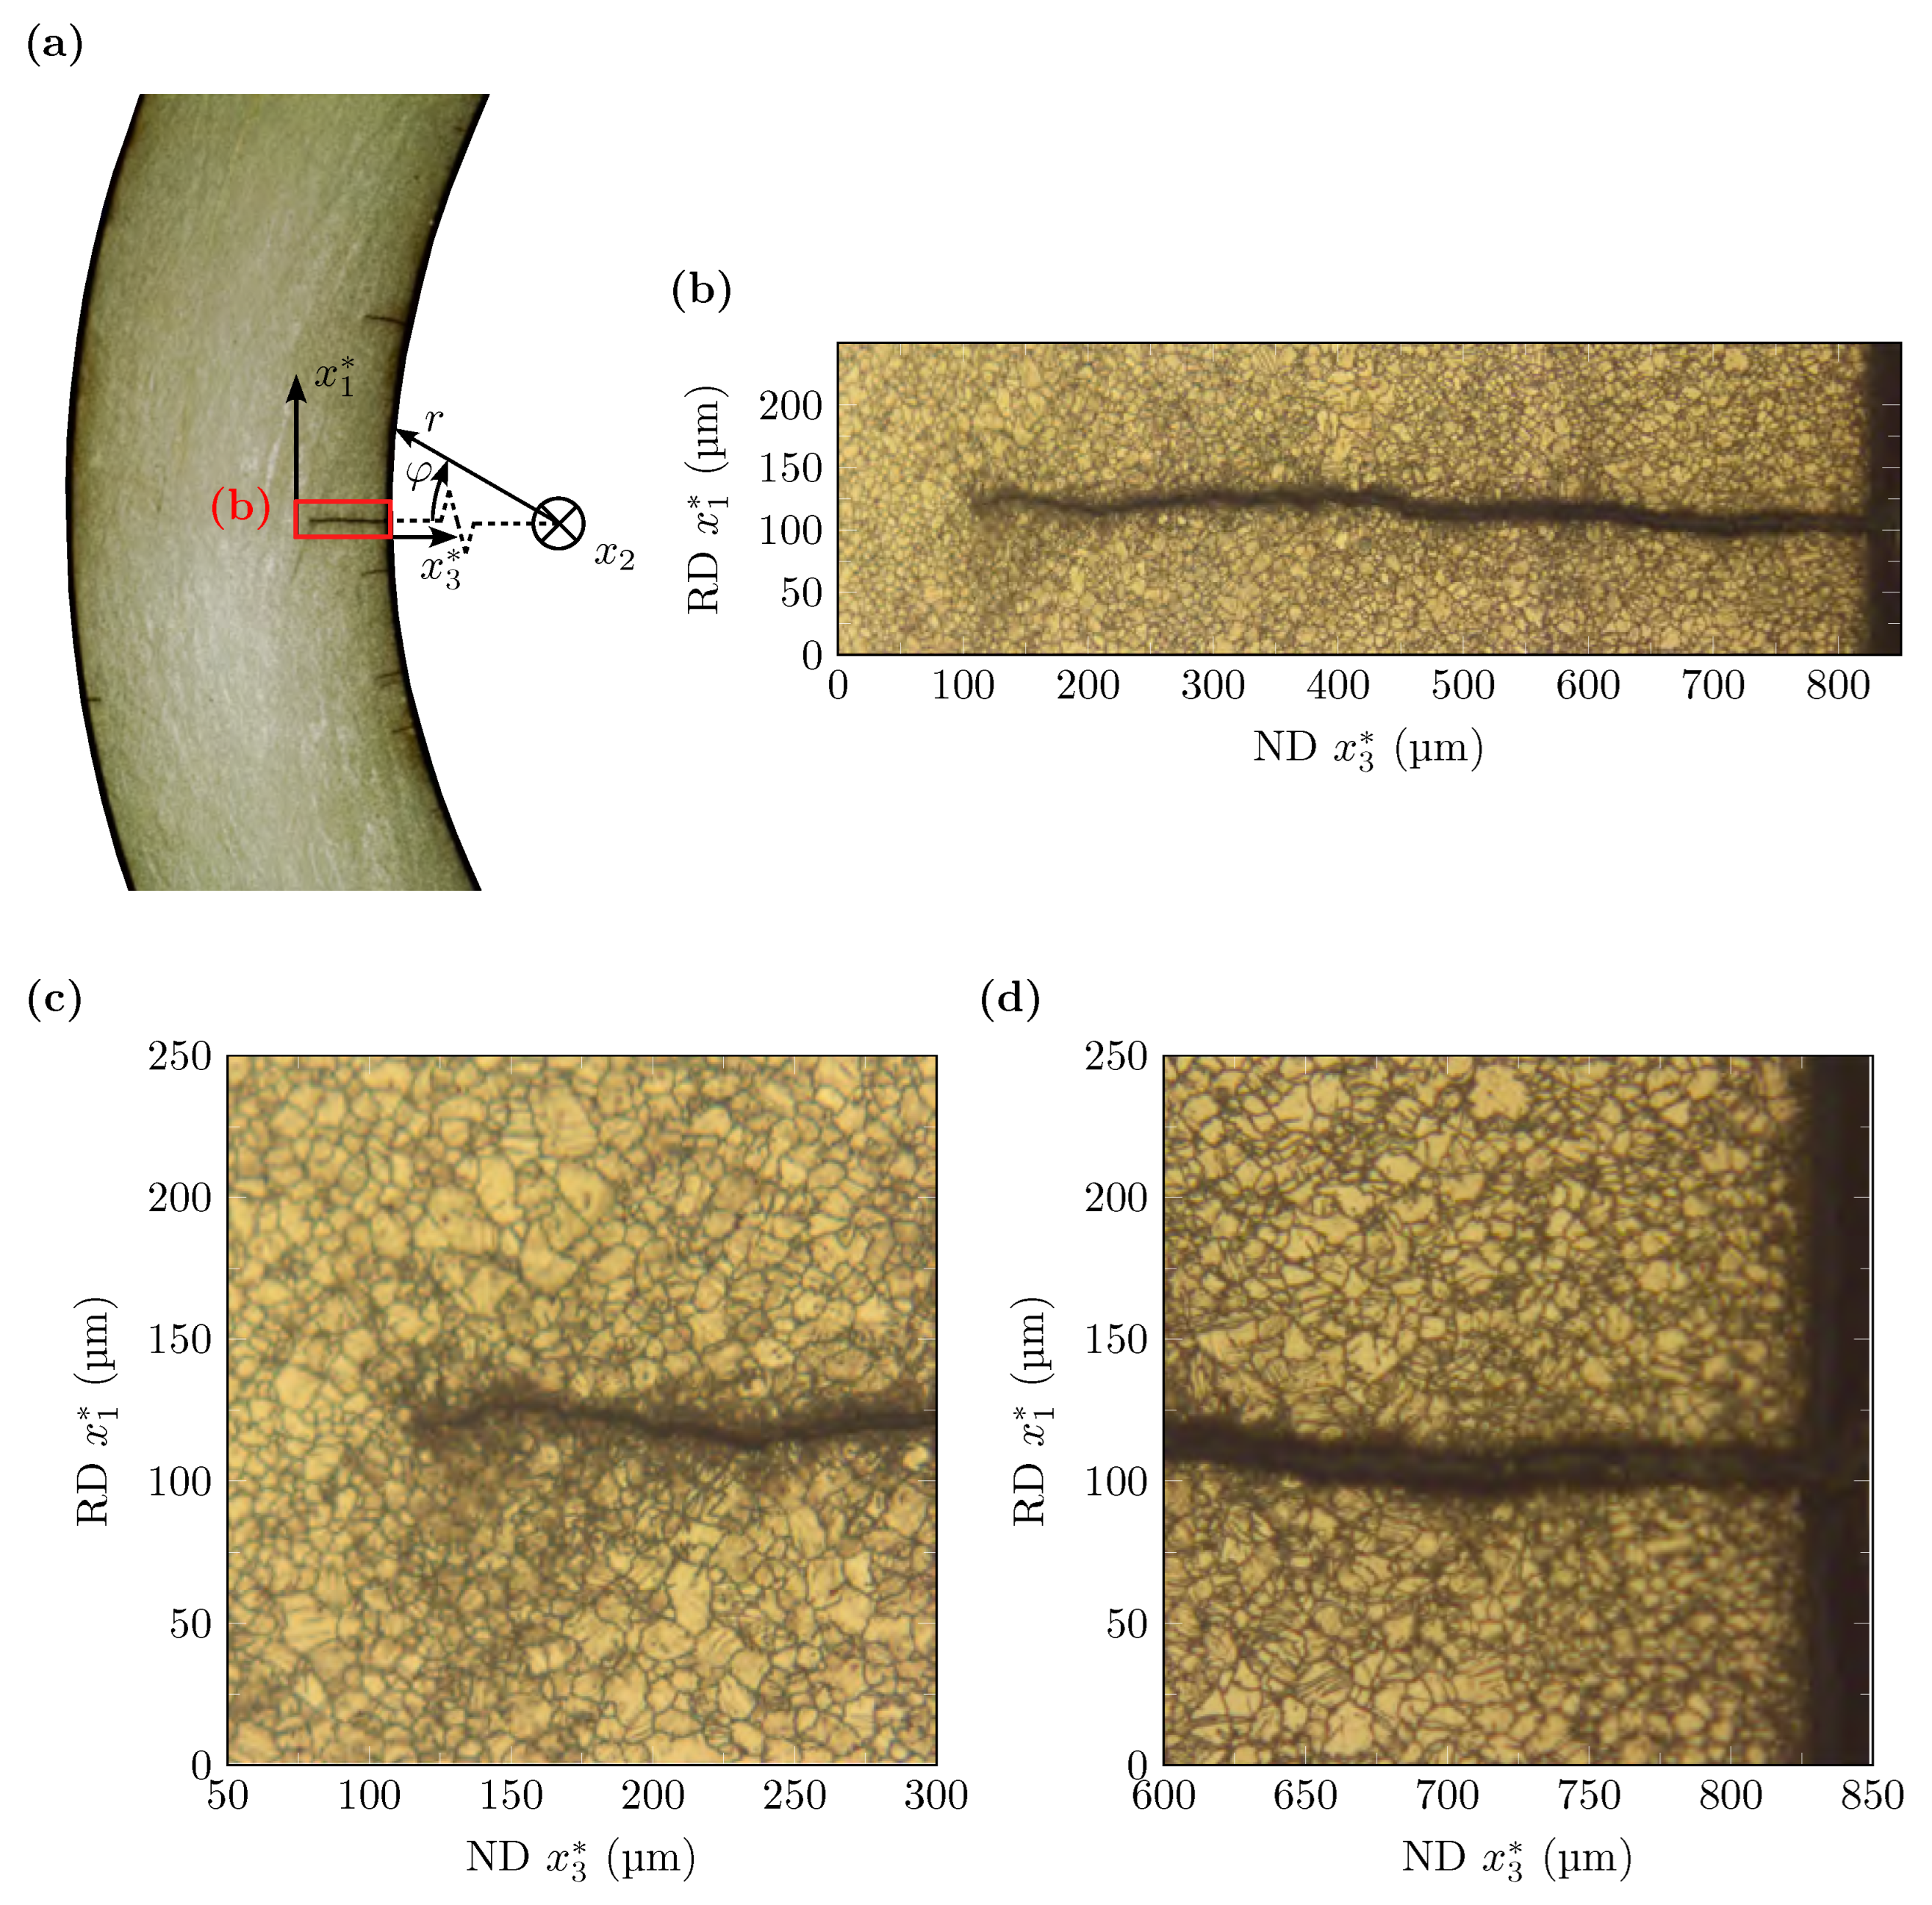
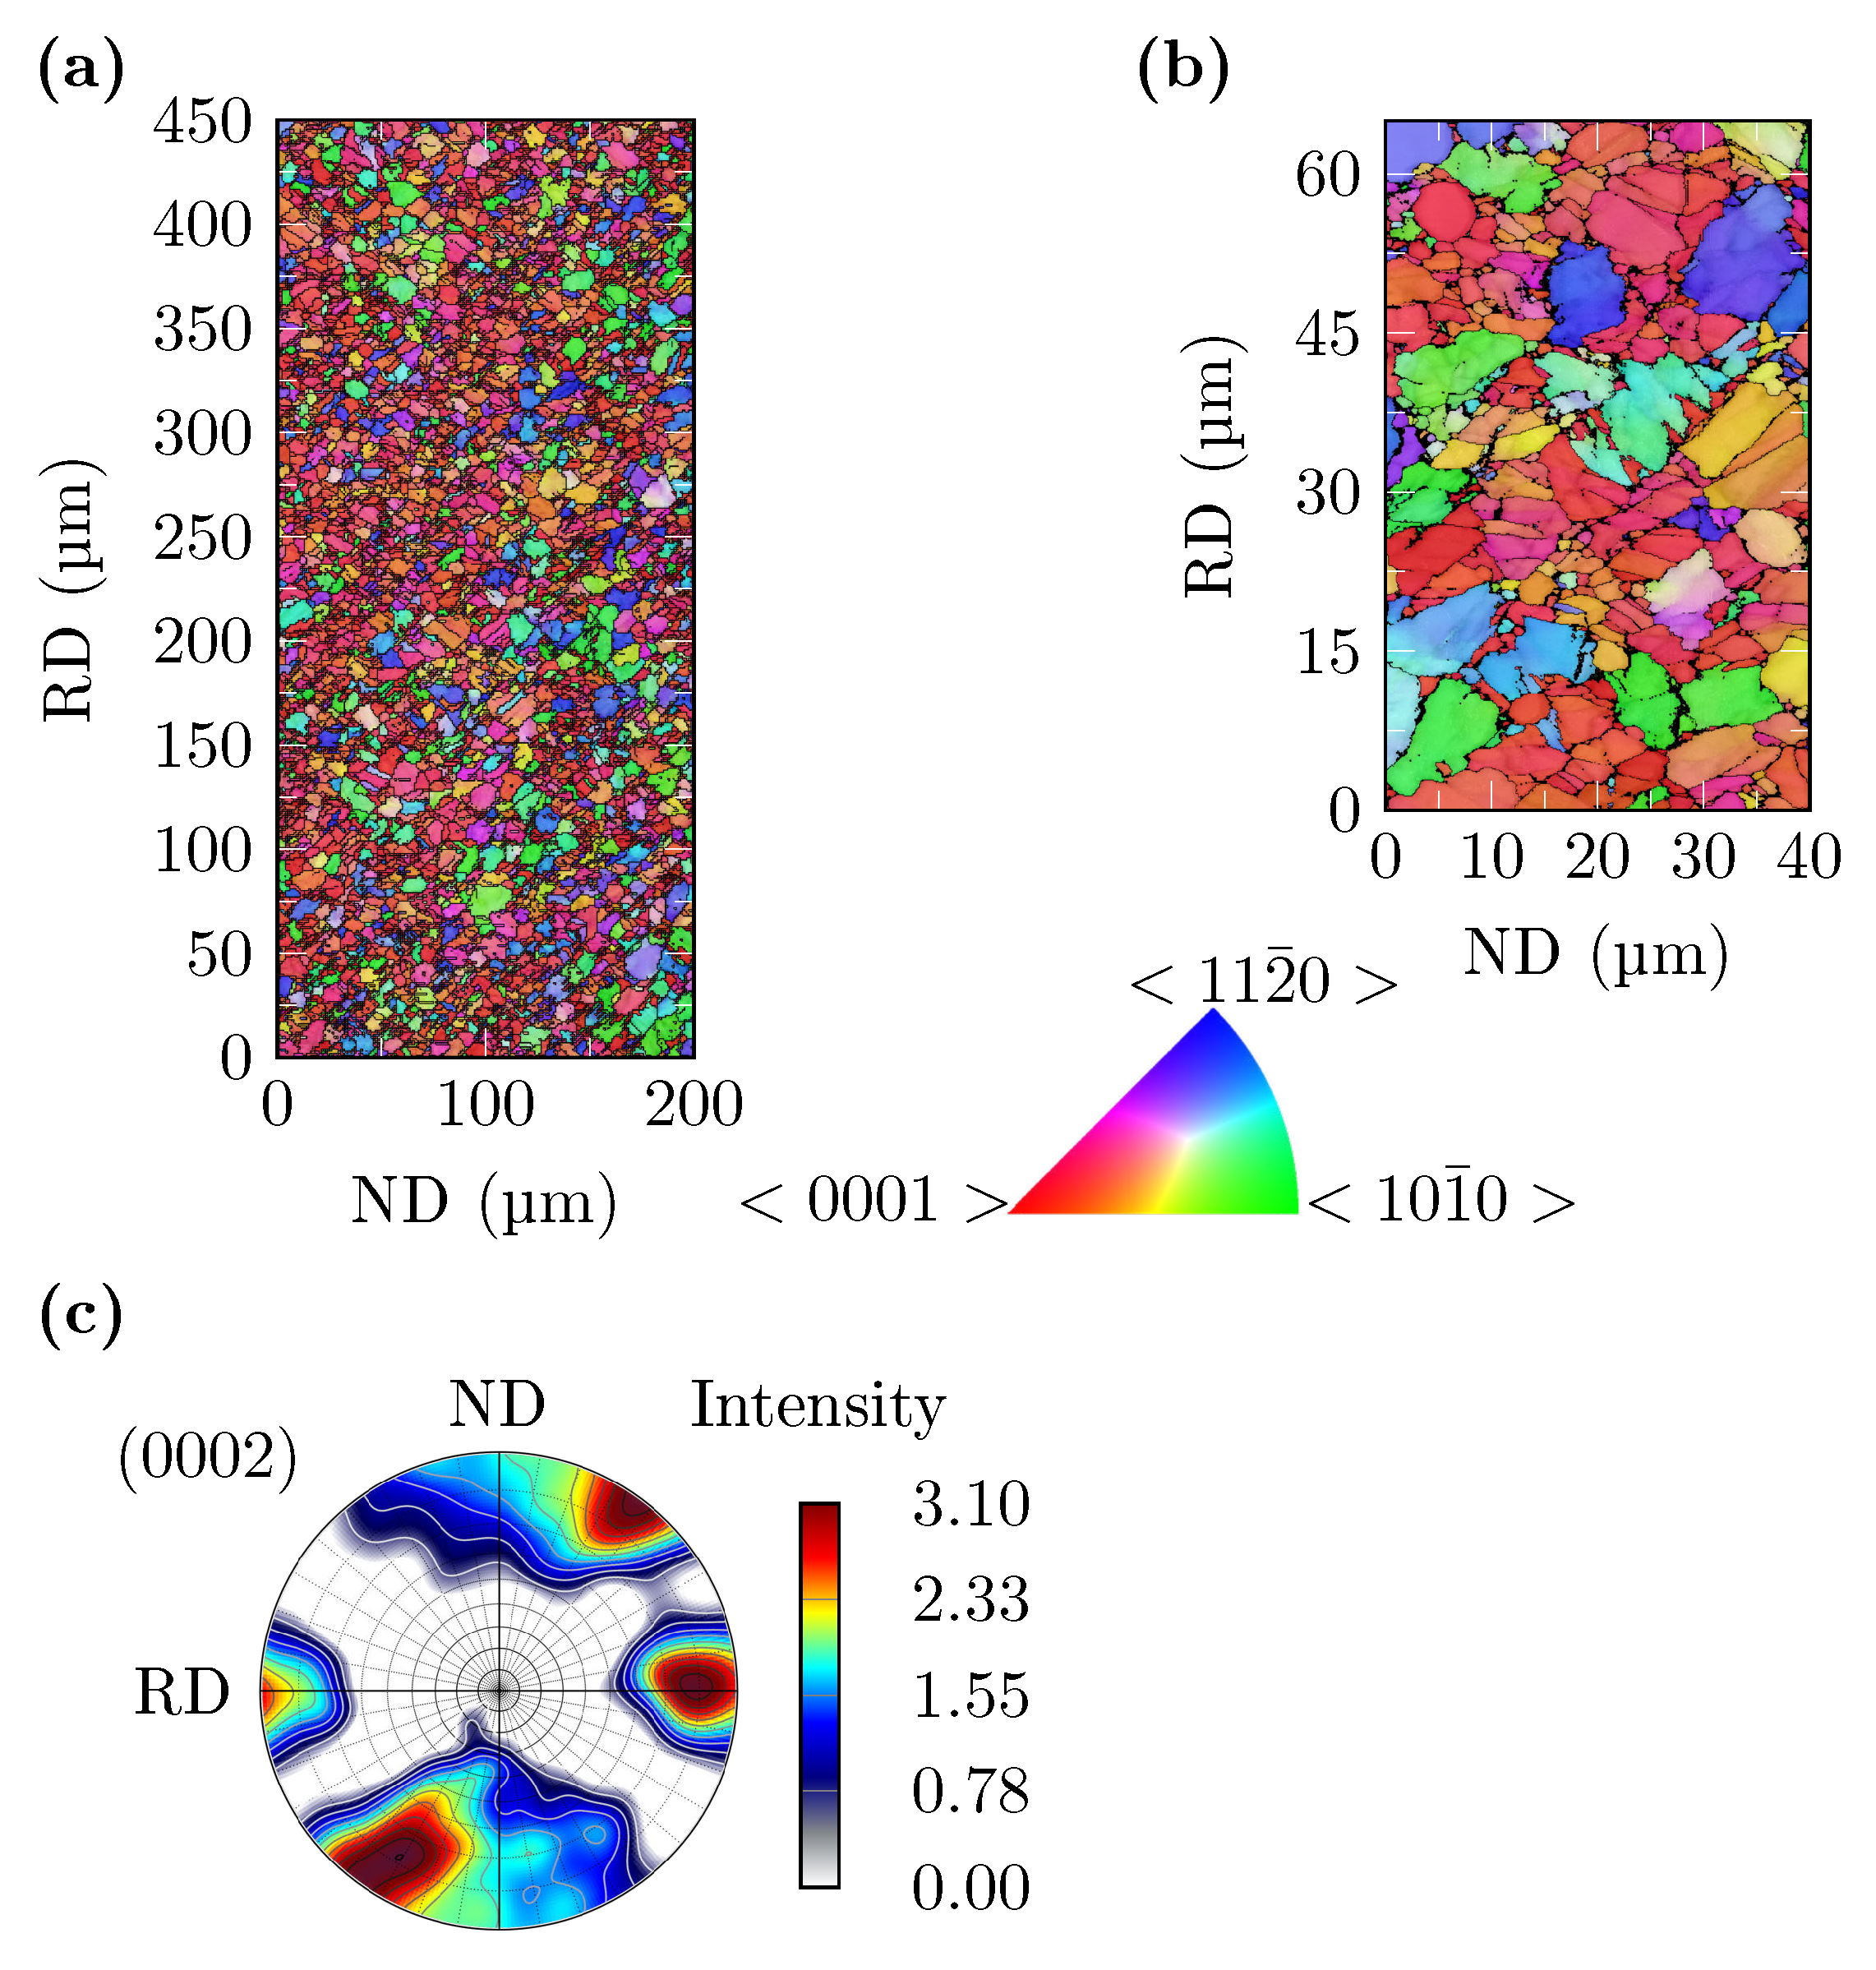
  • In domains with high plastic deformation during the hot forming process of the specimen, a highly inhomogeneous microstructure with serrated grain boundaries can be observed. This is due to the low-temperature dynamic recrystallization.
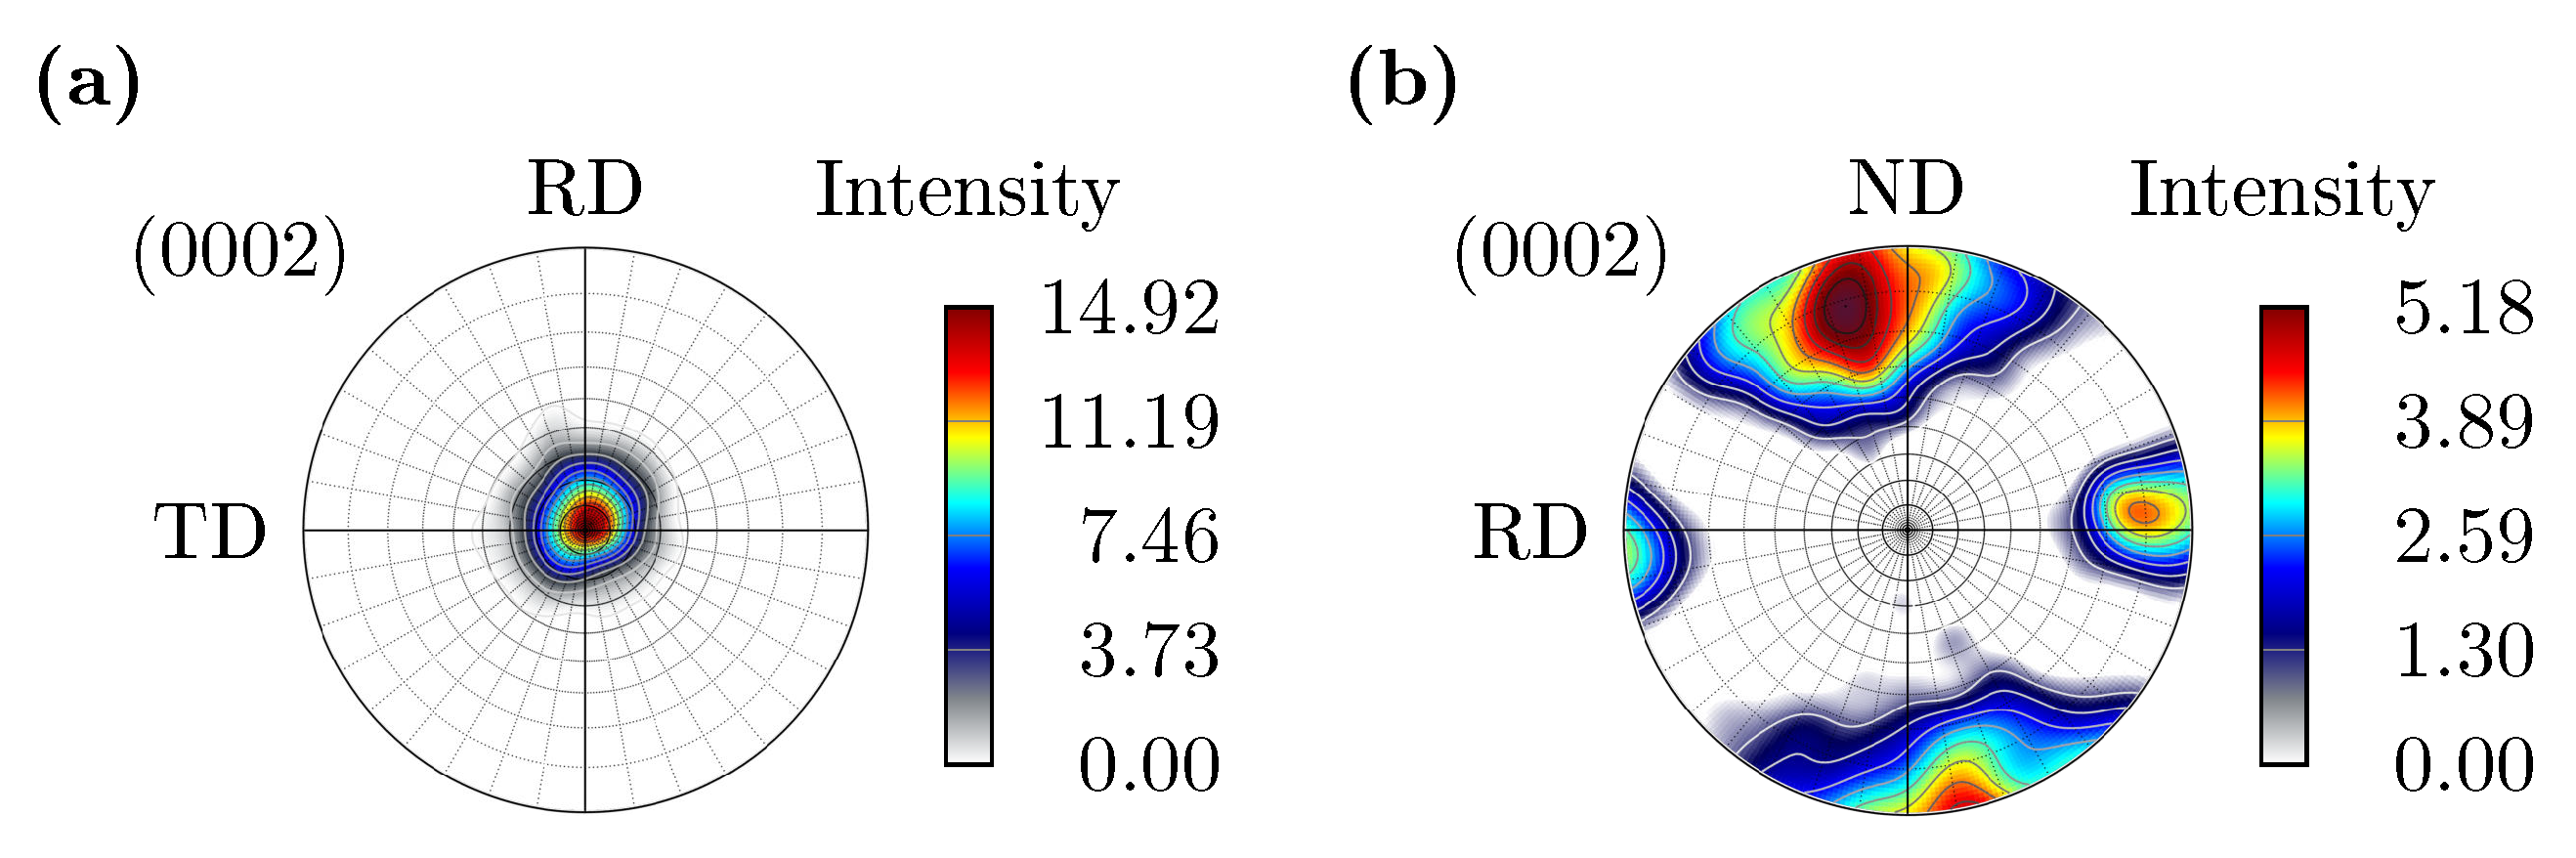
  • The hot forming process leads to the formation of BTG in the gauge area on the compressively loaded concave side of the specimen. These extend at a 45° angle to the sheet plane approx. 1 m m in the direction of the center of the sheet wall thickness. The EBSD and light microscope investigations of the microstructure after applied cyclic loading showed that these BTGs are no longer detectable. The reason for this is that the occurrence of twins distributes evenly after cyclic loading. The information on how far the material twins toward the center of the sheet wall thickness was used to determine the highly strained volume to apply the CH ε V.
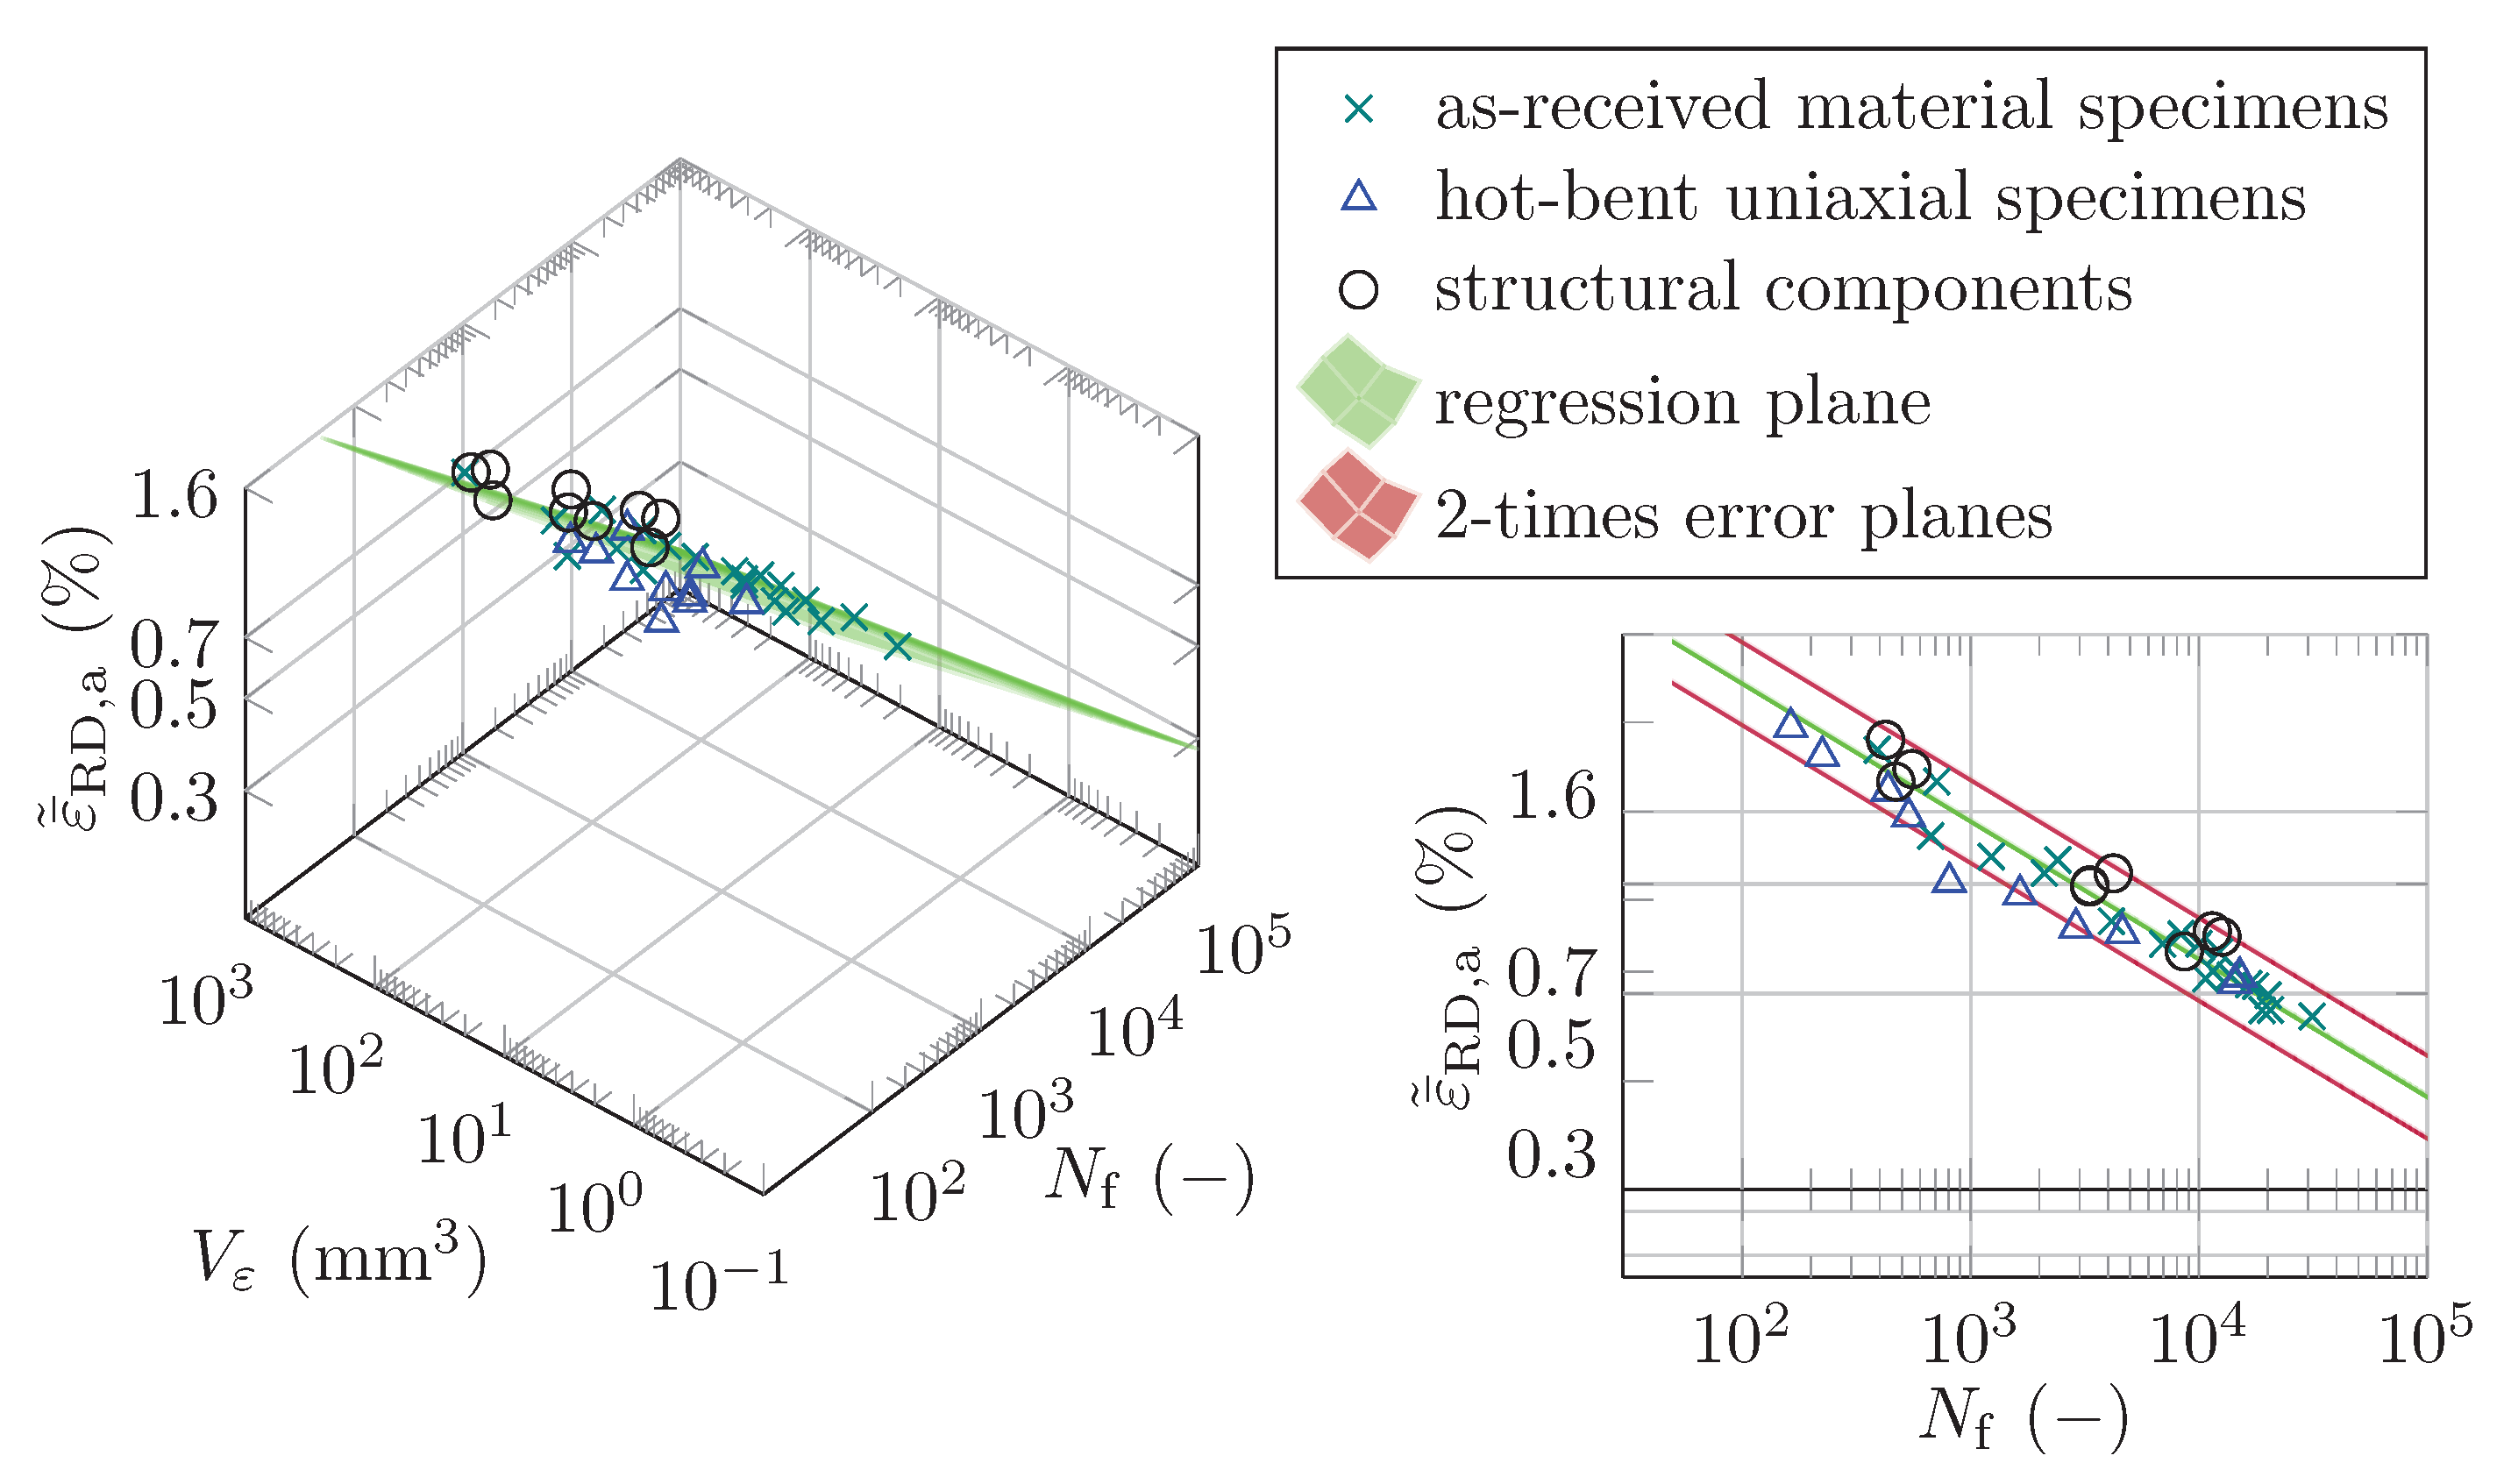
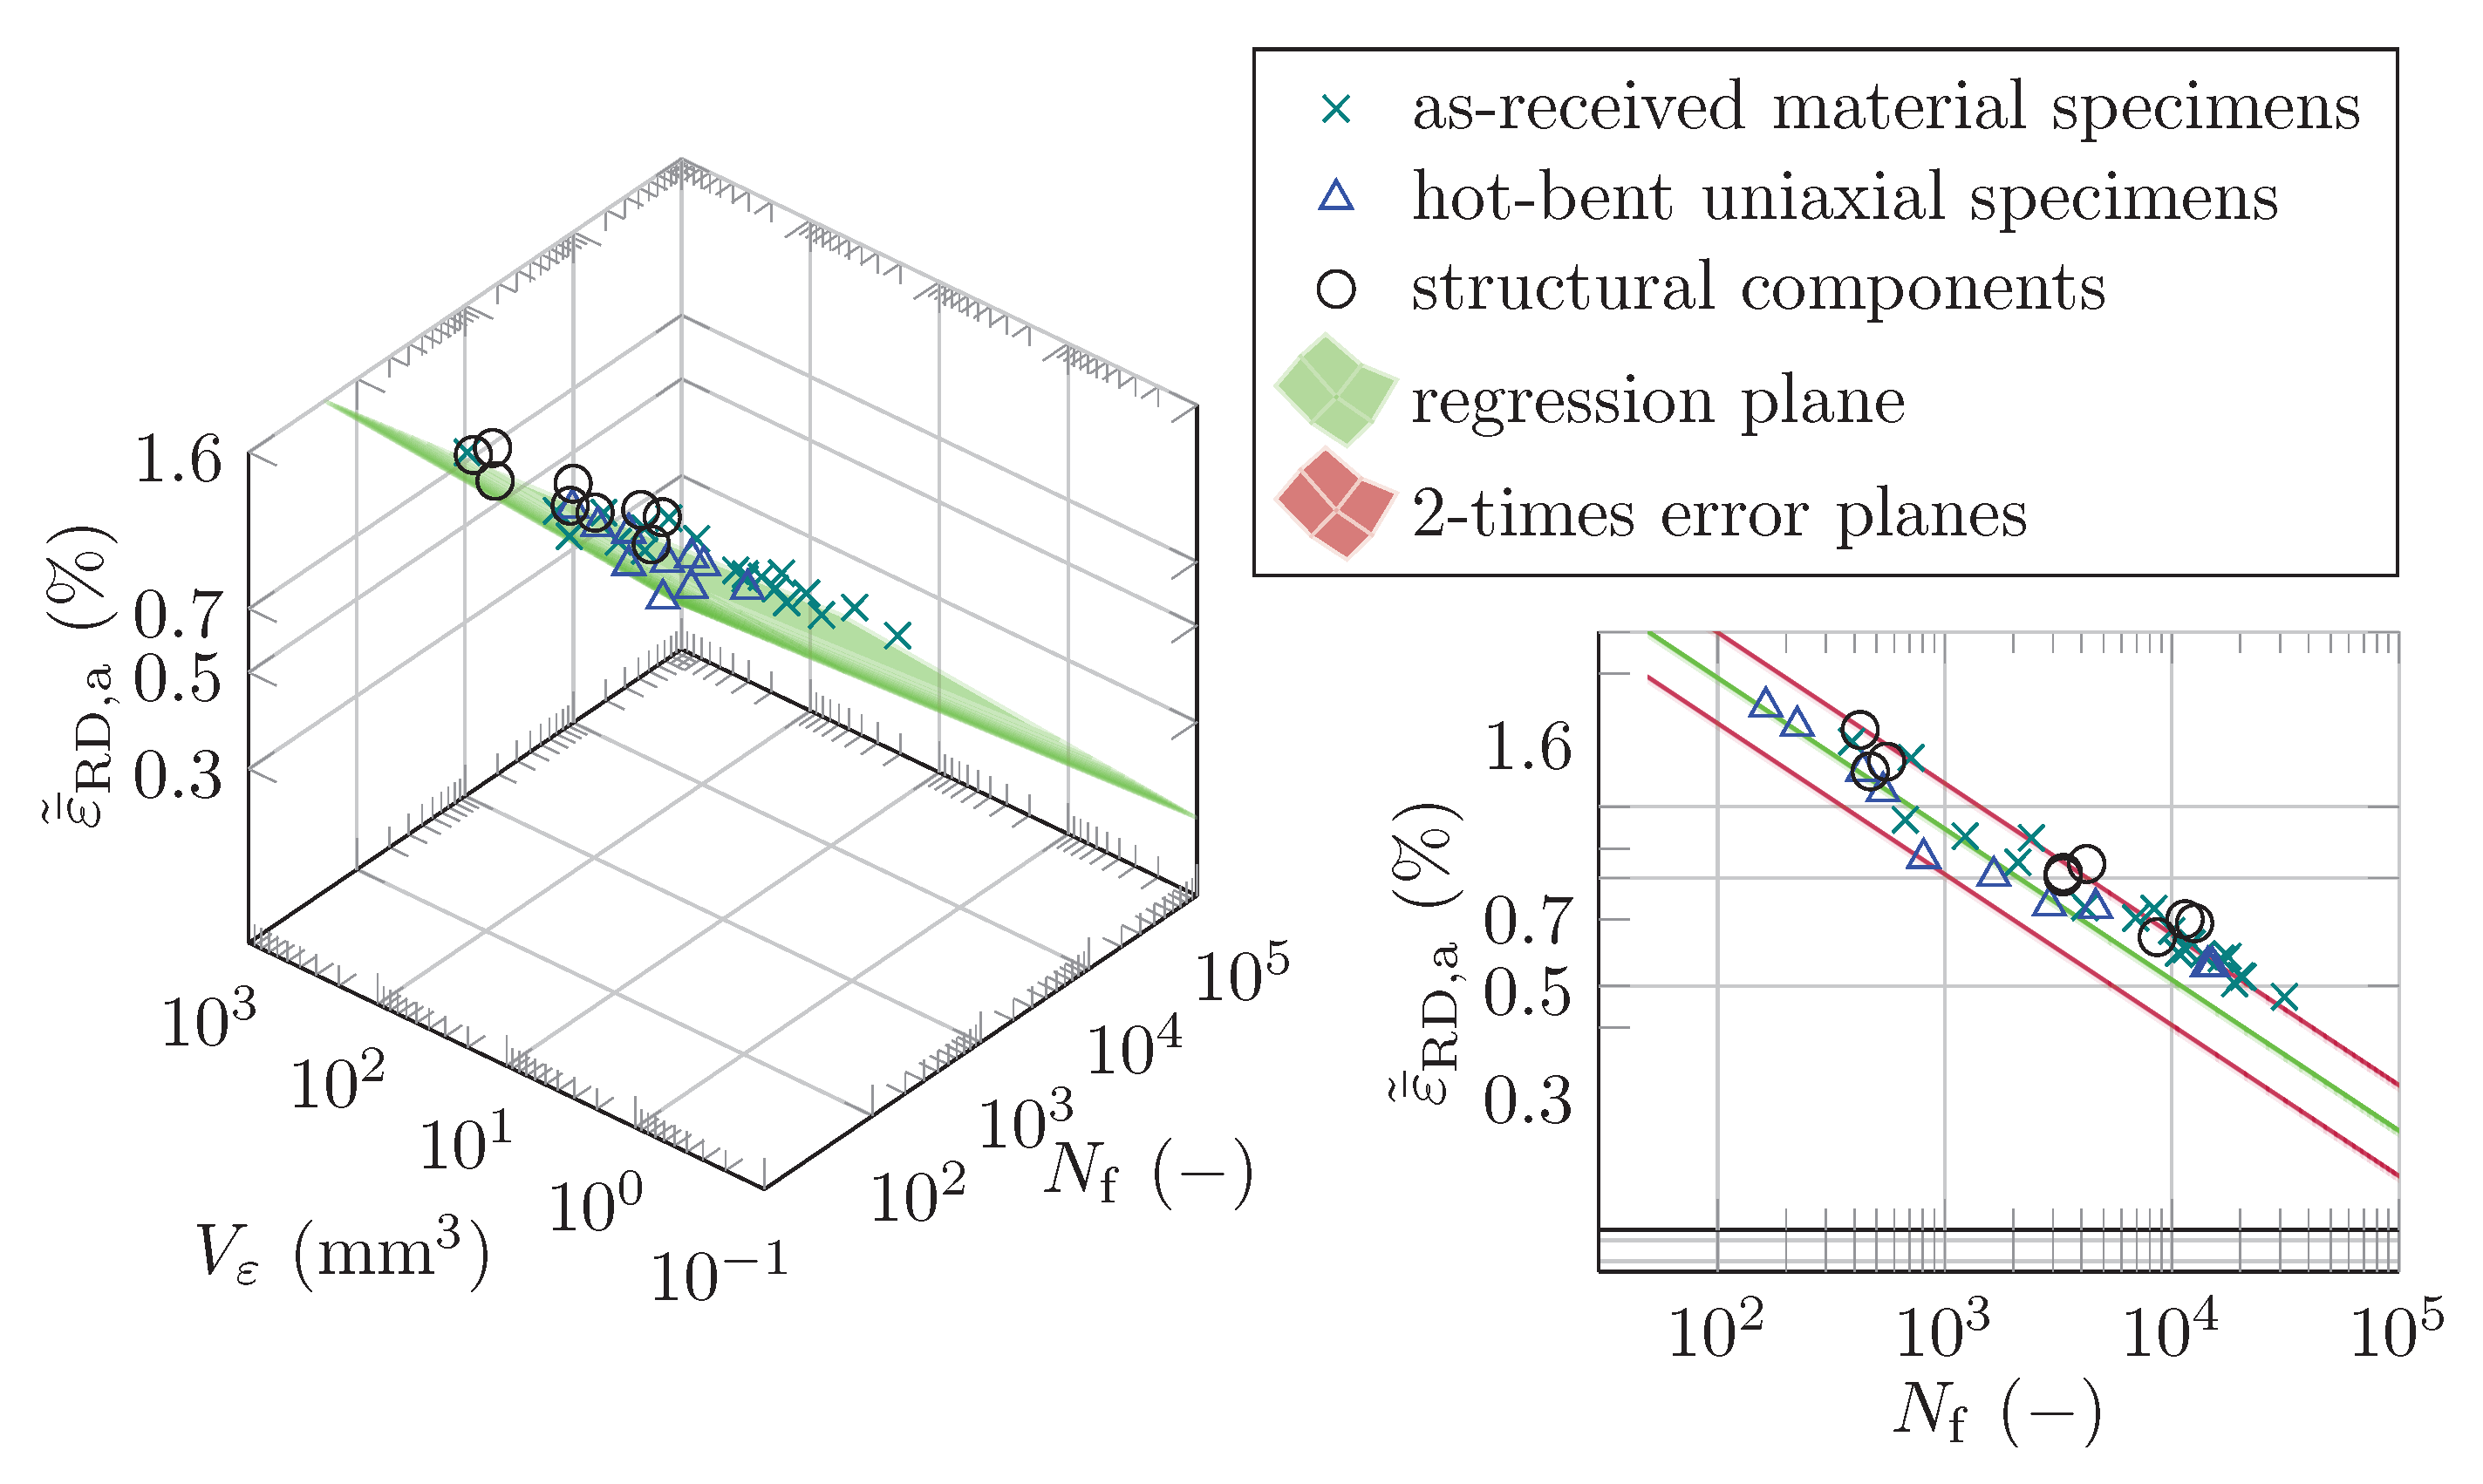
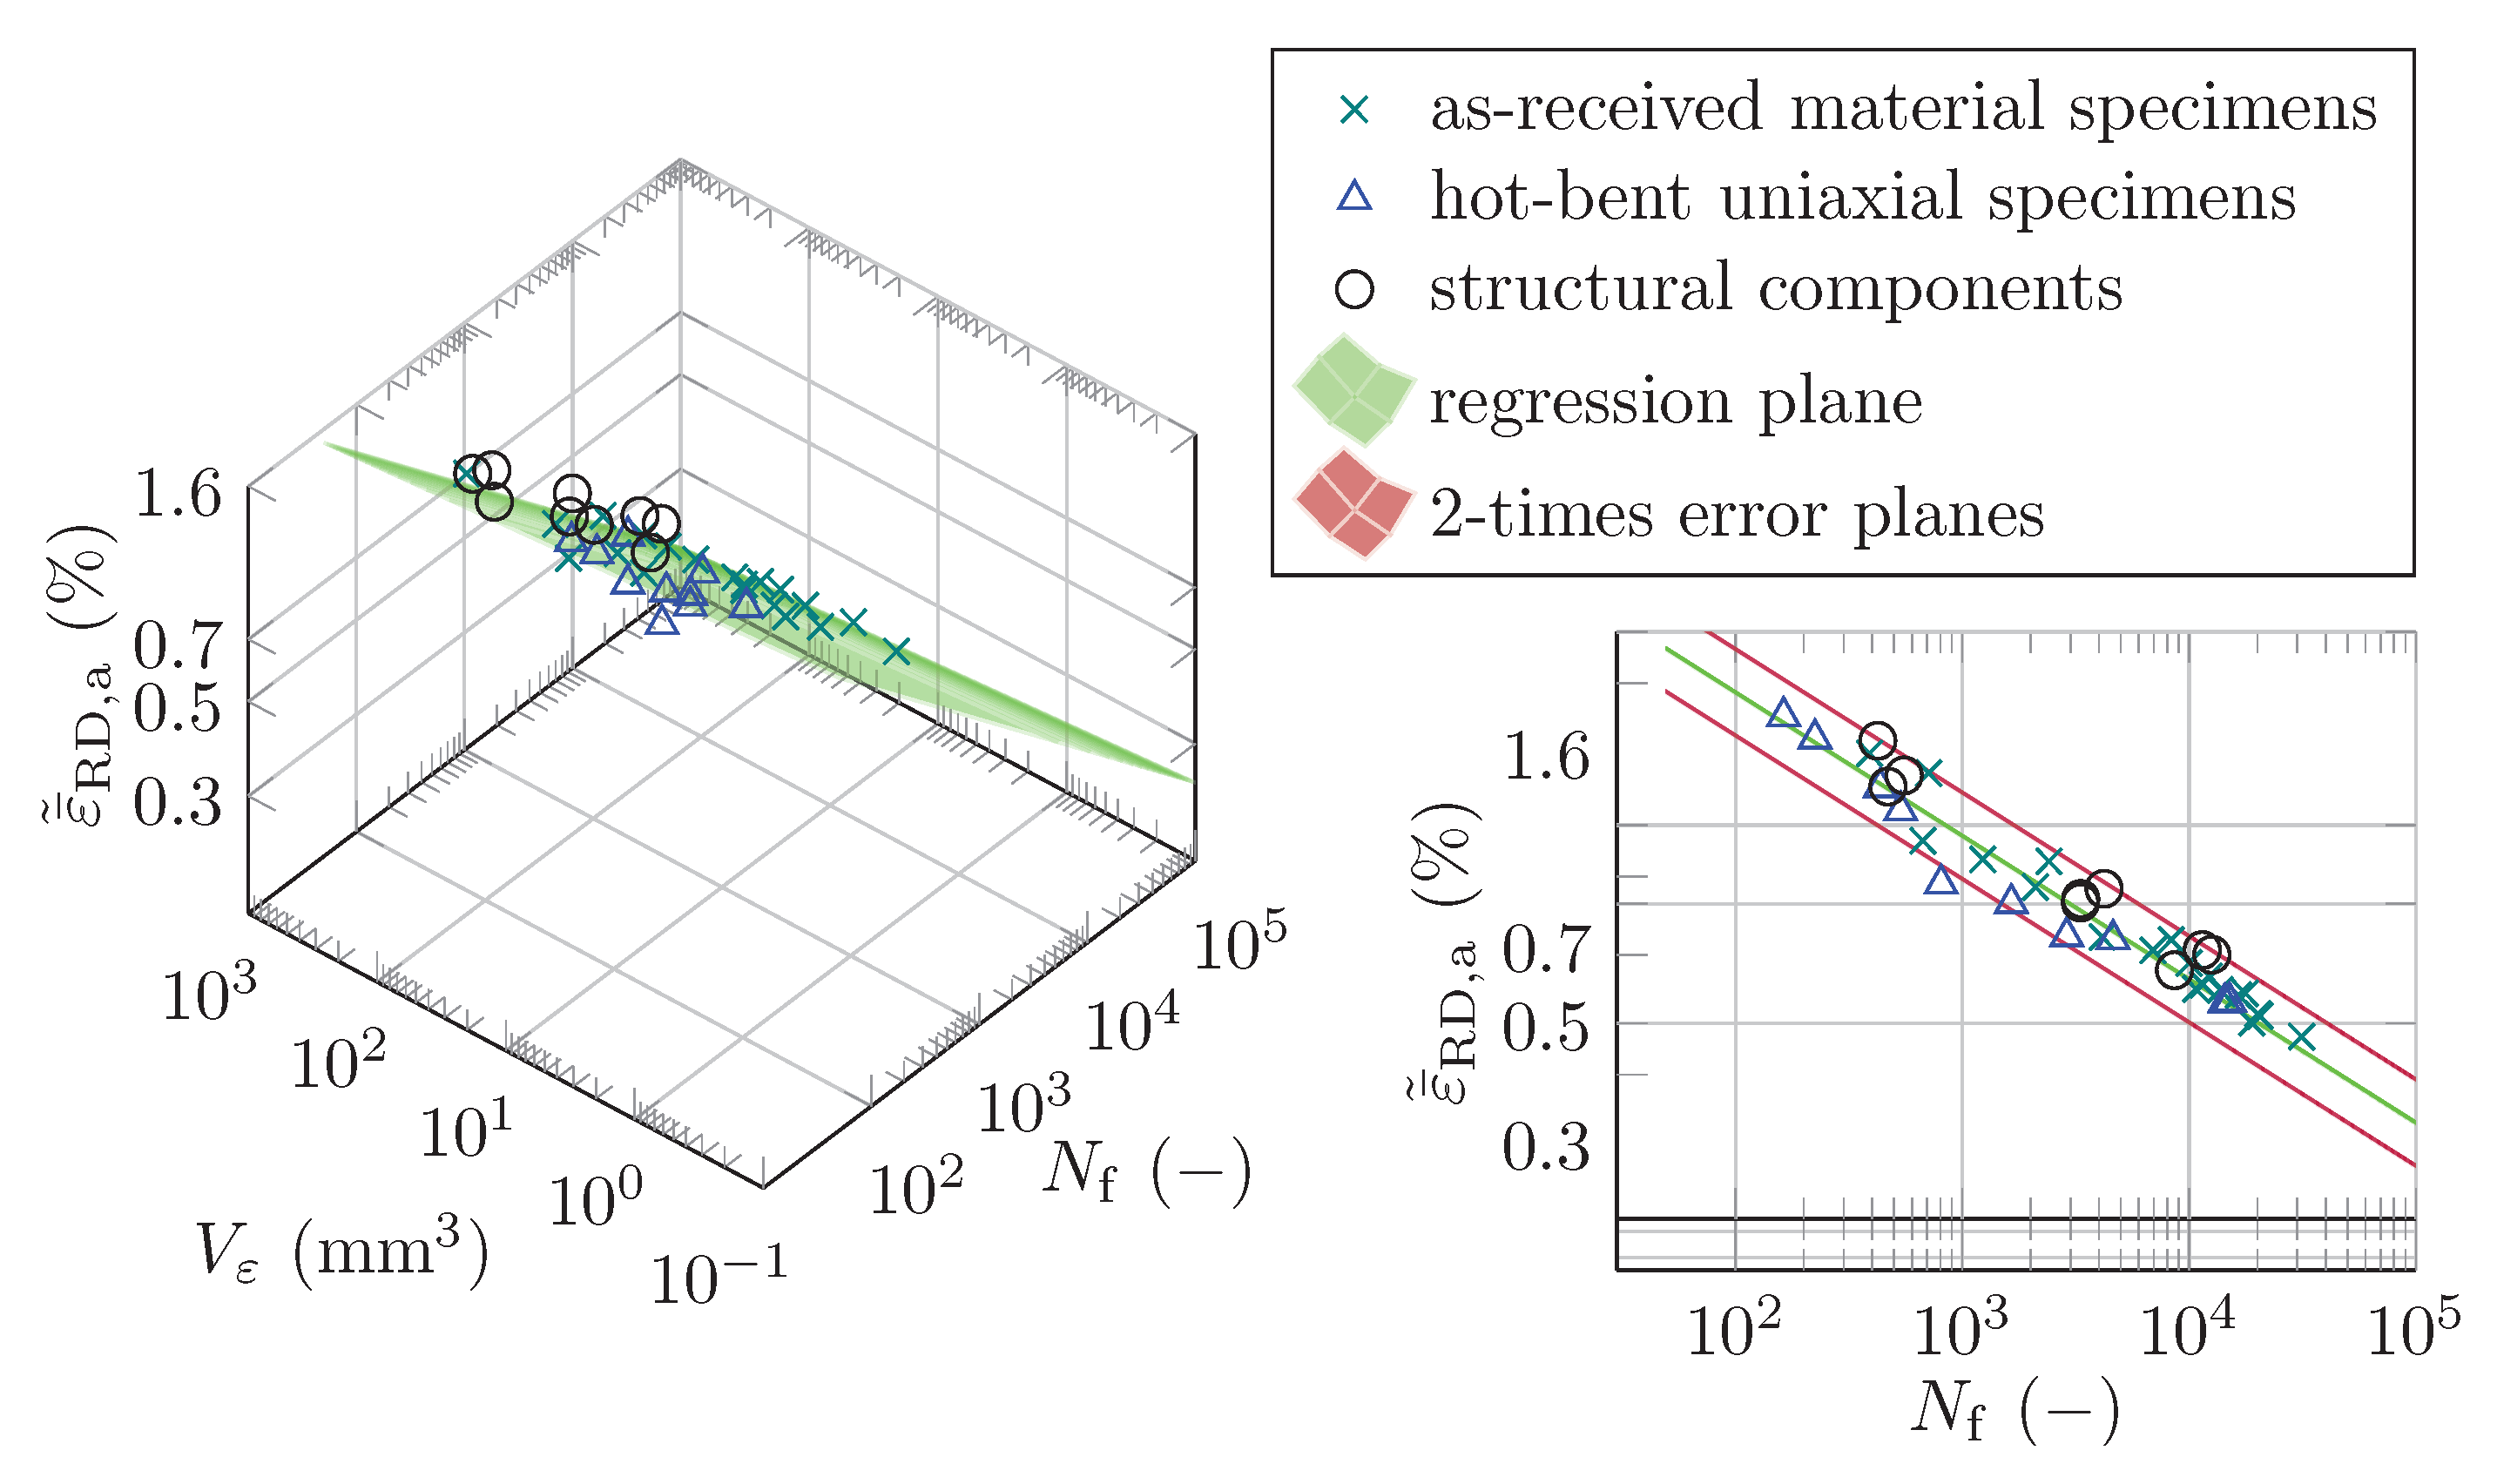
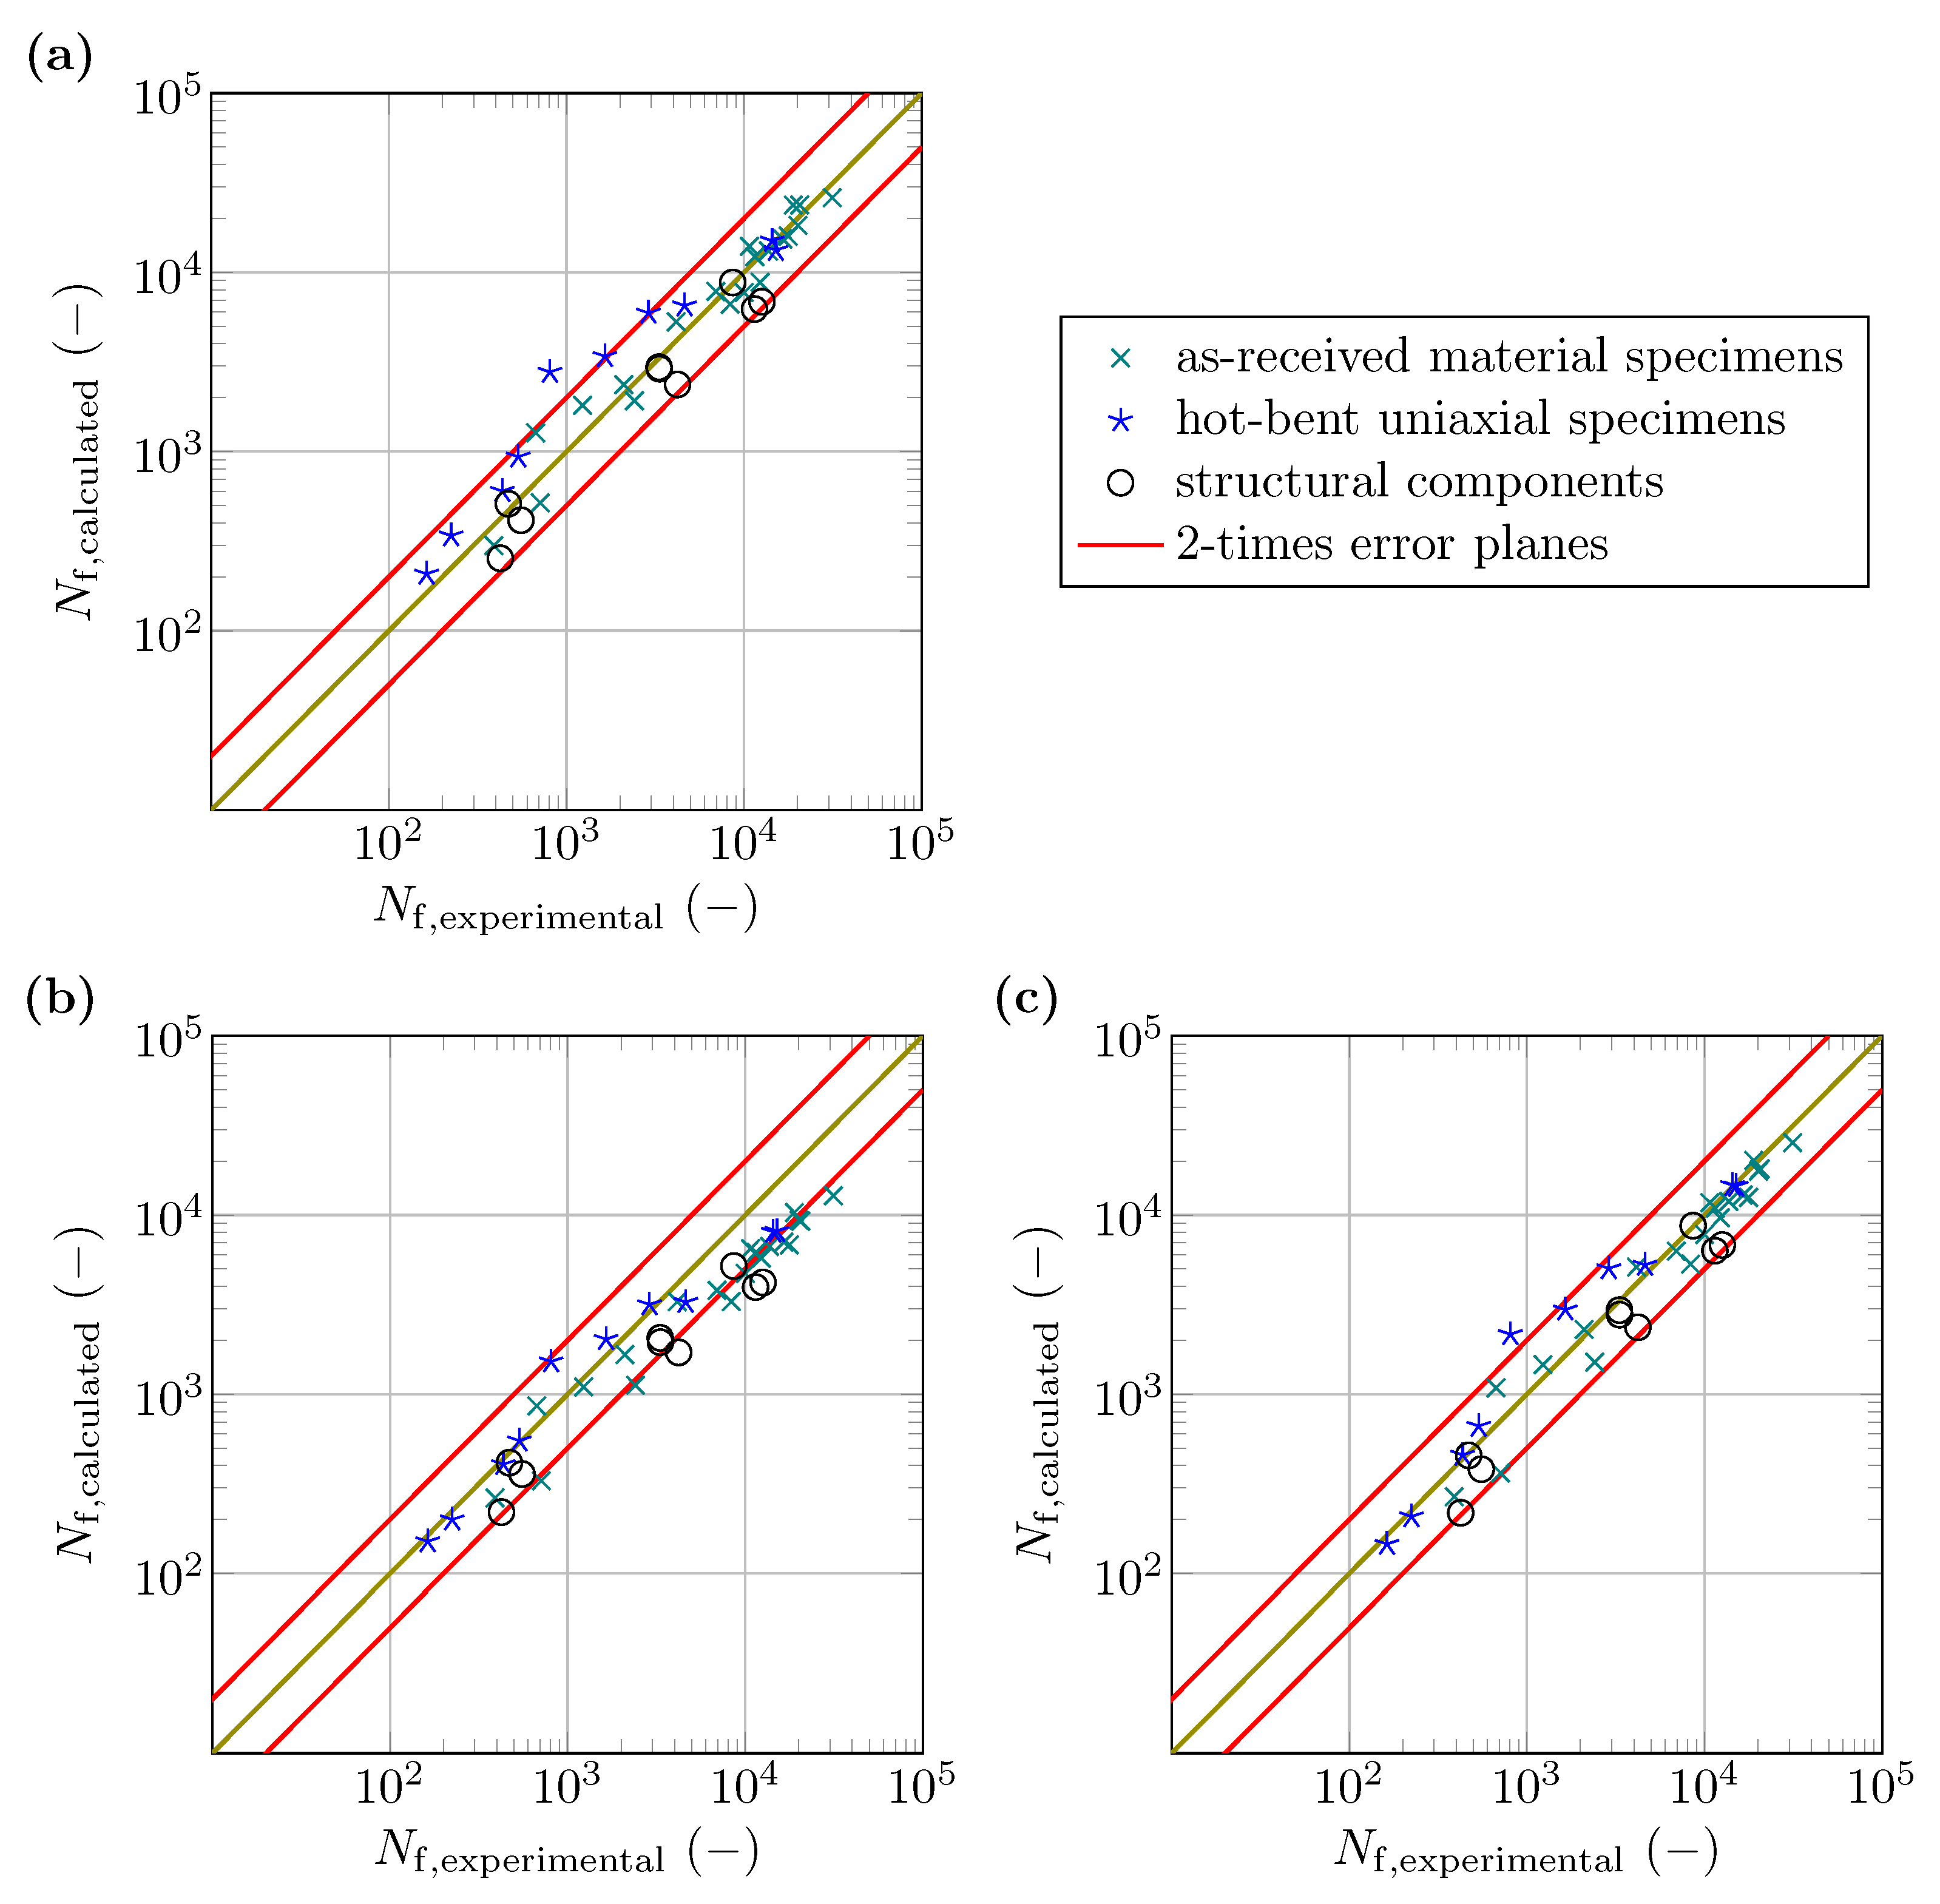
  • The study shows that fatigue models developed with data from uniaxial experiments and the CH ε V can represent the fatigue life of the tested structural components made of the wrought magnesium alloy AZ31B. In particular, the model developed by using a dataset containing data from both as-received and hot-bent uniaxial specimens shows a satisfactory prediction of the fatigue life of the V-bent specimens. Nevertheless, every model examined tends to underestimate the life of the specimens.

Author Contributions

Conceptualization, F.M., A.N. and O.H.; methodology, F.M. and A.N.; software, F.M.; investigation, F.M. and A.N.; resources, O.H.; writing—original draft preparation, F.M.; writing—review and editing, A.N. and O.H.; visualization, F.M.; supervision, O.H.; project administration, O.H.; funding acquisition, O.H. All authors have read and agreed to the published version of the manuscript.

Funding

The authors acknowledge the financial support of the Bavarian State Ministry of Science and the Arts within the funding program Support of Applied Research and Development at Universities of Applied Sciences 2017-2021 in the project `Lightweight Design’ under grant number VIII.2-F1116.LA/19/2.

Data Availability Statement

The data presented in this study are available on request from the corresponding author.

Conflicts of Interest

The authors declare no conflict of interest.

Abbreviations

The following abbreviations are used in this manuscript:
BSBent specimen
BTGBand of twinned grains
CH ε VConcept of highly strained volume
DICDigital image correlation
EBSDElectron backscatter diffraction
FEMFinite Element Method
LLLLower load level
MgMagnesium
NDNormal direction
RDRolling direction
RMSERoot Mean Square Error
TDTransverse direction
ULLUpper load level
V ε Highly strained volume
ZnZinc

References

  1. Kulekci, M.K. Magnesium and its alloys applications in automotive industry. Int. J. Adv. Manuf. Technol. 2008, 39, 851–865. [Google Scholar] [CrossRef]
  2. Dziubińska, A.; Gontarz, A.; Horzelska, K.; Pieśko, P. The Microstructure and Mechanical Properties of AZ31 Magnesium Alloy Aircraft Brackets Produced by a New Forging Technology. Procedia Manuf. 2015, 2, 337–341. [Google Scholar] [CrossRef] [Green Version]
  3. Istrate, B.; Munteanu, C.; Antoniac, I.V.; Lupescu, S.C. Current Research Studies of Mg-Ca-Zn Biodegradable Alloys Used as Orthopedic Implants—Review. Crystals 2022, 12, 1468. [Google Scholar] [CrossRef]
  4. Ucuncuoglu, S.; Ekerim, A.; Secgin, G.O.; Duygulu, O. Effect of asymmetric rolling process on the microstructure, mechanical properties and texture of AZ31 magnesium alloys sheets produced by twin roll casting technique. J. Magnes. Alloy. 2014, 2, 92–98. [Google Scholar] [CrossRef] [Green Version]
  5. Masoumi, M.; Zarandi, F.; Pekguleryuz, M. Microstructure and texture studies on twin-roll cast AZ31 (Mg-3wt.%Al-1wt.%Zn) alloy and the effect of thermomechanical processing. Mater. Sci. Eng. A 2011, 528, 1268–1279. [Google Scholar] [CrossRef]
  6. Ball, E.A.; Prangnell, P.B. Tensile-compressive yield asymmetries in high strength wrought magnesium alloys. Scr. Metall. Mater. 1994, 31, 111–116. [Google Scholar] [CrossRef]
  7. Agnew, S.R.; Duygulu, O. Plastic anisotropy and the role of non-basal slip in magnesium alloy AZ31B. Int. J. Fatigue 2005, 21, 1161–1193. [Google Scholar] [CrossRef]
  8. Koike, J.; Ohyama, R. Geometrical criterion for the activation of prismatic slip in AZ61 Mg alloy sheets deformed at room temperature. Acta Mater. 2005, 53, 1963–1972. [Google Scholar] [CrossRef]
  9. Denk, J.; Dallmeier, J.; Huber, O.; Saage, H. The fatigue life of notched magnesium sheet metals with emphasis on the effect of bands of twinned grains. Int. J. Fatigue 2017, 98, 212–222. [Google Scholar] [CrossRef]
  10. Anten, K.; Scholtes, B. Formation of macroscopic twin bands and inhomogeneous deformation during cyclic tension-compression loading of the Mg-wrought alloy AZ31. Mater. Sci. Eng. A 2019, 746, 217–228. [Google Scholar] [CrossRef]
  11. Denk, J.; Nischler, A.; Whitmore, L.; Huber, O.; Saage, H. Discontinuous and inhomogeneous strain distributions under monotonic and cyclic loading in textured wrought magnesium alloys. Mater. Sci. Eng. A 2019, 764, 138182. [Google Scholar] [CrossRef]
  12. Nischler, A.; Denk, J.; Huber, O. Fatigue modeling for wrought magnesium structures with various fatigue parameters and the concept of highly strained volume. Continuum. Mech. Therm. 2020, 33, 35–51. [Google Scholar] [CrossRef] [Green Version]
  13. Nischler, A.; Denk, J.; Saage, H.; Klaus, H.; Huber, O. Low-cycle fatigue behavior of hot-bent basal textured AZ31B wrought magnesium alloy. Metals 2021, 11, 1004. [Google Scholar] [CrossRef]
  14. Baird, J.C.; Li, B.; Parast, S.Y.; Horstemeyer, S.J.; Hector, L.G.; Wang, P.T.; Horstemeyer, M.F. Localized twin bands in sheet bending of a magnesium alloy. Scr. Mater. 2012, 67, 471–474. [Google Scholar] [CrossRef]
  15. McClelland, Z.; Li, B.; Horstemeyer, S.J.; Brauer, S.; Adedoyin, A.A.; Hector, L.G.; Horstemeyer, M.F. Geometrically necessary twins in bending of a magnesium alloy. Mater. Sci. Eng. A 2015, 645, 298–305. [Google Scholar] [CrossRef]
  16. Roostaei, A.A.; Ling, Y.; Jahed, H.; Glinka, G. Applications of Neuber’s and Glinka’s notch plasticity correction rules to asymmetric magnesium alloys under cyclic load. Theor. Appl. Fract. Mech. 2020, 105, 102431. [Google Scholar] [CrossRef]
  17. Dallmeier, J.; Huber, O.; Saage, H.; Eigenfeld, K. Uniaxial cyclic deformation and fatigue behavior of AM50 magnesium alloy sheet metals under symmetric and asymmetric loadings. Mater. Des. 2015, 70, 10–30. [Google Scholar] [CrossRef]
  18. Lin, Y.C.; Chen, X.M.; Liu, Z.H.; Chen, J. Investigation of uniaxial low-cycle fatigue failure behavior of hot-rolled AZ91 magnesium alloy. Int. J. Fatigue 2013, 48, 122–132. [Google Scholar] [CrossRef]
  19. Wu, L.; Agnew, S.R.; Ren, Y.; Brown, D.W.; Clausen, B.; Stoica, G.M.; Wenk, H.R.; Liaw, P.K. The effects of texture and extension twinning on the low-cycle fatigue behavior of a rolled magnesium alloy, AZ31B. Mater. Sci. Eng. A 2010, 527, 7057–7067. [Google Scholar] [CrossRef]
  20. Jabbari, A.; Sedighi, M.; Jahed, H.; Sommitsch, C. Low cycle fatigue behavior of AZ31B extrusion at elevated temperatures. Int. J. Fatigue 2020, 139, 105803. [Google Scholar] [CrossRef]
  21. Roostaei, A.A.; Jahed, H. Multiaxial cyclic behaviour and fatigue modelling of AM30 Mg alloy extrusion. Int. J. Fatigue 2017, 97, 150–161. [Google Scholar] [CrossRef]
  22. Albinmousa, J.; Jahed, H.; Lambert, S. Cyclic behaviour of wrought magnesium alloy under multiaxial load. Int. J. Fatigue 2011, 33, 1127–1139. [Google Scholar] [CrossRef]
  23. Denk, J.; Whitmore, L.; Huber, O.; Diwald, O.; Saage, H. Concept of the highly strained volume for fatigue modeling of wrought magnesium alloys. Int. J. Fatigue 2018, 117, 283–291. [Google Scholar] [CrossRef]
  24. Beausir, B.; Fundenberger, J.J. Analysis Tools for Electron and X-ray Diffraction, ATEX-Software; Université de Lorraine—Metz: Metz, France, 2017; Available online: http://www.atex-software.eu (accessed on 17 January 2023).
  25. Al-Samman, T.; Gottstein, G. Dynamic recrystallization during high temperature deformation of magnesium. Mater. Sci. Eng. A 2008, 490, 411–420. [Google Scholar] [CrossRef]
Figure 1. Variations of the structural component specimen: (a) blank of the structural component specimen with a global ( x 1 , x 2 , x 3 ) -coordinate system; (b) the investigated versions of the structural component with a cylindrical coordinate system ( r , φ , x 2 ) in the gauge area.
Crystals 13 00184 g001
Figure 2. Forming tool and structural component specimen: (a) setup of the forming tool with inserted structural component, thermocouple and modular exchangeable radius punches (blue) and dies (red); (b) modular exchangeable radius punches and dies of the respective structural component variant.
Crystals 13 00184 g002
Figure 3. Test setup for force-controlled LCF tests on V-bent structural components using 3D digital image correlation for strain measurement.
Crystals 13 00184 g003
Figure 4. Numerical simulation of the structural component made of AZ31B with bending radius R BS 12 = 12   m m : (a) stress field σ φ φ ( r , φ , x 2 ) of a FEM quarter model at a given load of F = 275   N in x 1 -direction; (b) stress σ φ φ along the path L x 2 ; (c) stress σ φ φ along the path L x 3 ; (d) stress σ φ φ along the path L φ .
Crystals 13 00184 g004
Figure 5. Numerical simulation of the structural component made of AZ31B with bending radius R BS 12 = 12   m m : (a) stress field σ 22 ( r , φ , x 2 ) of a FEM quarter model at a given load of F = 275   N in x 1 -direction; (b) stress σ 22 over the path L x 2 ; (c) stress σ 22 over the path L φ ; (d) stress ratio σ 22 / σ φ φ over the path L x 2 ; (e) stress ratio σ 22 / σ φ φ over the path L φ .
Crystals 13 00184 g005
Figure 6. Gauge area and microstructure of the structural component specimen BS9-003 made of AZ31B after the bending process: (a) overview of the gauge area with line-shaped BTG; (b) band structure with high and low densities of twins due to the bending process; (c) magnified view of areas of high and low density of twins.
Crystals 13 00184 g006
Figure 7. EBSD measurement with view in TD of the structural component specimen BS9-003 made of AZ31B after the bending process: (a) orientation map including a BTG with scanning step size of 1.00   μ m and reference view in ND; (b) orientation map including a BTG with scanning step size of 1.00   μ m and reference view in RD; (c) orientation map within the BTG with reference view in ND and scanning step size of 0.115   μ m ; (d) band contrast with detected { 10 1 ¯ 2 } tension twins marked with red lines and borders of BTG marked with green lines.
Crystals 13 00184 g007
Figure 8. ( 0002 ) pole figures of (a) the as-received material with view in the ND [13] and (b) the V-bent specimen BS9-003 made of AZ31B after the bending process with view in the TD.
Crystals 13 00184 g008
Figure 9. Gauge area and microstructure of the structural component specimen BS9-008 made of AZ31B after cyclic loading with R F = 1 and F a = 1104   N : (a) overview of the gauge area with visible cracks; (b) crack in the area of twinned grains in the center of the specimen at x 2 = 0 ; (c) magnified view at the crack tip; (d) magnified view at the origin of the crack with visible twins.
Crystals 13 00184 g009
Figure 10. EBSD measurements of the structural component specimen BS9-008 made of AZ31B after cyclic loading: (a) EBSD orientation map of the specimen BS9-008 with scanning step size of 1   μ m with reference direction in ND; (b) EBSD orientation map of the specimen BS9-008 with scanning step size of 0.115   μ m with visible serrated grain boundaries and reference direction in ND; (c) ( 0002 ) pole figure of the specimen BS9-008 with view in TD.
Crystals 13 00184 g010
Figure 11. Three-dimensional and two-dimensional ε ¯ ˜ RD , a - V ε - N f fatigue diagrams by applying the CH ε V with regression parameters from results of low-cycle fatigue tests of the as-received material specimens.
Crystals 13 00184 g011
Figure 12. Three-dimensional and two-dimensional ε ¯ ˜ RD , a - V ε - N f fatigue diagrams by applying the CH ε V with regression parameters from results of low-cycle fatigue tests of the hot-bent uniaxial specimens.
Crystals 13 00184 g012
Figure 13. Three-dimensional and two-dimensional ε ¯ ˜ RD , a - V ε - N f fatigue diagrams by applying the CH ε V with combined regression parameters from results of low-cycle fatigue tests of the as-received material specimens and hot-bent uniaxial specimens.
Crystals 13 00184 g013
Figure 14. Comparison of the calculated and experimentally determined numbers of cycles to failure N f : (a) model with the regression parameters of the as-received material specimens; (b) model with the regression parameters of the hot-bent uniaxial specimens; (c) model with the regression parameters of the combined as-received material specimens and hot-bent uniaxial specimens.
Crystals 13 00184 g014
Table 1. Chemical composition of the AZ31B sheet metal in weight percent ( wt % ).
MgAlZnMnCuSiFeNiCaOther Impurities
balance2.751.080.3680.002620.01870.002820.000380.00041<0.004
Table 2. Parameters of the LCF tests: Applied force amplitude F a , force ratio R F , the test frequency f, the highly strained volume V ε , the mean effective strain amplitude ε ¯ ˜ φ φ , a and the numbers of cycles to failure N f of the force-controlled cyclic tests.
Specimen ID F a  (N) R F  (-)f (Hz) V ε (mm 3 ) ε ¯ ˜ φ φ , a (%) N f (-)
BS12-011750 1 1.03350.42111,427
BS12-003900 1 1.04860.5424216
BS12-0121200 1 0.22981.03424
BS9-010690 1 1.02480.41612,592
BS9-009828 1 0.54190.5133319
BS9-0081104 1 0.25260.879554
BS6-008615 1 1.02190.3908623
BS6-007738 1 0.52700.5273329
BS6-009984 1 0.23110.849470
Disclaimer/Publisher’s Note: The statements, opinions and data contained in all publications are solely those of the individual author(s) and contributor(s) and not of MDPI and/or the editor(s). MDPI and/or the editor(s) disclaim responsibility for any injury to people or property resulting from any ideas, methods, instructions or products referred to in the content.

