Article

Crystal Growth and the Structure of a New Quaternary Adamantine Cu☐GaGeS4

1
Helmholtz-Zentrum Berlin für Materialien und Energie, Department Structure and Dynamics of Energy Materials, Hahn-Meitner-Platz 1, 14109 Berlin, Germany
2
Department Geosciences, Free University Berlin, Malteserstrasse 74-100, 12249 Berlin, Germany
*
Author to whom correspondence should be addressed.
Crystals 2023, 13(11), 1545; https://doi.org/10.3390/cryst13111545
Submission received: 4 October 2023 / Revised: 17 October 2023 / Accepted: 23 October 2023 / Published: 27 October 2023
(This article belongs to the Section Materials for Energy Applications)

Abstract

:
Single crystals of quaternary adamantine-type Cu☐GaGeS4 were grown using the chemical vapor transport technique, with iodine as the transport agent. Dark red transparent crystals were grown in a temperature gradient of ΔT = 900–750 °C. Chemical characterization by X-ray fluorescence showed the off-stoichiometric composition of Cu☐GaGeS4 crystals—in particular, a slight Ge deficiency was observed. By X-ray diffraction, Cu☐GaGeS4 was found to adopt the chalcopyrite-type structure with the space group I 4 ¯ 2 d . Cation distribution in this structure was analyzed by multiple energy anomalous synchrotron X-ray diffraction, and it was found that Cu and vacancies occupied the 4a site, whereas Ga and Ge occupied the 4b site. The band gap energies of several off-stoichiometric Cu☐GaGeS4 crystals were determined by UV-Vis spectroscopy and ranged from 2.1 to 2.4 eV. A non-linear correlation of the band gap energy with the Ge content of the compound was shown to follow the usual bowing behavior of semiconductor alloys, with a bowing parameter of b   = −1.45 (0.08).

1. Introduction

“Adamantine”-type compounds, including kesterites, are currently the most promising material for the development of a fully inorganic thin-film photovoltaic technology that is free of critical raw materials and thus provides sustainable solutions. The highest efficiency for fully inorganic thin-film photovoltaic technologies is exhibited by thin-film solar cells based on the ternary chalcopyrite-type compound semiconductor Cu(In,Ga)S2 (CIGS), with a record power conversion efficiency of 23.6% [1]. This absorber material belongs to the ternary AIBIIIXVI2 chalcopyrite-type compound, belonging to the adamantine compound family as well. One focus of research in solar energy conversion is hybrid halide perovskites, which result in thin-film devices with a record efficiency of 26.1% [1]. Despite their undisputed high efficiency, hybrid halide perovskites have some drawbacks; materials (and thus solar cell devices) have no long-term stability, and they contain lead, which is a critical toxicity issue. Furthermore, the use of Pb-containing absorber materials is not in line with the EU Directive 2002/95/EC (also known as the RoHS Directive), thereby restricting the use of lead in electrical and electronic equipment [2]. Therefore, the development of compound semiconductors that are free of critical raw materials and are long-term stable is crucial for the transition away from fossil fuels and the move toward a greener energy future. These compound semiconductors are promising materials both in single-junction solar cells and as top absorber layers in tandem cells.
The ternary AIBIIIXVI2 chalcopyrite compound family, which includes the compound semiconductor Cu(In,Ga)Se2—used as an absorber layer in high-efficiency thin-film solar cells—can be transformed into two different quaternary adamantines by chemical substitutions by obeying the valence octet rule. Due to added chemical and structural freedom, these quaternary compounds have some novel and exciting properties.
The first possible substitution would be 2 B I I I B I I + C I V , resulting in quaternary compound semiconductors AI2BIICIVXVI4. Such materials have recently attracted considerable attention because of their potential low costs and high-efficiency solar cell absorbers. Thin-film solar cells based on kesterite-type Cu2ZnSn(S,Se)4 (CZTSSe) not only show a record power conversion efficiency of 14.9% [1] but also show excellent long-term stability and do not contain toxic or critical components. Due to these advantages, kesterite-based thin-film solar cells are currently the only critical raw material-free and the most promising fully inorganic photovoltaic technologies. Cation alloying for band gap engineering and the extrinsic doping of kesterites to increase the power conversion efficiency of related devices have been performed by several groups. Alloying CZTSe with Ge generates solar cells with an efficiency of 12.3% [3] and alloying CZTSSe with Ag pushes the device’s efficiency to 12.96% [4]. In these Ag-alloyed kesterites, mixed crystals adopt a stannite-type structure, completely blocking Cu/Zn disorder [5]—a possible reason for high VOC deficits in CZTSSe-based devices. Extrinsic doping with alkali metals has been successfully used in chalcopyrite-type CIGS to achieve high energy-conversion efficiencies [6]. This approach has also been successfully adopted for kesterites. Extrinsic doping with Li can also shift the efficiency of CZTSSe to above 10% [7].
The second possible substitution would be A I + B I I I C I V + ☐, resulting in quaternary semiconductors AI☐BIIICIVXVI4 (the symbol ☐ indicates cation vacancies, i.e., empty cation sites in the crystal structure). These compounds are referred to as defect adamantines [8] and can be considered potential absorber materials for thin-film solar cell applications. However, studies on defect adamantines have made little progress since the first report by Pamplin [8]. Only a few studies on defect adamantine selenides have been published [9,10,11], but less information is available on sulfides [12,13]. Currently, this class of material is undergoing a renaissance because of its potential use in photovoltaic applications. For example, two studies on electronic structures and optical properties of defect adamantines have been performed by Shen et al. [14,15]. These investigations, using first-principle calculations, showed that the values of band gap energies of Cu☐GaSnSe4 and Cu☐GaGeSe4 were suitable for photovoltaic applications. Experimental studies on Cu☐GaGeSe4 thin films [16] have shown that these compounds can be successfully used as absorber layers in thin-film solar cells. Additionally, non-linear optical parameters, such as the non-linear refractive index, have been determined [16]. Thin-film solar cells based on a Cu☐InGeSe4 absorber showed a power conversion efficiency of 2.38% [17]. The crystal structure of the defect adamantine Cu☐AlGeSe4 was studied by Quintero et al. [18].
In general, little is known about sulfide adamantines. In this work, a detailed study of the structural and optoelectronic properties of Cu☐GaGeS4 was performed by preparing single crystals as representative materials.

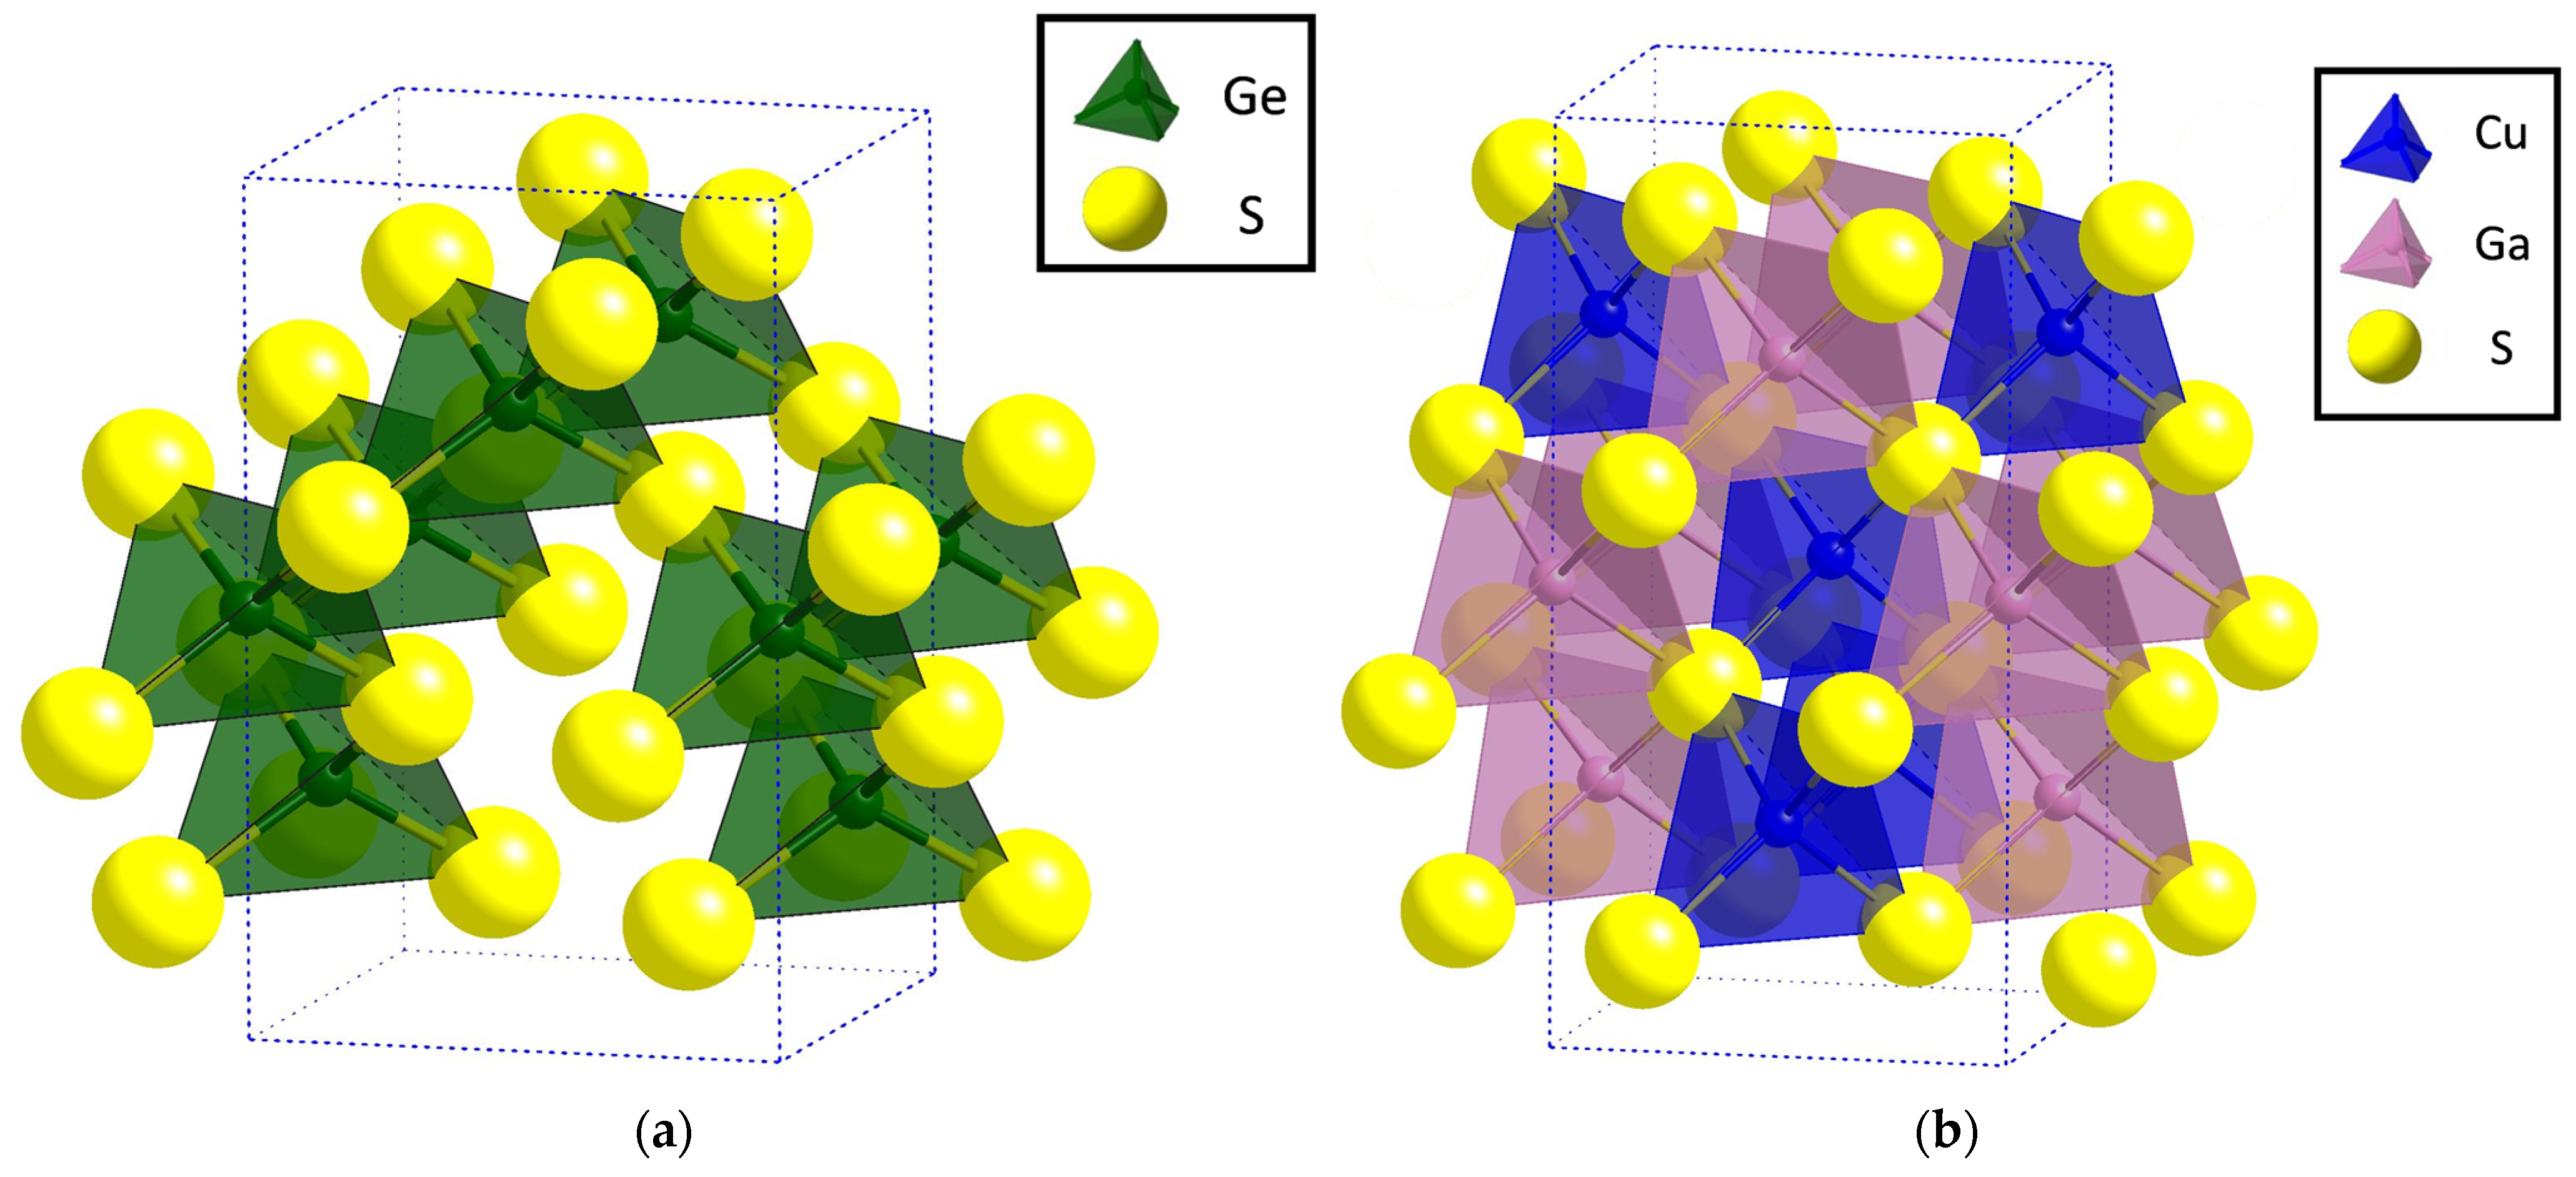
1.1. Structural Considerations

Adamantines crystallize in tetrahedrally coordinated structures and were derived from diamond-type (space group F d 3 ¯ m ) and lonsdaleite-type (space group P 6 3 m m c ) crystal structures. Pamplin [8] summarized 249 adamantines derived from these two different crystal structures of carbon (diamond and lonsdaleite). A pre-requisite is not only the tetrahedral coordination of cations by anions and vice versa, but also that four electrons exist per structural site and that the number of cations and anions is equal. In the case where a structural site is a vacancy, such as in AI☐BIIICIVXVI4 compounds, the compounds are referred to as “defect adamantine”.
Ternary compounds of the adamantine family, with general formula AIBIIIXVI2, crystallize in the chalcopyrite-type crystal structure (space group I 4 ¯ 2 d ) and belong to the tetragonal crystal system. In this crystal structure, each metal ion is tetrahedrally coordinated with four chalcogen anions and vice versa. Each anion is bonded to two mono-valent and two three-valent cations (Figure 1). In the chalcopyrite-type crystal structure, the AI cation occupies the Wyckoff position 4a at (0, 0, 0), and the BIII cation occupies the 4b position at (0, 0, 0.5). The anions occupy the Wyckoff position 8d at (x, 0.25, 0.125).
Quaternary compounds of the adamantine family are of AI2BIICIVXVI4 and AI☐BIIICIVXVI4 types. Figure 1 shows that the distribution of metal ions is important and determines the crystal structure of the quaternary compound. AI☐BIIICIVXVI4 defect adamantines are formed from ternary chalcopyrite-type compounds by doubling the entire formula unit (AIBIIIXVI2) and replacing one A1+ and one B3+ cation with one C4+ cation. This results in a balanced valence but an unbalanced cation–anion ratio (with respect to the ratio of cation and anion sites in the chalcopyrite-type structure). Accordingly, the structure must be compensated by vacancies (AI + BIII ↔ vacancy + CIV).

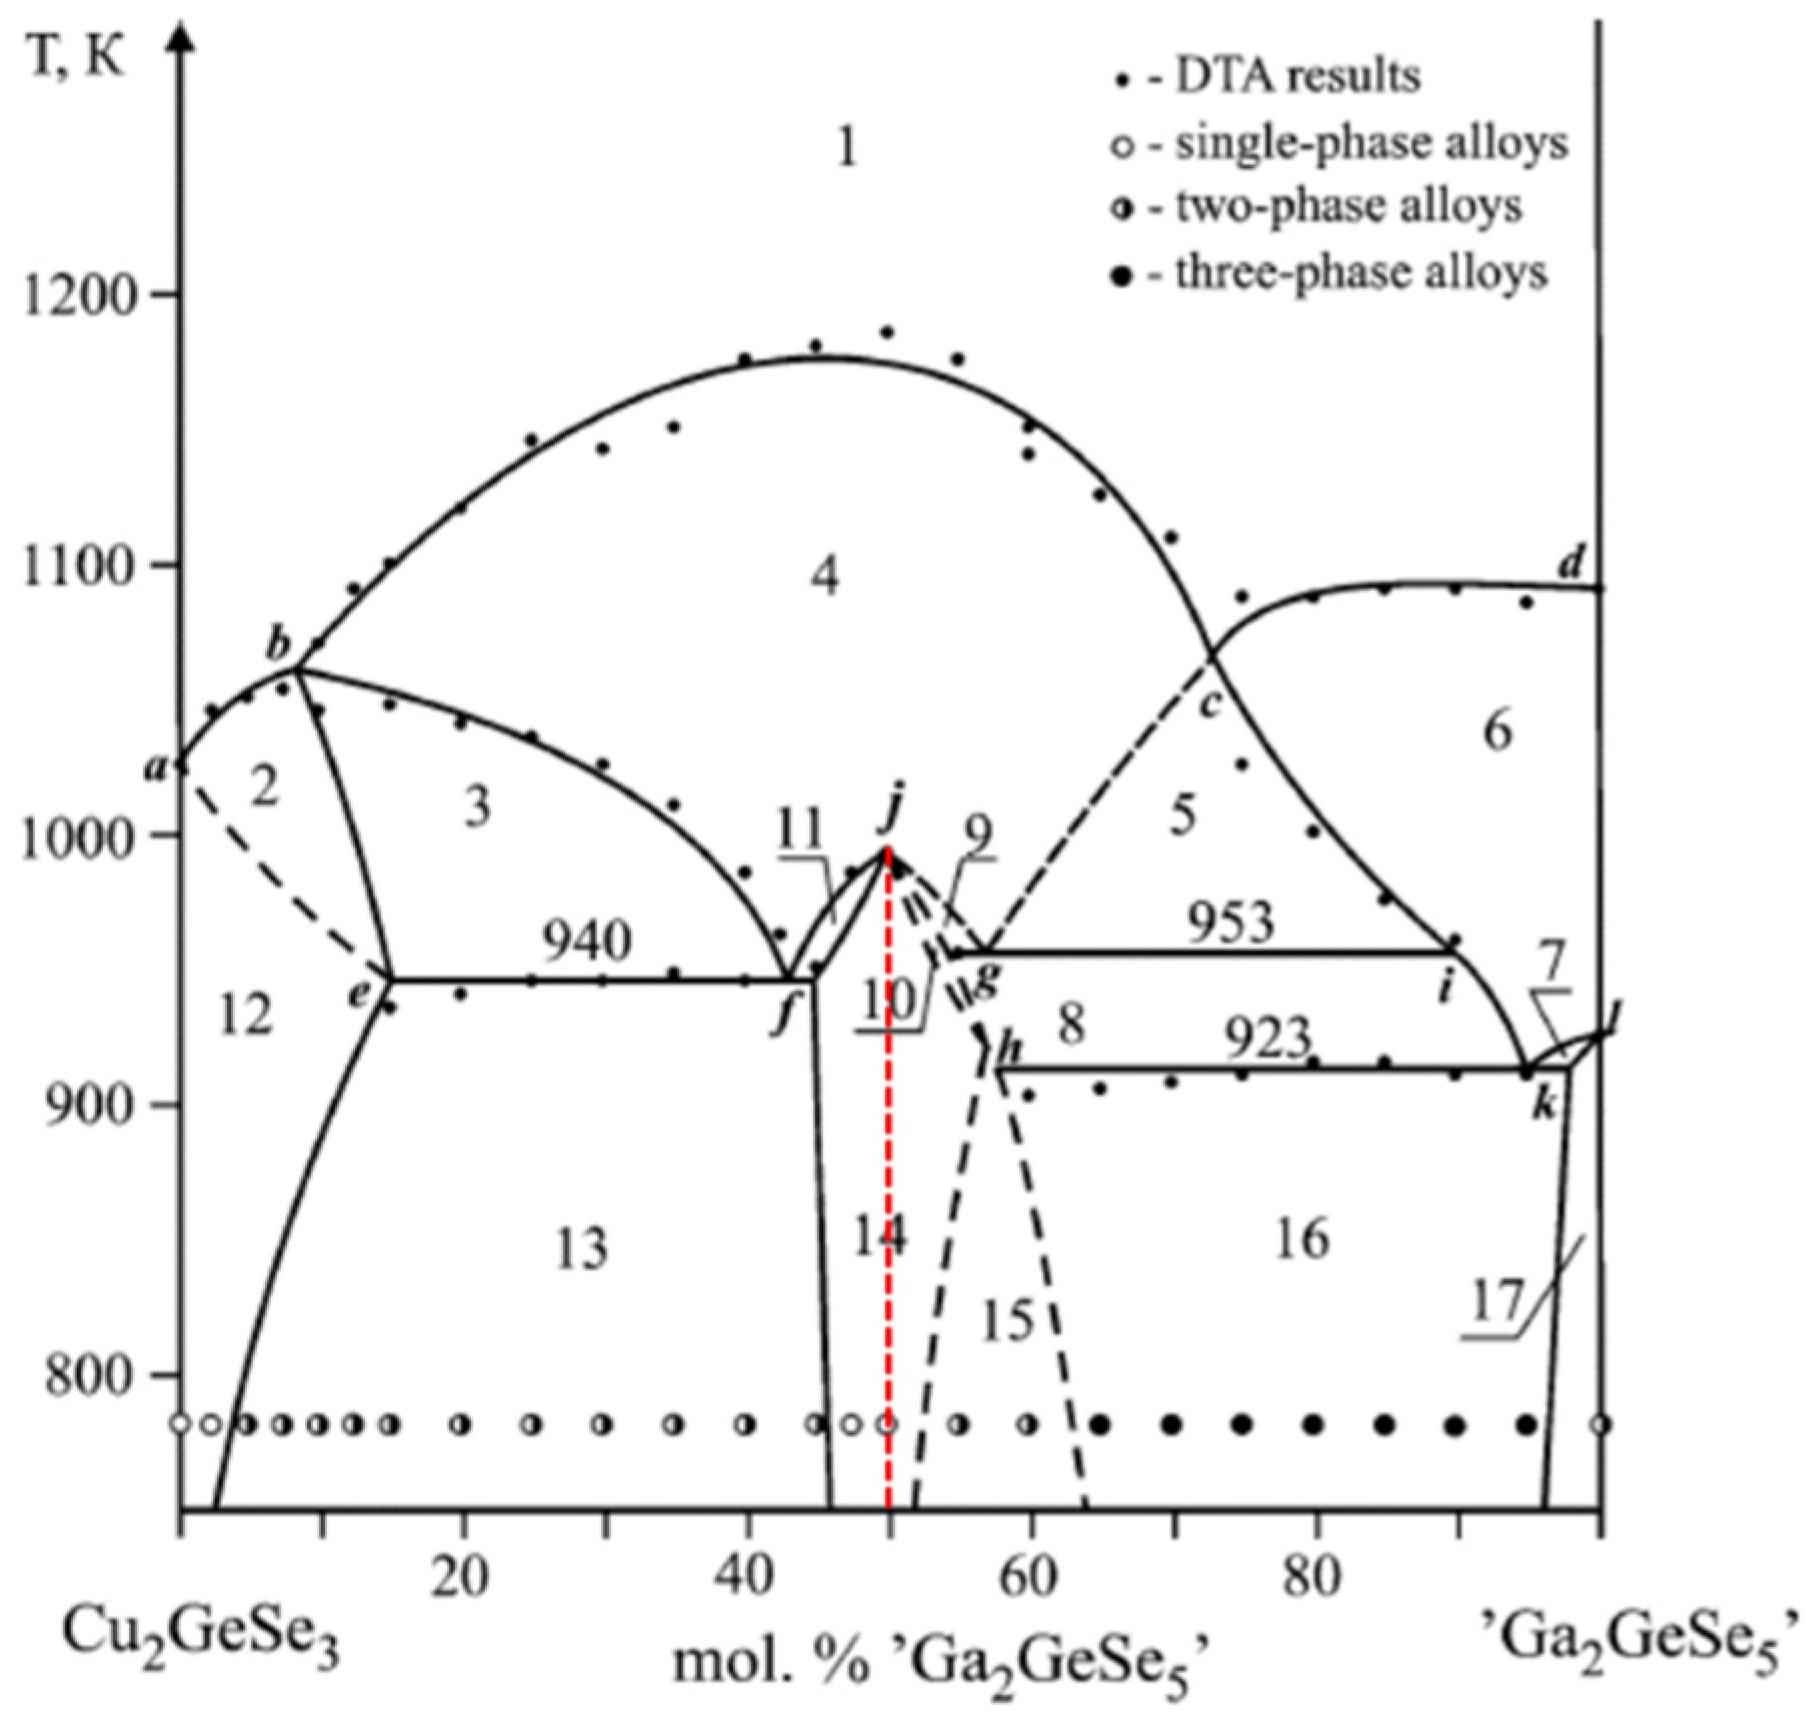
1.2. Thermodynamic Properties

Limited information is available on the properties of adamantine compounds of interest. Table 1 shows structural information and the melting points and band gap energies of Cu☐GaGeXVI4 with X = S, Se.
Table 1. Material properties of the defect adamantines Cu☐GaGeS4 and Cu☐GaGeSe4.
.Cu☐GaGeS4Cu☐GaGeSe4
tetragonal [13]tetragonal
I 4 ¯ 2 d [19]
tetragonal
I 4 ¯ 2 d [20]
tetragonal
I 4 ¯ 2 d [21]
a (Å)5.334 5.302 5.568 5.5617
c (Å)10.05010.21210.84110.9238
Tmelting (°C)1000 [9] 1000 [22]836 [9]
Tdecomposition (°C) 710 [22]
Eg (eV)2.73 [23] 1.85 [20]1.38 [10]
Little is known about the phase diagram of CuGaS2-GeS2. The phase diagram of Cu2GeSe3-Ga2GeSe5 [24] is used as a reference point for material synthesis (Figure 2). Very complex phase relations in the class of adamantines are obvious here. The presence of peritectic and eutectic points and phase transitions results in rather difficult conditions for single crystal growth.
The most appropriate single crystal growth method is chemical vapor transport (as introduced by Schäfer [25] and Nitsche [26]). With chemical vapor transport (CVT) enhanced by halogens, crystals can be grown below critical temperatures. Such crystals will grow close to thermodynamic equilibrium.
In this study, we report the growth of Cu☐GaGeS4 single crystals using the chemical vapor transport technique. Starting with ternary compound CuGaS2, conditions for growing the single crystals of Cu☐GaGeS4 are investigated. The evolved material and crystals are characterized with respect to chemical composition, crystal structure, and band gap energy.

2. Materials and Methods

2.1. Crystal Growth

Crystal growth experiments were performed using the chemical vapor transport technique (CVT). The starting elements Cu, Ga, Ge, and S were weighed into a glassy carbon boat, which was placed in a quartz glass ampoule of 28 mm diameter and 200 mm length. A halogen element, such as iodine, was used to enhance transport. The ampoule was evacuated, closed, and placed in a two-zone furnace. The iodine reacted with metals at elevated temperatures to form volatile species. Halogen-containing species were then transported from the hot (900 °C) to the cold (750 °C) part of the ampoule. Transport occurred based on the reaction in Equation (1).
C u s + G a s + G e s + 4 S s + 4 I 2 s C u I g + G a I 3 ( g ) + G e I 4 ( g ) + 2 S 2 ( g ) C u G a G e S 4 ( s ) + 4 I 2 ( s ) .
After cooling to ambient temperatures, ampoules were opened, and gaseous species present in the ampoule were allowed to evaporate.
In chemical vapor transport, growth conditions such as the temperature of the source, temperature gradient, and the concentration of the transport agent are of great importance for crystal growth. All formed phases were analyzed. The results of growth experiments—in this case, occurring phases—showed how important the consideration of the gaseous phase was for transport in a closed system. The main challenge here was to control the composition of the gas phase and optimize the temperature field during growth.
For the growth of CuGaGeS4 crystals, most conditions were the same for all experiments; only the concentration of the transport agent iodine varied (see Table 2). The exact weights of metals and sulfur were calculated for 5 g of stoichiometric material. A temperature gradient of ΔT = 900 °C–750 °C was maintained for 240 h of growth times.

2.2. Chemical Characterization

Wavelength dispersive X-ray spectroscopy (WDX) was used to determine the composition of present phases; an electron microprobe analysis system was used. In order to obtain reliable results from WDX measurements, the microprobe system was calibrated using NIST elemental standards. A high accuracy of compositional parameters was achieved by averaging over 10 local measured points within one grain and averaging over more than 30 grains of the quaternary phase showing the same compositional values.
Additionally, composition was measured by X-ray fluorescence (XRF) using a Bruker M4 Tornado Micro-XRF spectrometer with Rh excitation beams and two detectors.

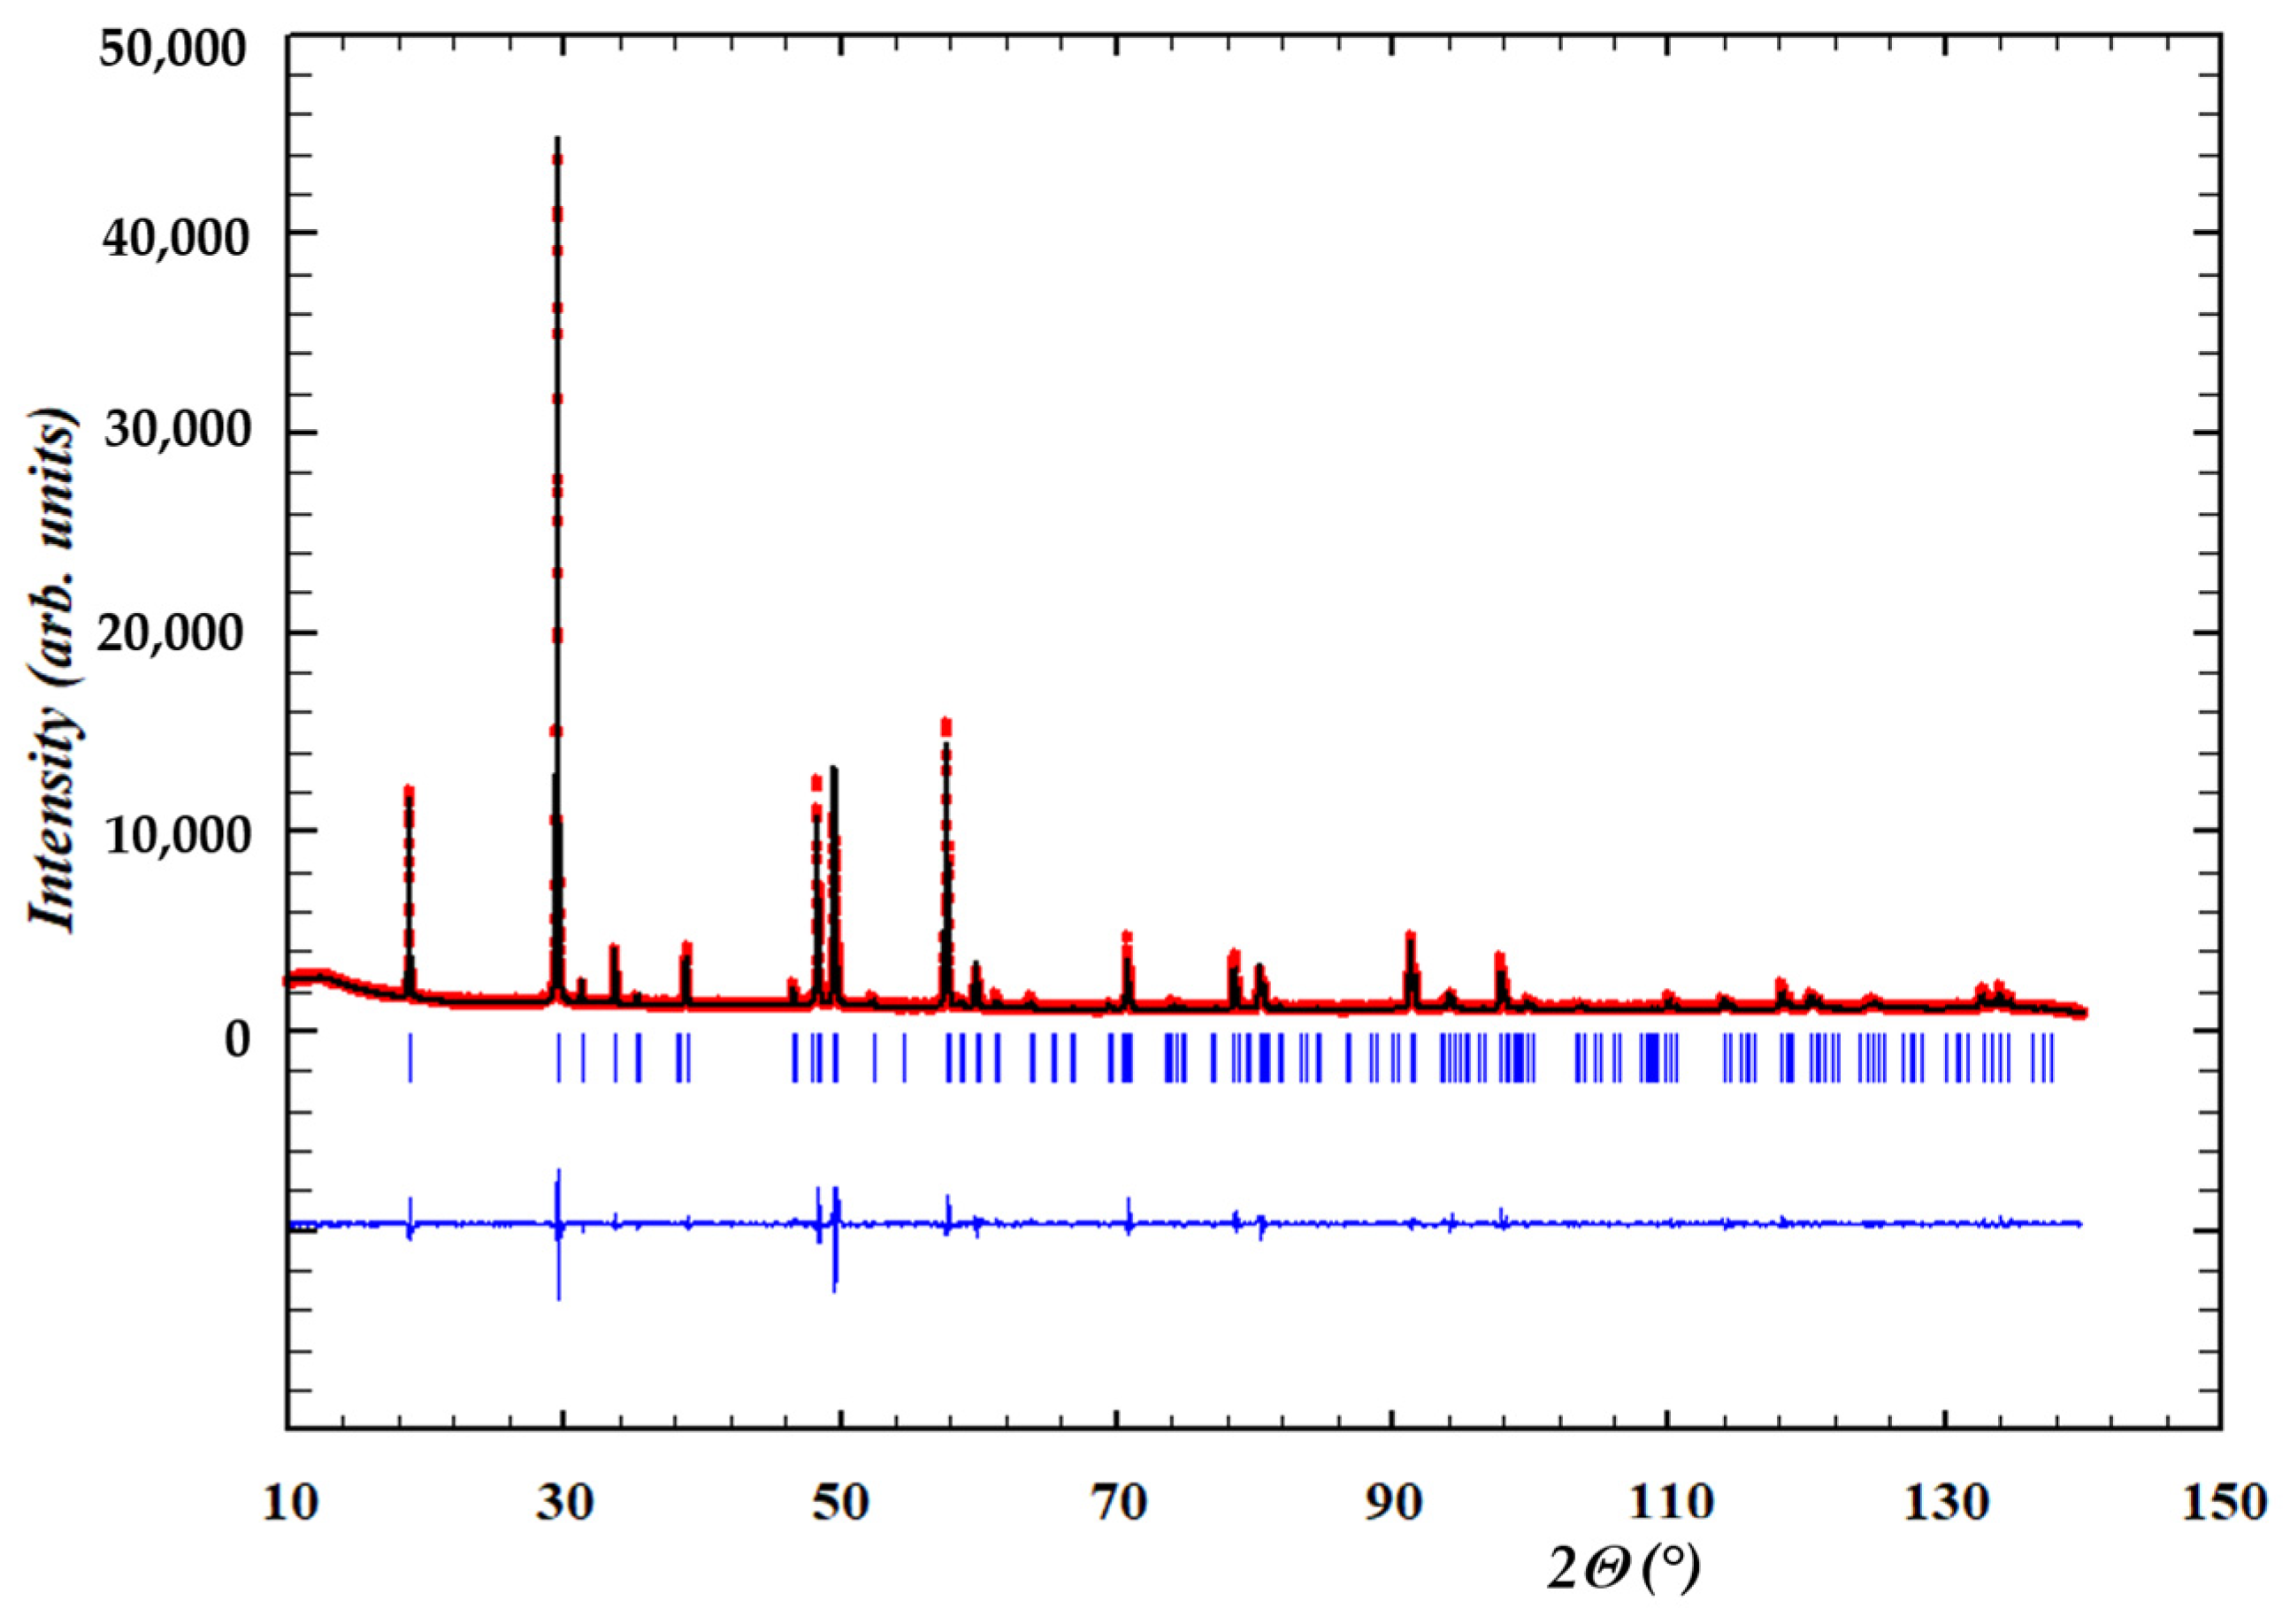
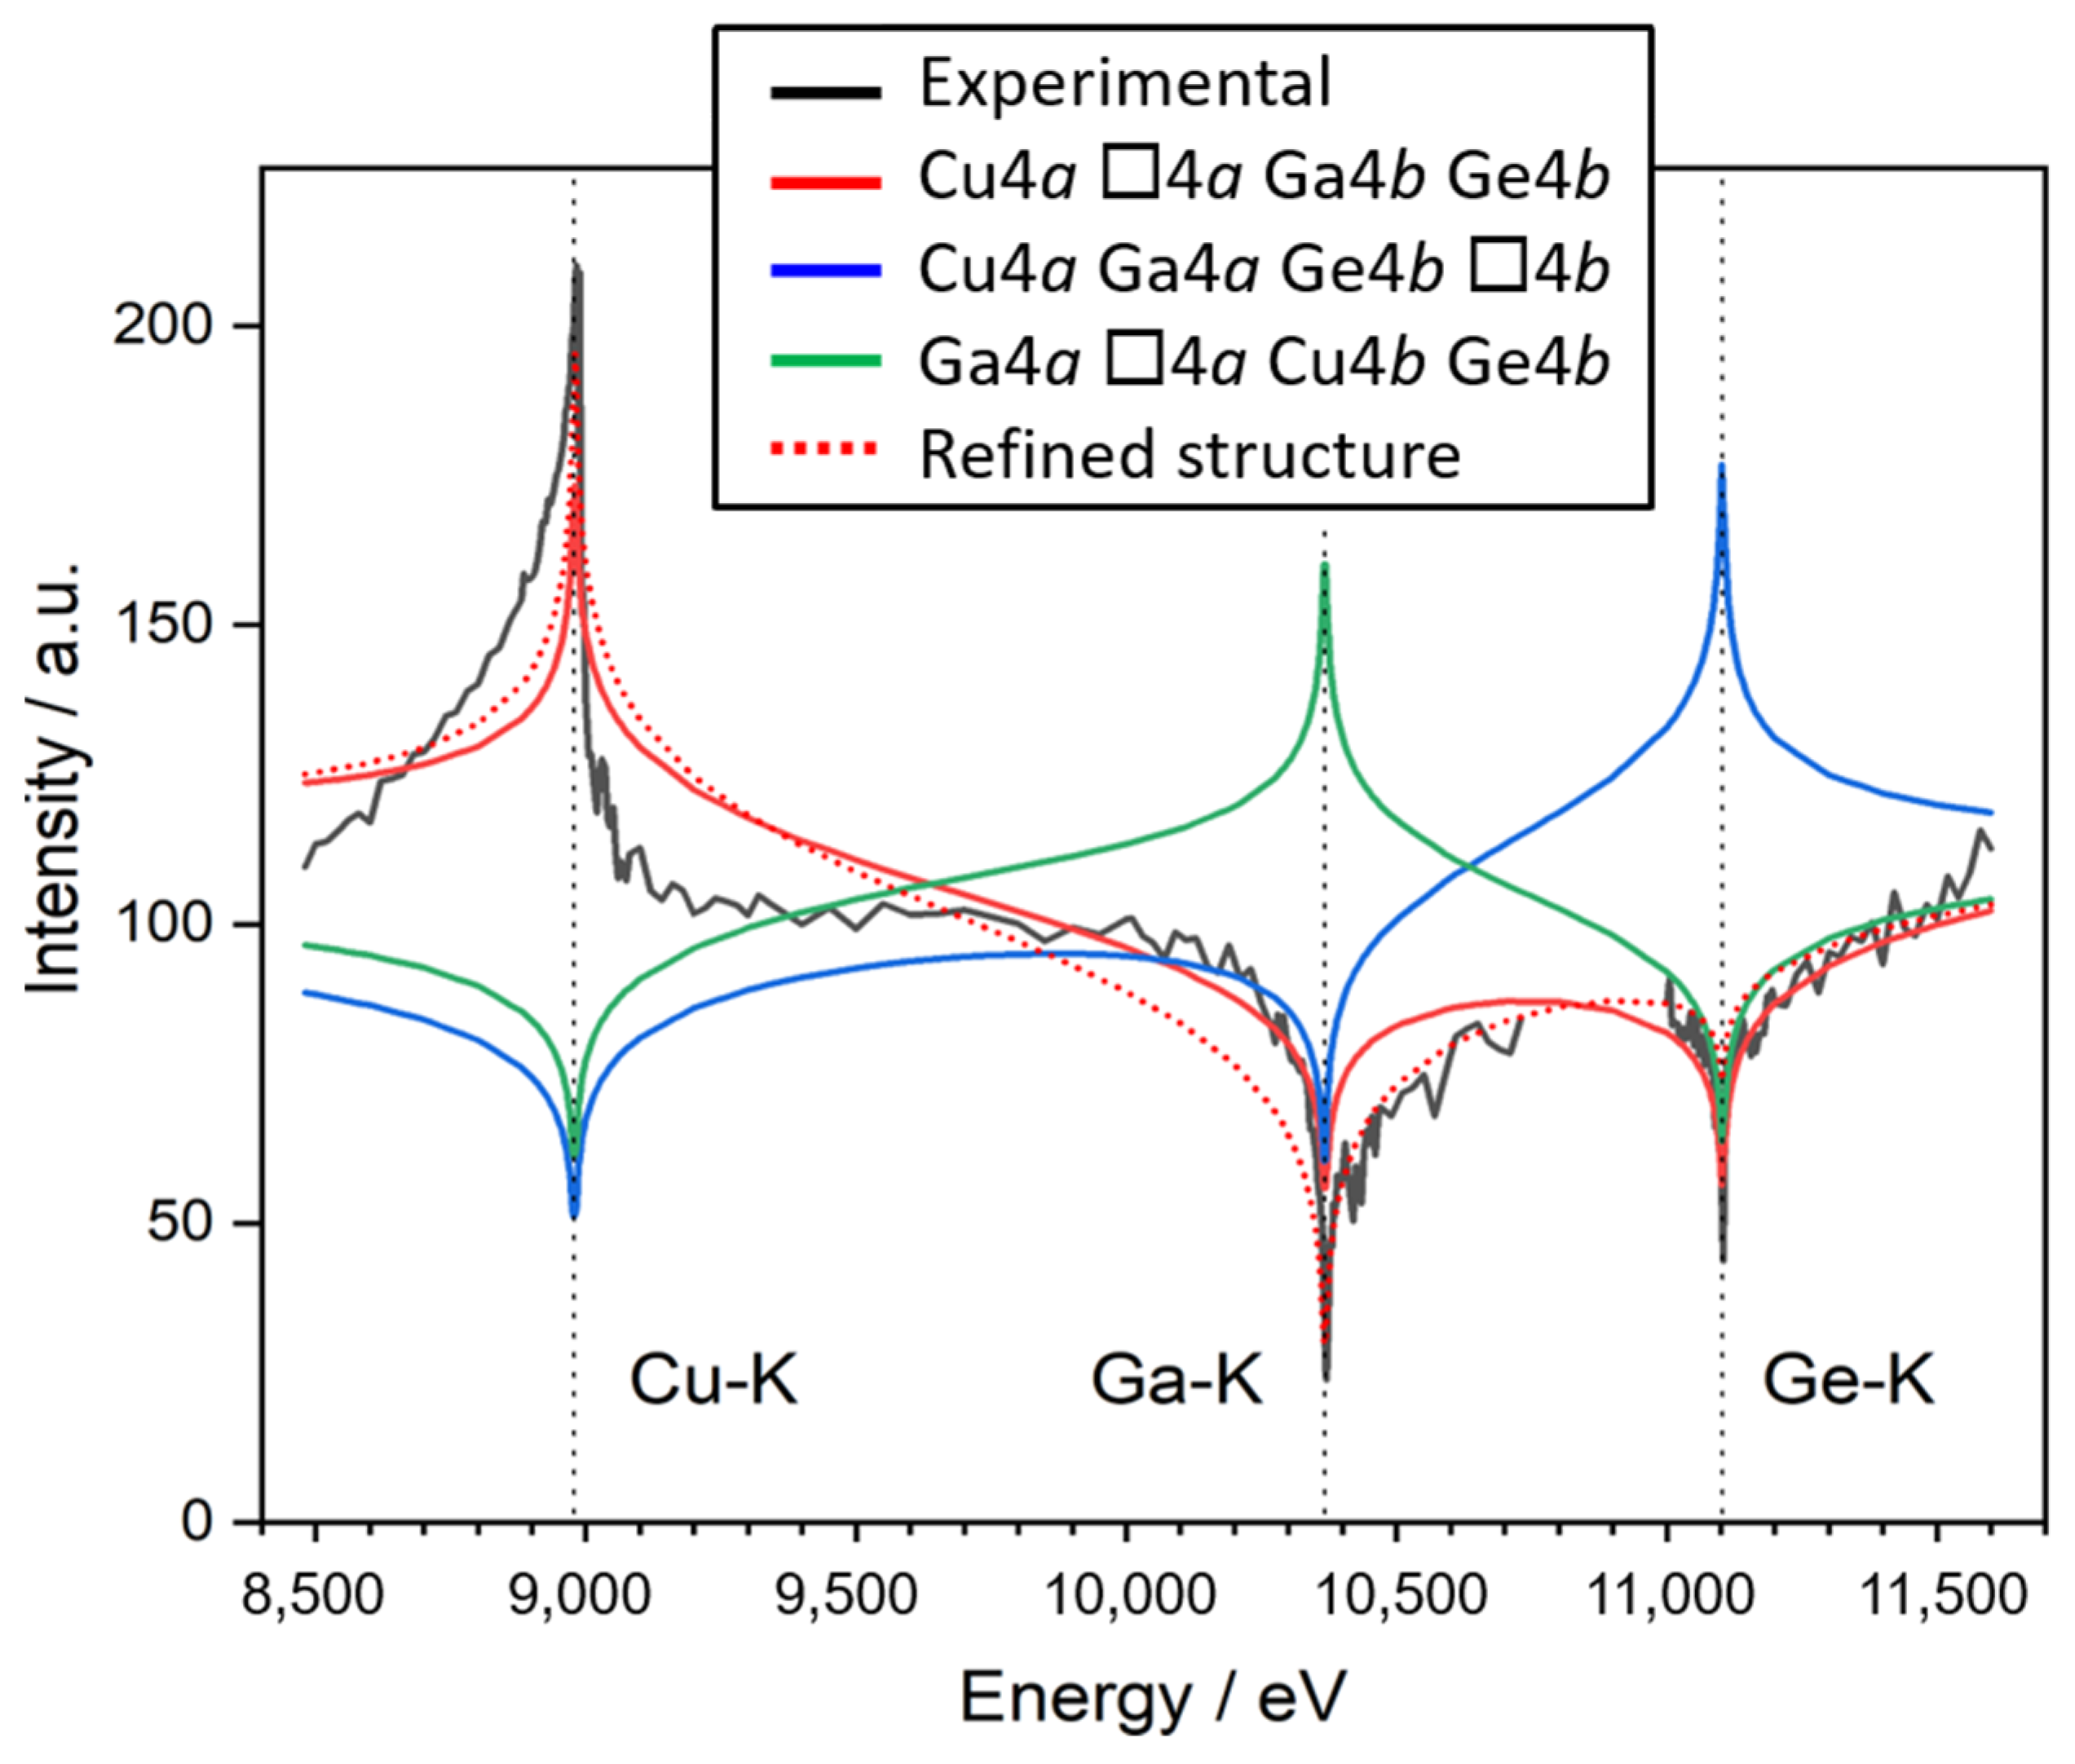
2.3. Structural Characterization

X-ray diffraction: Grown crystals were characterized by powder X-ray diffraction (XRD). X-ray powder diffraction data were recorded over a 2θ range of 10–140° with a step size of 0.01313° by means of a BRUKER D8 diffractometer using Cu Kα1,2 radiation at wavelengths of 1.540598 Å and 1.544426 Å, respectively. Lattice parameters of the material were determined via a LeBail analysis of the diffraction pattern.
Multiple Edge Anomalous Diffraction (MEAD): To clarify cation distribution, anomalous X-ray powder diffraction data (AXRPD) from Cu☐GaGeS4 were collected at the KMC-2 Diffraction station at the KMC-2 beamline, BESSY II, Berlin, Germany [27], and analyzed as described in the literature [28]. Intensity scans of the 101 Bragg peak in Multiple Edge Anomalous Diffraction (MEAD) analysis were collected at the Κ X-ray absorption edges of the elements Cu, Ga, and Ge. Experimental absorption edges were observed at energies of 8987(1) eV, 10,370(1) eV, and 11,104(1) eV. These values did not deviate significantly from the literature values of 8979 eV (Cu-Κ), 10,367 eV (Ga-Κ), and 11,103 eV (Ge-Κ) [29], with the notable exception of the Cu-Κ edge, which was 8 eV higher than the reference value. Absorption corrections for experimental data were calculated based on the chemical composition of the sample, as determined experimentally by WDX. Full powder diffraction sets within the 2θ-range of 6–132° were collected at energies of 8048 eV (λ = 1.5406 Å, equivalent to Cu Kα1) and below the absorption edges at 8965 eV, 10,353 eV, and 11,089 eV.

2.4. Optical Characterization

Diffuse Reflectance Spectroscopy (DRS) measurements were carried out in the air and at room temperature using a spectrophotometer equipped with an integrating sphere (Perkin Elmer UV/Vis-spectrometer Lambda 750S). The wavelength range of the measurement was adjusted to 800–1800 nm with a step size of 1 nm. Tauc plots were obtained by plotting (F(R)2 versus photon energies [30]. The linear part of the curve was extrapolated relative to the baseline, and the optical band gap was extracted from the value of the intersection.
Table 2. Chemical composition of off-stoichiometric Cu☐GaGeS4 crystals determined by X-Ray fluorescence analysis and cation ratios. Iodine concentrations were used for crystal growth. Lattice parameters of crystals were determined using the LeBail analysis of X-ray diffraction data.
Sample No.Chemical FormularCu/(Ga+Ge)Ge/(Ga+Ge)Iodine Concentration
(mg/cm3)
a (Å)c (Å)V (Å3)
To589Cu0.931.08Ga0.86Ge1.13S40.4670.5680 *5.330(1)10.203(2)289.856
To557Cu1.100.90Ga1.09Ge0.91S40.5500.4554.95.315(1)10.114(2)285.713
To569Cu1.180.83Ga1.15Ge0.84S40.5930.4225.05.324(1)10.187(2)288.750
To585wCu1.220.78Ga1.25Ge0.77S40.6040.3818.15.324(1)10.184(2)288.265
To597Cu1.270.74Ga1.24Ge0.75S40.6380.3774.75.319(1)10.189(2)287.308
To555Cu1.270.75Ga1.22Ge0.76S40.6410.3844.95.318(1)10.159(2)287.845
To329Cu1.270.75Ga1.20Ge0.78S40.6410.3945.05.318(1)10.178(2)287.524
To556Cu1.300.69Ga1.24Ge0.77S40.6470.3834.95.320(1)10.159(2)287.650
To581Cu1.290.72Ga1.23Ge0.76S40.6480.3825.05.323(1)10.152(2)288.665
To585Cu1.300.72Ga1.23Ge0.75S40.6560.3798.15.324(1)10.184(2)287.642
To583Cu1.300.72Ga1.22Ge0.76S40.6570.3845.05.319(1)10.167(2)286.942
To531Cu1.330.68Ga1.27Ge0.72S40.6680.3625.05.323(1)10.127(2)289.856
To591Cu1.350.67Ga1.29Ge0.69S40.6820.3481.15.324(1)10.226(2)291.816
To599Cu1.350.68Ga1.24Ge0.73S40.6850.3713.15.330(1)10.272(2)292.484
To580Cu1.360.66Ga1.28Ge0.70S40.6870.3535.05.362(1)10.173(2)291.816
To596Cu1.470.54Ga1.42Ge0.57S40.7390.2864.75.330(1)10.272(2)288.665
To588Cu1.760.27Ga1.63Ge0.34S40.8930.1731.15.340(1)10.365(9)295.564
literature
CuGaS2 [31]0.9910 5.355(1)10.485(2)300.668
CuGaS2 [31]0.9950 5.356(1)10.483(2)300.723
GeS2 [32]01 5.688.97287.781
* Solid state reaction without iodine.

3. Results and Discussion

3.1. Crystal Growth

In CVT growth experiments, single crystals of Cu☐GaGeS4 up to 10 mm in length were obtained, as shown in Figure 3. Crystalline materials had a dark red and orange color. In growth experiments, in addition to transparent red-orange Cu☐GaGeS4 crystals, other phases also appeared, such as GeS2 and GaI3.

3.2. Chemical Composition and Off-Stoichiometry Relations

In analyzing the chemical composition of defect adamantine, chemical analysis of grown crystals by X-ray fluorescence (XRF) revealed that crystals showed Cu/(Ga+Ge) ratios between 0.45 and 0.9 and Ge/(Ga+Ge) ratios between 0.15 and 0.6 (see Table 2). Thus, single crystals showed quite a strong deviation from the stoichiometric composition, which was in accordance with Cu/(Ga+Ge) = Ge/(Ga+Ge) = 0.5. Therefore, defect adamantine Cu☐GaGeS4 was seen as a compound that was formed within the solid solution between CuGaS2 and GeS2, which can be described by (CuGaS2)1−x(GeS2)x (see Figure 4). The general Cu2(1−x)2(1−x)Ga2(1−x)Ge2xS4 formula can be applied to describe the off-stoichiometric composition of the material, x = 0.5, resulting in the stoichiometric Cu☐GaGeS4 composition.
According to this general formula, the chemical compositions for compounds with x = 0 to x = 1 were calculated (calculation 1 and the solid line in Figure 4). Nevertheless, it is well known that CuGaS2 and CuGaSe2 exhibit an off-stoichiometric composition by retaining the chalcopyrite-type crystal structure [33,34]. Thus, instead of a stoichiometric end member, off-stoichiometric Cu2yGa2(1−y)S3−2y can be assumed. The chemical compositions for compounds from x = 0 to x = 1, assuming an off-stoichiometric end member with y = 0.51, were calculated (calculation 2 and the dotted line in Figure 4). These calculations showed that, especially within the range of high Cu/(Ga+Ge) values, the experimental chemical composition of Cu☐GaGeS4 single crystals agreed more with calculation 2, assuming an off-stoichiometric CuGaS2 end member.

3.3. Crystal Structure of Cu2(1−x)2(1−x)Ga2(1−x)Ge2xS4 Defect Adamantines

The crystal structure of the CuGaS2 and GeS2 end members of the (CuGaS2)1−x(GeS2)x series were both based on a corner-sharing network of tetrahedra (see Figure 5). CuGaS2 crystallizes in the chalcopyrite-type structure (space group I 4 ¯ 2 d ) formed by corner-sharing CuS4, GaS4, and GeS4 tetrahedra [31]. For the network of corner-sharing GeS4 tetrahedra forming the crystal structure of GeS2, tetragonal (space group I 4 ¯ 2 d ), orthorhombic (space group Fdd2), and monoclinic (space group Pc) modifications were reported [32,35]. The difference between these modifications is the degree of the distortion of the GeS4 tetrahedron. The (CuGaS2)1−x(GeS2)x series was realized by the substitution of C u + + G a 3 + G e 4 + + ☐; thus, with increasing Ge content in CuGaS2, the fraction of vacancies (☐) and thus the fraction of ☐S4 tetrahedra increased (see Figure 6).
X-ray diffraction data on pulverized crystals were analyzed by LeBail analysis using the chalcopyrite-type structure as the structural model. An exemplarily X-ray diffractogram and corresponding LeBail analysis for a Cu☐GaGeS4 single crystal (prepared as a powder) is presented in Figure 7.
Tetragonal lattice parameters a and c from different Cu2(1–x)2(1−x)Ga2(1−x)Ge2xS4 crystals were determined by the LeBail analysis of X-ray diffraction data (see Table 2). For comparisons, the lattice constants of CuGaS2 and GeS2 from the literature [31,32] are also provided in Table 2. The unit cell volume correlated linearly with both Cu/(Ga+Ge) (see Figure 8) and Ge/(Ga+Ge) ratios. With increasing C u + + G a 3 + G e 4 + + ☐ substitutions in CuGaS2, the fraction of vacancies increased (Figure 6). In addition, the radius of the incorporated Ge4+ was smaller than the radius of Cu+ and Ga3+ (rCu1+ = 0.60 Å; rGa3+ = 0.47 Å; rGe4+ = 0.39 Å [36]). Thus, the unit cell volume decreased with increasing substitutions.
With increasing C u + + G a 3 + G e 4 + + ☐ substitutions in CuGaS2, lattice parameters a and c changed in an anisotropic fashion; i.e., the slope of their dependence on cation ratios Cu/(Ga+Ge) and Ge/(Ga+Ge) was different (see Figure 9).
The chalcopyrite-type structure (space group I 4 ¯ 2 d ) had two different cation sites, Wyckoff positions 4a and 4b (Figure 10), whereas the mono-valent cation occupied the 4a position, and the three-valent cation occupied the 4b position. As Cu+, Ga3+, and Ge4+ had the same number of electrons, their X-ray atomic form factors were very similar. Thus, the determination of cation distribution on the two structural sites of the chalcopyrite-type structure by conventional X-ray diffraction was not possible. Published results on the crystal structure of Cu☐GaGeSe4, which were based on investigations by X-ray diffraction, assumed either Cu and vacancies on 4a and Ga and Ge on 4b positions [20] or Cu and Ga on 4a and Ge and vacancies on 4b sites [21] (see Figure 10). However, it was also possible for Cu and Ge to occupy 4b, in addition to various degrees of cation disorder.
Multiple Edge Anomalous Diffraction (MEAD) using synchrotron X-rays is an established experimental method that distinguishes electronically similar elements during data analysis [28]. The experimental MEAD spectrum was compared to calculated spectra (see Figure 11). As a structural model in calculated spectra, the chalcopyrite-type structure was used, but it was used with three different cation distributions. For calculations, the structural parameters for Cu☐GaGeSe4 (from Woolley [20]) and the ideal stoichiometric composition were assumed. In addition, a calculated spectrum based on the final refined crystal structure (Table 3) was also shown; differences relative to the ideal model were negligible.
It was obvious that the real cation distribution showed that Cu and vacancies occupied the 4a site and Ga and Ge occupied the 4b site.
A subsequent joint Rietveld refinement of the structure using diffraction patterns collected with four different X-ray energies confirmed this result. Due to anomalous scattering, which resulted in a change in the scattering power of chemical elements between individual datasets, the simultaneous independent refinement of all cation site occupation factors was possible. However, this resulted in rather high uncertainties, and the structural model was subsequently simplified by removing atoms with (unphysical) negative occupation factors and limiting total site occupation to full occupation. Note that this was not compulsive; interstitial cations could not be excluded by the methods presented here. The resulting model (Figure 12) was in full agreement with the results from MEAD analyses, with only copper on the 4a position and gallium and germanium on the 4b position, but not copper. Vacancies were found on 4a and 8d anion sites; the 4b Wyckoff site with the highest site occupation factor was assumed to be fully occupied. During the final step, charge neutrality between Cu1+, Ga3+, Ge4+, and S2− was forced; this did not result in a reduction in fit quality and did not significantly affect the refined values of site occupation factors. The results of the refinement are shown in Table 3.

3.4. Band Gap Energy

Band gap energy was determined from diffuse reflectance as measured using UV-VIS spectroscopy. Using the following Kubelka–Munk pseudo-absorption function [38,39]
F R = ( 1 R ) 2 2 R ,
the band gap energy Eg was determined from the linear slope of function F R · h ν 2 , assuming a direct band gap for the material studied.
Table 4 summarizes the band gap energies of several off-stoichiometric Cu☐GaGeS4 crystals and their chemical composition. A non-linear correlation was observed between chemical composition and band gap energy.
The band gap energy of semiconductor alloys is usually described by a quadratic polynomial as a function of the concentration of an alloy component, with the quadratic coefficient referred to as the “bowing parameter”. Accordingly, the band gap energy Eg of alloy (2CuGaS2)1−x(Cu☐GaGeS4)x is described by
E g x = x E g C u G a G e S 4 + 1 x E g C u G a S 2 b x 1 x .
Here, b is the bowing parameter. Figure 13 shows the experimentally determined band gap energy of (2CuGaS2)1−x(Cu☐GaGeS4)x crystals and band gap bowing according to Equation (3). In the respective fit, Ge content of crystals was selected to represent the x value in Equation (3). The bowing parameter was determined as b = −1.45(0.08) and described the deviation from linearity.

4. Conclusions

Defect adamantines are interesting and promising materials for photovoltaic applications, and are free of critical raw materials. Quaternary adamantines can be derived directly from ternary chalcopyrite AIBIIIXVI2. In the doubled chemical formula, one A1+ and one B3+ are replaced by one C4+ atom, resulting in cation vacancies containing quaternary compounds with the general formula AI☐BIIICIVXVI4 while maintaining tetrahedral coordination.
Cu☐GaGeS4 single crystals were grown using the chemical vapor transport technique. Their chemical composition was found to vary and deviate significantly from the stoichiometric composition. Therefore, grown crystals were described as compounds of a solid solution between CuGaS2 and GeS2, forming (CuGaS2)1−x(GeS2)x alloys. The Cu/(Ga+Ge) and Ge/(Ga+Ge) cation ratios described the deviation from the stoichiometric composition (Cu/(Ga+Ge) = Ge/(Ga+Ge) = 0.5). Structural and optoelectronic properties were considerably influenced by these cation ratios and the number of vacancies.
It was shown that Cu☐GaGeS4 crystallized in the chalcopyrite-type structure (space group I 4 ¯ 2 d ). The cation distribution in this structure, analyzed using MEAD, was determined to be Cu and vacancies on the Wyckoff position 4a and Ga and Ge were observed on Wyckoff position 4b of the chalcopyrite-type structure.
The band gap energy Eg of off-stoichiometric Cu☐GaGeS4 crystals varied between 2.1 and 2.4 eV. The non-linear correlation between band gap energy Eg and the chemical composition (Ge content) was described by the usual bowing behavior of semiconductor alloys, with a bowing parameter of b = −1.45(0.08).

Author Contributions

The manuscript was written with the contribution of all authors. Conceptualization, Y.T. and S.S.; methodology, Y.T., G.G., D.M.T. and S.S.; validation, Y.T., G.G., D.M.T. and S.S.; formal analysis, Y.T., G.G. and D.M.T.; investigation, Y.T., G.G., D.M.T. and S.S.; data curation, Y.T.; writing—original draft preparation, Y.T. and S.S.; writing—review and editing, Y.T., G.G., D.M.T. and S.S.; visualization, Y.T., G.G., D.M.T. and S.S.; supervision, S.S. All authors have read and agreed to the published version of the manuscript.

Funding

This research received no external funding.

Data Availability Statement

Data can be provided by the corresponding author by request.

Acknowledgments

AXRPD measurements were carried out using the diffraction instrument at the KMC-2 beamline at Helmholtz-Zentrum Berlin für Materialien und Energie GmbH, Berlin, Germany. We thank HZB for the allocation of synchrotron radiation beamtimes.

Conflicts of Interest

The authors declare no conflict of interest.

References

  1. Best Research-Cell Efficiency Chart, NREL. Available online: https://www.nrel.gov/pv/cell-efficiency.html (accessed on 14 October 2023).
  2. EUR-Lex.europa. Available online: http://data.europa.eu/eli/dir/2011/65/2016-07-15 (accessed on 14 October 2023).
  3. Kim, S.; Kim, K.M.; Tampo, H.; Shibata, H.; Niki, S. Improvement of voltage deficit of Ge-incorporated kesterite solar cells with 12.3% conversion efficiency. Appl. Phys Express 2016, 9, 102301. [Google Scholar] [CrossRef]
  4. Gong, Y.; Zhu, Q.; Li, B.; Wang, S.; Duan, B.; Lou, L.; Xiang, C.; Jedlicka, E.; Giridharagopal, R.; Zhou, Y.; et al. Elemental de-mixing-induced epitaxial/CdS interface enabling 13% efficiency solar cells. Nat. Energy 2022, 7, 966–997. [Google Scholar] [CrossRef]
  5. Gurieva, G.; Marquez, J.A.; Franz, A.; Hages, C.J.; Levcenco, S.; Unold, T.; Schorr, S. Effect of Ag incorporation on structure and optoelectronic properties of (Ag1−xCux)2ZnSnSe4 solid solutions. Phys. Rev. Mater. 2020, 4, 054602. [Google Scholar] [CrossRef]
  6. Wang, Y.; Lv, S.; Li, Z. Review of incorporation of alkali elements and their effects in Cu(In,Ga)Se2 solar cells. J. Mater. Sci. Technol. 2022, 96, 179–189. [Google Scholar] [CrossRef]
  7. Giraldo, S.; Jehl, Z.; Placidi, M.; Izquierdo-Roca, V.; Perez-Rodriguez, A.; Saucedo, E. Progress and Perspectives of Thin Film Kesterite Photovoltaic Technology: A Critical Review. Adv. Mater. 2019, 31, 1806692. [Google Scholar] [CrossRef]
  8. Pamplin, B. The Adamantine Family of Compounds. Prog. Cryst. Growth Charact. 1981, 3, 179–192. [Google Scholar] [CrossRef]
  9. Matsushita, H.; Katsui, A. Materials design for Cu-based quaternary compounds derived from chalcopyrite-rule. J. Phys. Chem. Solids 2005, 66, 1933–1936. [Google Scholar] [CrossRef]
  10. Maeda, T.; Matsushita, H.; Katsui, A. Crystal growth of Cu-III-Ge-Se4 Quaternary compounds (III = Ga, In) by vertical Bridgman methods. Jpn. J. Appl. Phys. 2000, 39, 41–43. [Google Scholar] [CrossRef]
  11. Lopez-Rivera, S.A.; Pamplin, B.R.; Woolley, J.C. High-Temperature lattice parameters and DTA of the quaternary compound CuGaSn☐Se4. Il Nuovo C. 1983, 2, 1728–1735. [Google Scholar] [CrossRef]
  12. Garbato, L.; Geddo-Lehmann, A.; Ledda, F. Growth and structural properties of quaternary copper thiostannates. J. Cryst. Growth 1991, 114, 299–306. [Google Scholar] [CrossRef]
  13. Hahn, H.; Strick, G. Über quaternäre Chalkogenide zinkblendeähnlicher Struktur. Naturwiss. 1967, 54, 225–226. [Google Scholar] [CrossRef]
  14. Shen, K.; Lu, H.; Zhang, X.; Jiao, Z. Numerical studies of the electronic structure, elastic and optical properties of defect quaternary semiconductor CuGaSnSe4. Results Phys. 2018, 9, 49–54. [Google Scholar] [CrossRef]
  15. Shen, K.; Zhang, X.; Lu, H.; Jiao, Z. Numerical study of the defect adamantine compound CuGaGeSe4. Mol. Phys. 2018, 116, 1551–1557. [Google Scholar] [CrossRef]
  16. Hassanien, A.S.; Almari, H.R.; El Radaf, I.M. Impact of film thickness on optical properties and optoelectrical parameters of novel CuGaGeSe4 thin films synthesized by electron beam deposition. Opt. Quantum Electron. 2020, 52, 335. [Google Scholar] [CrossRef]
  17. Hameed, T.A.; Wassel, R.A.; El Radaf, I.M.; Elsayed-Ali, H.E. Characterization of CuInGeSe4 thin films and Al/n-Si/-CuInGeSe4/Au heterojunction device. J. Mater. Sci. Mater. Electron. 2018, 29, 12584–12594. [Google Scholar] [CrossRef]
  18. Delgado, G.E.; Quintero, M. Synthesis and structural characterization using Rietveld method of the quaternary compound CuAlGeSe4. Rev. Mex. Fis. 2022, 68, 020501. [Google Scholar] [CrossRef]
  19. Pamplin, B.R.; Ohachi, T.; Maeda, S.; Negrete, P.; Elworthy, T.P.; Sanderson, R.; Whitlow, H.J. Solubility of the group IV chalcogenides in I-III-VI2 compounds. In Ternary Compounds; Holah, G.D., Ed.; Institute of Physics Publishing: Bristol, UK, 1977; pp. 35–42. [Google Scholar]
  20. Woolley, J.C.; Goodchild, R.G.; Hughes, O.H.; Lopez-Rivera, S.A.; Pamplin, B.R. Quaternary Defect Chalcopyrite Compounds I III IV VI4. Jpn. J. Appl. Phys. 1980, 19 (Suppl. 19-3), 145–148. [Google Scholar] [CrossRef]
  21. Kistaiah, P.; Vishnuvardhan Reddy, C.; Satyanarayana Murthy, K. Thermal-expansion anisotropy in the quaternary semiconductor CuGaGe1−x(VGe)xSe4 at elevated temperatures. Phys. Rev. B 1990, 42, 7186–7192. [Google Scholar] [CrossRef]
  22. Lopez Rivera, A. Quaternary Defect Adamantine Compounds of the Type I-III-IV-☐2-VI4. Doctoral Thesis, University of Bath, Bath, UK, 1981. [Google Scholar]
  23. Panyutin, V.L.; Ponedelnikov, B.E.; Chizhikov, V.I. Energy band spectra of mercury selenogermanate and copper thiogermanogallate. Sov. Phys. Semicond. 1983, 17, 1061–1062. [Google Scholar]
  24. Strok, O.M.; Olekseyuk, I.D.; Zmiy, O.F.; Ivashchenko, I.A.; Gulay, L.D. The Quasi-ternary system Cu2Se-Ga2Se3-GeSe2. J. Phase Equilibria Diffus. 2013, 34, 94–103. [Google Scholar] [CrossRef]
  25. Schäfer, H. Chemical Transport Reactions; Academic Press: New York, NY, USA; London, UK, 1964. [Google Scholar]
  26. Nitsche, R. Kristallzucht aus der Gasphase durch chemische Transportreaktionen. Fortschr. Miner. 1967, 44, 231–287. [Google Scholar]
  27. Többens, D.M.; Zander, S. Helmholtz-Zentrum Berlin für Materialien und Energie, KMC-2: X-ray beamline with dedicated diffraction and XAS endstations at BESSY II. J. Large-Scale Res. Facil. 2016, 2, A49. [Google Scholar] [CrossRef]
  28. Többens, D.M.; Gurieva, G.; Niedenzu, S.; Schuck, G.; Zizak, I.; Schorr, S. Cation distribution in Cu2ZnSnSe4, Cu2FeSnS4 and Cu2ZnSiSe4 by multiple-edge anomalous diffraction. Acta Cryst. B 2020, B76, 1027–1035. [Google Scholar] [CrossRef] [PubMed]
  29. Merritt, E.A. X-ray Anomalous Scattering; Biomolecular Structure Center the University of Washington: Seattle, WA, USA, 2014. [Google Scholar]
  30. Tauc, J.; Grigorovici, R.; Vancu, A. Optical properties and electronic structure of amorphous Germanium. Phys. Stat. Sol. 1966, 15, 627–637. [Google Scholar] [CrossRef]
  31. Stephan, C. Structural Trends in Off-Stoichiometric Chalcopyrite Type Compound Semiconductors. Ph.D. Thesis, Freie Universität Berlin, Berlin, Germany, 2011. [Google Scholar]
  32. The Materials Project. mp-7582. Available online: https://next-gen.materialsproject.org (accessed on 17 July 2023).
  33. Stephan, C.; Schorr, S.; Schock, H.-W. New Structural Investigations in the Cu2Se(S)-In2Se3(S)/Cu2Se(S)-Ga2Se3(S) Phase Diagrams. In Thin-Film Compound Semiconductor Photovoltaics—2009; Yamada, A., Heske, C., Contreras, M., Igalson, M., Irvine, S.J.C., Eds.; Materials Research Society Symposium Proceedings; Cambridge University Press: Cambridge, UK, 2009; 1165-M09-08. [Google Scholar]
  34. Stephan, C.; Scherb, T.; Kaufmann, C.; Schorr, S.; Schock, H.-W. Cationic point defects in CuGaSe2 from a structural perspective. Appl. Phys. Lett. 2012, 101, 101907. [Google Scholar] [CrossRef]
  35. Dittmar, G.; Schäfer, H. Die Kristallstruktur von L.T.-GeS2. Acta Crystallogr. 1976, B32, 1188–1192. [Google Scholar] [CrossRef]
  36. Shannon, R.D. Revised effective ionic radii and systematic studies of interatomic distances in halides and chalcogenides. Acta Cryst. A 1976, 32, 751–767. [Google Scholar] [CrossRef]
  37. Bérar, J.-F.; Lelann, P. E.S.D.’s and estimated probable error obtained in Rietveld refinements with local correlations. J. Appl. Cryst. 1991, 24, 1–5. [Google Scholar] [CrossRef]
  38. Kubelka, P.; Munk, F. Ein Beitrag zur Optik der Farbanstriche. Z. Technol. Phys. 1931, 12, 593–601. [Google Scholar]
  39. Kubelka, P. New contributions to the optics of intensely light-scattering materials. Part I. J. Opt. Soc. Am. 1948, 38, 448–457. [Google Scholar] [CrossRef]
Figure 1. Adamantines—transition from tetragonal chalcopyrite-type compounds (like CuInS2) to quaternary chalcogenides. The arrangement of cations and anions is shown, along with the resulting crystal structure type and exemplarily compounds.
Crystals 13 01545 g001
Figure 2. Phase diagram of Cu2GeSe3-Ga2GeSe5, adapted with permission from Strok et al. Ref. [24]. Copyright 2022, Springer Nature. The red line highlights compound Cu☐GaGeSe4. Vertical section of Cu2GeSe3-‘Ga2GeSe5’ (1—L, 2—L + σ, 3—L + σ+ β, 4—L + β, 5—L + β + ε, 6—L + ε, 7—L + ε + ζ, 8—L + η+ ε, 9—L + β + η, 10—β + η, 11—L + β + η, 12—σ, 13—σ + η, 14—η, 15—η + ε, 16—η + ε + ζ, 17—ε + ζ).
Crystals 13 01545 g002
Figure 3. As-grown crystals of Cu☐GaGeS4; chemical vapor transport using iodine (5 mg/cm3) as the transport agent, with ΔT = 900 °C–750 °C.
Crystals 13 01545 g003
Figure 4. Experimentally determined chemical composition of off-stoichiometric Cu☐GaGeS4 crystals as indicated in a cation ratio plot: Cu/(Ga+Ge) vs. Ge/(Ga+Ge). The ideal stoichiometric composition is at Cu/(Ga+Ge) = Ge/(Ga+Ge) = 0.5. Calculation 1 represents the composition of Cu2(1−x)2(1−x)Ga2(1−x)Ge2xS4 crystals assuming a stoichiometric CuGaS2 end member. For calculation 2, an off-stoichiometric end member described by Cu2yGa2(1−y)S3−2y with y = 0.51 was assumed.
Crystals 13 01545 g004
Figure 5. Crystal structure of (a) GeS2 according to ref. [32] and (b) CuGaS2 according to ref. [31]. CuS4, GaS4, and GeS4 cation tetrahedra are shown. The dotted line shows the unit cell.
Crystals 13 01545 g005
Figure 6. Fraction of vacancies in Cu2(1−x)2(1−x)Ga2(1−x)Ge2xS4 as a dependence of Ge content. The dots show experimental values and the solid line corresponds to nominal values according to general chemical formulae above.
Crystals 13 01545 g006
Figure 7. Example of an X-ray diffractogram of Cu1.220.78Ga1.25Ge0.77S4 and LeBail analysis of the data. Red dots are experimentally obtained data and blue dashes are Bragg peak positions of the chalcopyrite-type structure. The black line is the calculated fit between measured data and the structure. The blue line is the difference between experimentally obtained and calculated intensities.
Crystals 13 01545 g007
Figure 8. Unit cell volume of off-stoichiometric Cu☐GaGeS4 crystals calculated from the lattice parameter as determined by LeBail analysis of XRD data as a dependence of the Cu/(Ga+Ge) ratio. The line should guide the eye.
Crystals 13 01545 g008
Figure 9. Correlation between lattice parameter a and the c/2 of off-stoichiometric Cu☐GaGeS4 crystals with cation ratios (a) Cu/(Ga+Ge) and (b) Ge/(Ga+Ge). The solid lines should guide the eye.
Crystals 13 01545 g009
Figure 10. Chalcopyrite-type structure and cation and vacancy distributions according to Woolley [20] and Kistaiah [21].
Crystals 13 01545 g010
Figure 11. MEAD analysis of the energy dependency of the 101 Bragg peak intensity of Cu1.220.78Ga1.25Ge0.77S4. Curves are normalized relative to an average intensity of 100.
Crystals 13 01545 g011
Figure 12. Refined structure of Cu1.220.78Ga1.25Ge0.77S4 with site occupation indicated. Cu/vacancies, blue/sky blue; Ge/Ga, green/turquoise.
Crystals 13 01545 g012
Figure 13. Band gap energies of different crystals within the (2CuGaS2)1−x(Cu☐GaGeS4)x alloy. CuGaS2 is the end member of the alloy for x = 0 and the right end member is represented by off-stoichiometric Cu☐GaGeS4 crystal with the highest Ge content. The solid line represents the fit of experimental band gap energy values relative to Equation (3), describing the bowing behavior.
Crystals 13 01545 g013
Table 3. Results showing the structural refinement of MEAD data for Cu1.22Ga1.25Ge0.77S4.
Composition (refined): Cu1.152(3) Ga1.554(26) Ge0.446(26) S3.799(13)
Space   group :   I 4 ¯ 2 d
AtomWyckoffxyzBiso [Å2]s.o.f.
Cu4a0000.830(36)0.576(2)
Ga4b000.50.909(15)0.777(13)
Ge4b000.50.909(15)0.223(13)
S8d0.25518(20)0.250.1250.8040.950(3)
S
Anisotropic
U11 = 0.010(2), U22 = 0.0029(19), U33 = 0.0179(7), U12 = 0, U13 = 0, U23 = 0.0041(7)
Lattice
parameter
a = 5.321383(10) Åc = 10.18642(3) ÅV = 288.4500(12) Å3
Overall fit indicators (referring to the combined four diffraction patterns):
Rwp = 0.067Chi2 = 11.7Bérar SCOR [37] = 4.42
Table 4. Results for off-stoichiometric Cu☐GaGeS4 crystals: chemical composition and their band gap energies as determined by UV-Vis spectroscopy.
Sample No.CompositionBand Gap Energy Eg (eV)
To557Cu1.100.90Ga1.09Ge0.91S42.49(5)
To569Cu1.180.83Ga1.15Ge0.84S42.41(5)
To597Cu1.270.74Ga1.24Ge0.75S42.29(5)
To581Cu1.290.72Ga1.23Ge0.76S42.28(5)
To585Cu1.300.72Ga1.23Ge0.75S42.36(5)
To531Cu1.330.68Ga1.27Ge0.72S42.28(5)
To599Cu1.350.68Ga1.24Ge0.73S42.24(5)
To580Cu1.360.66Ga1.28Ge0.70S42.30(5)
To596Cu1.470.54Ga1.42Ge0.57S42.11(5)
To588Cu1.760.27Ga1.63Ge0.34S42.15(5)
Disclaimer/Publisher’s Note: The statements, opinions and data contained in all publications are solely those of the individual author(s) and contributor(s) and not of MDPI and/or the editor(s). MDPI and/or the editor(s) disclaim responsibility for any injury to people or property resulting from any ideas, methods, instructions or products referred to in the content.

