Article

Optimized Design with Artificial Intelligence Quantum Dot White Mini LED Backlight Module Development

1
Department of Photonics, College of Electrical and Computer Engineering, National Yang Ming Chiao Tung University, Hsinchu 30010, Taiwan
2
Semiconductor Research Center, Hon Hai Research Institute, Taipei 11492, Taiwan
3
Research Center for Applied Sciences, Academia Sinica, Taipei 11529, Taiwan
*
Author to whom correspondence should be addressed.
The authors contributed equally to this work.
Crystals 2023, 13(10), 1411; https://doi.org/10.3390/cryst13101411
Submission received: 16 August 2023 / Revised: 8 September 2023 / Accepted: 21 September 2023 / Published: 22 September 2023
(This article belongs to the Special Issue Semiconductor Nanocrystal Studies for Optoelectronic Applications)

Abstract

:
This study delves into the innovation of mini light-emitting diode (mini-LED) backlight module designs, a significant advancement in display technology. The module comprises a substrate, a receiving plane, and an LED structure, which uses a blue light with specific spectral characteristics. When combined with a red-green quantum dot (QD) film, it produces white light. For improved illumination uniformity, the Mini-LED structure was optimized with a focus on the thickness and concentration of layers, especially the TiO2 diffusion layer. A comprehensive design methodology using LightTools (8.6.0) optical simulation software was employed, linked with MATLAB (R2022a) for varied parameters and using the double deep Q-network (DDQN) algorithm via Python as a reinforcement learning agent. This approach facilitated optimal architecture design based on illumination uniformity. Also, the bidirectional scattering distribution function (BSDF) was employed to calculate the scattering properties of the backlight module’s surface, providing accurate simulation results. The DDQN algorithm enhanced the learning design, reducing simulation runs by 76.7% compared to traditional methods. The optimized solution achieved an impressive illumination uniformity of 83.8%, underscoring the benefits of integrating advanced algorithms into display technology optimization.

1. Introduction

In recent years, the rapid advancement of technology has prominently featured light-emitting diode (LED) devices across various domains, such as high-power electronics; lighting; and, notably, display technology [1,2,3]. Within the realm of display technology, LEDs have become integral to the manufacturing of LED displays. The miniaturization trend of LEDs has greatly enhanced display experiences, elevating resolution, energy efficiency, and color quality [4,5,6]. Such progress has steered the display industry towards more streamlined designs.
Recent innovations in mini-LED backlight modules now surpass traditional liquid crystal displays (LCDs), boasting superior attributes like heightened contrast, precise local dimming control, expansive color gamut, reduced light leakage and flickering, and enhanced energy efficiency [7,8,9]. These qualities significantly uplift the viewer’s experience. However, mini-LED technology is not devoid of challenges [4]. Its reliance on a more extensive array of smaller LED chips complicates their use and increases the manufacturing cost. Moreover, the augmented heat output from mini-LED backlighting calls for robust heat dissipation systems, ensuring display stability [10]. Limitations in size and density can compromise resolution and pixel density, especially in high-resolution and larger displays [11]. Issues like uneven brightness or backlight leakage arise due to smaller chip sizes, posing challenges in maintaining brightness uniformity [8,12].
Currently, many mini-LED technologies are married with quantum dots (QDs) to create white light backlight modules [13,14]. QDs, known for their narrow spectral linewidth and high color purity, enable a wider color gamut, culminating in an enriched color experience [15]. In addition to their excellent photovoltaic properties, QDs still face unresolved issues. It is well known that the ionic structure of QDs is unstable, leading to chemical, optical, or thermal instabilities; as a result, achieving long-term stability remains a significant hurdle for their large-scale utilization. Furthermore, the high-energy radiation from QDs to blue LEDs can cause thermal bursts and photodegradation of PQDs, limiting their practical applications. Consequently, enhancing the stability of QDs has emerged as a critical focus in the current research. Over the past few years, various techniques have been proposed to improve PQD stability, including co-doping or hybridization with other cations and surface passivation. In 2022, Lee et al. succeeded in significantly stabilizing QDs by coating their surfaces with Al2O3 using an atomic layer deposition (ALD) passivation protection technique [16]. This effective encapsulation method increases resistance to oxygen and humidity by using an additional substrate to isolate the QDs from each other. On the application side, common QD coating technologies include QD photoresist (QDPR) and inkjet printing. Huang et al. employed inkjet printing technology for QD deposition onto mini-LEDs, achieving a unique three-in-one mini-LED display [17]. Lee et al. employed QDPR to create a color conversion layer (CCL). This was combined with blue and quantum well hybrid UV hybrid μ-LEDs equipped with DBR. The result was a full-color display array featuring high uniformity and a wide color gamut [15].
The task of designing backlight modules demands the adjustment of numerous parameters. Traditionally, optical simulation software like MATLAB (R2022a) has been pivotal for fine-tuning of parameters and module enhancement [18]. Yet, these traditional optical simulations can be laborious, demanding intricate calculations and comprehensive model constructions. The need to pinpoint optimal parameter configurations via optimization algorithms leads to hefty computational demands and prolonged computation durations. Such hurdles render traditional optical simulations less than ideal for intricate optical system design.
However, new methodologies, specifically deep reinforcement learning (DRL), promise solutions [19]. DRL amalgamates deep learning and reinforcement learning, mastering optimal decision making through environment interaction. Compared to its predecessors, DRL showcases superior adaptability, equipping itself to navigate more intricate challenges and adjust in fluid environments [19,20]. Its continual improvement via trial, feedback, and error equips it to manage uncertainties [21]. Huang et al. harnessed DRL for an efficient model optimization approach tailored for Micro-LED backlight modules [22].
While Deep Q-Network (DQN) remains popular in DRL, it has its limitations, especially in overestimating target values in highly correlated scenarios [23]. There is also a risk of overfitting [24,25]. To counter this, the double deep Q-network (DDQN) was conceptualized. The DDQN uses two discrete Q-networks—action selection and action value evaluation, enhancing algorithm stability and accuracy [26,27]. Building upon the DDQN, Han et al. introduced a DRL framework rooted in separate graph scheduling, which amalgamates the DDQN’s flexibility and real-time responsiveness [28]. Salh et al. explored the merger of generative adversarial networks and deep distributed Q-networks (GAN-DDQNs) for intelligent scheduling in Internet of Things (IoT) contexts, elevating the module training’s stability and intelligence [29,30].
In this study, a mini-LED display module, integrated with QD as the color conversion layer, incorporated DRL for improved computational speeds. Using the DDQN algorithm, the study achieved notable time and labor savings. Furthermore, utilizing artificial intelligence model inferences, the team produced an efficient, slim, luminous, and uniform mini-LED backlight module. With the merging of these pioneering technologies, significant advancements in display technology are anticipated.

2. Experiment and Algorithm Design

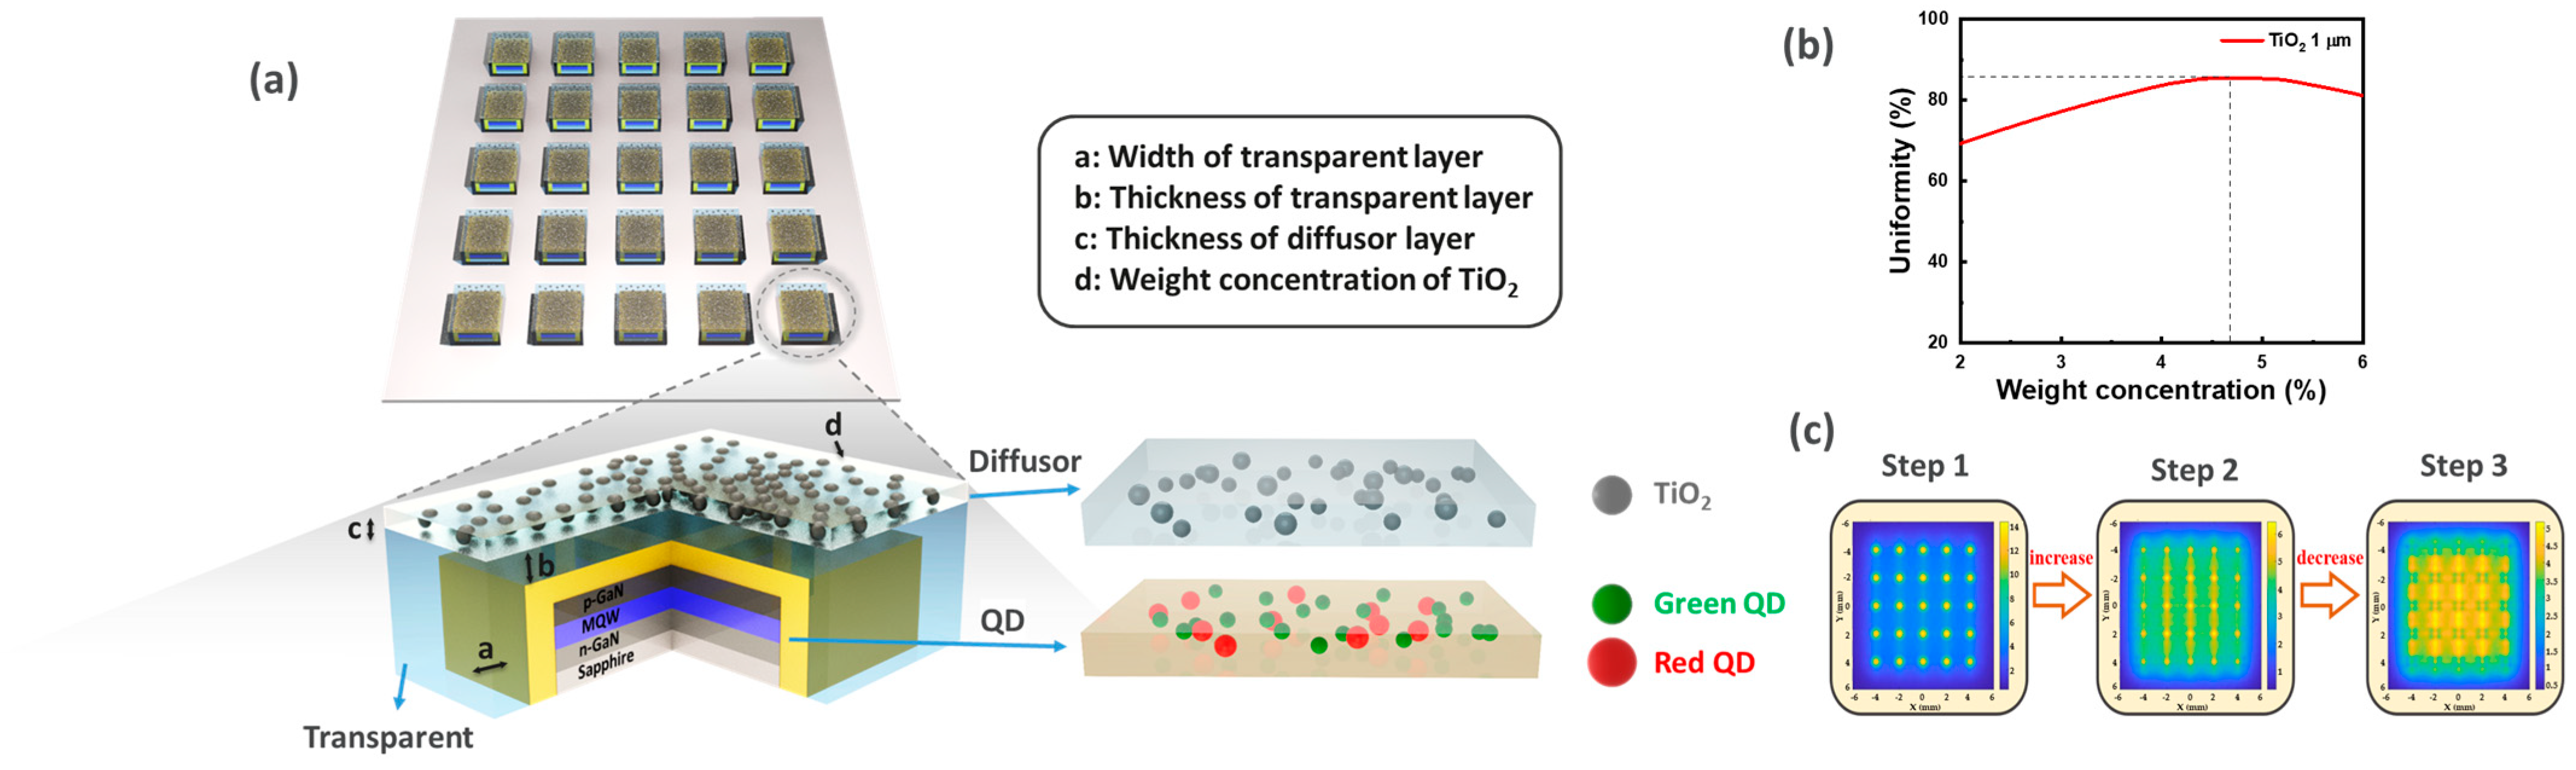
2.1. Mini-LED Module Design

The mini-LED backlight module is a leading development in current display technology. As shown in Figure 1a, the module primarily consists of a substrate, a receiving plane, and a structured LED design. This study’s mini-LED backlight module employs blue light characterized by a Gaussian distribution of wavelength spectrum, a spectral peak of 450 nm, and a full width at half maximum (FWHM) of 18 nm. In combination with a red and green QD mixing film, it produces white light through light mixing. To achieve greater illumination uniformity, we initially designed and optimized a single mini-LED package structure, as depicted in Figure 1a. The 8 × 12 mil blue LED wafer is enveloped in a 30 μm thick QD layer. This transparent layer of optical material, mixed with red and green QDs, serves to convert white light color. A protective transparent layer coats the QD layer, guarding the unstable QDs against forms of degradation such as self-aggregation while providing a mixing distance. Lastly, an atomized layer, composed of a transparent adhesive and TiO2 scattering particles, is situated on top of the LED to widen the angle of divergence. We established four parameters—the transparent layer’s width and thickness, the diffusion layer’s thickness, and the TiO2 particle concentration in the diffusion layer—as adjustable for synchronized optimization to achieve the best uniformity parameter combination, demonstrated in Table 1. To ensure the accuracy of the optical simulation, we established a single LED model based on the above conditions and compared it with actual LED samples possessing the same parameters. We found that the simulation results closely resembled the actual products’ light-emitting fields, indicating the simulation’s reliability. Figure 1b,c demonstrate the impact of the TiO2 particle concentration in the diffusion layer, which can be divided into three stages. In the first stage, if the diffusion particle concentration is too low, the fogging effect is inadequate, leading to a small LED dispersion angle, poor gap brightness, and poor uniformity. However, upon reaching a certain critical concentration, the excessive diffusion concentration of particles suppresses the LED’s frontal light output, decreasing the uniformity. Given that we aim for the thickness of a single LED in this backlight module to be under 300 μm, this study will develop an optimization method for the four-variable design of the architecture.

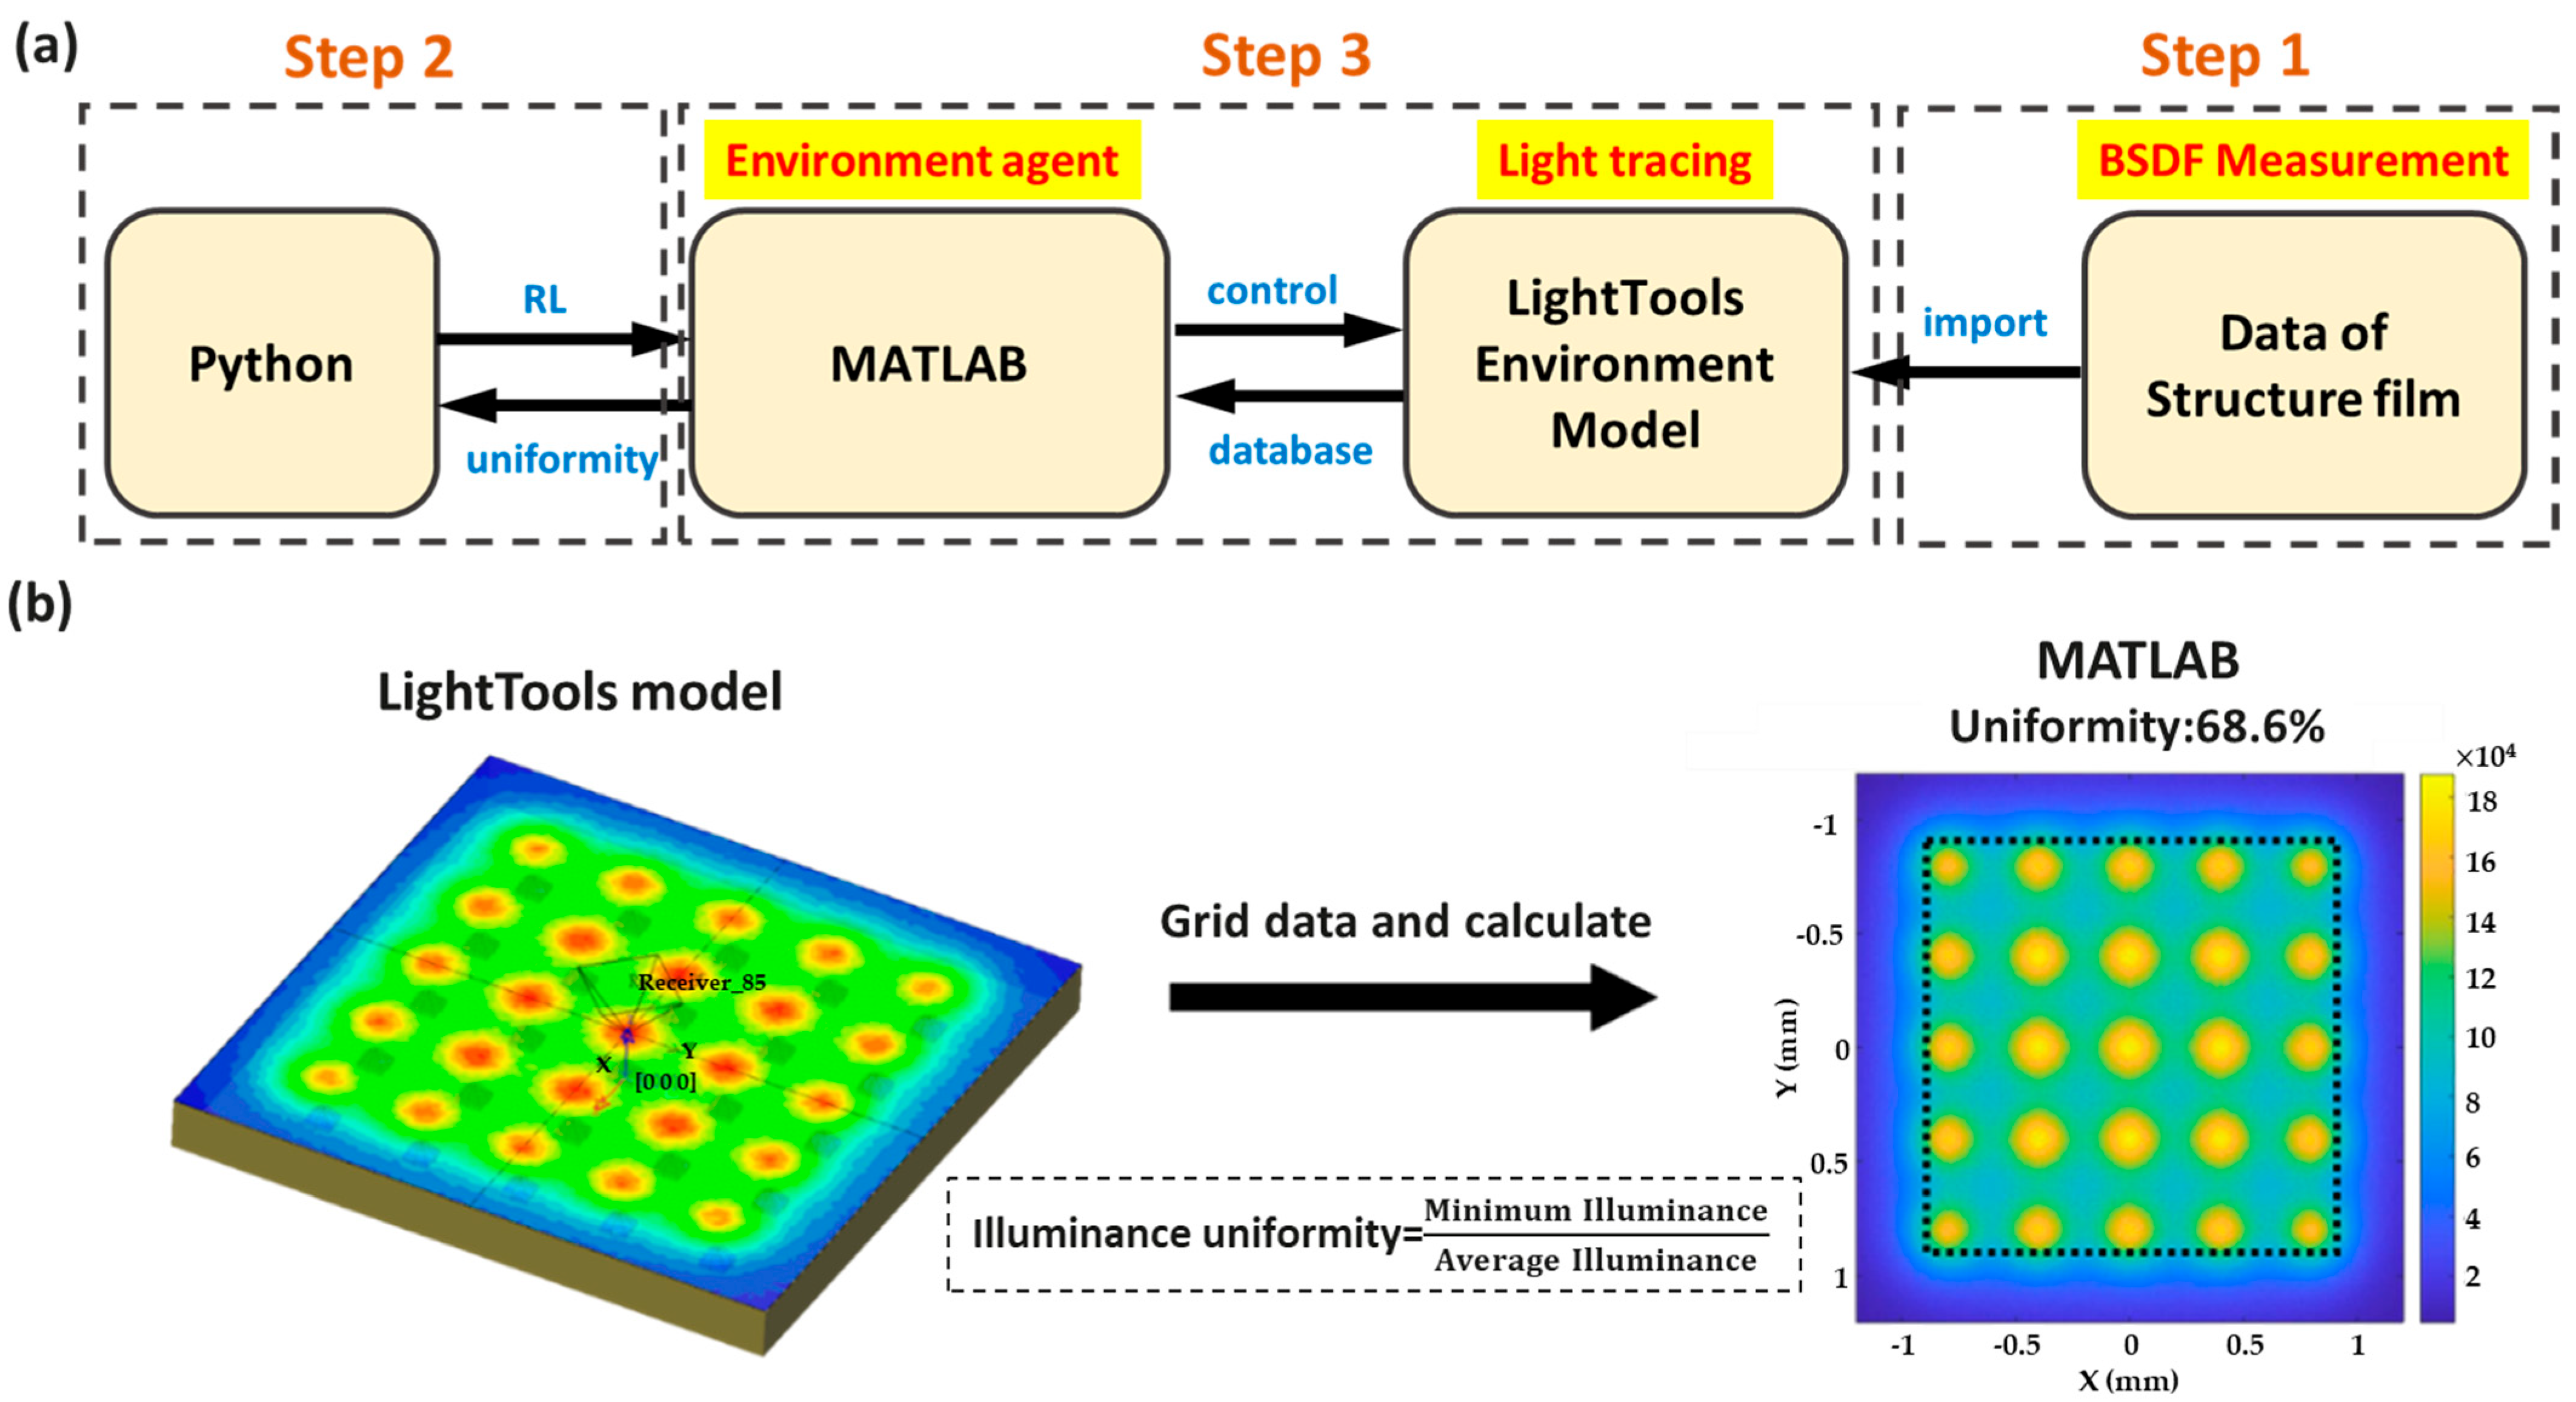
2.2. Overall Design Workflow

We present a comprehensive design methodology to achieve the optimal simulation results, as depicted in Figure 2. Figure 2a outlines the program’s operation and linkage flowchart. First, we created a mini-LED backlight module as an environment model using LightTools (8.6.0) optical simulation software and imported the structure’s optical parameters. We then combined LightTools’ new pickup function with MATLAB to set four different variables influencing the illumination uniformity. Following the simulation in LightTools, MATLAB collected mesh data from surface receivers and calculated the illumination uniformity. Lastly, we implemented the DDQN algorithm via Python to allow it to act as the reinforcement learning (RL) agent in the experimental process. This algorithm enabled the agent to interact with the environment, developing an optimization method for the architecture’s variable design and identifying the optimal solution for illuminance uniformity by connecting it to LightTools’ simulated illuminance uniformity. We utilized LightTools to establish the mini-LED backlight module, as shown in Figure 2b. The architecture primarily comprised three parts: the mini-LED (light source), a structural sheet, and a surface receiver. We created five absorbing surfaces as a baffle wall to encase the entire model and simulated a mini-LED backlight module using a 5 × 5 array Mini-LED array with a structural sheet atop it, investigating the illumination uniformity.
In our comprehensive optimization framework, we incorporated the optical parameter of the structured sheet as the bidirectional scattering distribution function (BSDF). This function calculates the surface scattering optical properties of the material under microscopic conditions [31]. The BSDF combines the bidirectional reflectance distribution function (BRDF) and bidirectional transmission distribution function (BTDF) [32,33], as depicted in Figure 3a. The BSDF describes how a ray of light projected onto a material surface generates scattered light in various directions due to surface properties, with the scattered light direction changing along with incident light changes. Besides understanding a material’s BSDF through measuring scattered light, we can also simulate the scattering effect if the material’s BSDF properties are known. In our model design, the backlight module’s top layer comprised multiple geometrically small, light-transmitting materials. Due to light tracing limitations in optical simulation software, the simulation results can easily become distorted. Therefore, we improved the actual bidirectional scattering distribution function of the light by sending the structural model for measurement to achieve simulation results closer to the actual conditions, as shown in Figure 3b.

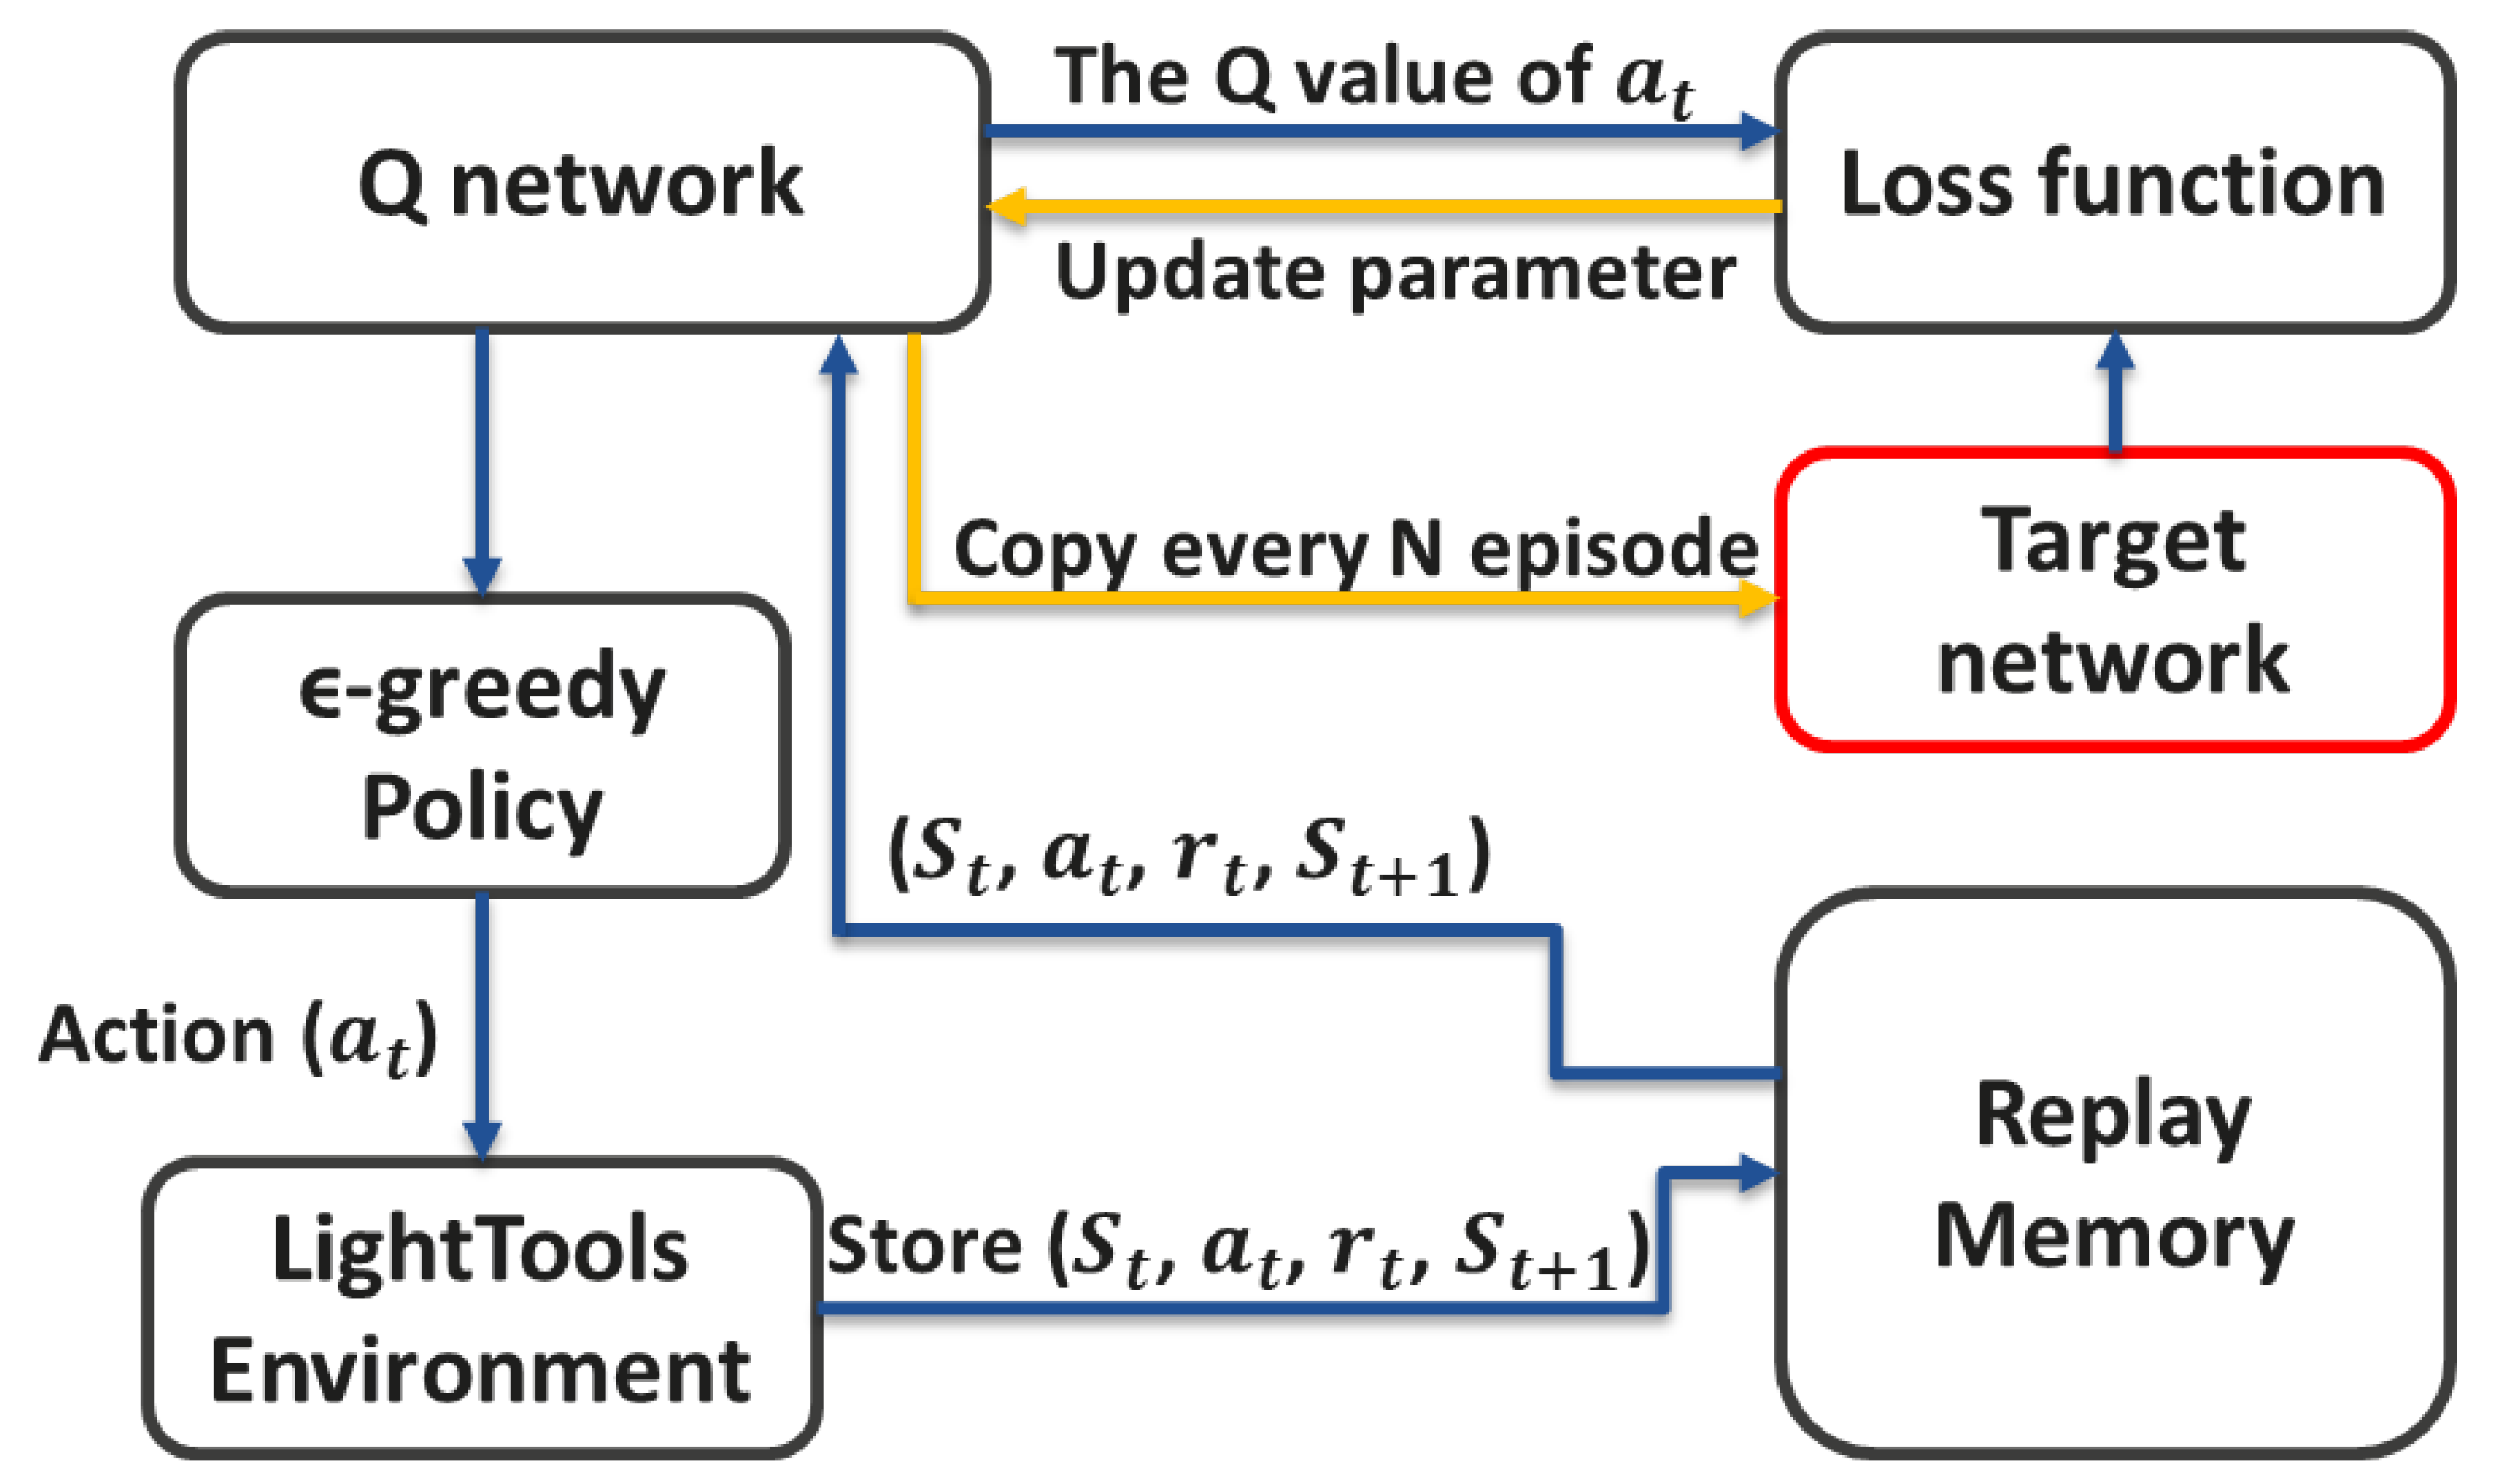
2.3. Definitions of Action Functions, State Functions, and Reward Functions of DDQN Algorithm

In the traditional DQN algorithm, a single neural network estimates the Q-value of different actions in each state, a measure used to select the subsequent action. However, the DQN algorithm’s Q-network uses the same network to select and evaluate the next action’s Q-value during Q-value updates, leading to overestimation. To solve this overestimation, DDQN, an enhanced learning algorithm for solving value-function-based reinforcement learning problems, is introduced, serving as an improvement upon the DQN algorithm. DDQN uses two neural networks, the online network and the target network, to mitigate the overestimation issue inherent to DQN. The online network selects the next action, while the target network evaluates this action’s Q-value. When updating the online network, a greedy policy selects the subsequent action, and the target network evaluates the Q-value using the online network’s optimal action. This process reduces Q-value overestimation by the online network, enhancing the algorithm’s stability and performance. As illustrated in Figure 4, the ε-greedy policy calculates action (at) and sends it to the environment control agent. The environment control agent computes and controls states t, St+1, and at, as well as reward value (rt) at time t and (t + 1), reporting them back. Each iteration’s states, at, and rt, are logged through replay memory. Subsequently, the loss function is computed, determining the new parameter update via the Q network (θt) and target Q network (θ’t) neural networks. The target Q and loss function are defined as displayed in Equations (1) and (2):
Target Q = R t + 1 + γ   M a x a t + 1 Q S t + 1 , a t + 1 ;   θ t
where Rt+1 is the incentive value at the moment (t + 1), γ is the hyperparameter of the model, and the loss function (MSE) is defined as in Equation (2) below:
Loss   function ( MSE ) = L ( θ ) = [ ( T a r g e t Q Q ( s , a ; θ t ) ) 2 ]
After several iterations, the best results are obtained when the loss letter value converges.
The main steps of the DDQN algorithm include:
  • The online and target networks are initialized;
  • At each time step, an action is selected from the online network based on the current state of the state space (St);
  • The selected action is performed, the next state is observed, and the environmental feedback is rewarded.
  • The next action from the target network is selected as an action space (at), and its Q-value is evaluated.
  • The Q estimate for the online network is updated using the next state of the feedback and the reward function (rt);
  • The target network is regularly updated by copying the parameters from the online network to the target network;
  • Steps 2 through 6 are repeated until the desired stop condition is reached.
The work flow and definition of the state space, action space, and reward function of the DDQN algorithm in this work are illustrated in Figure 4 and Table 2, respectively.

3. Result

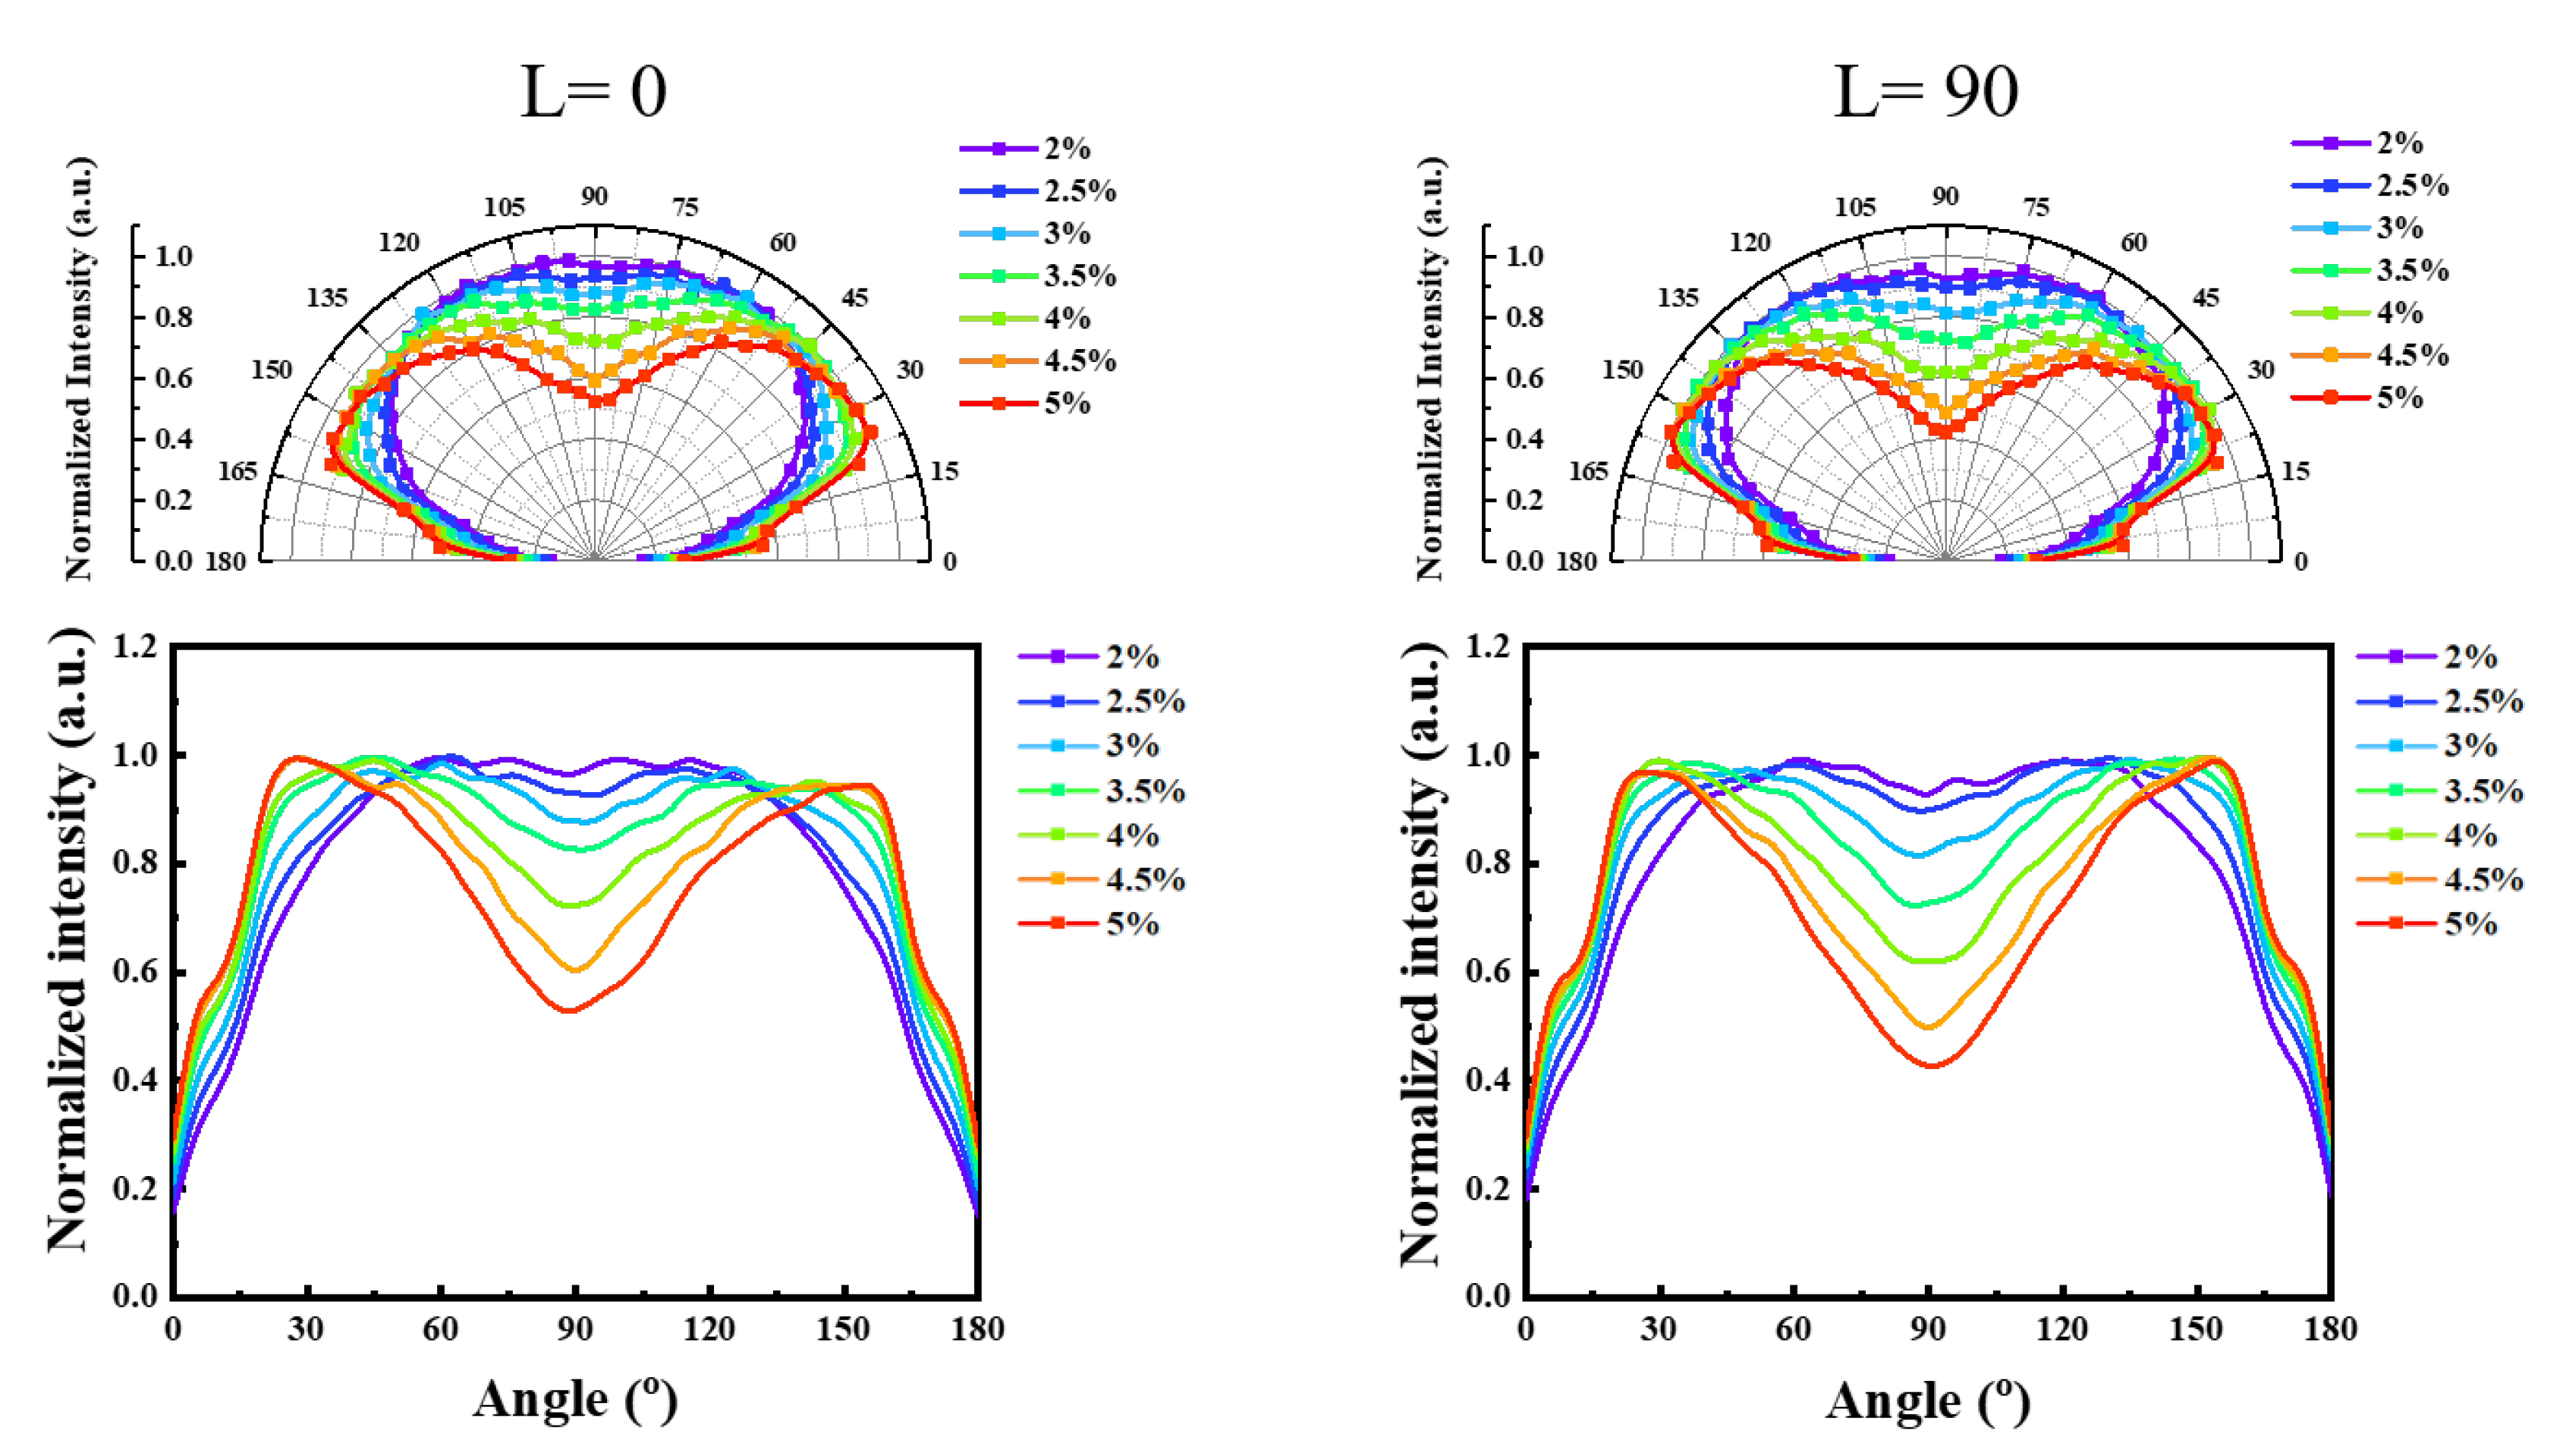
3.1. Divergent Angle of Single Packaged Mini-LED

Firstly, to ensure our designed package yields the desired results and to pursue higher uniformity, a wider dispersion angle of a single mini-LED is theoretically preferable in order to minimize the dark area between LEDs. We initially built a model with a single-unit structure, adjusting the concentration of TiO2 particles in the diffusion layer. Figure 5 displays the simulation results of modifying the TiO2 particle concentration in the diffusion layer. As the concentration of TiO2 particles increased, a single Mini-LED dispersion angle became enlarged. However, a relatively high particle concentration inhibited the frontal emission of mini-LEDs, reducing frontal light intensity, as shown in Table 3. This negatively impacts the overall uniformity of the backlight module, requiring a balance between dark area elimination and frontal light emission suppression. Therefore, the weight percentage concentration range of TiO2 selected in our optimization process was between 2% and 5%, based on the result of the former testing. Traditional optical simulation entails manipulating numerous parameters; hence, we utilized the DDQN method in DRL to find the optimal parameter solution.

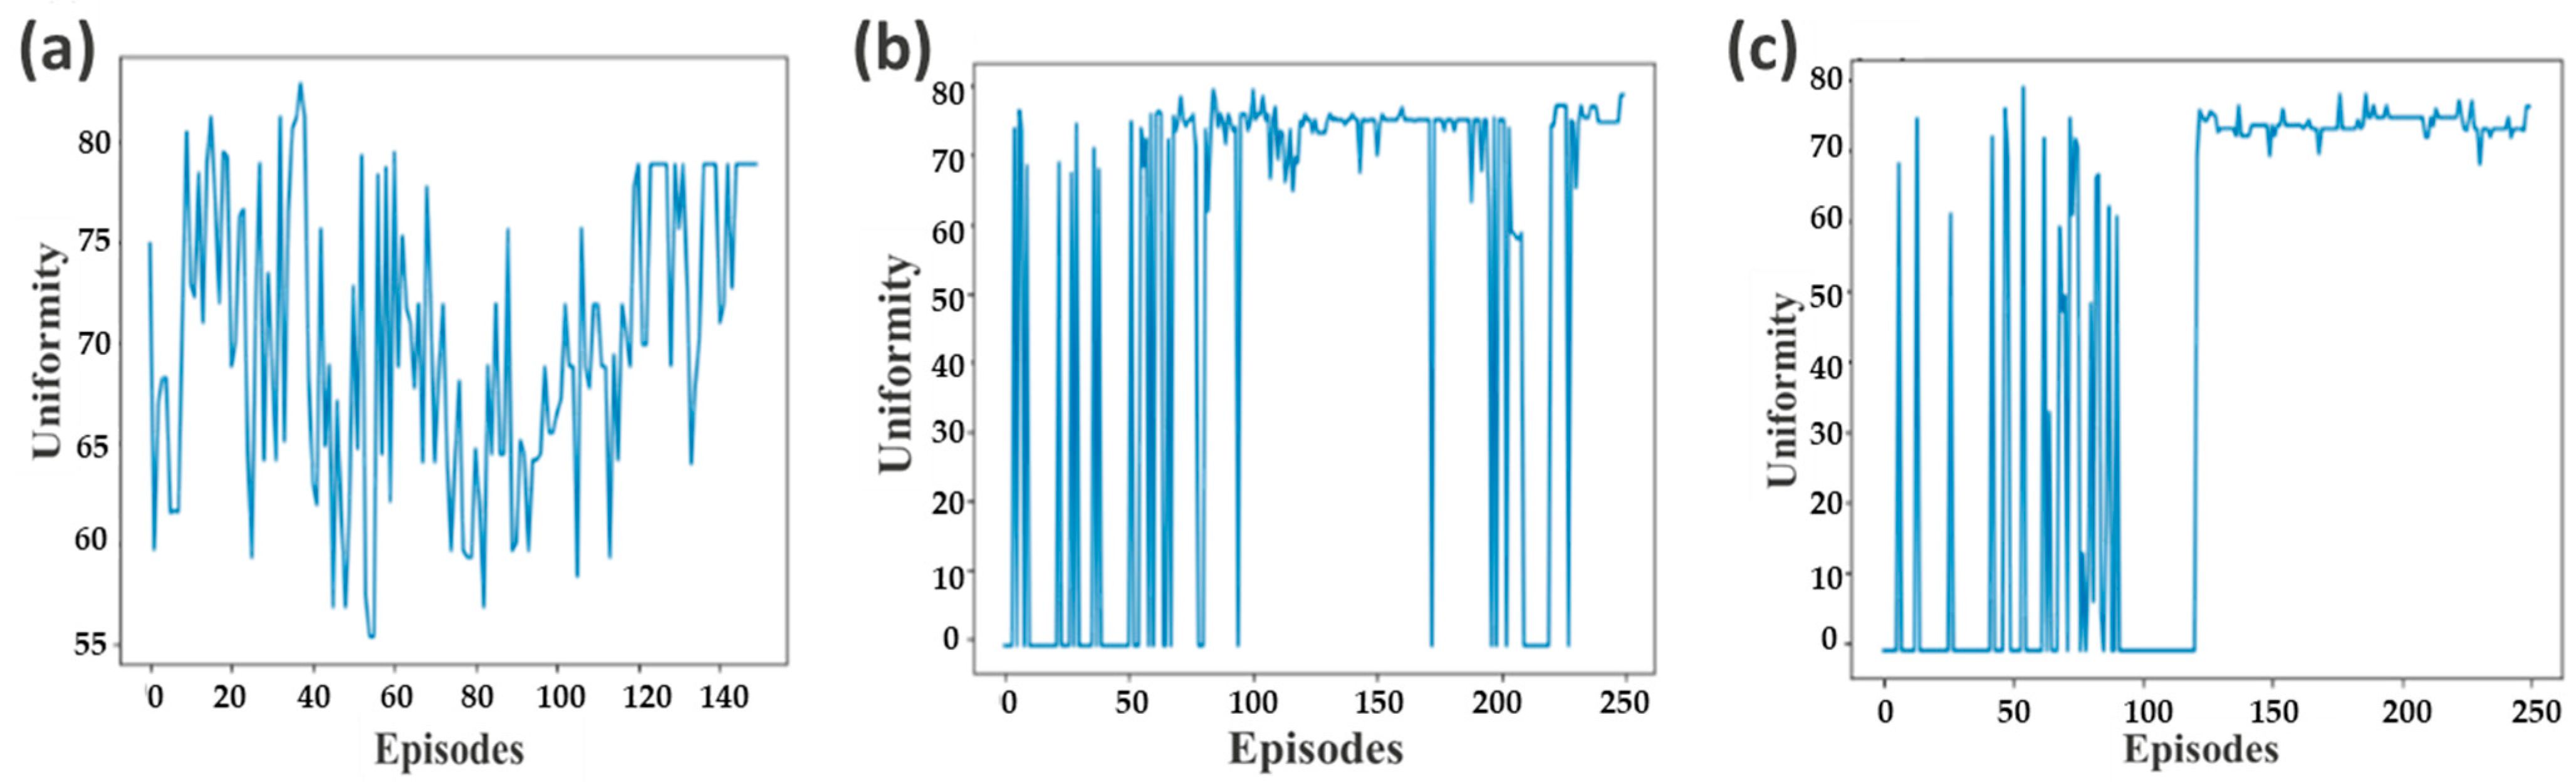
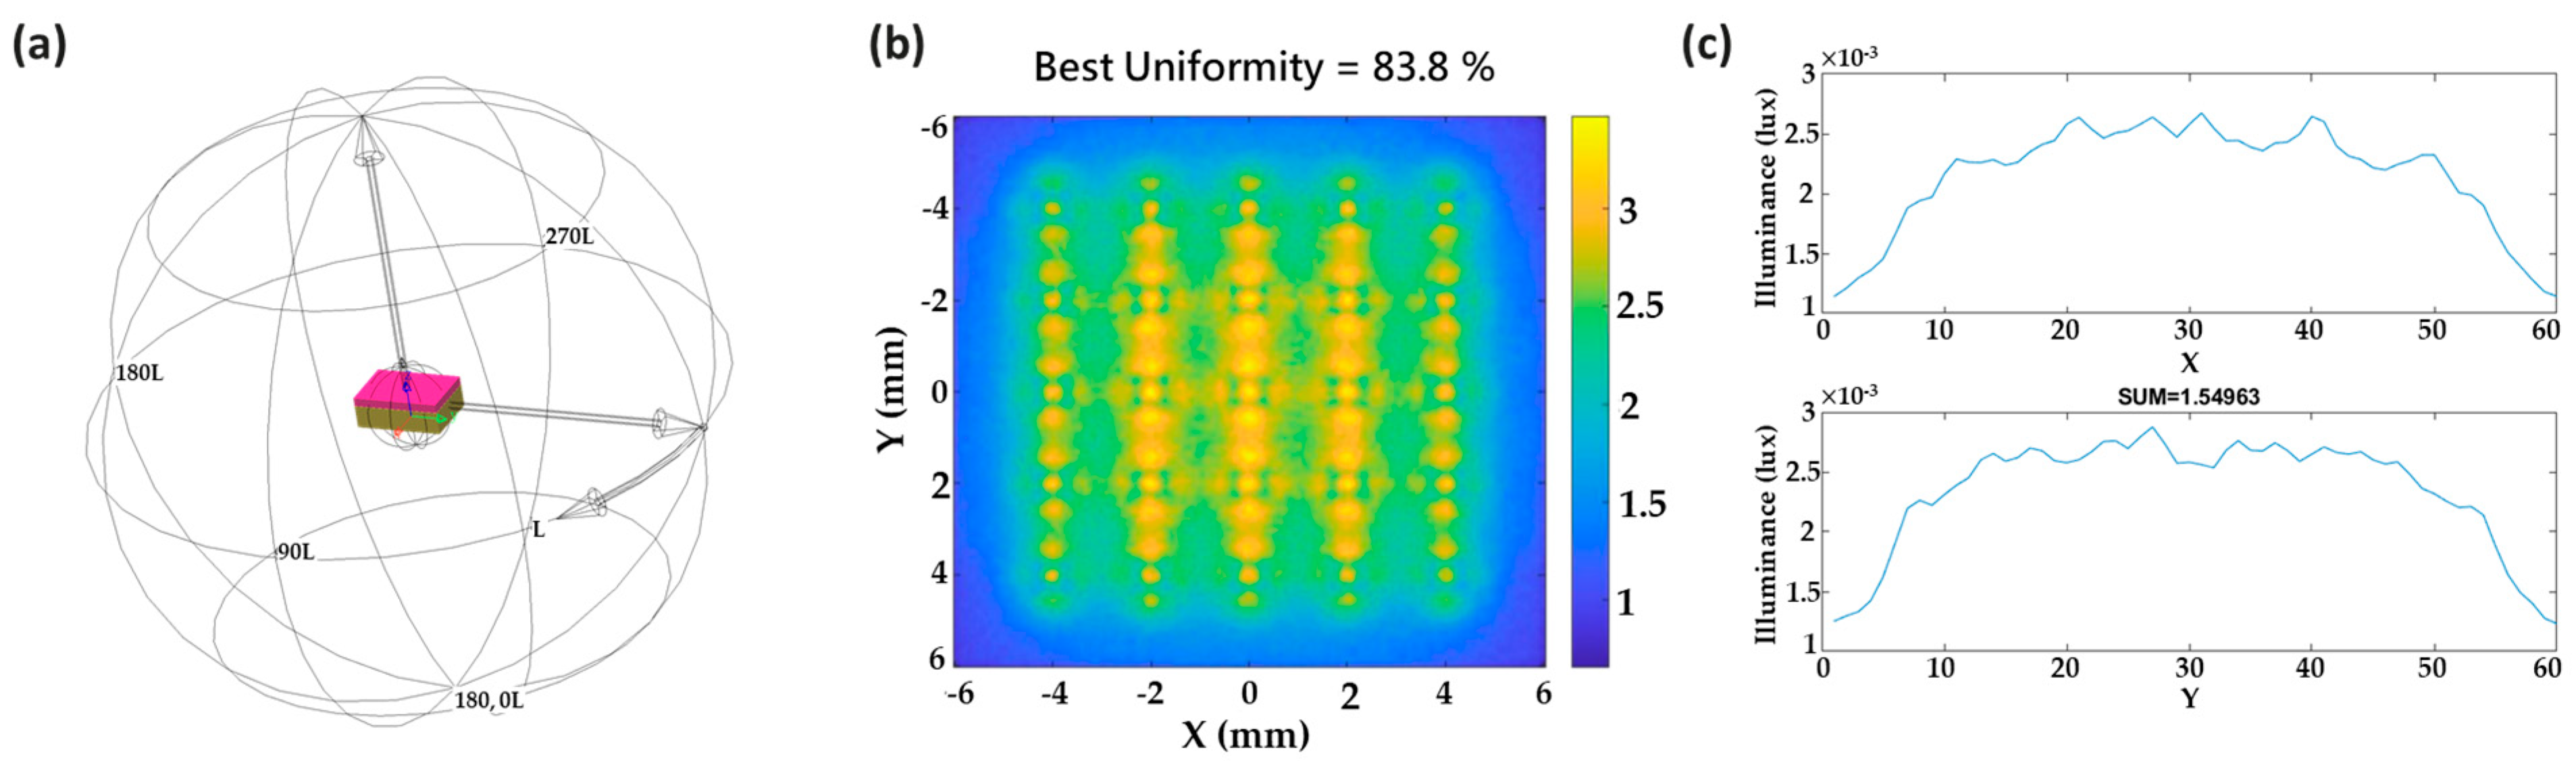
3.2. Experimental Result for DDQN

Reward function 1 is defined with respect to a fixed reference value, while reward function 2 is designed as “strictly decreasing”, requiring each loss value to be lower than the previous one. The RL results are illustrated in Figure 6. The horizontal axis represents the number of episodes, and the vertical axis signifies the illuminance uniformity of each episode. The reward of all steps is summed up based on our defined rt, encouraging continuous learning in the RL system. Episodes outside of our defined range are rated as −10. Figure 6 represents the trend of illuminance uniformity in the RL system, with the vertical axis showing the illuminance uniformity of each episode’s final step after simulation. Figure 6a reveals no convergence after 150 episodes without super-parameter adjustment. Failing to appropriately adjust the epsilon decay and learning rate in the context of reinforcement learning can result in situations where the outcomes do not converge as desired. This phenomenon can be attributed to several factors. Firstly, in the realm of exploration versus exploitation, reinforcement learning employs the ε-greedy strategy, wherein the epsilon value plays a pivotal role in balancing the trade-off between exploration and exploitation. A rapid reduction in epsilon, leading to its quick diminishment to very small values, can cause the agent to prematurely cease exploration activities. This, in turn, leads to missed opportunities for the agent to acquire superior strategies. Secondly, the learning rate constitutes a crucial hyperparameter controlling the magnitude of weight updates within the model. An excessively high learning rate can induce oscillations in the model’s weights, thus obstructing convergence. Conversely, an overly small learning rate results in sluggish convergence, necessitating extended training times to attain satisfactory performance levels. Figure 6b demonstrates a better learning rate with the ϵ-decay setting, but some convergence issues occurred after 150 episodes. Adjusting rt by subtracting the old and new values by 100 solves this issue, as shown in Figure 6c. Failing to appropriately adjust the epsilon decay and learning rate in the context of reinforcement learning can result in situations where the outcomes do not converge as desired. This phenomenon can be attributed to several factors. Firstly, in the realm of exploration versus exploitation, reinforcement learning employs the ε-greedy strategy, wherein the epsilon value plays a pivotal role in balancing the trade-off between exploration and exploitation. A rapid reduction in epsilon, leading to its quick diminishment to very small values, can cause the agent to prematurely cease exploration activities. This, in turn, leads to missed opportunities for the agent to acquire superior strategies. Secondly, the learning rate constitutes a crucial hyperparameter controlling the magnitude of weight updates within the model. An excessively high learning rate can induce oscillations in the model’s weights, thus obstructing convergence. Conversely, an overly small learning rate results in sluggish convergence, necessitating extended training times to attain satisfactory performance levels.
Through simulation and optimization, the final optimal solution achieved an illumination uniformity of 83.8%, as shown in Figure 7. The parameter values were a 40 μm transparent layer width, 70 μm thickness, 60 μm atomized layer thickness, and a 4.1% weight percent concentration of TiO2. Compared to the traditional method, which required 32,850 simulations, the use of DRL’s DDQN algorithm reduced this number to just 7744 simulations, representing a time reduction of 76.7%. The DRL-centered agent uses an enhanced learning design agent characteristic of deep learning solutions, minimizing the search scope to find the best solution. Consequently, it can deliver more efficient and better-optimized solutions.

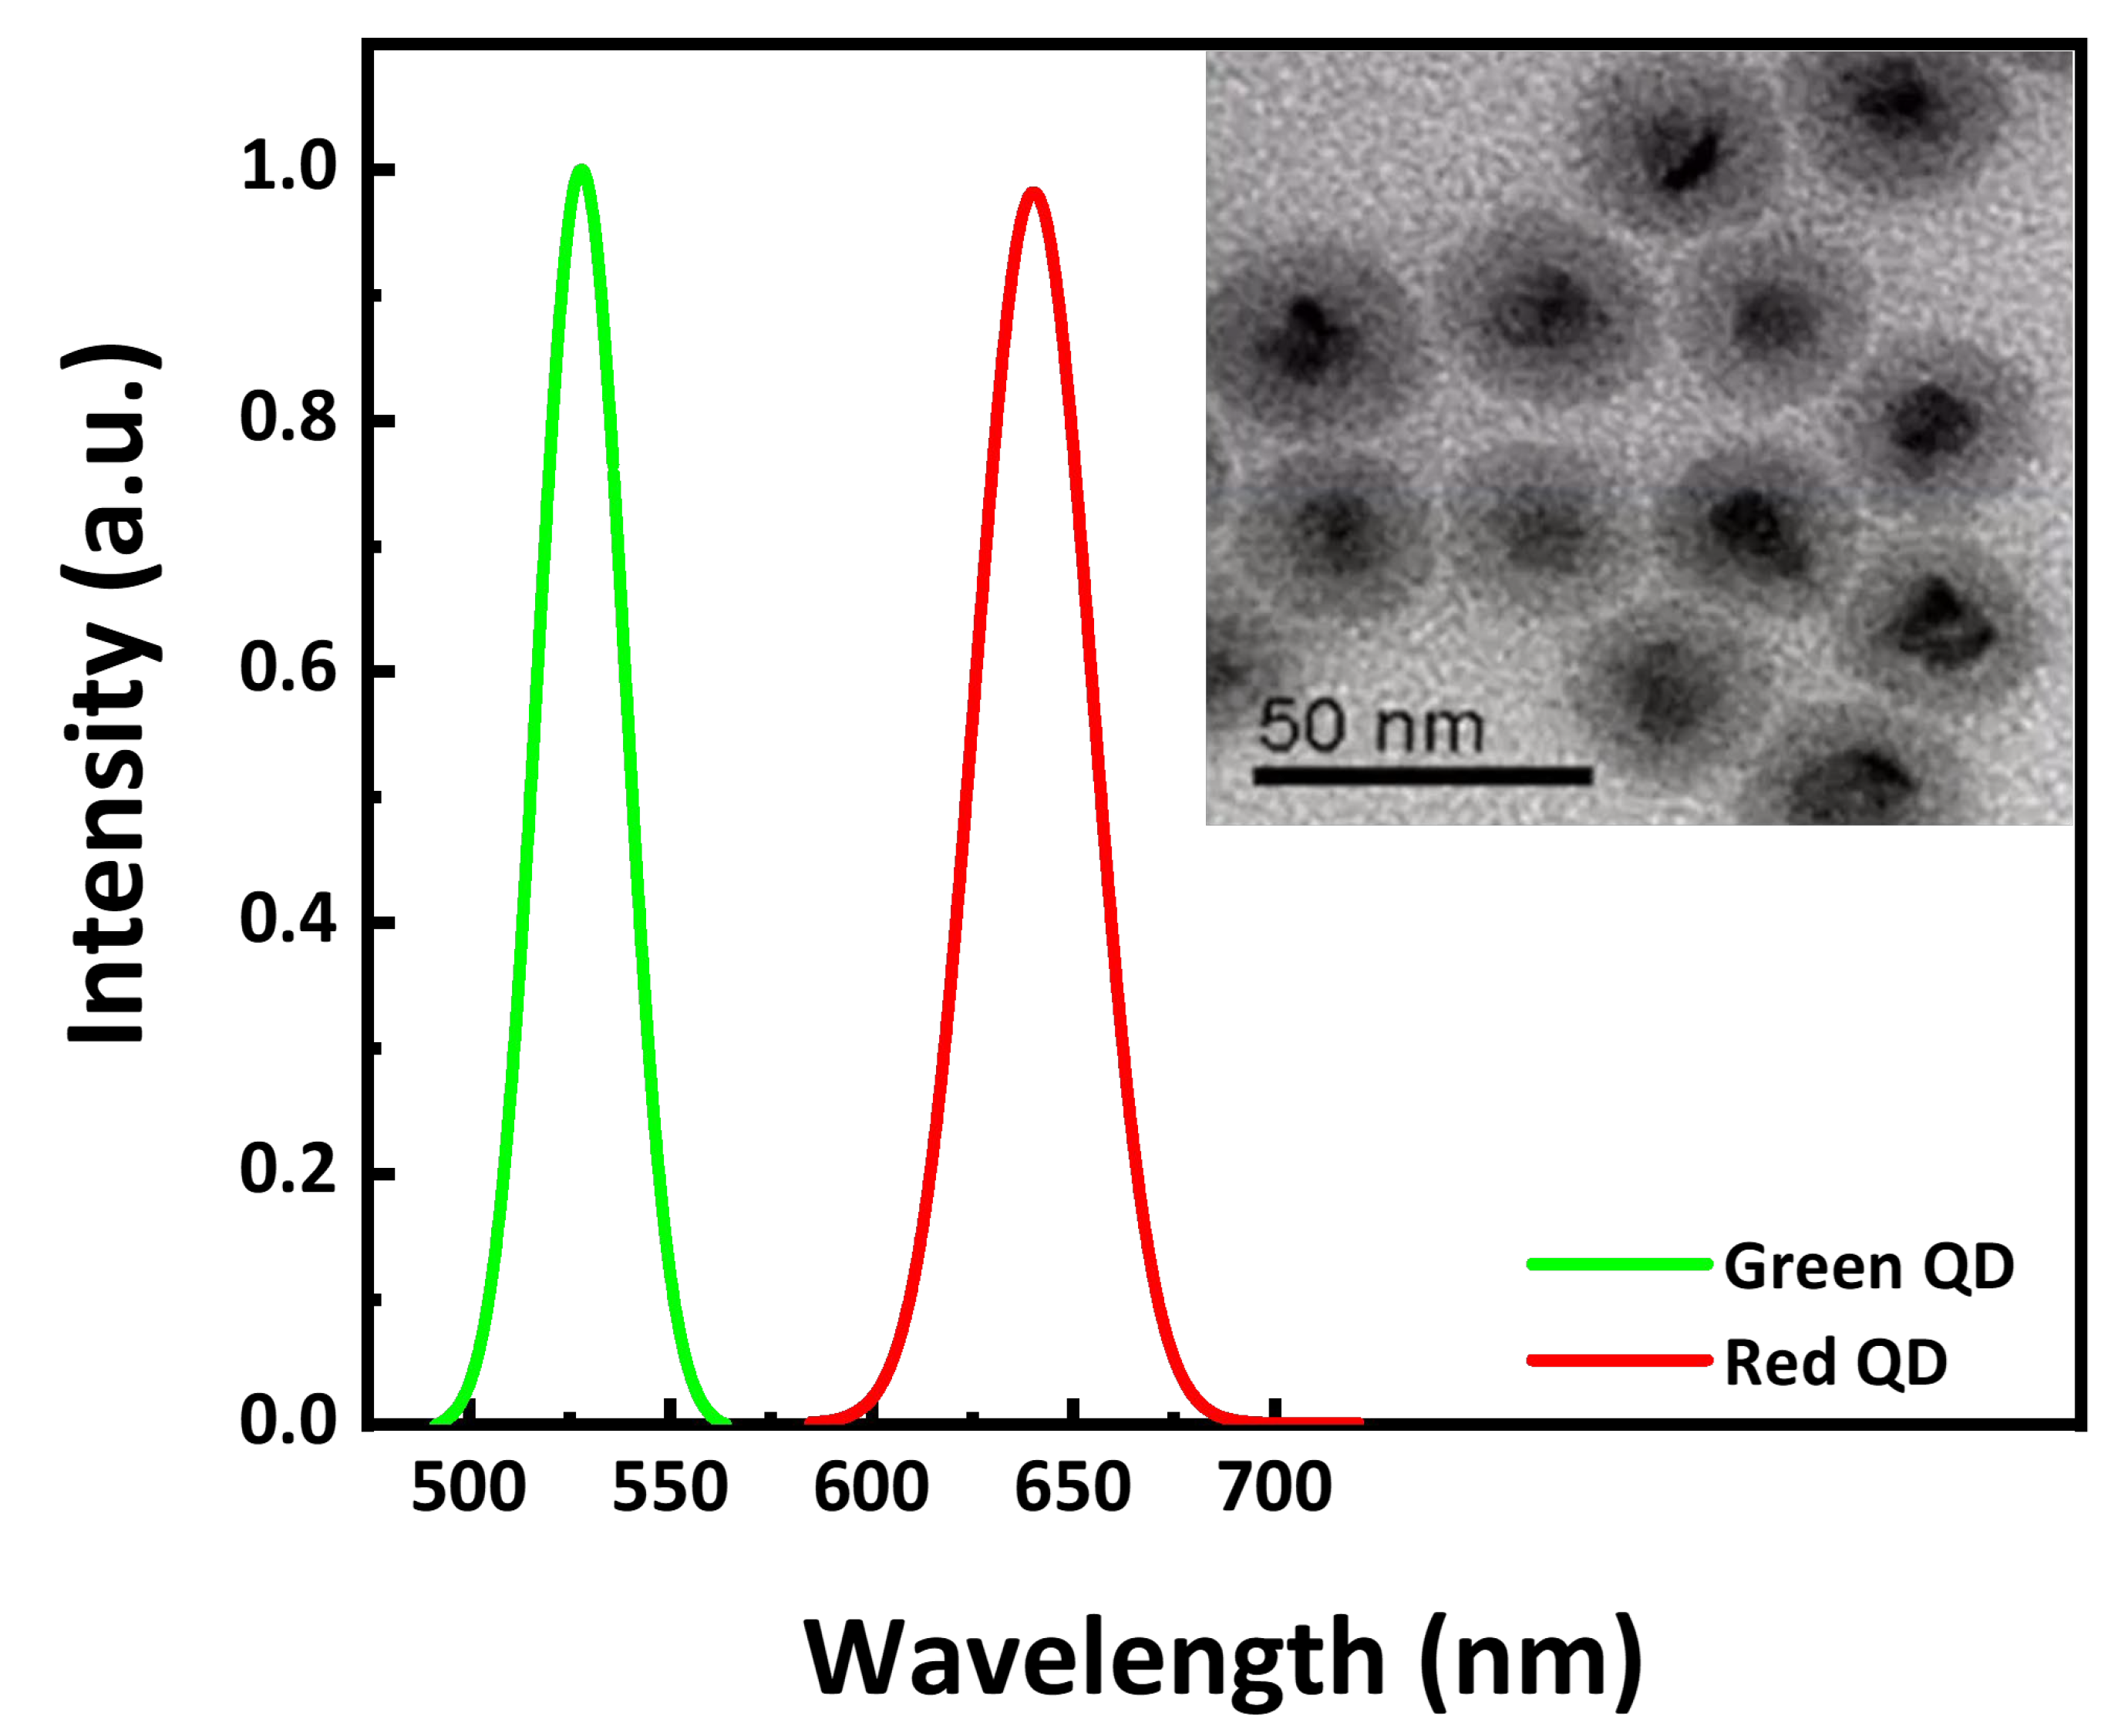
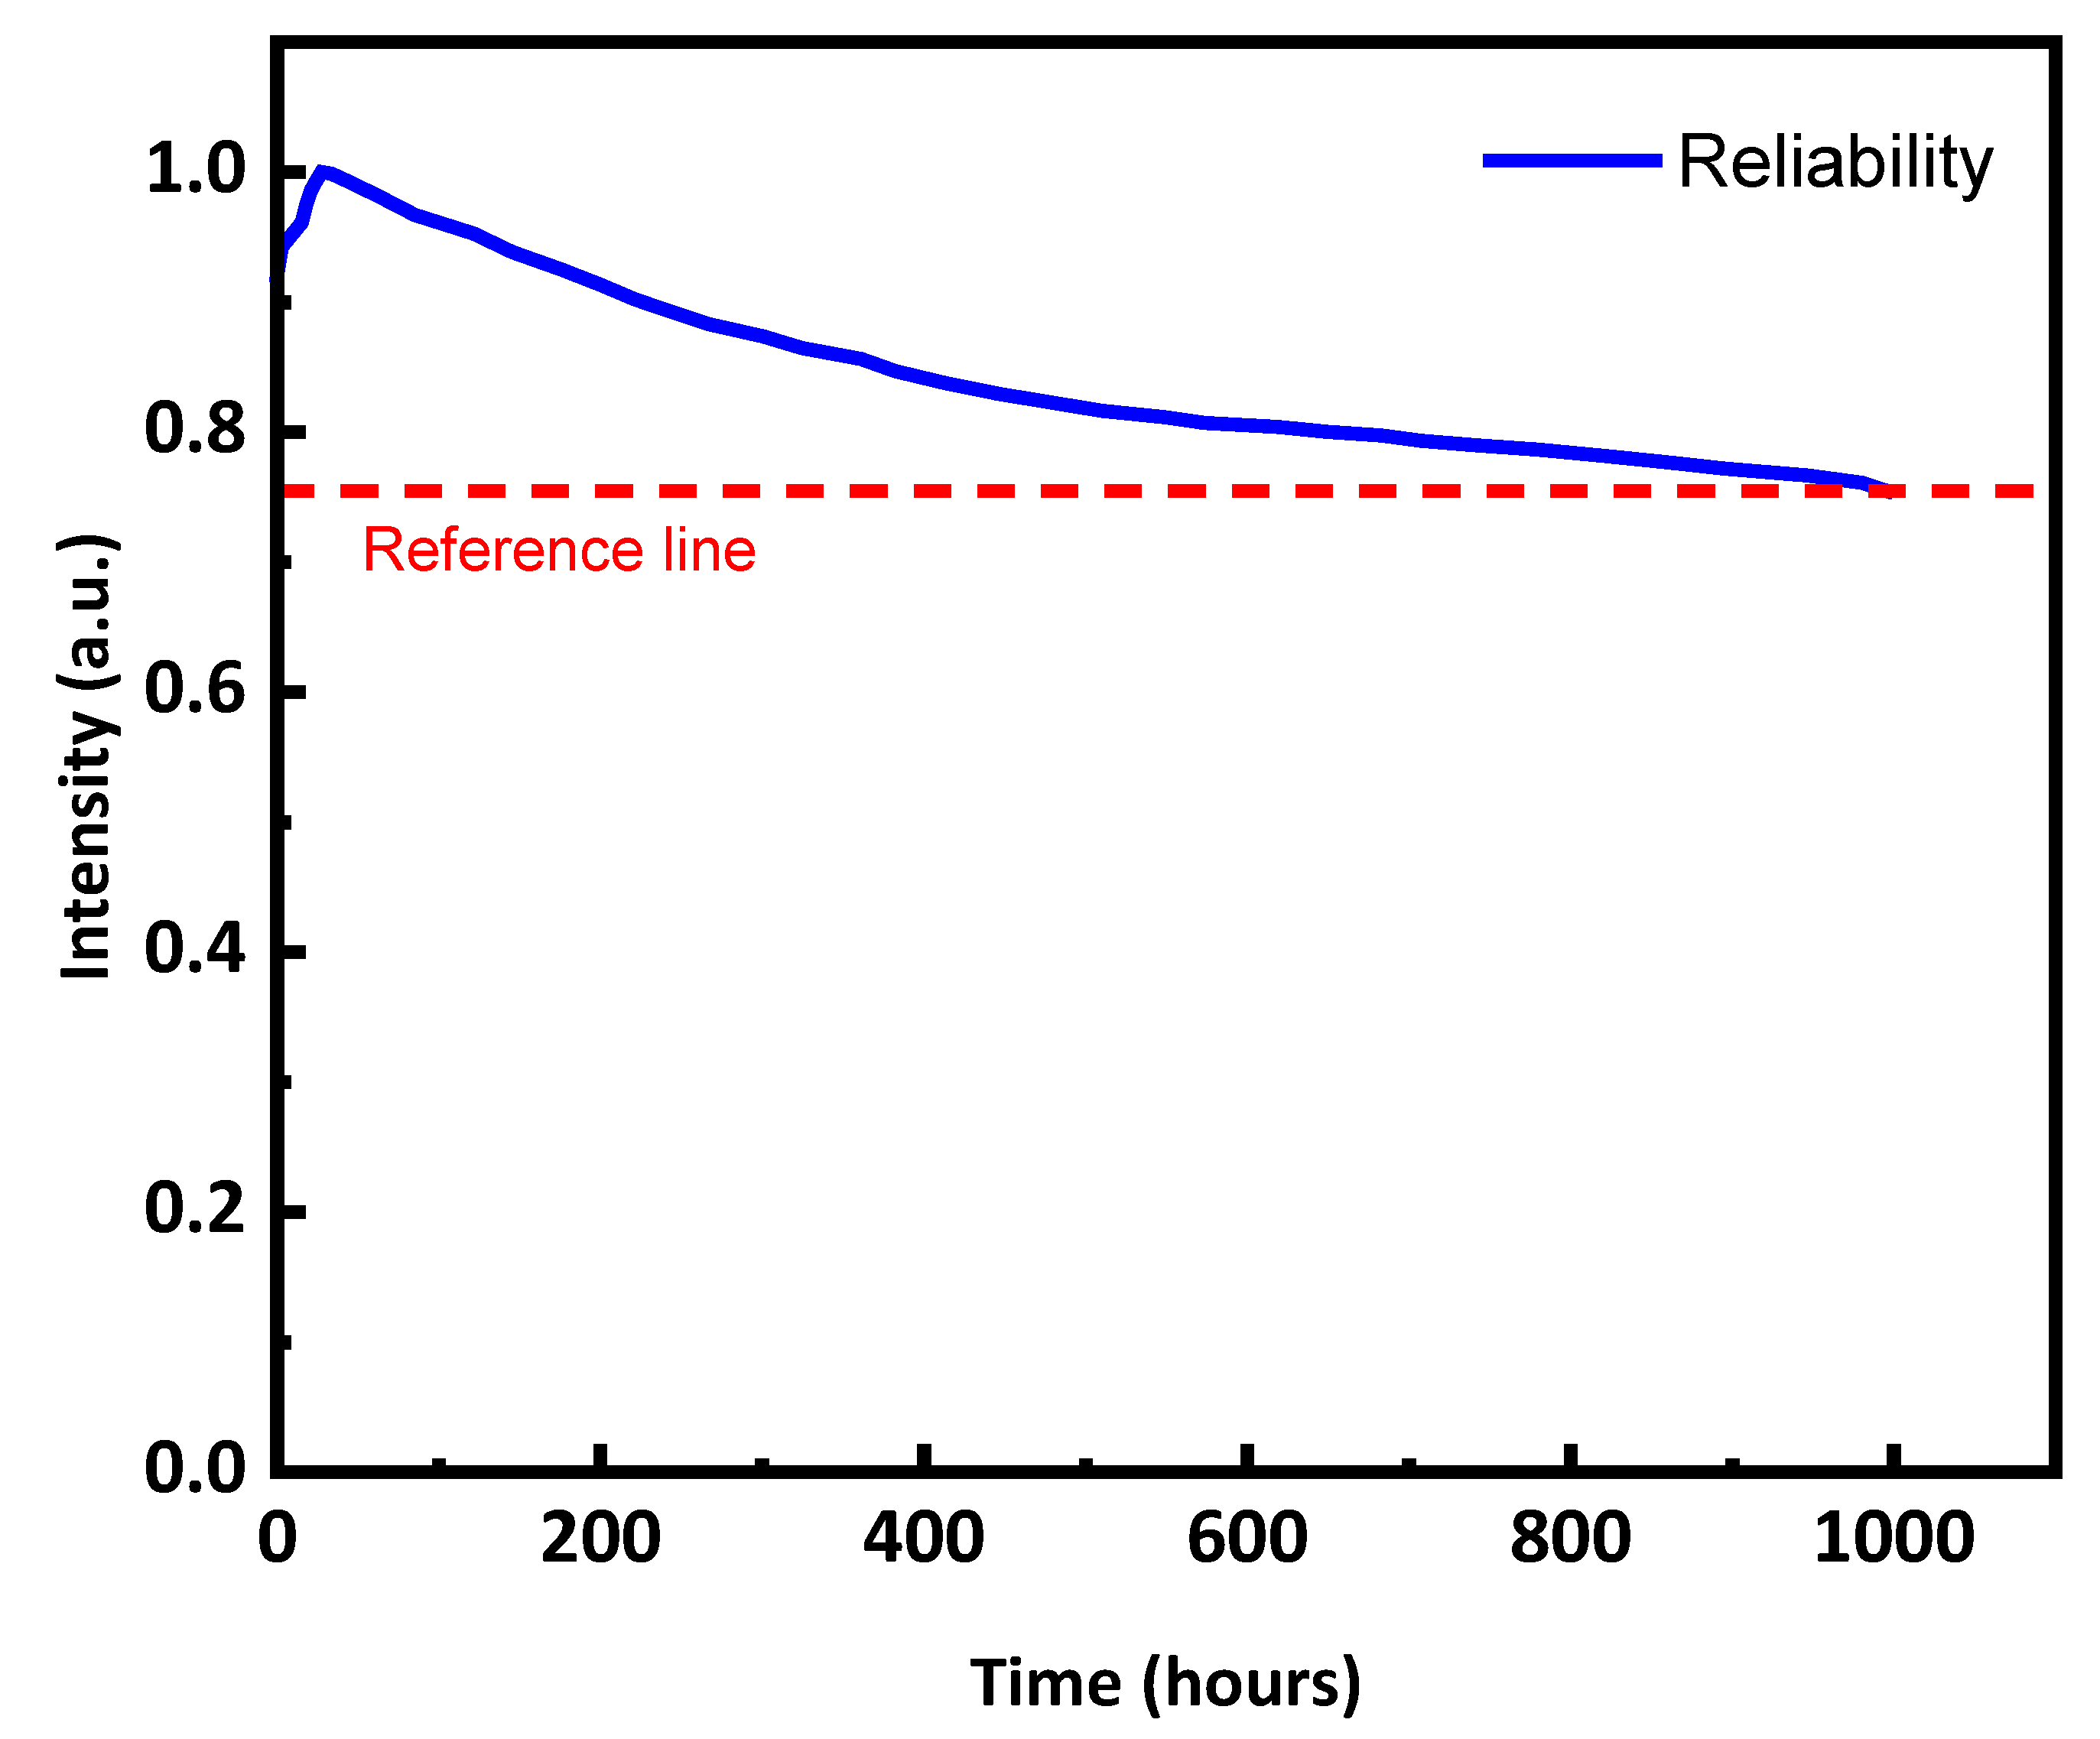
3.3. QD Color Conversion and Reliability Test of the Mini-LED Backlight Module

Based on the simulation results, the selected parameter values were a 40 μm transparent layer width, a thickness of 70 μm, an atomized layer thickness of 60 μm, and a 4.1% weight percent concentration of TiO2. The photoluminescence efficiencies (PLQY) were calculated using electroluminescence (EL) spectroscopy, as shown in Figure 8. Under 450 nm excitation, the photoluminescence central wavelengths for the green and red QD powders were 527 nm and 640 nm, respectively, with PLQY of 83.3% and 91.1%. Additionally, the FWHM values for the green and red powders were 22 nm and 33.5 nm, respectively.
Once the QD layer is prepared, it is paired with a blue mini-LED to create a display. This step verifies the optimal parameter outcomes from the simulation. We used a spectrophotometer (Minolta CS-1000T), an image generator (Chroma 2403), and a robotic arm (ABB IRB2600) to measure the display’s reliability. The luminance uniformity exceeded 90%, and the average center luminance was measured at 1057 cd/m2. A high-temperature and high-humidity reliability test of the mini-LED backlight module was also conducted. The module was tested with long-term light aging at a temperature of 60 °C and 90% relative humidity, as depicted in Figure 9. The results indicate that the illumination intensity of the mini-LED gradually converged to 75.5% after 996 h of testing. For the section concerning QD composite films, our team has previously published measurement data related to reliability [16]. We utilized ALD passivation protection technology to coat the QD surface with a protective Al2O3 layer, thereby enhancing its weathering resistance. Measurements were conducted for various tests, including a current variation test, a long-term light aging test, and a temperature/humidity test at 60°/90%. Our paper indicates that, after 1100 h in the long-term aging test, efficiency was reduced to only 0.225 of its original value, which corresponds to an LT50 of approximately 2300 h. For the 60°/90% temperature/humidity test, the LT50 was around 6070 h, demonstrating excellent wavelength stability and reliability.

4. Conclusions

Conventional optical design methods often emphasize the accuracy of model parameters, as they typically involve complex calculations and larger model structures. These methods can be challenging and difficult to implement, requiring significant time expenditure. The environmental control agent technique introduced in this study efficiently integrates multi-parameter simultaneous tunable combinations into an optimized model. This enhanced learning model also offers an efficient model optimization design method for mini-LED backlight modules. Through RDL, the optimal location on the solution plane can be determined more swiftly and with higher resolution. The optimization results using the DDQN algorithm were proven to be superior and faster than those from conventional optical simulations. It took only 23.3% of the total cycle time to find the optimal solution, and it achieved 83.8% illumination uniformity with the optimized parameter combination. This method will decrease the limitations of optical system design and analysis. It successfully yielded an ultra-thin, high-efficiency, high-brightness, and high-uniformity mini-LED backlight module based on the inference results of an artificial intelligence model. The combination of these forward-looking technologies is expected to lead to greater breakthroughs in display technology, thereby providing a better user experience and improved energy efficiency.

Author Contributions

Methodology, T.-Y.L.; software, W.-B.L. and J.-H.C.; validation, H.-C.K.; investigation, T.-Y.L. and W.-B.L.; writing—original draft preparation, T.-Y.L. and W.-T.H.; writing—review and editing, W.-T.H.; supervision, F.-C.C., S.-W.C., and H.-C.K. All authors have read and agreed to the published version of the manuscript.

Funding

We are grateful for the financial support provided by the National Science and Technology Council of Taiwan under contract nos. NSTC 111-2124-M-A49-004-, 112-2622-E-A49-012-, 112-2218-E-A49-022-MBK.

Data Availability Statement

Not applicable.

Acknowledgments

The authors would like to express their gratitude to Lextar Electronics Corporation, LEDA-technology Co., Ltd., and Hon Hai Research Institute for their technical support and helpful discussions.

Conflicts of Interest

The authors declare no conflict of interest.

References

  1. Kizilyalli, I.C.; Edwards, A.P.; Nie, H.; Disney, D.; Bour, D. High Voltage Vertical GaN p-n Diodes with Avalanche Capability. IEEE Trans. Electron Devices 2013, 60, 3067–3070. [Google Scholar] [CrossRef]
  2. Pimputkar, S.; Speck, J.S.; DenBaars, S.P.; Nakamura, S. Prospects for LED lighting. Nat. Photonics 2009, 3, 180–182. [Google Scholar] [CrossRef]
  3. Huang, C.-H.; Chen, K.-J.; Tsai, M.-T.; Shih, M.-H.; Sun, C.-W.; Lee, W.-I.; Lin, C.-C.; Kuo, H.-C. High-efficiency and low assembly-dependent chip-scale package for white light-emitting diodes. J. Photonics Energy 2015, 5, 057606. [Google Scholar] [CrossRef]
  4. Wu, T.; Sher, C.-W.; Lin, Y.; Lee, C.-F.; Liang, S.; Lu, Y.; Huang Chen, S.-W.; Guo, W.; Kuo, H.-C.; Chen, Z. Mini-LED and micro-LED: Promising candidates for the next generation display technology. Appl. Sci. 2018, 8, 1557. [Google Scholar] [CrossRef]
  5. West, R.S.; Konijn, H.; Sillevis-Smitt, W.; Kuppens, S.; Pfeffer, N.; Martynov, Y.; Takaaki, Y.; Eberle, S.; Harbers, G.; Tan, T.W.; et al. 43.4: High Brightness Direct LED Backlight for LCD-TV. In SID Symposium Digest of Technical Papers; Blackwell Publishing Ltd.: Oxford, UK, 2003; Volume 34, pp. 1262–1265. [Google Scholar] [CrossRef]
  6. Hsiang, E.-L.; Yang, Z.; Yang, Q.; Lan, Y.-F.; Wu, S.-T. Prospects and challenges of mini-LED, OLED, and micro-LED displays. J. Soc. Inf. Disp. 2021, 29, 446–465. [Google Scholar] [CrossRef]
  7. Yang, Z.; Hsiang, E.-L.; Qian, Y.; Wu, S.-T. Performance Comparison between Mini-LED Backlit LCD and OLED Display for 15.6-Inch Notebook Computers. Appl. Sci. 2022, 12, 1239. [Google Scholar] [CrossRef]
  8. Gao, Z.; Ning, H.; Yao, R.; Xu, W.; Zou, W.; Guo, C.; Luo, D.; Xu, H.; Xiao, J. Mini-LED Backlight Technology Progress for Liquid Crystal Display. Crystals 2022, 12, 313. [Google Scholar] [CrossRef]
  9. Chen, E.; Guo, J.; Jiang, Z.; Shen, Q.; Ye, Y.; Xu, S.; Sun, J.; Yan, Q.; Guo, T. Edge/direct-lit hybrid mini-LED backlight with U-grooved light guiding plates for local dimming. Opt. Express 2021, 29, 12179–12194. [Google Scholar] [CrossRef]
  10. Gong, Z.; Jin, S.; Chen, Y.; McKendry, J.; Massoubre, D.; Watson, I.M.; Gu, E.; Dawson, M.D. Size-dependent light output, spectral shift, and self-heating of 400 nm InGaN light-emitting diodes. J. Appl. Phys. 2010, 107, 013103. [Google Scholar] [CrossRef]
  11. Huang, Y.; Hsiang, E.-L.; Deng, M.-Y.; Wu, S.-T. Mini-LED, Micro-LED and OLED displays: Present status and future perspectives. Light: Sci. Appl. 2020, 9, 105. [Google Scholar] [CrossRef]
  12. Chen, H.; Sung, J.; Ha, T.; Park, Y. Locally pixel-compensated backlight dimming on LED-backlit LCD TV. J. Soc. Inf. Disp. 2007, 15, 981–988. [Google Scholar] [CrossRef]
  13. Yin, Y.; Peng, W.; Geng, J.; Bai, X.; Duan, M.; Wu, Y.; Hou, J.; Li, D.; Hwang, J.; Zhang, X.; et al. 18.4: Full-Color Active-matrix Mini-LED Display based on Novel Color Conversion Technology. SID Symp. Dig. Tech. Pap. 2021, 52, 244–246. [Google Scholar] [CrossRef]
  14. Chen, C.-J.; Lien, J.-Y.; Chiang, R.-K. P-115: Patternable and Ultra-Thin Quantum Dot Color Conversion Layer for Mini-Sized White Light LED Backlight. In SID Symposium Digest of Technical Papers; Blackwell Publishing Ltd.: Oxford, UK, 2019; Volume 50, pp. 1681–1684. [Google Scholar] [CrossRef]
  15. Lee, T.-Y.; Miao, W.-C.; Hung, Y.-Y.; Bai, Y.-H.; Chen, P.-T.; Huang, W.-T.; Chen, K.-A.; Lin, C.-C.; Chen, F.-C.; Hong, Y.-H.; et al. Ameliorating Uniformity and Color Conversion Efficiency in Quantum Dot-Based Micro-LED Displays through Blue–UV Hybrid Structures. Nanomaterials 2023, 13, 2099. [Google Scholar] [PubMed]
  16. Lee, T.-Y.; Hsieh, T.-H.; Miao, W.-C.; James Singh, K.; Li, Y.; Tu, C.-C.; Chen, F.-C.; Lu, W.-C.; Kuo, H.-C. High-Reliability Perovskite Quantum Dots Using Atomic Layer Deposition Passivation for Novel Photonic Applications. Nanomaterials 2022, 12, 4140. [Google Scholar] [CrossRef] [PubMed]
  17. Huang, Y.M.; Ahmed, T.; Liu, A.C.; Chen, S.W.H.; Liang, K.L.; Liou, Y.H.; Ting, C.C.; Kuo, W.H.; Fang, Y.H.; Lin, C.C.; et al. High-Stability Quantum Dot-Converted 3-in-1 Full-Color Mini-Light-Emitting Diodes Passivated with Low-Temperature Atomic Layer Deposition. IEEE Trans. Electron Devices 2021, 68, 597–601. [Google Scholar] [CrossRef]
  18. Sven-Silvius, S.; Neubert, B.; Eichler, C.; Scherer, M.; Habel, F.; Seyboth, M.; Scholz, F.; Hofstetter, D.; Unger, P.; Schmid, W.; et al. Absorption and light scattering in InGaN-on-sapphire- and AlGaInP-based light-emitting diodes. J. Light. Technol. 2004, 22, 2323–2332. [Google Scholar] [CrossRef]
  19. Arulkumaran, K.; Deisenroth, M.P.; Brundage, M.; Bharath, A.A. Deep Reinforcement Learning: A Brief Survey. IEEE Signal Process. Mag. 2017, 34, 26–38. [Google Scholar] [CrossRef]
  20. Sutton, R.S.; Barto, A.G. Reinforcement Learning: An Introduction; MIT Press: Cambridge, MA, USA, 2018. [Google Scholar]
  21. Silver, D.; Huang, A.; Maddison, C.J.; Guez, A.; Sifre, L.; van den Driessche, G.; Schrittwieser, J.; Antonoglou, I.; Panneershelvam, V.; Lanctot, M.; et al. Mastering the game of Go with deep neural networks and tree search. Nature 2016, 529, 484–489. [Google Scholar] [CrossRef]
  22. Huang, C.-H.; Cheng, Y.-T.; Tsao, Y.-C.; Liu, X.; Kuo, H.-C. Micro-LED backlight module by deep reinforcement learning and micro-macro-hybrid environment control agent. Photon. Res. 2022, 10, 269–279. [Google Scholar] [CrossRef]
  23. Hasselt, H. Double Q-learning. In Advances in Neural Information Processing Systems, Proceedings of the NIPS 2010, Vancouver, BC, Canada, 6–9 December 2010; Curran Associates, Inc.: Red Hook, NY, USA, 2010; Volume 23, p. 23. [Google Scholar]
  24. Hessel, M.; Modayil, J.; Van Hasselt, H.; Schaul, T.; Ostrovski, G.; Dabney, W.; Horgan, D.; Piot, B.; Azar, M.; Silver, D. Rainbow: Combining improvements in deep reinforcement learning. In Proceedings of the Thirty-Second AAAI Conference on Artificial Intelligence, New Orleans, LA, USA, 2–7 February 2018. [Google Scholar]
  25. Lillicrap, T.P.; Hunt, J.J.; Pritzel, A.; Heess, N.; Erez, T.; Tassa, Y.; Silver, D.; Wierstra, D. Continuous control with deep reinforcement learning. arXiv 2015, arXiv:1509.02971. [Google Scholar]
  26. Sewak, M. Deep Q Network (DQN), Double DQN, and Dueling DQN. In Deep Reinforcement Learning: Frontiers of Artificial Intelligence; Sewak, M., Ed.; Springer: Singapore, 2019; pp. 95–108. [Google Scholar] [CrossRef]
  27. Brim, A. Deep Reinforcement Learning Pairs Trading with a Double Deep Q-Network. In Proceedings of the 2020 10th Annual Computing and Communication Workshop and Conference (CCWC), Las Vegas, NV, USA, 6–8 January 2020; pp. 0222–0227. [Google Scholar]
  28. Han, B.A.; Yang, J.J. Research on Adaptive Job Shop Scheduling Problems Based on Dueling Double DQN. IEEE Access 2020, 8, 186474–186495. [Google Scholar] [CrossRef]
  29. Salh, A.; Audah, L.; Alhartomi, M.A.; Kim, K.S.; Alsamhi, S.H.; Almalki, F.A.; Abdullah, Q.; Saif, A.; Algethami, H. Smart Packet Transmission Scheduling in Cognitive IoT Systems: DDQN Based Approach. IEEE Access 2022, 10, 50023–50036. [Google Scholar] [CrossRef]
  30. Salh, A.; Audah, L.; Kim, K.S.; Alsamhi, S.H.; Alhartomi, M.A.; Abdullah, Q.; Almalki, F.A.; Algethami, H. Refiner GAN Algorithmically Enabled Deep-RL for Guaranteed Traffic Packets in Real-Time URLLC B5G Communication Systems. IEEE Access 2022, 10, 50662–50676. [Google Scholar] [CrossRef]
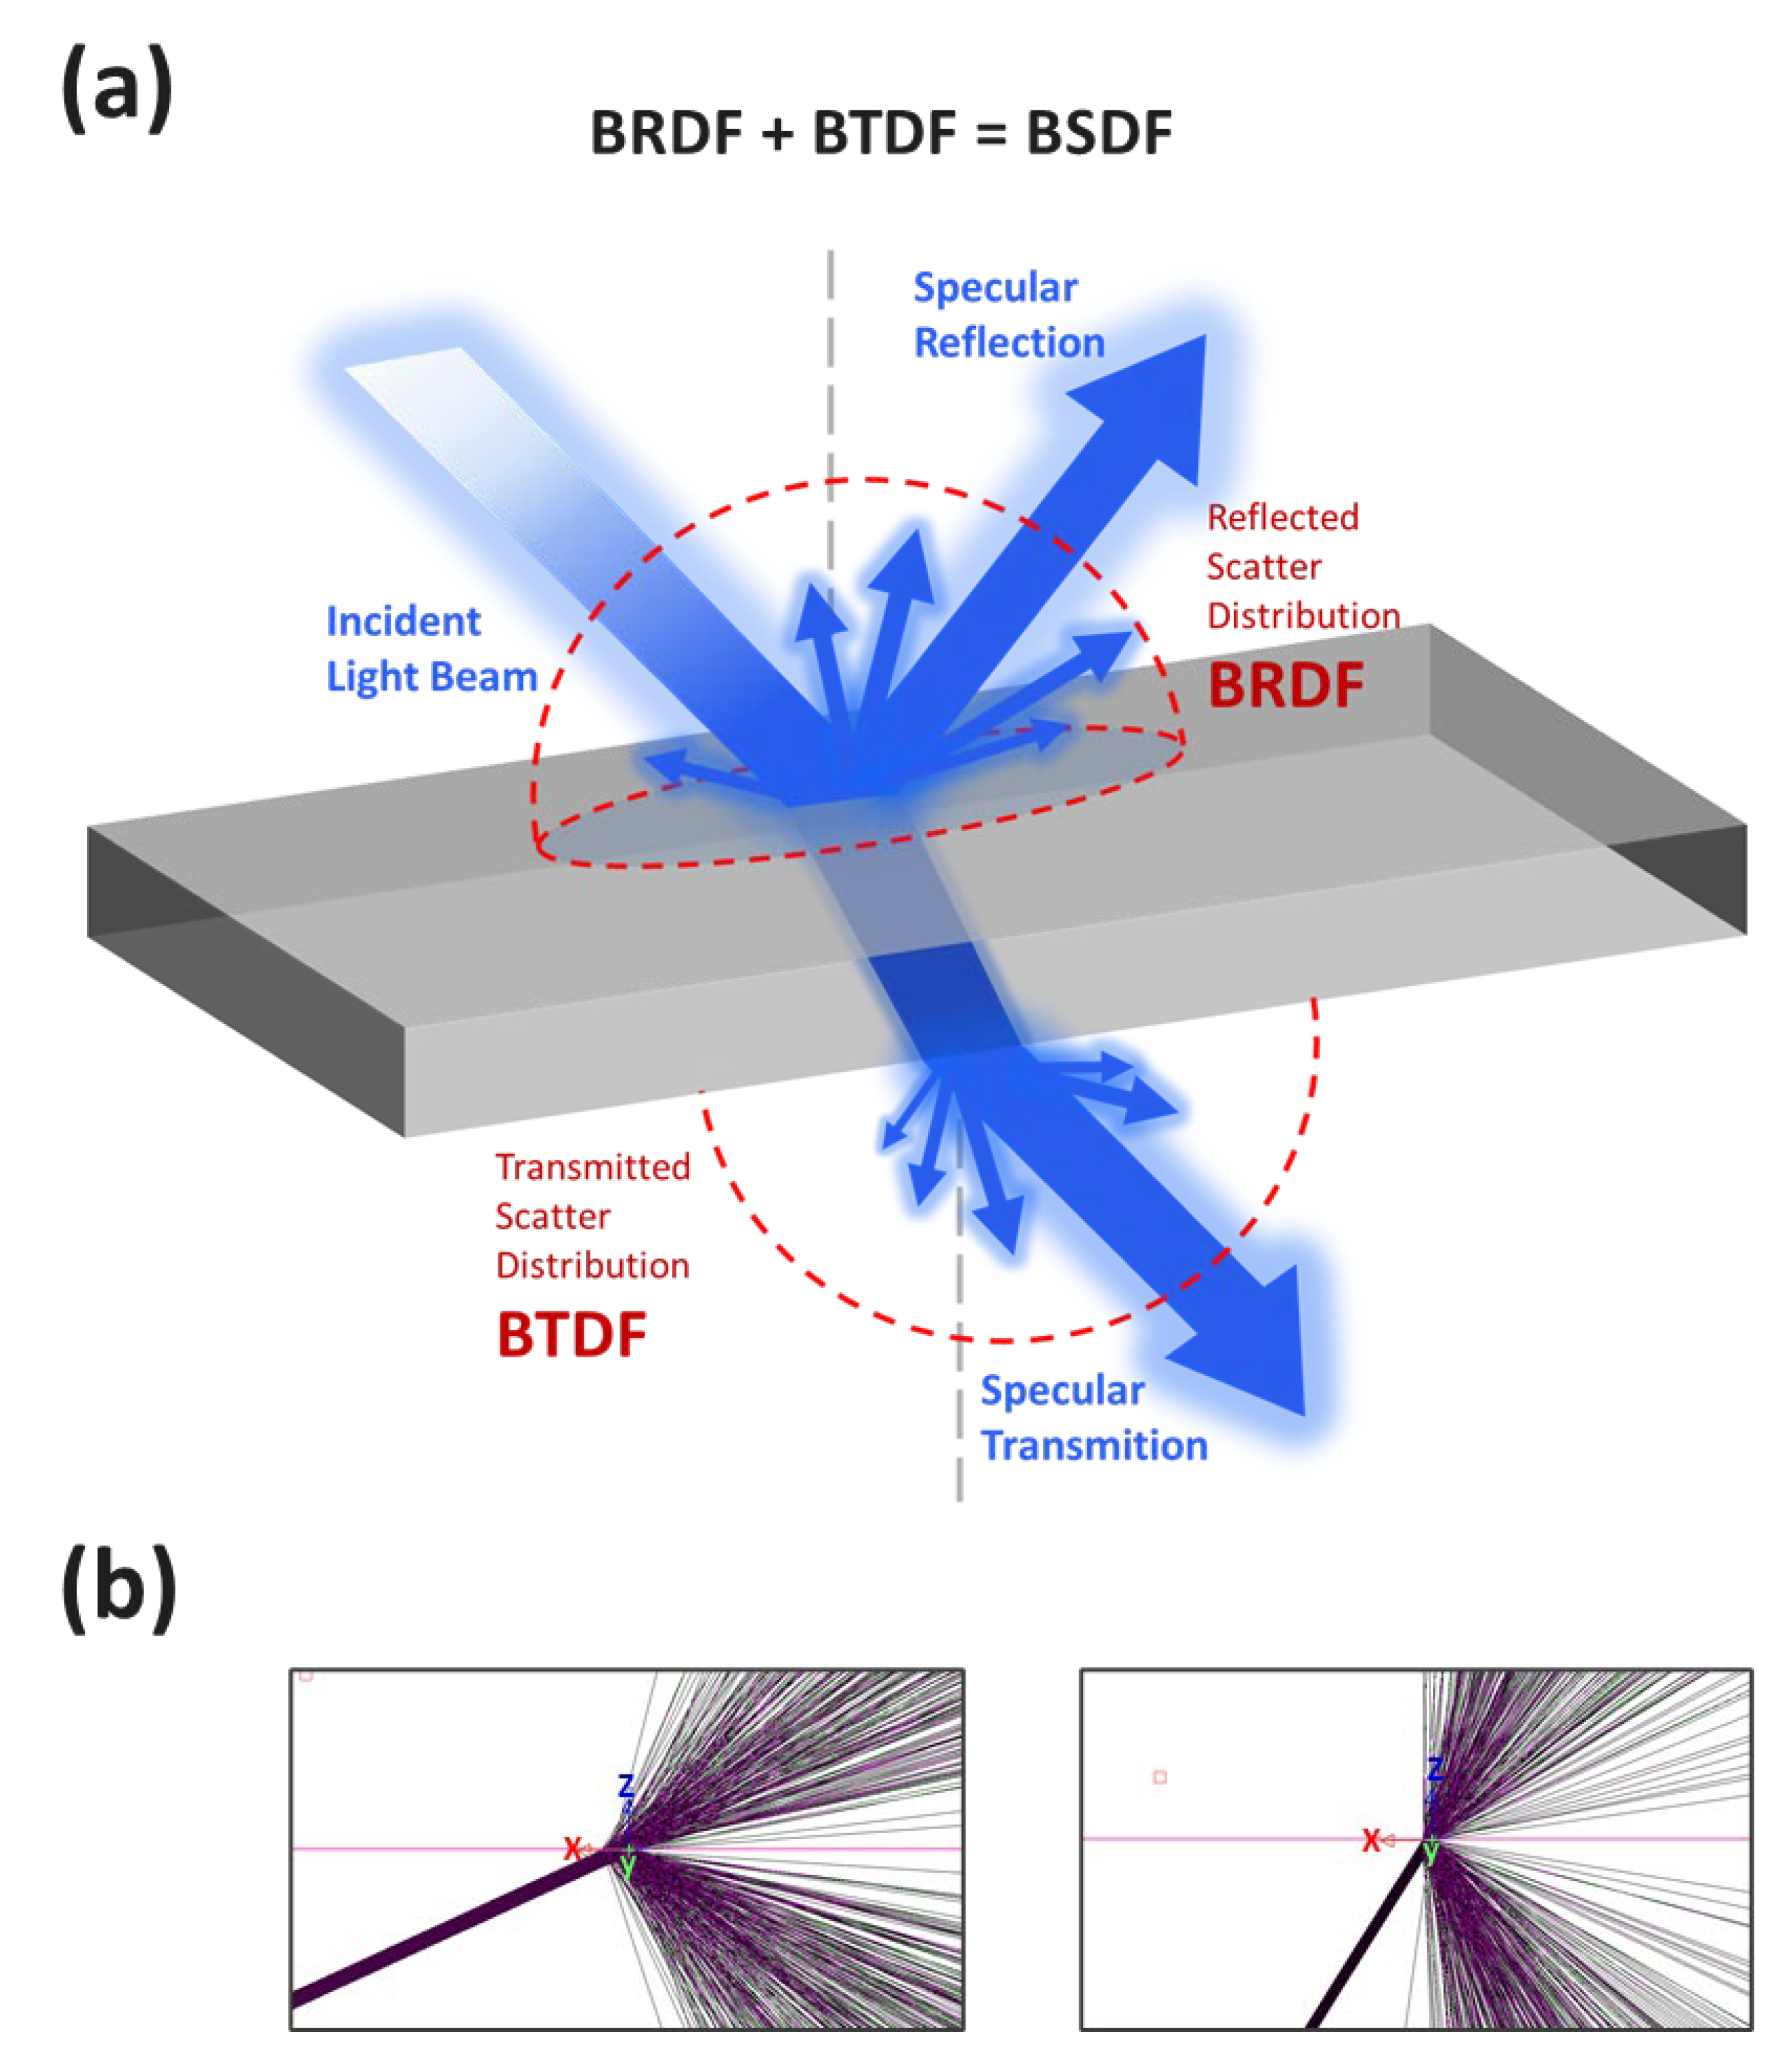
  31. Asmail, C. Bidirectional Scattering Distribution Function (BSDF): A Systematized Bibliography. J. Res. Natl. Inst. Stand. Technol. 1991, 96, 215–223. [Google Scholar] [CrossRef] [PubMed]
  32. Leloup, F.B.; Forment, S.; Dutré, P.; Pointer, M.R.; Hanselaer, P. Design of an instrument for measuring the spectral bidirectional scatter distribution function. Appl. Opt. 2008, 47, 5454–5467. [Google Scholar] [CrossRef]
  33. Ward, G.; Mistrick, R.; Lee, E.S.; McNeil, A.; Jonsson, J. Simulating the Daylight Performance of Complex Fenestration Systems Using Bidirectional Scattering Distribution Functions within Radiance. LEUKOS 2011, 7, 241–261. [Google Scholar] [CrossRef]
Figure 1. (a) Schematic diagram of mini-LED backlight module and single packaged LED. (b) Illuminance uniformity with variable concentration of TiO2 in the diffusion layer. (c) The schematic diagram of the changing process while increasing the concentration of TiO2 in the diffusion layer.
Crystals 13 01411 g001
Figure 2. (a) Overall design of optical simulation and algorithm; (b) schematic diagram of modeling in LightTools.
Crystals 13 01411 g002
Figure 3. (a) Schematic diagram of BSDF. (b) Result of BSDF measurement.
Crystals 13 01411 g003
Figure 4. Workflow of DDQN algorithm.
Crystals 13 01411 g004
Figure 5. Simulated light patterns of mini-LED with variable TiO2 concentration in the diffusion layer.
Crystals 13 01411 g005
Figure 6. (a) Setup completed with hyperparameters but not yet adjusted. (b) Optimized learning rate and ε-decay value settings, but poor convergence. (c) Optimizing the reward function allowed the data to converge.
Crystals 13 01411 g006
Figure 7. (a) Mini-LED simulation model in LightTools. (b,c) Optimizing the illumination uniformity of the result.
Crystals 13 01411 g007
Figure 8. The electroluminescence spectra of the green and red QD; the inset is the optical microscopic photo of the QDs.
Crystals 13 01411 g008
Figure 9. The intensity of the mini-LED backlight module over time, tested at a temperature of 60 °C and 90% relative humidity.
Crystals 13 01411 g009
Table 1. Tunable parameters in the LightTools environment model for reinforce learning.
ParametersSymbolRange
Width of transparent layera30 μm to 200 μm, step: 10 μm
Thickness of transparent layerb30 μm to 140 μm, step: 10 μm
Thickness of diffusor layerc30 μm to 140 μm, step: 10 μm
Weight concentration of TiO2d0.1% to 30%, step: 0.1%
Table 2. Definition of state space, action space, and reward function.
State Space (St)Action Space (at)Reward Function (rt)
State No.State DefinitionAction No.Action DefinitionReward No.Reward Definition
S1The value of aa1, a2increase a, decrease auIlluminance uniformity = Minimum Illuminance/Average Illuminance
S2The value of ba3, a4increase b, decrease brr1 = (Uniformitynew − 73)3/1000
r2 = (unew − uold)/100
R (out of range) = −10
S3The value of ca5, a6increase c, decrease c
S4The value of da7, a8increase d, decrease d
Table 3. TiO2 particle concentration in diffusion layer on the angle-intensity of mini-LED backlight module data.
Weight Concentration22.533.544.55
Divergence Angle
L = 0141146152156165166167
L = 90147152161170171168167
Disclaimer/Publisher’s Note: The statements, opinions and data contained in all publications are solely those of the individual author(s) and contributor(s) and not of MDPI and/or the editor(s). MDPI and/or the editor(s) disclaim responsibility for any injury to people or property resulting from any ideas, methods, instructions or products referred to in the content.

