Article

Synthesis, Crystal Structure, DFT Studies and Optical/Electrochemical Properties of Two Novel Heteroleptic Copper(I) Complexes and Application in DSSC

by
Samuel Soto-Acosta
1,
José J. Campos-Gaxiola
1,*,
Edgar A. Reynoso-Soto
2,
Adriana Cruz-Enríquez
1,
Jesús Baldenebro-López
1,
Herbert Höpfl
3,
Juventino J. García
4,
Marcos Flores-Álamo
4,
Valentín Miranda-Soto
2 and
Daniel Glossman-Mitnik
5
1
Facultad de Ingeniería Mochis, Universidad Autónoma de Sinaloa, Fuente de Poseidón y Prol. A. Flores S/N, C.U., Los Mochis C.P. 81223, Mexico
2
Tecnológico Nacional de México, Instituto Tecnológico de Tijuana, Centro de Graduados e Investigación en Química, Apartado Postal 1166, Tijuana C.P. 22000, Mexico
3
Centro de Investigaciones Químicas, Instituto de Investigación en Ciencias Básicas y Aplicadas, Universidad Autónoma del Estado de Morelos, Av. Universidad 1001, Cuernavaca C.P. 62209, Mexico
4
Facultad de Química, Universidad Nacional Autónoma de México, Cto. Exterior S/N, C.U., Ciudad de México C.P. 04510, Mexico
5
Centro de Investigación en Materiales Avanzados, S. C., Miguel de Cervantes 120, Complejo Industrial Chihuahua, Chihuahua 31136, Mexico
*
Author to whom correspondence should be addressed.
Crystals 2022, 12(9), 1240; https://doi.org/10.3390/cryst12091240
Submission received: 16 August 2022 / Revised: 25 August 2022 / Accepted: 26 August 2022 / Published: 1 September 2022
(This article belongs to the Special Issue Feature Papers in Crystal Engineering in 2022)

Abstract

:
New copper(I) compounds of compositions [Cu(HL)(PPh3)2]·H2O (1) and [Cu(HL)POP]·CH2Cl2 (2), where HL = monoanion of pyridine-2,5-dicarboxylic acid, PPh3 = triphenylphosphine and POP = bis [2-(diphenylphosphine)phenyl]ether), are documented. The complexes were characterized by elemental analysis, spectroscopic techniques (IR, 1H/31P RMN and UV–VIS), cyclic voltammetry, and thermogravimetric analysis. Single-crystals for 1 and 2 enabled X-ray diffraction analysis, revealing distorted tetrahedral geometries for Cu(I) centers embedded in NOP2 environments. The crystal structures are stabilized by O−H∙∙∙O, C−H∙∙∙O, C−H∙∙∙π and π∙∙∙π interactions that were analyzed by inspection of the Hirshfeld surfaces and fingerprint plots. Compounds 1 and 2 show interesting optical/electrochemical properties, which were studied experimentally in solution by UV–Vis spectroscopy and cyclic voltammetry, as well as theoretically using Time-Dependent Density Functional Theory (TD-DFT). Additionally, in combination with the ruthenium complex N719, their efficiency as co-sensitizers in dye-sensitized solar cells (DSSCs) was assessed, showing good activity.

1. Introduction

In the past five decades, the worldwide energy demand increase and its climate change repercussions have promoted interest for renewable energy sources due to the increase of carbon dioxide emission [1,2]. According to energy claims and consequent environmental concerns, solar energy-to-electricity conversion technologies (photovoltaics) constitute at this instant the main perspective for clean energy and have raised an accelerated development in renewable energy research [2,3,4]. In photovoltaic technology, over the past two decades, dye-sensitized solar cells (DSSCs) emerged as a unique option for energy generation by achieving sunlight-to-electricity conversion through a process partially imitating photosynthesis. This method offers a promising alternative for manufacturing highly efficient and low-cost solar cells based on good transparency, novel color options, plastic flexibility, and eco-friendly operation. Because of these advantages, dye-based photovoltaic systems have become a reliable competitor to solid-state junction devices [4]. There are two types of sensitizers used in DSSCs: organic dyes and inorganic dyes. Organic dyes involve natural or synthetic organic compounds. Inorganic dyes include metal compounds such as polypyridyl, porphyrin, and phthalocyanine complexes. The most common metals in these N-ligand based complexes are Ru (II), Os (II), Ir (III), and Pt (II) complexes, which frequently show intense absorption in the visible region, elevated photoluminescence quantum yields, good excited-state lifetimes, and high thermal and chemical stability [5,6,7].
The organic compound or coordination complex in DSSCs is responsible for light recollection and electron transfer into the conduction band (CB) of a semiconductor electrode (typically TiO2), to which it is chemically bonded. The performance of the solar device depends further on the composition of the redox couple and the electrolyte, and most crucially, the dye properties [8]. Over the past two decades, much effort has been spent in optimizing these components to improve the DSSCs’ overall efficiency [9].
Ruthenium compounds have demonstrated particularly good solar energy-electricity conversion efficacy by giving photon-to-current conversion efficiencies (PCEs) above 10% [10]. In this context, the most well-known dyes are [cis-(dithiocyanato)-Ru-bis(2,2′-bipyridine-4,4′-dicarboxylate)], N3, and the doubly protonated tetrabutylammonium salt, N719 [11]. However, ruthenium is among the most expensive metals and is difficult to acquire, aside from being harmful to the environment since metal complexes based on this metal frequently undergo degradation in the presence of water [12].
Aiming to develop more accessible and sustainable materials for DSSCs [6,13,14], Cu(I) complexes have recently attracted interest due to their excellent photophysical and electrochemical properties as well as the low cost, abundance, and environmentally friendly features of copper [15,16]. These attributes have stimulated the use of Cu(I) complexes for the preparation of diverse components in DSSCs, e.g., as hole-transporting materials (HTM) [17], redox mediators [18], and dyes [19].
The seminal contributions by Sauvage and coworkers [20] on Cu(I) polypyridyl complexes of the type [Cu(N^N)2]+ as dyes with wide band-gap semiconductors (TiO2 and ZnO) for DSSCs have stimulated the development of other homoleptic [Cu(N^N)2]+ and heteroleptic [Cu(N^N)(N^N)’]+ or [Cu(N^N)(P^P)]+ sensitizers (N^N = diimine chelating ligand; P^P = bidentate diphosphines) [11,21,22]. While homoleptic Cu(I) complexes for DSSCs are synthesized with ease, attaching ligands containing different functional groups is challenging. However, Cu(I) complexes used for applications in DSSCs should carry anchoring ligands that bind to the TiO2 semiconductor surface and ancillary ligands enabling for adjustment of the photonic and electronic properties of the compounds. Because of this, heteroleptic type Cu(I) complexes contain generally two distinct ligands that include the required functional and anchoring groups. Heteroleptic copper(I) sensitizers carrying carboxylic acid/carboxylate or phosphonic acids as anchoring ligands also gave improved DSSC performances [23,24].
Using a heteroleptic copper(I) dye with the sterically demanding 6,6-dimesityl-2,2′-bipyridine-4,4′-dicarboxylic acid anchoring ligand, a 2,2′-bipyridine auxiliary ligand and hole-transporting triphenylamino units, Odobel and coworkers reached a DSSC with a photoconversion efficiency of 4.66%. The relatively large efficiency of the DSSC was also attributed to the co-adsorbent chenodeoxycholic acid [25,26]. There are also DSSCs in which copper compounds are employed as electrolytes due to their favorable Cu(I/II) redox potentials [27], and DSSCs in which both the dye and the electrolyte are copper complexes [28].
Our research groups reported previously the photophysical and electrochemical properties of heteroleptic Cu(I) complexes carrying sterically demanding triphenylphosphine (PPh3) as ancillary ligand and either cis-(±)-2,4,5-tris(2-pyridyl)imidazoline or 2,4,6-tris(2-pyridyl)triazine as anchoring ligand and their performance as co-sensitizer in DSSCs [29]. Herein, we document the molecular and crystal structures of two novel complexes of composition [Cu(HL)(PPh3)2]·H2O (1) and [Cu(HL)POP]·CH2Cl2 (2), where HL = monoanion of pyridine-2,5-dicarboxylic acid, PPh3 = triphenylphosphine and POP = bis [2-(diphenylphosphine)phenyl]ether), see Scheme 1. Both complexes exhibit interesting optical and electrochemical properties, which were evaluated in solution by UV–Vis spectroscopy and cyclic voltammetry and analyzed further by TD-DFT calculations. In addition, their efficiency as sensitizer and co-sensitizer in DSSCs was assessed.

2. Materials and Methods

2.1. General

All chemicals, including pyridine-2,5-dicarboxylic acid (H2L), triphenylphosphine (PPh3), bis [2-(diphenylphosphine)phenyl]ether (POP) and [Cu(MeCN)4]PF6 were purchased from Sigma-Aldrich and used as received without further purification. The dye N719 was purchased from Solaronix. [Cu(PPh3)2NO3] was obtained by a previously documented methodology [30]. Elemental analyses were performed on a Elementar Vario ELII instrument. IR spectra were determined on a Bruker Alpha Tensor 27 Vertex Series spectrophotometer using KBr pellets in the 4000–500 cm−1 region. A Bruker Advance III-400 spectrometer was used to record 1H and 31P NMR spectra. Chemical shifts are reported in ppm and were referenced to residual solvent resonances. UV–Vis absorption spectra were recorded on a Shimadzu UV-1800 spectrophotometer. Electrochemical redox potentials were obtained by means of cyclic voltammetry (CV) on an electrochemistry workstation (Bio-Logic VMP-300 potentiostat-galvanostat) with platinum, silver wire and Ag/AgNO3 as working, counter and reference electrodes, respectively. Substrates were dissolved in HPLC grade EtOH for 1 and CH2Cl2 for 2 (ca. 8 × 10⁻⁵ M) containing 0.025 M tetrabutylammonium hexafluorophosphate (nBu4N)PF6 as supporting electrolyte. The scan rate was 100 mVs−1. Thermogravimetric analyses were performed on a TA SDT Q600 apparatus in the range 50–800 °C (10 °C min−1) using nitrogen (50 mL min−1) as purge gas.

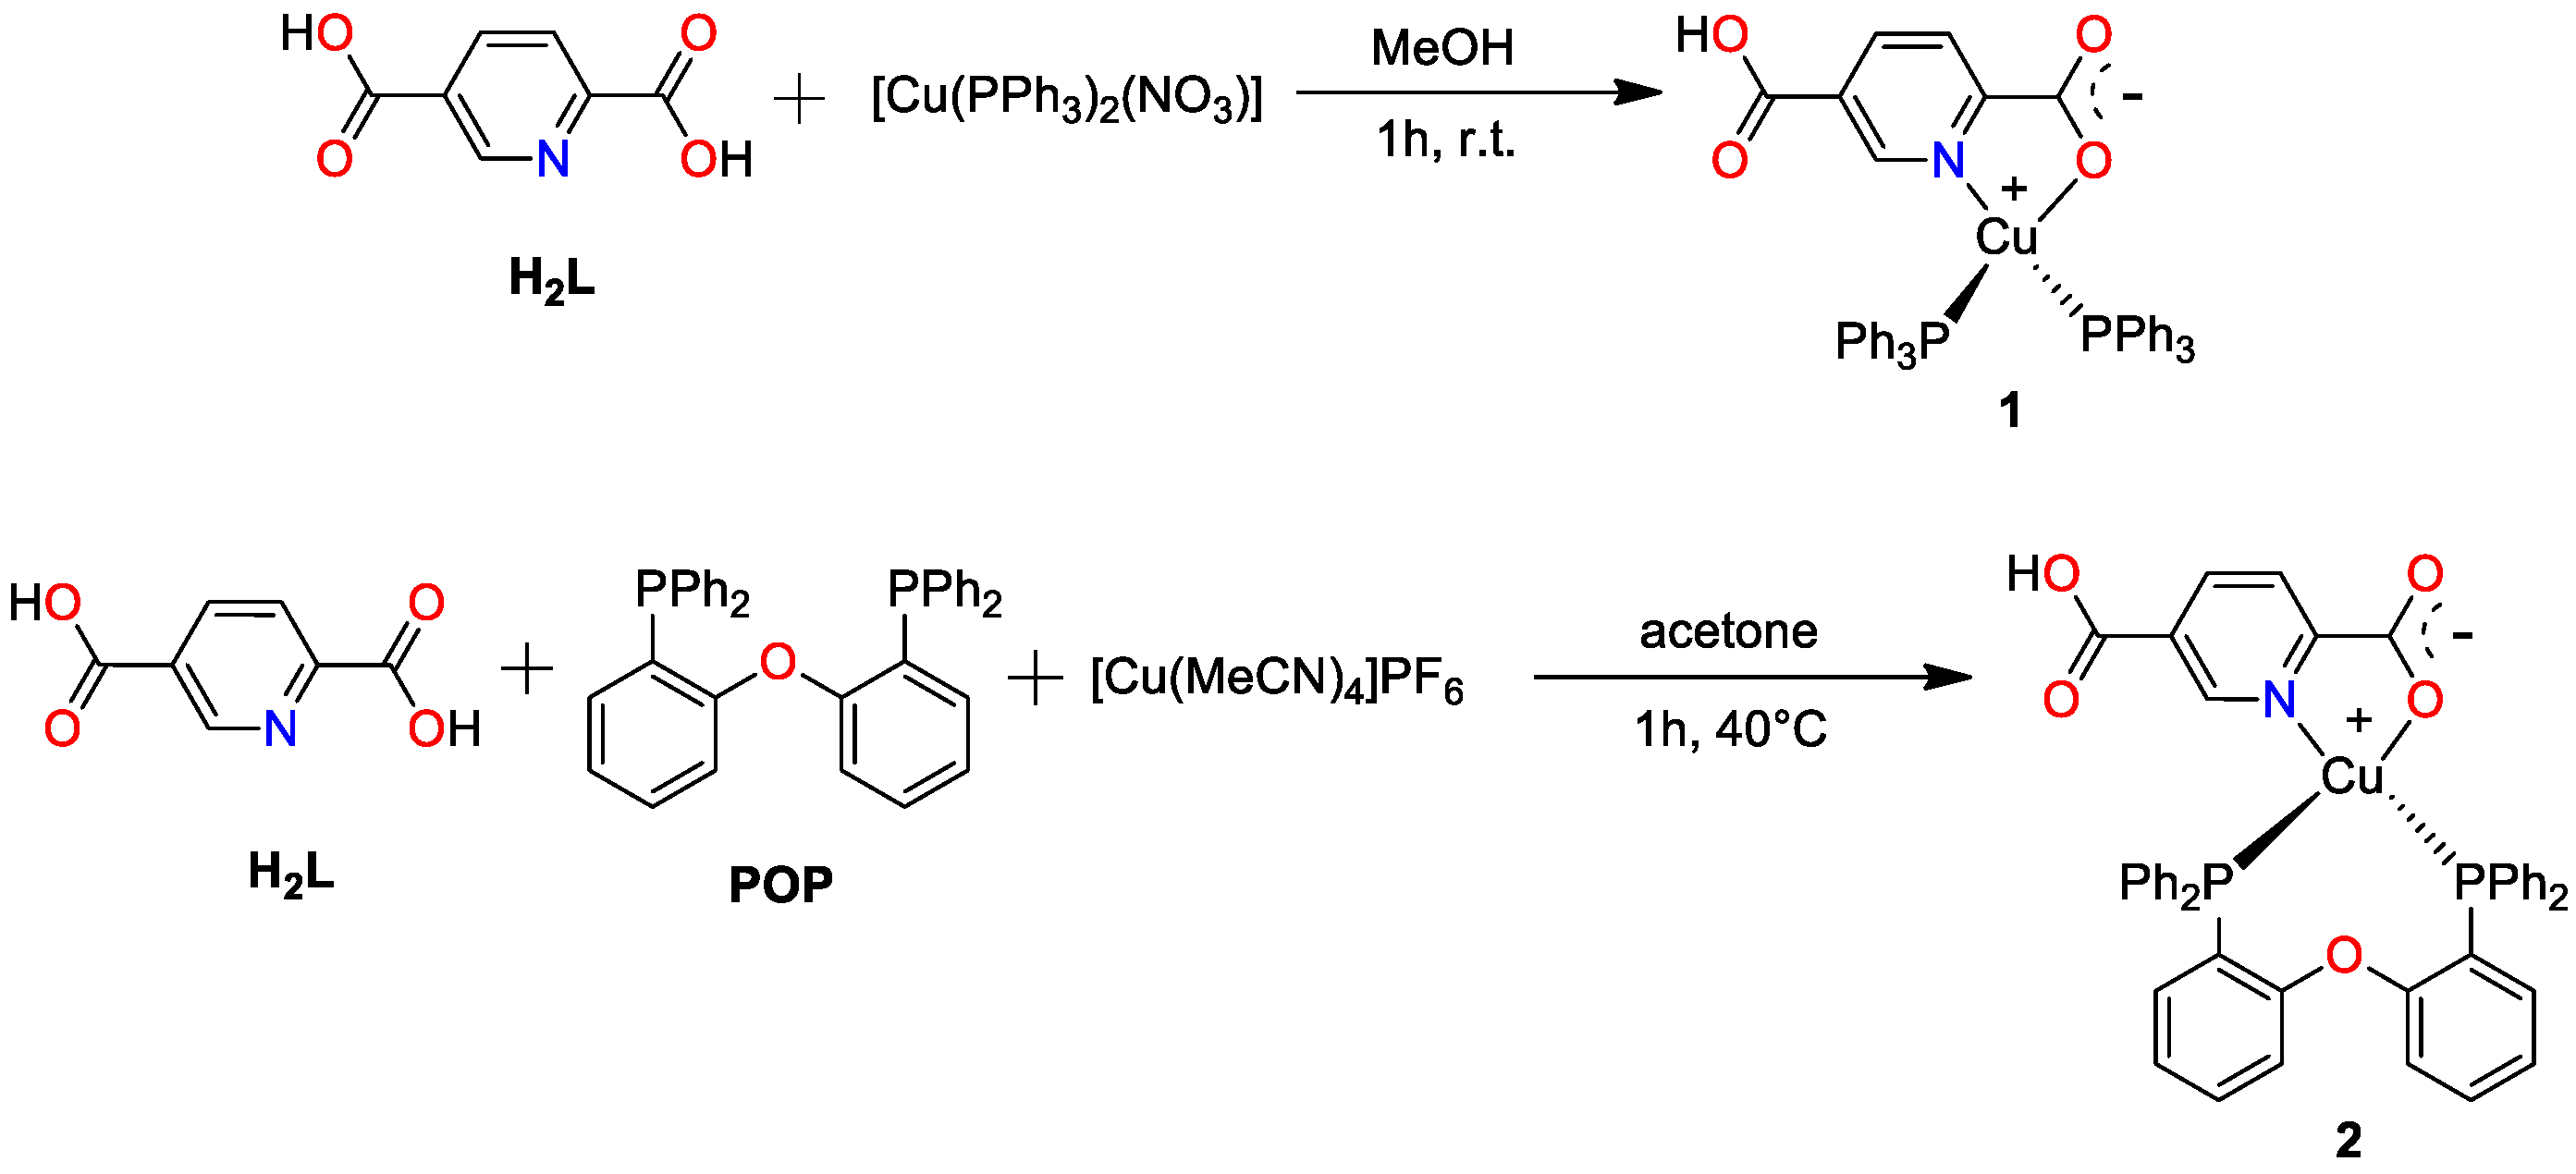
2.2. Preparation of [Cu(HL)(PPh3)2]·H2O (1)

[Cu(PPh3)2(NO3)] (38.9 mg, 0.060 mmol) was slowly added to a stirring solution of pyridine-2,5-dicarboxylic acid (H2L) (20 mg, 0.120 mmol) in MeOH (3 mL) to obtain a yellow solution, which was stirred for 1 h at ambient temperature and filtered. Yellow single-crystals were grown by diffusion of diethyl ether vapor into the solution. Yield (26 mg, 28%). IR (KBr); ν (cm−1): 3476 (w) 3052 (m), 1715 (w), 1597 (m), 1551 (w), 1479 (m), 1434 (s), 1265 (s), 1094 (m), 779 (m), 745 (s), 696 (s). The IR spectrum of 1 is given in Figure S1 (Supporting Information). 1H-NMR ((CD3)2SO, 400 MHz) δ 13.58 (bs, 1H,), 8.52 (s, 1H), 8.36 (dd, J = 1.94, 8.06 Hz, 1H), 8.16 (d, J = 8.06, 1H), 7.46–7.34 (m, 6H), 7.34–7.24 (m, 12H), 7.17 (t, J = 8.13 Hz, 12H) ppm. 31P-RMN ((CD3)2SO, 162 MHz) δ −1.47 (s, PPh3), ppm. 1H and 31P NMR spectra of the copper metal complex are shown in Figures S2 and S3 (SI). Microanalysis (%) for C43H36CuNO5P2: calculated: C 66.88, H 4.70, N 1.81%; found: C 67.36, H 3.97, N 2.20%.

2.3. Preparation of [Cu(HL)(POP)]·CH2Cl2 (2)

[Cu(MeCN)4]PF6 (67 mg, 0.180 mmol) and bis [2-(diphenylphosphine)phenyl]ether (POP) (97 mg, 0.180 mmol) were added to a hot stirring solution of pyridine-2,5-dicarboxylic acid (H2L) (30 mg, 0.180 mmol) in acetone (3 mL) for 1 h at 40 °C to obtain an orange solution. The reaction mixture was concentrated to 1 mL under reduced pressure whereupon pentane (3 mL) was added to obtain an orange microcrystalline solid. The product was filtered and dried under vacuum. The solid was dissolved in CH2Cl2 and recrystallized by vapor diffusion of pentane into the concentrated solution. Yield (55 mg, 36%). IR (KBr); ν (cm−1): 3525 (w), 3055 (w), 1722 (w), 1589 (w), 1566 (w), 1481 (w), 1463 (m), 1435 (s), 1261 (m), 1219 (s), 1093 (m), 837 (s), 739 (s), 692 (s). The IR spectrum of 2 is shown in Figure S4 (Supporting Information). 1H-NMR (CDCl3, 400 MHz) δ 8.72 (s, 1H), 8.27 (dd, J = 8.08, 1.76 Hz, 2H), 7.30–7.10 (m, 21H), 6.90–6.80 (m, 5H), 6.75–6.70 (m, 2H) ppm. 31P-RMN (CDCl3, 162 MHz) δ −14.83 (s, POP), ppm. 1H and 31P NMR spectra of the copper metal complex are given in Figures S5 and S6 (SI). Microanalysis (%) for C44H34Cl2CuNO5P2: calculated: C 61.94, H 4.02, N 1.64%; found: C 61.54, H 3.80, N 1.20%.

2.4. Crystallography

The single-crystal X-ray diffraction study of complex 1 was performed on an Agilent Technologies SuperNova diffractometer equipped with a CCD area detector (EosS2) utilizing Mo-Kα radiation (λ = 0.71073 Å) from a microfocus X-ray source and an Oxford Instruments Cryojet cooler. Data for compound 1 were collected at T = 100 K. The measured intensities were reduced to F2 and corrected for absorption employing spherical harmonics (CrysAlisPro) [31]. Structure solution, refinement, and data output were carried with the OLEX2 [32] program package utilizing SHELXTL [33] for the structure solution and SHELXL-2014 [34] for the refinement. Non-hydrogen atoms were refined anisotropically. C-H hydrogen atoms were placed in geometrically calculated positions through the riding model. The O-H hydrogen atoms in 1 were located from difference Fourier maps and refined with geometry and Uij restraints. Similarly, a suitable single crystal of complex 2, was mounted on a glass fiber. The crystallographic data were collected at T = 130 K on an Oxford Diffraction Gemini “A” diffractometer equipped with a CCD detector and using Mo-Kα radiation (λ = 0.71073 Å) and an Oxford Instruments Cryojet ES-75 cooler. The unit cell parameters were calculated with a set of three runs of 15 frames each (1° in ω). A double pass method of scanning was employed to exclude noise [31]. The collected frames were integrated utilizing an orientation matrix resolute from the narrower frame scans. The final cell constants were obtained by global refinement. The diffraction data were corrected for absorbance through an analytical numeric absorption correction, which employed a multifaceted crystal model based on expressions of Laue symmetry with equivalent reflections [35]. Structure resolution and refinement were performed using SHELXT-2014 [33] and SHELXL-2014 [34]. All non-hydrogen atoms were refined anisotropically. All hydrogen atoms were placed in geometrically calculated positions utilizing the riding model. Hydrogen-bonding interactions in the crystal lattice were determinate with the MERCURY program package [36]. Figures were elaborated with MERCURY [36] and DIAMOND [37].
1: C43H34CuNO4P2·H2O, MW = 772.21 g mol−1, monoclinic, space group P21/c, a = 16.3186(4), b = 12.5564(3), c = 18.3395(5) Å, α = 90, β = 108.186(3), γ = 90°, V = 3570.10(17)Å3, Dc = 1.437 g cm−3, T = 100 K, Z = 4, µ(MoKα) = 0.751 mm−1. Total 16,943 reflections, 8257 unique (Rint = 0.0234). Refinement of 8257 reflections (476 parameters) with I > 2σ(I) converged at final R1 = 0.0360 (R1 all data = 0.0446), wR2 = 0.0777 (wR2 all data = 0.0820), F(000) = 1600, gof = 1.048. CCDC 2102984.
2: C43H32CuNO5P2·CH2Cl2, MW = 853.10 g mol−1, monoclinic, space group P21/n, a = 11.2658(5), b = 24.1820(11), c = 14.4158(7) Å, α = 90, β = 92.107(4), γ = 90°, V = 3924.6(3)Å3, Dc = 1.444 g cm−3, T = 130 K, Z = 4, µ(MoKα) = 0.822 mm−1. Total 51,937 reflections, 10,008 unique (Rint = 0.0375). Refinement of 10,008 reflections (496 parameters) with I > 2σ(I) converged at final R1 = 0.0373 (R1 all data = 0.0529), wR2 = 0.0867 (wR2 all data = 0.0942), F(000) = 1752, gof = 1.011. CCDC 2103642.

2.5. Solar Cell Construction

The kit for the preparation of dye-sensitized solar cells was purchased from Solaronix, Switzerland. The DSSCs sensitized with [Cu(L)(PPh3)2] (1), [Cu(L)(POP)] (2) and the 1:1 dye combinations 1/N719, 2/N719 and N719 were fabricated according to previous literature reports with modifications [38,39]. For the preparation of the working electrodes, fluorine-doped tin oxide (FTO) glass plates (Solaronix TCO30-8, 3 mm thickness) were washed in consecutive ultrasonic baths filled with 1% soap solution, distilled water and ethanol (HPLC grade) for 10 min each. Finally, the electrodes were treated for 10 min under UV light (λ = 254 nm) in a peroxide solution in deionized water (5%). Then, eemploying the Deep Coating method, a compact layer of TiO2 was deposited on each FTO plate by immersion in a 40 mM aqueous TiCl4 solution (70 °C for 30 min) followed by washing with distilled water and ethanol. The glass plates with the TiO2 layers were sintered at 450 °C for 30 min using a muffle (Thermolyne SCIENTIFIC FB1410M), cooled to room temperature and washed with EtOH. Finally, mesoporous TiO2 was deposited using the Screen Print method on each FTO glass (0.2 cm2), whereupon the sintering process was repeated. After cooling, a second Dip Coating treatment was carried out, followed by a 1-hour treatment with UV radiation (λ = 254 nm). The electrodes were immersed in 0.3 mM solutions of either 1, 2 or N719 in a CH3CN/tert-butanol solvent mixture (50:50% v/v) for 24 h in the dark. For co-sensitization, the electrodes with 1 or 2 were immersed under the same conditions in 0.3 mM solutions of N719 in a CH3CN/tert-butanol mixture (50:50% v/v). The electrodes were finally rinsed with EtOH and dried. For the preparation of the counter-electrodes, FTO plates with holes of 0.5 mm diameter at the edge of the conductor side were used. The FTO glasses were cleaned following the above-described procedure used for the working electrodes. The platinum layer was deposited by Screen Printing over the entire FTO glass surface, followed by drying at 120 °C for 10 min. Then, the plates were immediately immersed for 1 min in a 10 mM solution of H2PtCl4 in isopropanol and dried at 120 °C for 5 min. Finally, a heat treatment at 400 °C (heating rate 1.2 °C/min) was applied for 15 min followed by cooling to 100 °C at a rate of 10 °C/min.
The working and counter-electrodes were joined by a thermoplastic (Meltonix 1170-25 DuPont Surlyn) of 60 μm thickness (treatment at 110 °C for ~5 min in an oven). Then, an electrolyte composed of 0.05 M I2, 0.1 M LiI, 0.5 M 4-tert-butylpyridine and 0.6 M tetrabutylammonium iodide dissolved in a mixture of acetonitrile and 3-methoxypropionitrile (50:50% v/v) was introduced into the DSSCs. Remainder air was removed by treatment under vacuum.
The performance of the DSSCs was examined by lateral irradiation of the cell anode using a light source AM 1.5 solar simulator (Oriel LCS-100) coupled with a potentiostat/galvanostat (Bio-Logic VMP-300). The incident light intensity was 100 mW cm−2 (1 sun), which was calibrated using a reference Si solar cell.

2.6. Computational Details

Hirshfeld surface analyses and fingerprint plots of 1 and 2 were created based on the crystallographic information files (CIFs) utilizing CrystalExplorer 17 [40]. The Hirshfeld surface (dnorm) was mapped over the range –0.5 to +1.5.
DFT calculations [41,42] for complexes 1 and 2 were carried out with the Gaussian 09 package [43]. The results were visualized with the GaussView software [44]. Minimum energy structures were computed and corroborated via frequency calculations (without imaginary frequencies). Transitions among the different orbitals were assessed with time-dependent density functional theory (TD-DFT) [45,46] using the M06 hybrid-meta-GGA functional [47] in combination with the 6-31G(d) [48] basis set for C, H, N, O, and P atoms and the DZVP [49] basis set for the Cu atom. The effects of a solvated environment were estimated with the integral equation formalism for the polarizable continuum model (IEF-PCM) and the implementation of the nonequilibrium solvation model [50]. The solvent contemplated for this analysis was ethanol.

3. Results and Discussion

A mixture of pyridine-2,5-dicarboxylic acid (H2L) and bis(triphenylphosphine)copper(I) nitrate in methanol stirred for 1 h provided [Cu(L)(PPh3)2]·H2O (1) after filtration. Similarly, Cu(MeCN)4PF6 and bis [2-(diphenylphosphine)phenyl]ether (POP) were combined in acetone at 40 °C to yield [Cu(L)(POP)]·CH2Cl2 (2) after workup and recrystallization in dichloromethane. In both complexes, the auxiliary phosphine ligands play an important role for the stabilization of the molecular structures [51]. The two compounds were fully characterized by elemental analysis, IR, UV–VIS and 1H-NMR spectroscopy, thermogravimetric analysis (TGA) and single-crystal X-ray diffraction (scXRD) analysis accomplished by inspection of the Hirshfeld surface analysis. In addition, the electrochemical properties of the compounds were studied by cyclovoltammetry.

3.1. IR and NMR Spectroscopic Analysis

The IR spectra for compounds 1 and 2 agree with the structures established by the X-ray determinations of single crystals. The spectra exhibit characteristic C-H aromatic stretching vibrations in the range 3055–3052 cm−1. The C=N stretching bands at 1554 and 1566 cm−1, respectively, are shifted to lower wavenumbers with respect to the uncoordinated ligand (1595 cm−1) due to the formation of the N→Cu bond (see Table 1, Figures S1 and S4). The bands around 1462–1433 cm−1 are typical for C=C stretching vibrations of aromatic rings. Calculation of the differences between the asymmetric, νas(COO), and symmetric, νs (COO), stretching bands of the ligands provides useful information about the binding mode of the carboxylate groups [52,53,54]. Complexes 1 and 2 display bands in the 1597–1589 cm−1 and 1265 cm−1 regions, with separations of 328–332 cm−1. Differences larger than 200 cm−1 suggest monodentate binding of the carboxylate group to the metal ion after proton displacement [52,53,54]. In addition, the complexes exhibit a band in the region of 1722–1715 cm−1, which corresponds to the C=O stretching mode of the second uncoordinated COOH function. The spectra also exhibit a broad absorption band in the range 3400–3500 cm−1 due to the hydroxyl group, which is red-shifted by ~45 cm−1 compared to free H2L in consequence of the intermolecular O−H∙∙∙O hydrogen bonding interactions observed in the solid state. Complex formation is further supported by bands at approximately 1434 and 1093 cm−1, which are characteristic for the P-CAr vibrations of the phosphine ligands [29,55,56,57,58].
The 1H NMR spectrum of 1 in DMSO-d6 (Figure S2) displays slightly broadened resonances for the hydrogen atoms of coordinated HL and PPh3. The resonances in the region 8.52–8.16 ppm are assigned to the three aromatic hydrogens of HL; meanwhile, the hydrogen attached to the free carboxylic acid group gives a characteristic broad singlet at 13.58 ppm [58]. The three signal sets in the region 7.46–7.12 ppm (30 H) are assigned to the phosphine ligands. The 1H NMR spectrum of 2 was recorded in CDCl3 (Figure S5) and displays five sets of signals in the region 8.72–6.70 ppm that integrate for the 31 aromatic hydrogen atoms of the compound. The 31P NMR shifts of complexes 1 and 2 are −1.40 ppm and −14.83 ppm, respectively.

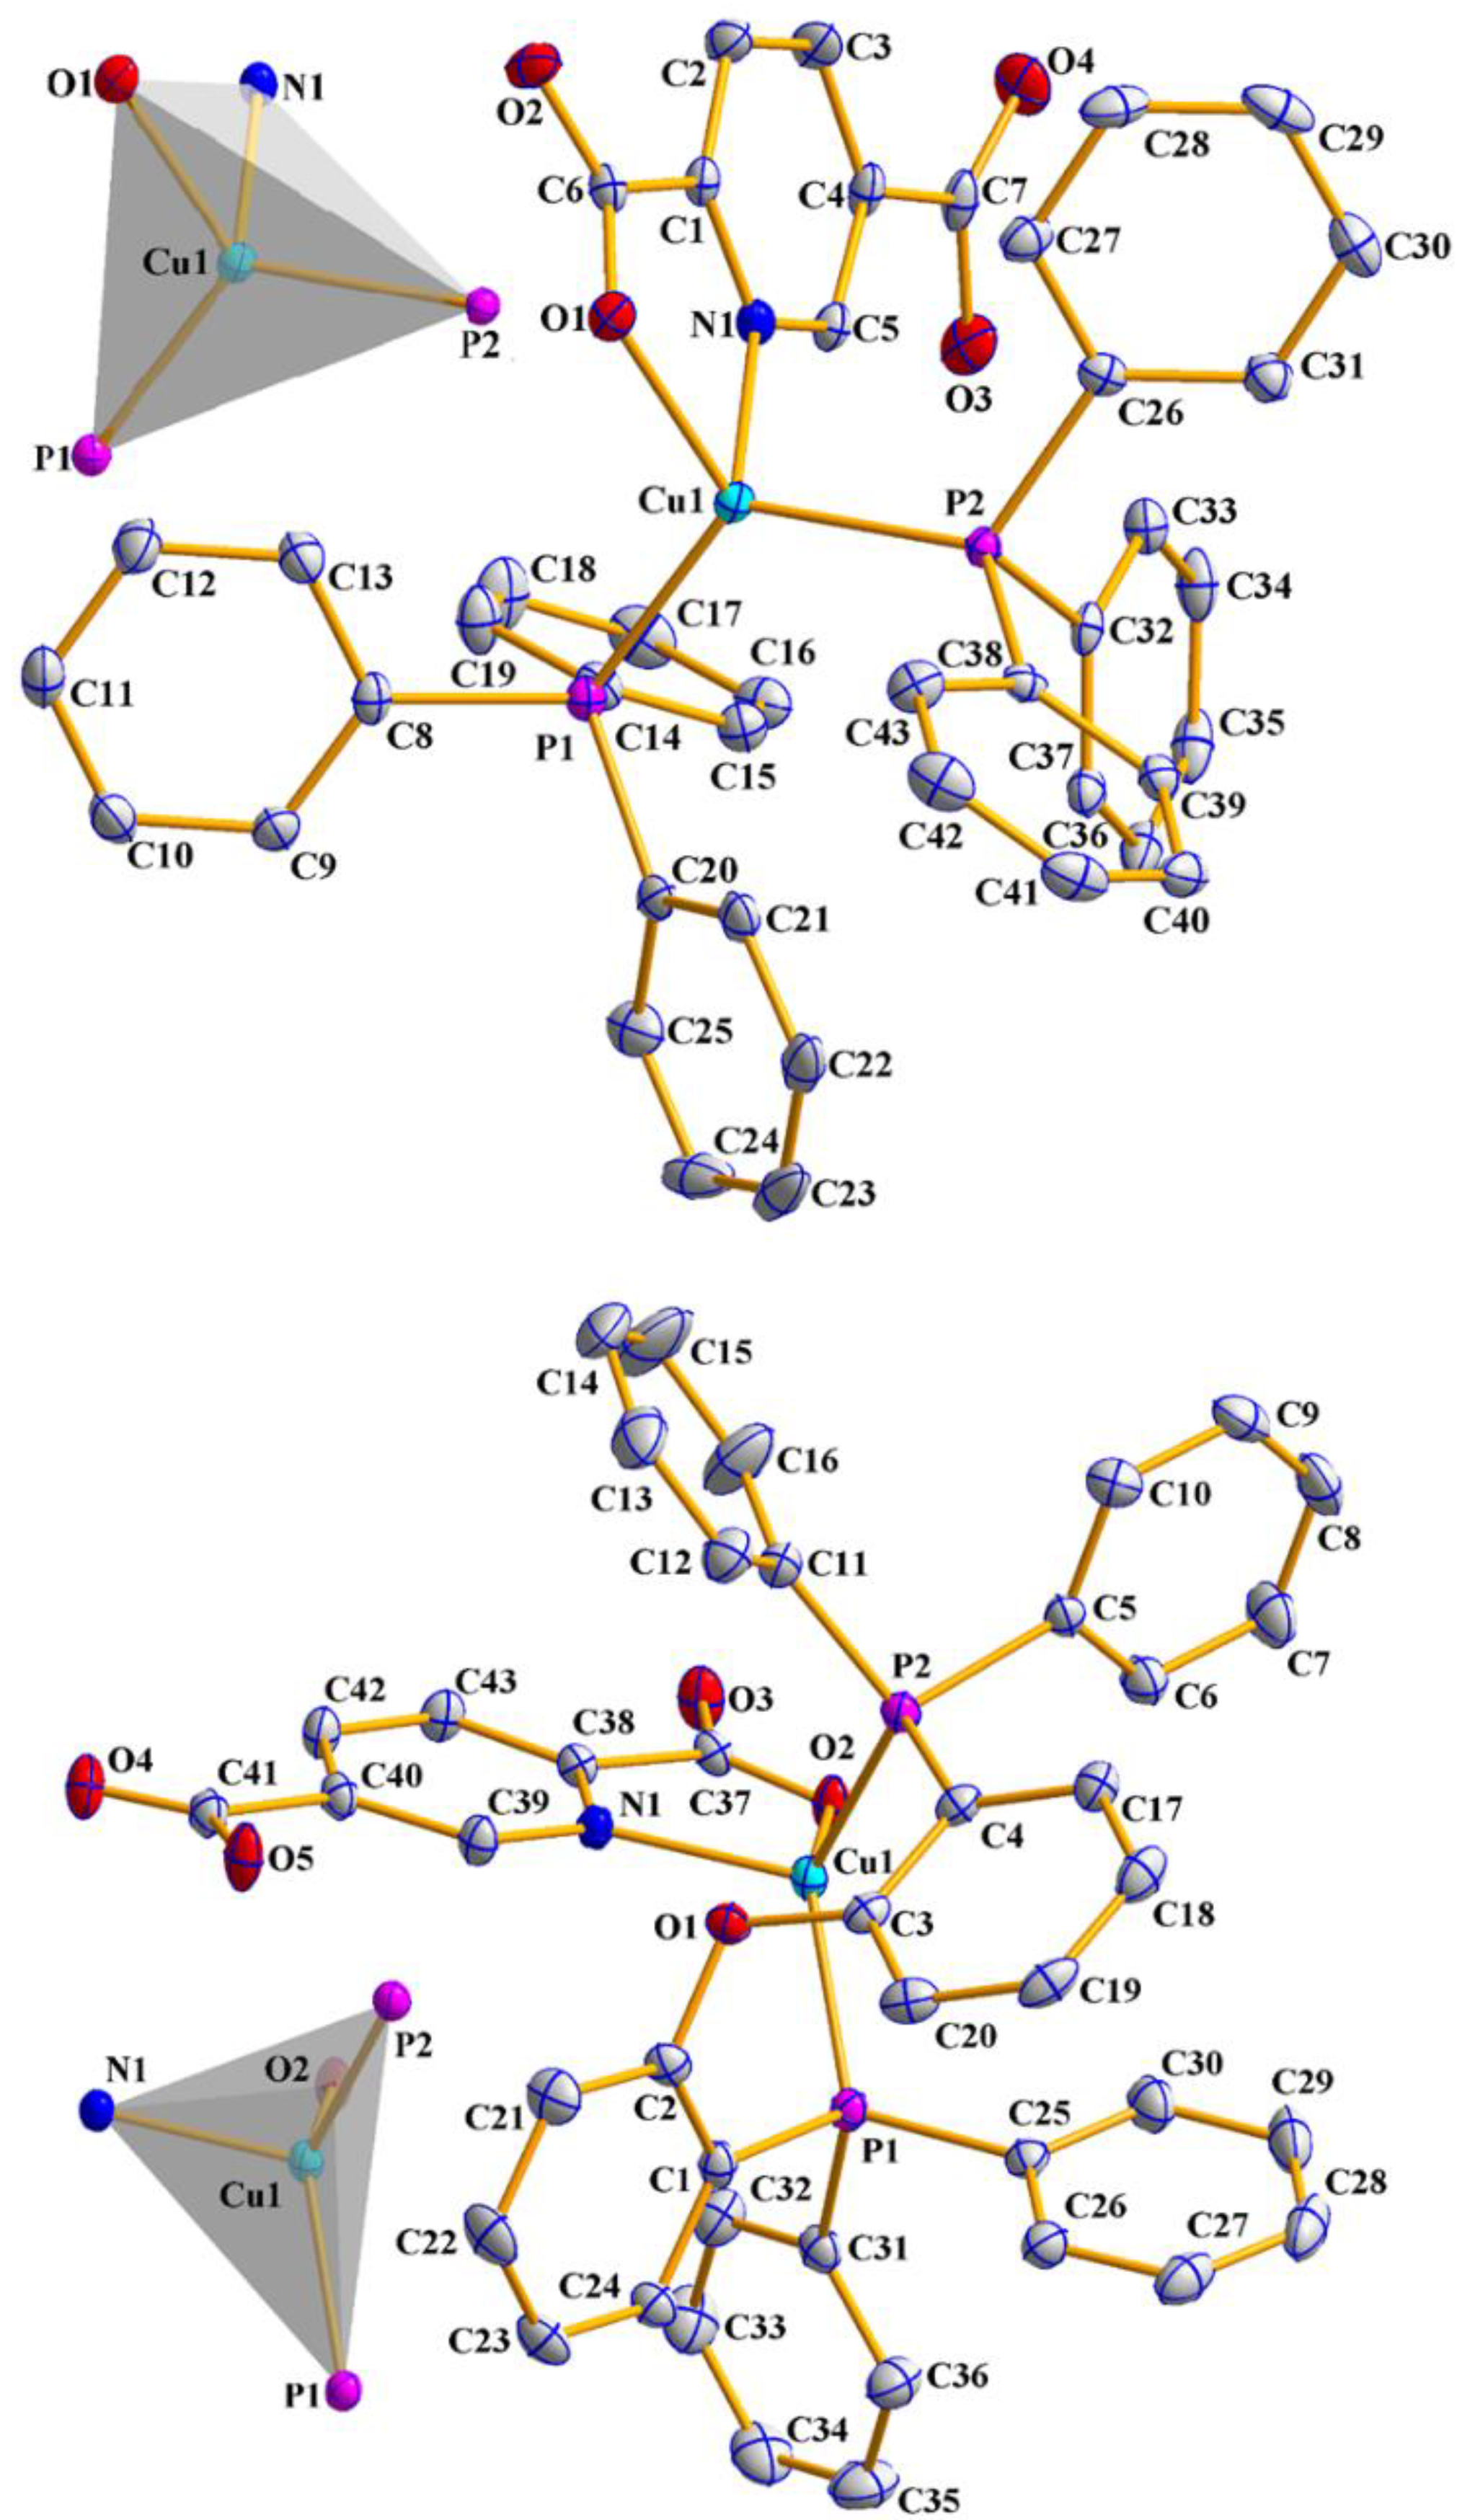
3.2. X-ray Crystallography

The molecular structures extracted from the solid-state structure analysis by scXRD for compounds 1 and 2 are depicted in Figure 1. Selected bond lengths and bond angles are given in Table 2. Hydrogen bonding geometries are listed in Table S1 (see SI).
[Cu(HL)(PPh3)2]·H2O (1) and [Cu(HL)(POP)]·CH2Cl2 (2) crystallized in the monoclinic crystal system with space groups P21/c and P21/n, respectively. The asymmetric units are composed of one copper(I) atom as metal center, one HL ligand, two PPh3 molecules in 1 and one POP ligand in 2, and an uncoordinated solvent molecule (H2O for 1 and CH2Cl2 for 2). In both samples, the Cu(I) atoms are embedded in NOP2 environments, resulting from coordination by the auxiliary phosphine ligands and the monoanionic HL ligand, which adopts a bidentate coordination mode upon binding with the pyridyl nitrogen and one oxygen atom from the carboxylate group. The C-O distances of 1.254(2)/1.255(2) Å for 1 and 1.279(2)/1.224(2) Å for 2 within the carboxylate groups indicate charge delocalization despite the monodentate coordination mode (Scheme 1), particularly in compound 1. In comparison, for the free COOH group the C-O distances are significantly distinct from each other in both complexes (1.309(3)/1.216(2) Å for 1; 1.310(2)/1.213(2) Å for 2). The five-membered Cu-N-C-C-O chelate rings observed in the molecular structures have Cu-N and Cu-O bond lengths in the range of 2.0483(15)–2.0974(15) Å and 2.0991(13)–2.1305(13) Å, respectively. The Cu-P bond lengths are in the range 2.2261(5)–2.2574(5) Å and the bond angles at Cu(1) vary from 79.03(5) to 122.07(4)°, with the smallest value corresponding to the O-Cu-N angle in the five-membered chelate ring formed in 1. The largest bond angle is formed with the sterically demanding POP ligand in 2. Despite the similar Cu-P bond lengths, the P−Cu−P bite angles vary significantly [121.40(2)° in 1 and 114.25(2)° in 2]. A comparison of the P−Cu−P bite angle with the bond angle calculated by DFT (M06/6-31G(d)+DZVP level) agrees well for 2 but shows a significant difference for 1 (≈4°). The intramolecular distance between the two phosphorus atoms in the complexes correlates with the observed bite angles, giving the largest value for 1 (3.9238(7) Å for 1 versus 3.7557(6) for 2). The N-C-C-O torsion angles in 1 and 2 are 11.8(2) and 0.4(2)°, indicating distortion from planarity of the five-membered chelate ring only in the first case.
The dihedral angles between the P–Cu–P and N–Cu–O planes are 88.71° and 88.16° for 1 and 2, respectively, illustrating that the geometries are only slightly distorted from ideal tetrahedral geometry. The distortion is also indicated by the τ4-values of 0.86 for 1 and 0.87 for 2 [59]. The molecular structures for 1 and 2 are closely related to the previously reported compound [Cu(HL1)(CH3CN)(PPh3)]PF6, where HL1 = 2,2,2-triphenyl-N-(2-pyridylmethyl)acetamide [59].
Inspection of the structural data also revealed a close Cu–OPOP contact in [Cu(L)(POP)] (2) (Cu1–O1 = 3.028(1) Å), see Figure S8. This distance is less than the sum of the van der Waals radii of Cu and O (3.30–3.36 Å) [60]. The interaction is also established by the observation of small variations of the N1-Cu1-O1/O2 and P1-Cu1-P2 bond angles compared to 1 (see Table 2).
Noteworthy is also the observation of an offset face-to-face intramolecular π-stacking interaction between two adjacent phenyl rings of the POP ligand in 2, see Figure S8 (centroid···centroid separation of 3.86 Å), which should play an important role for the stability of the complex. No intramolecular π-stacking contacts are present in 1. The difference presumably arises from the flexibility of the POP ligand.
A close inspection of the crystal structure of 1 reveals a 3D hydrogen bonded network (Figure S9 in Supplementary Materials), in which units of composition [Cu(L)(PPh3)2] are linked through O-H···O, Ow-H···OOC, Ow-H···Oc=o and C-H···O/Ow/Oc=o hydrogen bonds where Ow represents uncoordinated water molecules. The crystal structure is further stabilized by a series of additional C-H···π and π···π contacts between the components of the complex molecules (Table S1). All intermolecular distances and angles are within the range found in previously reported structures [29,54,55,56,57].
The crystal structure of complex 2 also exhibits a 3D hydrogen bonded network (Figure S10 in Supplementary Material), formed among [Cu(L)(POP)] units and CH2Cl2 solvate molecules through a series of O-H···O, C-H···O/Oc=o, C-H···Cl, C-Cl···π, and C-H···π interactions (Table S1). All intermolecular distances and angles are within the expected range [29,54,55,56,57,61,62].

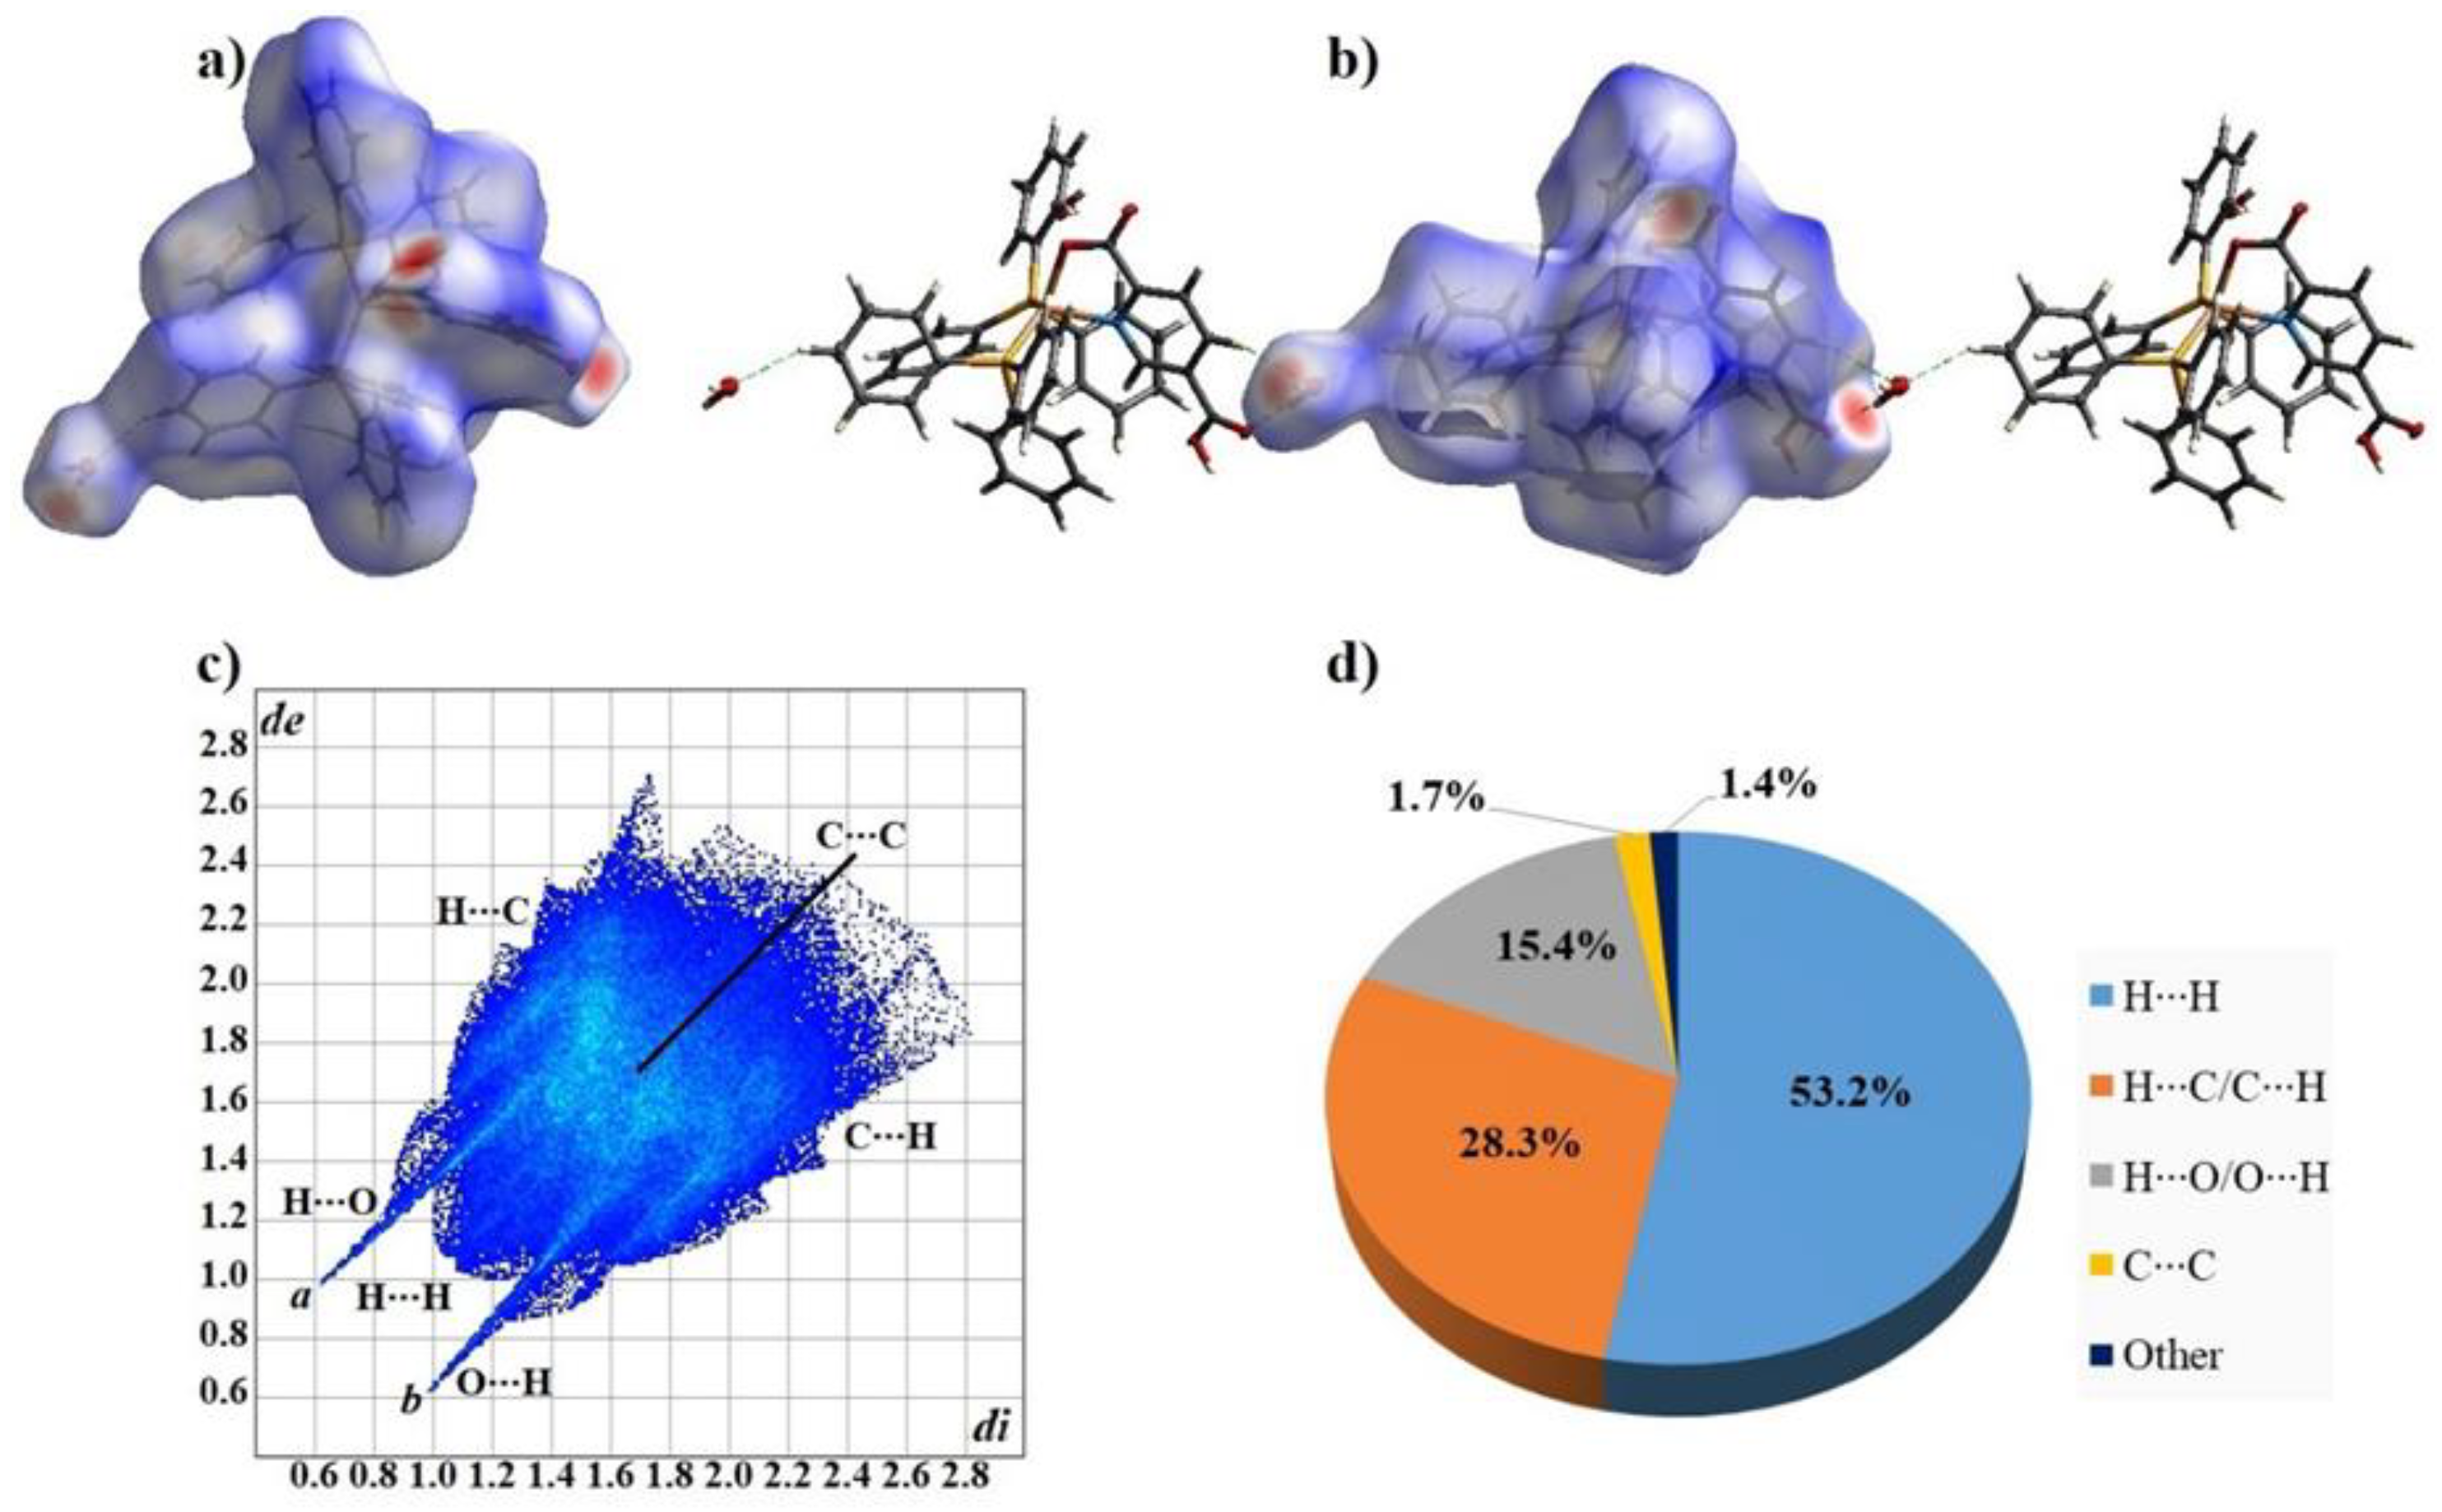
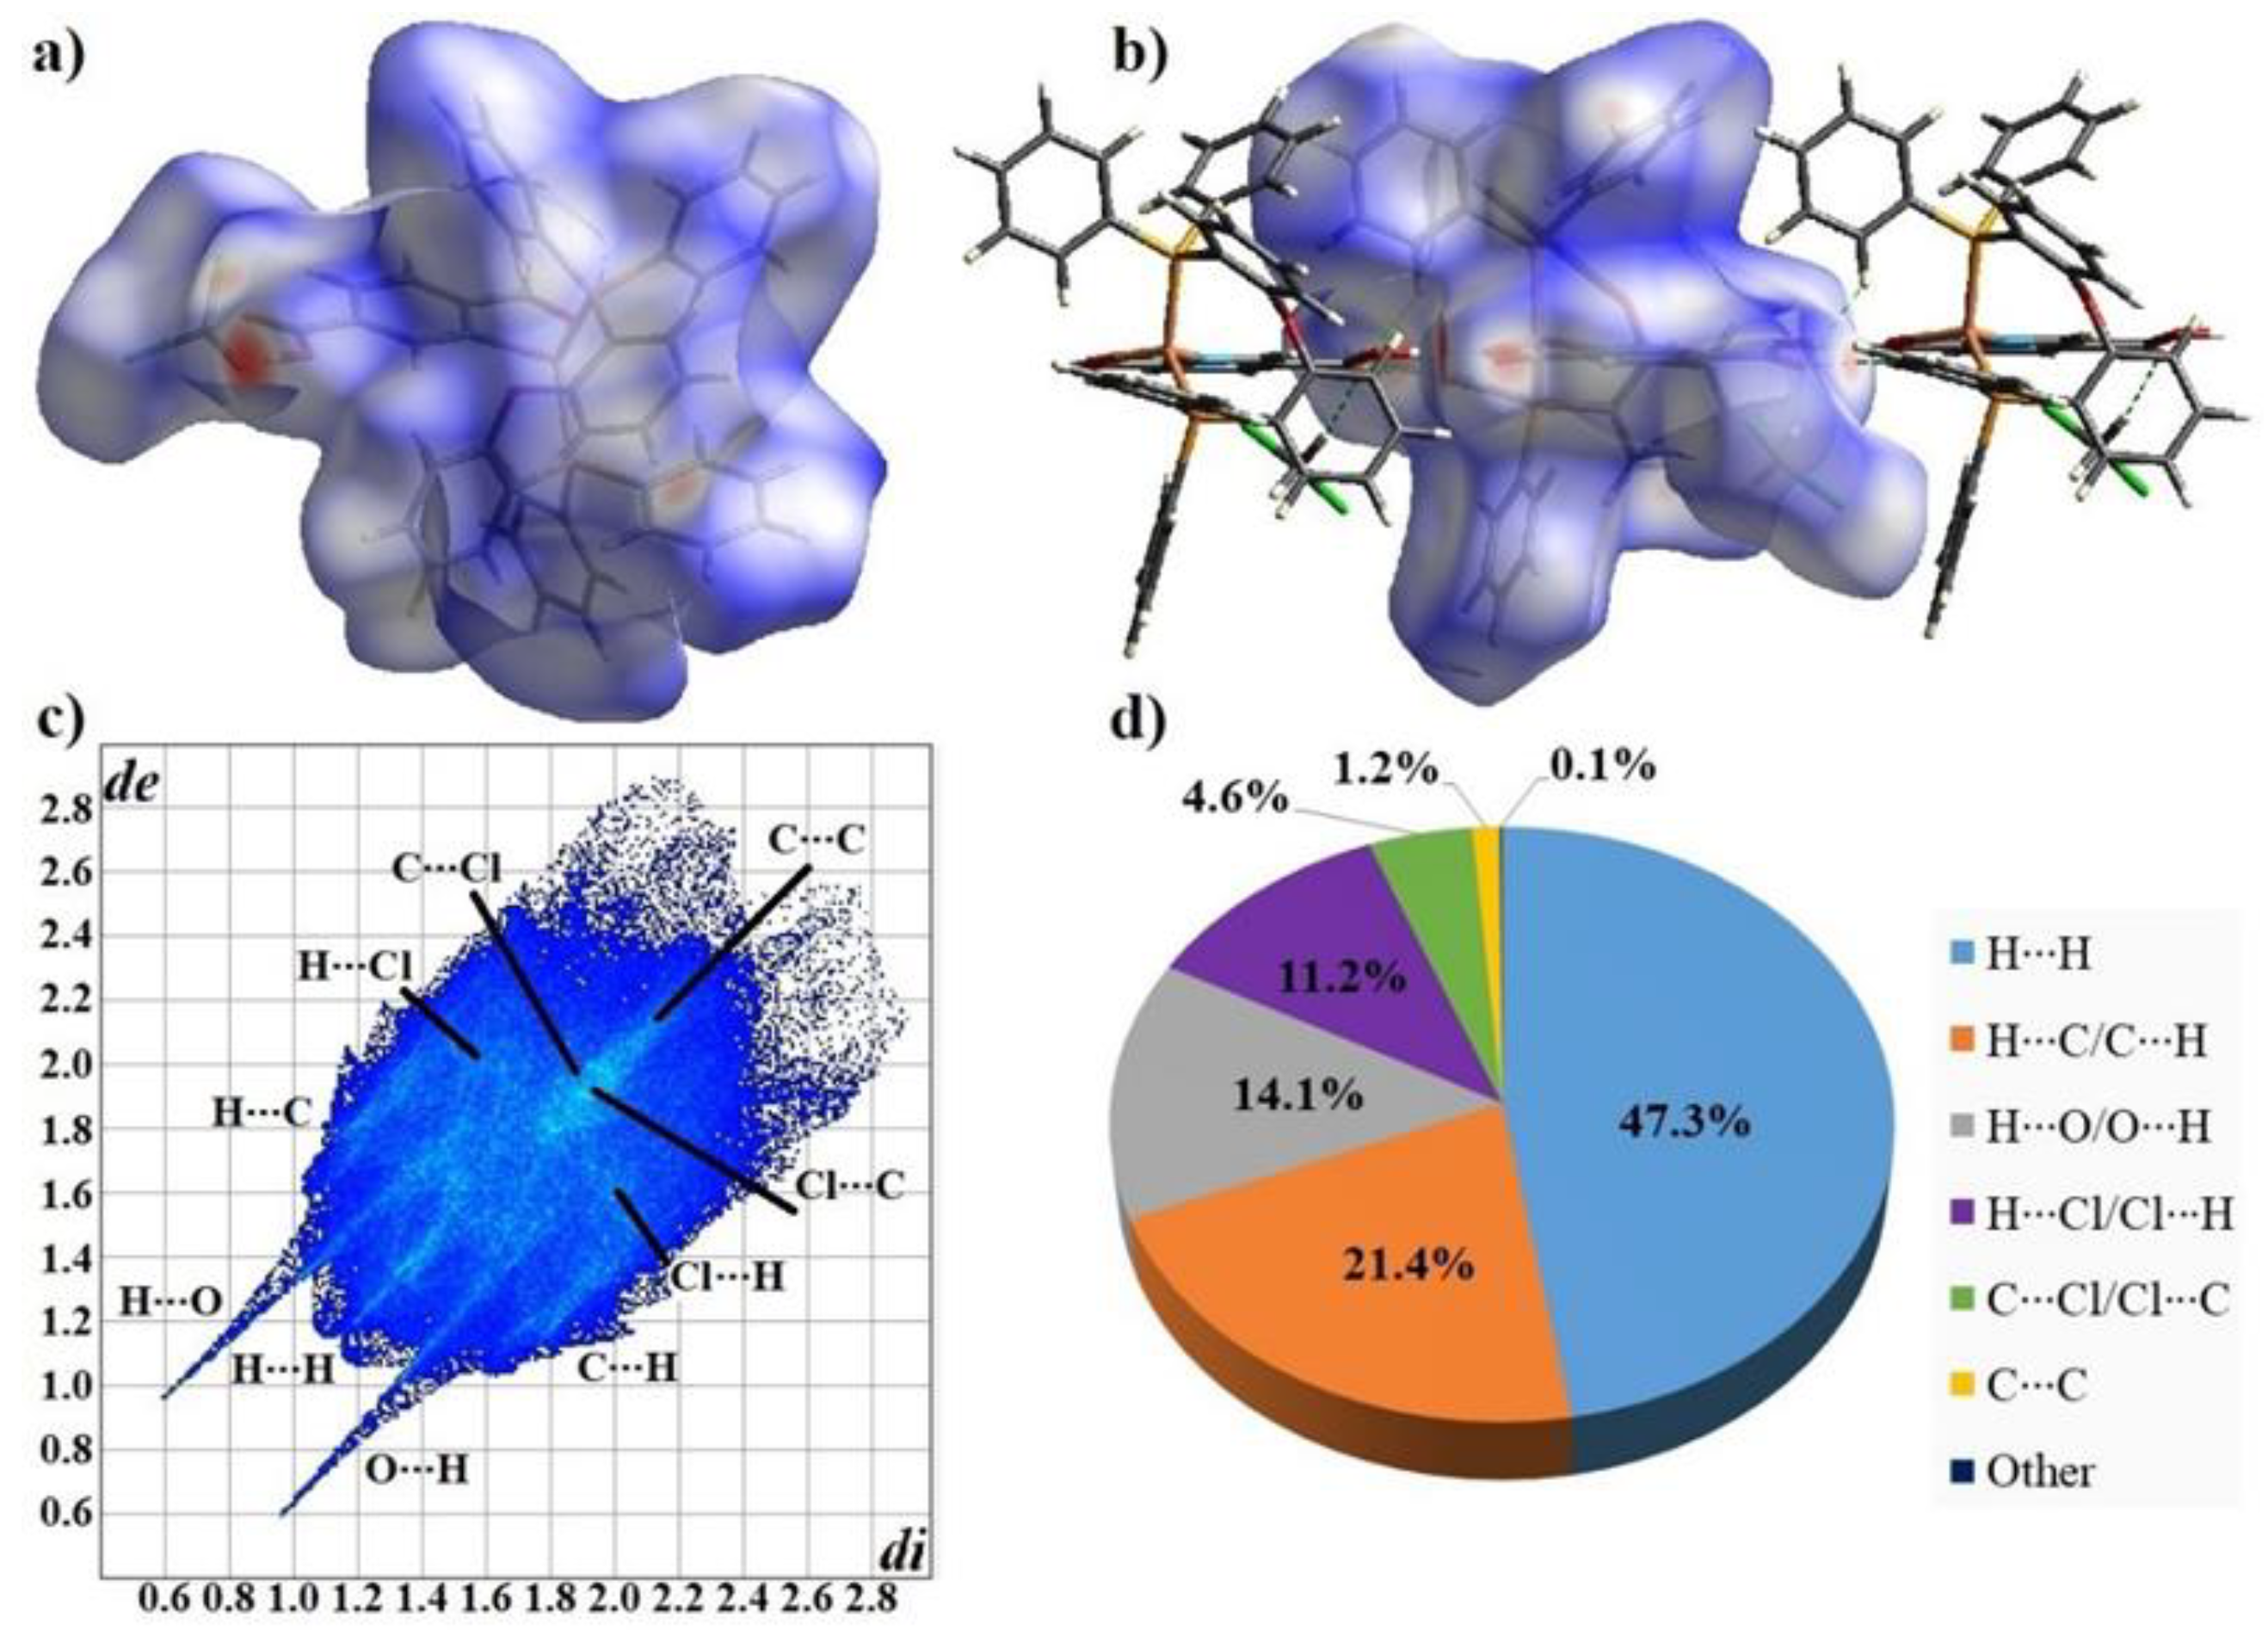
3.3. Analysis of the Hirshfeld Surface and Fingerprint Plots

To analyze the supramolecular connectivity for 1 and 2 further, Hirshfeld surface analyses were realized. Maps of the Hirshfeld surface over dnorm (−0.5 to 1.5) are shown in Figure 2a,b and Figure 3a,b. In the Hirshfeld surface maps, areas marked in blue reveal the longest contacts, while the depressions in red color are indicative of the zones of strong donor–acceptor interactions [63]. In the plot, the distances to the closest atom inside the surface (di) and to the closest atom outside the surface (de) are reported. The differences in the plots reveal variations in the packing modes of the structures.
The hydrogen bonds in complexes 1 and 2 are represented in the 2D fingerprint plots shown in Figure 2c, Figure S11, Figure 3c and Figure S12 respectively. The fingerprints around 1.8 (di, de) vary from a blue tone to a slightly green color and are associated with the C∙∙∙C contacts from π···π interactions [64]. The greenish coloration in the central part of the fingerprints corresponds to the stronger π···π contributions in the solid-state structures, illustrating that these are more relevant in 2, as corroborated by the short centroid–centroid distance of the π···π intramolecular contact discussed in the section of the molecular structure analysis. The contributions of the O-H∙∙∙O/Ow/Oc=o hydrogen bonds appear as well-defined elongated pegs in the fingerprint plots and are marked with labels a and b, which is usual for strong hydrogen bonds [64,65]. The more dispersed zones in blue color correspond mainly to C-H···O contacts.
Figure 2d and Figure 3d summarize the overall distribution of the individual intermolecular interactions based on the Hirshfeld surface analysis. The overall largest contributions of intermolecular contacts correspond to the diverse C···H/H···C (28.3–21.4%) interactions and van der Waals contacts (H···H, 53.2–47.3%). The contributions of O···H/H···O (15.4–14.1%) hydrogen bonds are less abundant. The π-interactions contribute with 1.2–1.7% for C···C contacts. In 2, Cl···H/H···Cl interactions contribute 11.2% and are characterized as “wings” in the upper left and lower right regions of the 2D fingerprint plots (see Figure 3c and Figure S12). Finally, C···Cl/Cl···C (4.6%) interactions are indicated by the green area in the central section of the 2D fingerprint plot (Figure 3c) and evidence Cl···π interactions contacts in 2.

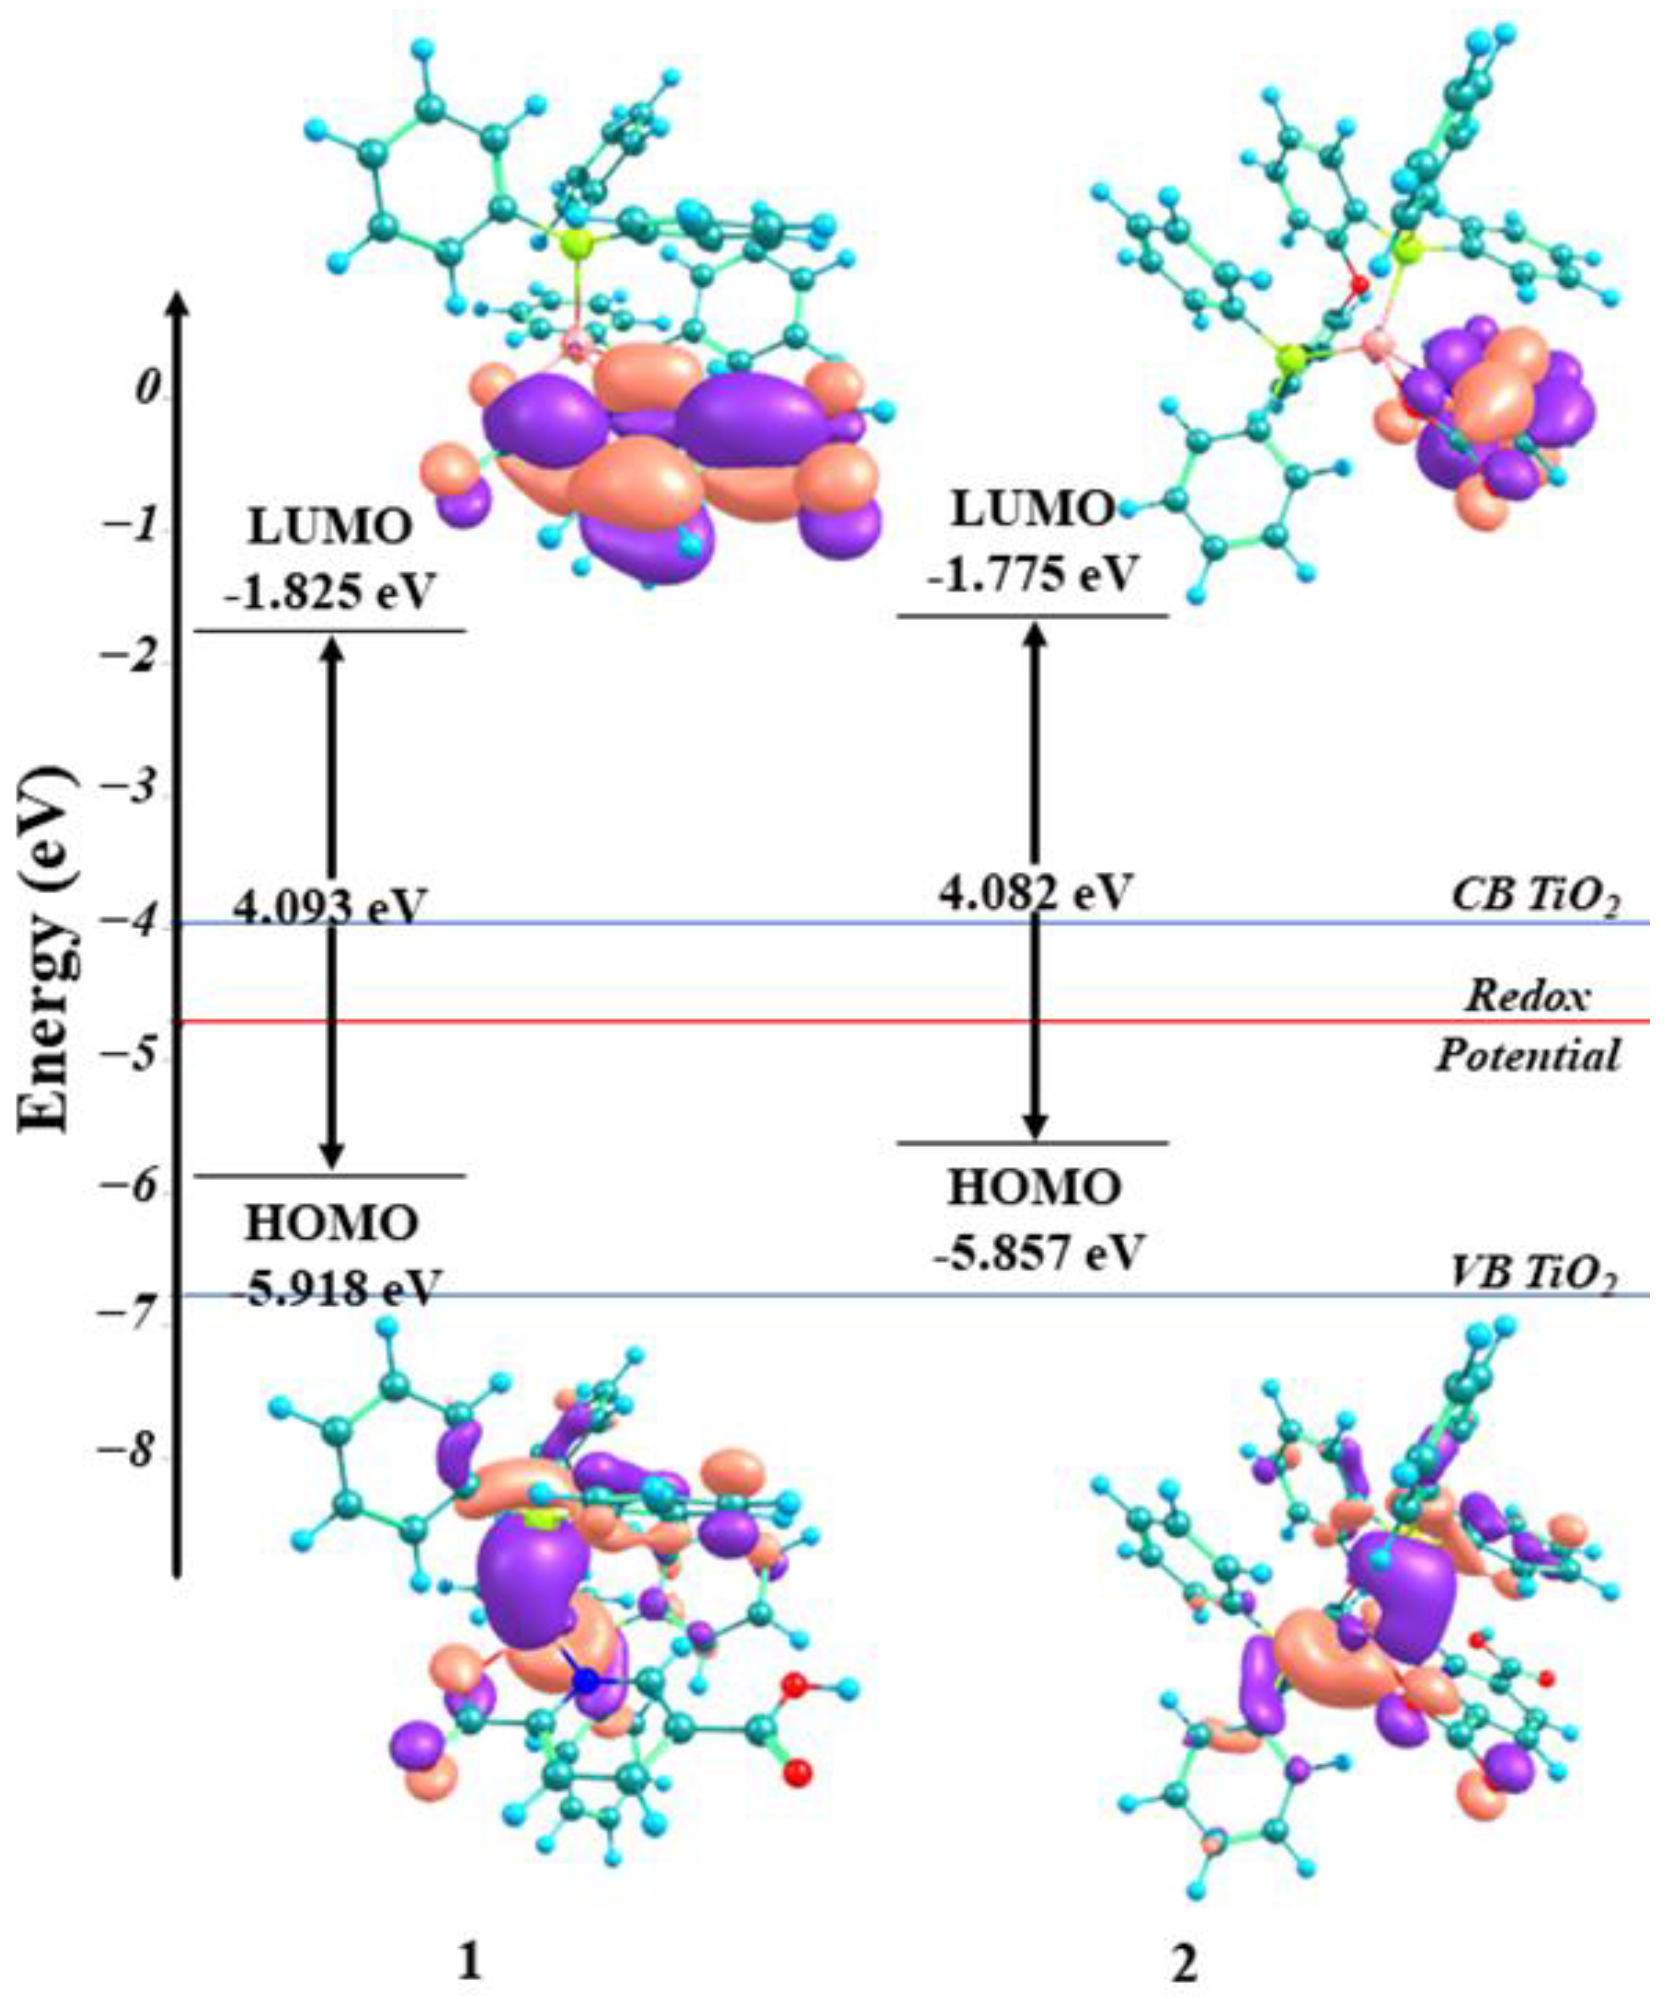
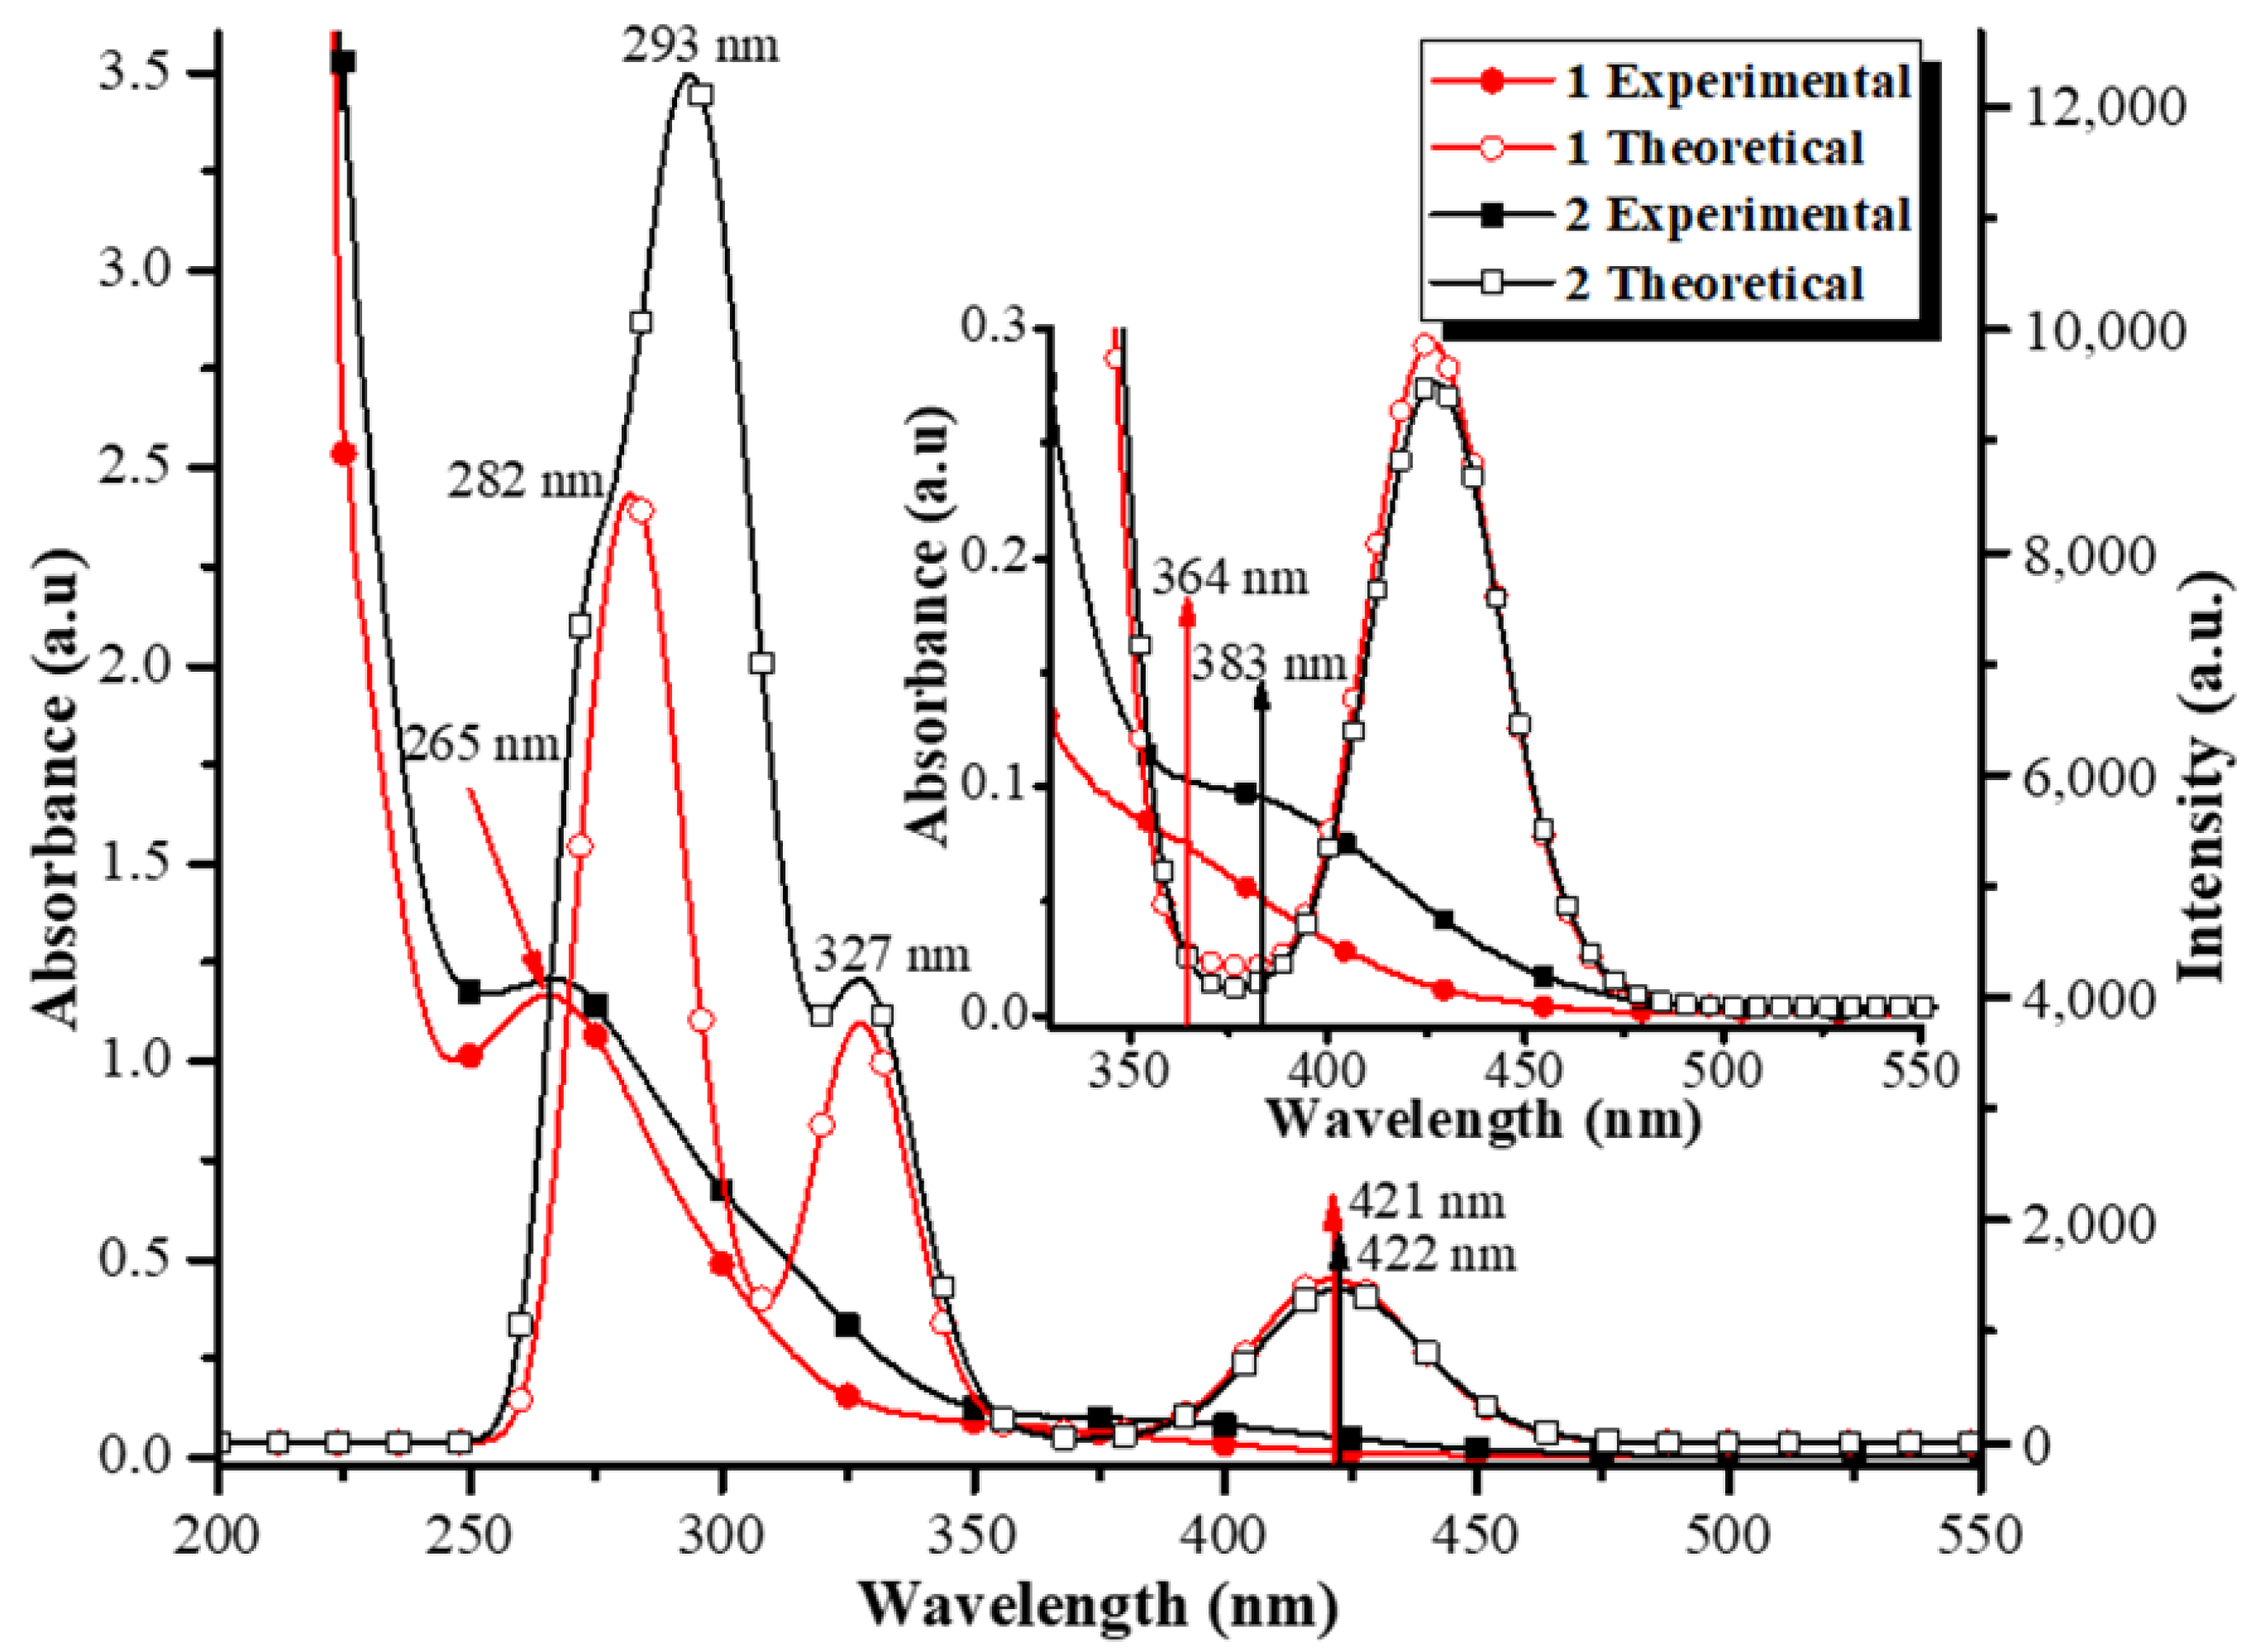
3.4. DFT Calculations and UV−Vis Absorption

The molecular structures and electronic properties of complexes 1 and 2 were calculated using DFT and TD-DFT methods. Calculations were performed using the M06 hybrid-meta-GGA functional with the 6–31 G(d,p) (for C, H, N, O and P atoms) and DZVP (for Cu) basis sets with an IEF-PCM of EtOH [41,42,43,44,45,46,47,48,49]. Ground-state geometries were optimized starting from the structures determined experimentally by X-ray crystallographic analysis. Notably, the calculated P−Cu−P angles are within 4° of the experimental values (see Table 2).
Molecular orbital theory enables explaining and predicting the chemical behavior of molecular systems. The energy gap between the highest occupied molecular orbital (HOMO) and the lowest unoccupied molecular orbital (LUMO) is a relevant parameter for determining the electrical and optical properties of organic and inorganic materials [54,55].
Considering that the electronic excitations crucial for the optical absorption processes are HOMO→LUMO transitions, it is important to introduce efficient charge-separated states with the HOMO localized on a donor unit and the LUMO on an acceptor unit. Isodensity plots of the frontier molecular orbitals (FMO) in 1 and 2 reveal that intramolecular charge transfer from HOMO to LUMO orbitals can occur (see Figure 4 and Figure S13). For 1, the energy of the highest occupied molecular orbital (EHOMO) is −5.918 eV and the energy of the lowest unoccupied molecular orbital (ELUMO) is −1.825 eV, giving ΔE(LUMO-HOMO) = 4.093 eV. Compound 2 has similar values with a ΔE(HOMO-LUMO) gap of 4.082 eV. As illustrated in Figure 4 and Figure S5, in both compounds the HOMO orbital is mainly concentrated at the copper metal center and the phosphorus atoms, while the LUMO electron density is distributed over the HL ligand. Additionally, Figure S13 shows that the LUMO + 4, LUMO + 5 and LUMO + 6 orbitals are spread over the entire phosphine ligands. Figure 4 shows that the HOMO and LUMO energy levels of complexes 1 and 2 are appropriate for the generation of DSSCs containing TiO2. The LUMO levels lie above the conduction band of the TiO2 semiconductor (−4.40 eV), indicating efficient electron injection, and the HOMO energy levels lie below the I/I3 redox potential of the electrolyte (−4.60 eV), which can be further improved (about −0.3 V) by adding additives such as 4-tert-butyl pyridine (TBP) to the I/I3− redox electrolyte, providing sufficient driving force for dye regeneration [66].
Figure 5 shows the experimental and calculated UV–Vis absorption spectra for 1 and 2. The spectra were acquired from a 6.0 × 10⁻⁵ M solution in EtOH at room temperature and the theoretical spectra were calculated at the TD-DFT/M06/6-31G(d) + DZVP level of theory. The results of the TD-DFT calculation indicate three major transitions for complex 1 (Figure 5 and Table S2), two in the UV region at 287/279 nm (f = 0.0406/0.0266) and 328 nm (f = 0.0367) corresponding to the HOMO→LUMO + 4/LUMO + 5 and HOMO→LUMO + 1 transitions [MLCTCu→L/(PPh3)2)/LLCT(PPh3)2→L/π→π*(PPh3)2→(PPh3)2) and MLCT Cu→L/(PPh3)2/LLCT(PPh3)2→L/π→π* (PPh3)2→(PPh3)2], respectively, and one in the visible region at 421 nm (f = 0.0145) for the HOMO→LUMO [MLCTCu→L/LLCT(PPh3)2→L] excitation. These transitions imply that intramolecular charge transfer takes place [29,67,68,69], which is consistent with the broad low-intensity band observed in the experimental UV–VIS spectrum at 364 nm (ε = 1266 M−1 cm1, see Figure S14). The experimental band centered at 265 nm (ε = 19,450 M−1 cm−1) was assigned to π→π* transitions having LLCT/MLCT character (HOMO→LUMO + 1/LUMO + 4/LUMO + 5).
The calculated UV–VIS spectrum of 2 displays bands similar to 1, of which the most intense band at 293 nm (f = 0.0411) is due to the HOMO→LUMO + 4 transition having MLCT(Cu→POP/L)/LLCT(POP→L)/π→π*(POP→POP) character. This excitation is consistent with the broad band centered at 265 nm (ε = 20,166 M−1 cm−1, see Figure S14) in the experimental spectrum. The calculated spectrum displays two additional bands at 327 and 422 nm, which are assigned to HOMO→LUMO + 1 and HOMO→LUMO transitions, respectively. The band at 422 nm can be related to the broad experimental absorption band found at 383 nm (ε = 1600 M−1 cm−1, Figure S14) and has MLCT(Cu→L)/LLCT(POP→L) character. A detailed assignment of the TD-DFT calculations in terms of FMO is included in the Supplementary Data (Table S2).

3.5. Electrochemistry

The electrochemical properties of the heteroleptic complexes 1 and 2 were investigated at 298 K for solutions in EtOH and CH2Cl2, respectively, by cyclic voltammetry (CV) using tetrabutylammonium hexafluorophosphate, (nBu4N)PF6, as supporting electrolyte. The observed processes are summarized in Table 3 and the CVs are shown in Figure S15. Both compounds exhibit quasi-reversible oxidation processes in the range 0.70–0.51 V, which is attributed to the Cu(I)/Cu(II) oxidation process. When scanning beyond +1.0 V, additional oxidation waves appear, for which the process is no longer reversible [70]. These oxidation potentials occur within the range 1.47–1.56 V and can be assigned to the oxidation of the phosphine ligands (Figure S15). The highest potential is observed for the complex with POP, indicating higher structural rigidity. For 1 and 2, irreversible processes are observed at −1.89 or −1.94 V and are assigned to a reduction process of the N^O-ligand. Based on the above-mentioned reduction potentials, the HOMO and LUMO energy levels were calculated by using equation 1 [71].
HOMO (or LUMO) (eV) = −4.8 − [(Epeak potentialE1/2 (Ferrocene)]
where, Epeak potential corresponds to the maximum and minimum peak potential and E1/2 is the halfwave potential of ferrocene (0.42 V), which was used as reference. The resulting values for the HOMO orbitals (−5.85 and −5.94 eV) are in good agreement with the values obtained by the DFT calculations (−5.92 and −5.86 eV). Due to the irreversibility of the redox process, it was not possible to obtain a good approach for the LUMO values.

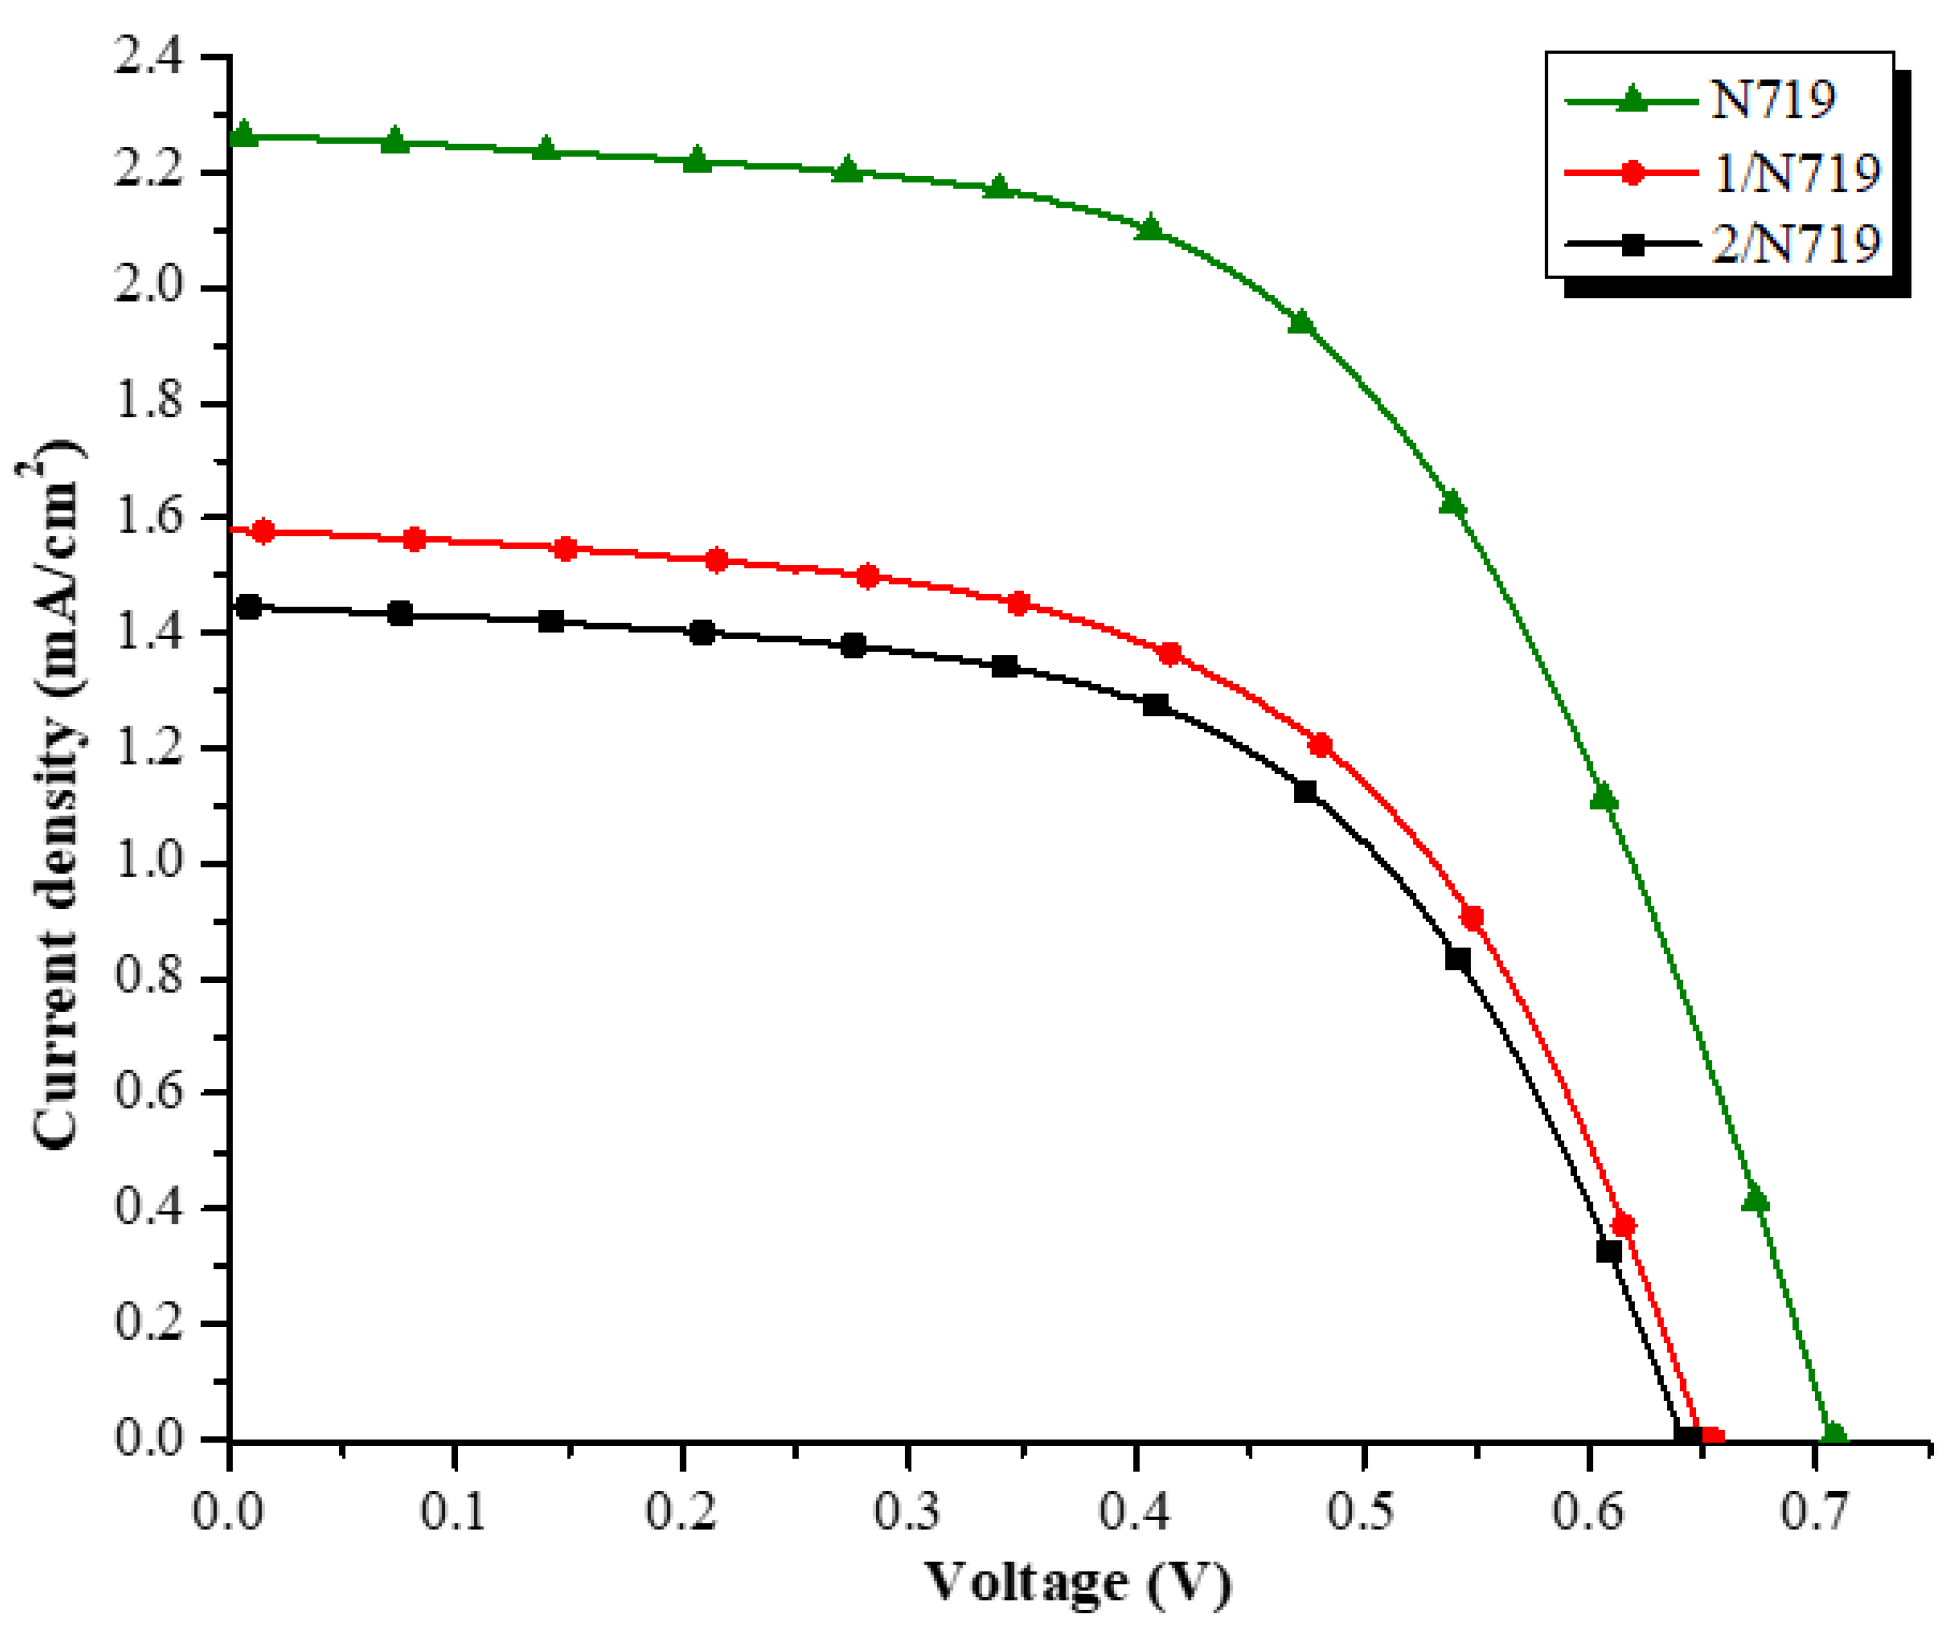
3.6. Application in DSSCs

The UV–visible absorption spectra of the free ligand H2L and their respective Cu(I) complexes were measured in EtOH at room temperature (Figure S14). Compounds 1 and 2 display a metal-to-ligand charge transfer (MLCT) absorption band between 350 and 450 nm. Compared with the commercially available ruthenium complex N719, which absorbs in the 330–450 nm range [11,19], compounds 1 and 2 could accomplish the low wavelength region of absorption (ultraviolet and blue-violet) [72] when used as co-sensitizer in photovoltaic devices for DSSCs. To verify this hypothesis, three solar devices were assembled; one was sensitized only with N719 and used as control, and two were co-sensitized with a 1:1 (w/w) mixture of 1 or 2 and N719. It is important to note that the amount of N719 in the co-sensitized devices was only half than that employed in the control device. The current–voltage (JV) characteristics of the DSSC devices based on the N719, 1/N719 and 2/N719 photoanodes are shown in Figure 6 and the corresponding cell performances are summarized in Table 4. The values of Jsc, Voc and η are in the order of N719 > 1/N719 > 2/N719, respectively, which is attributed to the fact that N719 and the Cu(I) complexes are attached to the TiO2 surface and contributed effectively to electron injection into the conduction band of TiO2. The co-sensitization of N719 and the [Cu(N^O)(P)2] complexes generates a synergic effect on light harvesting and electron collection in TiO2. As shown in Table 4, under standard global AM1.5 solar irradiation conditions the electrode yield (ηrel) of the co-sensitized solar cells 1/N719/TiO2 and 2/N719/TiO2 decreases 36.38% and 41.39%, respectively, which is less than the maximum reduction expected due to the presence of only half the amount of N719 (50%). In addition, there is also almost no expense of the open circuit voltage (Voc). These results suggest that co-sensitization of TiO2/N719 photoelectrodes with 1 and 2 are an option to reduce the amount of ruthenium dye, saving costs without a drastic impact on the efficiency of the DSSCs.

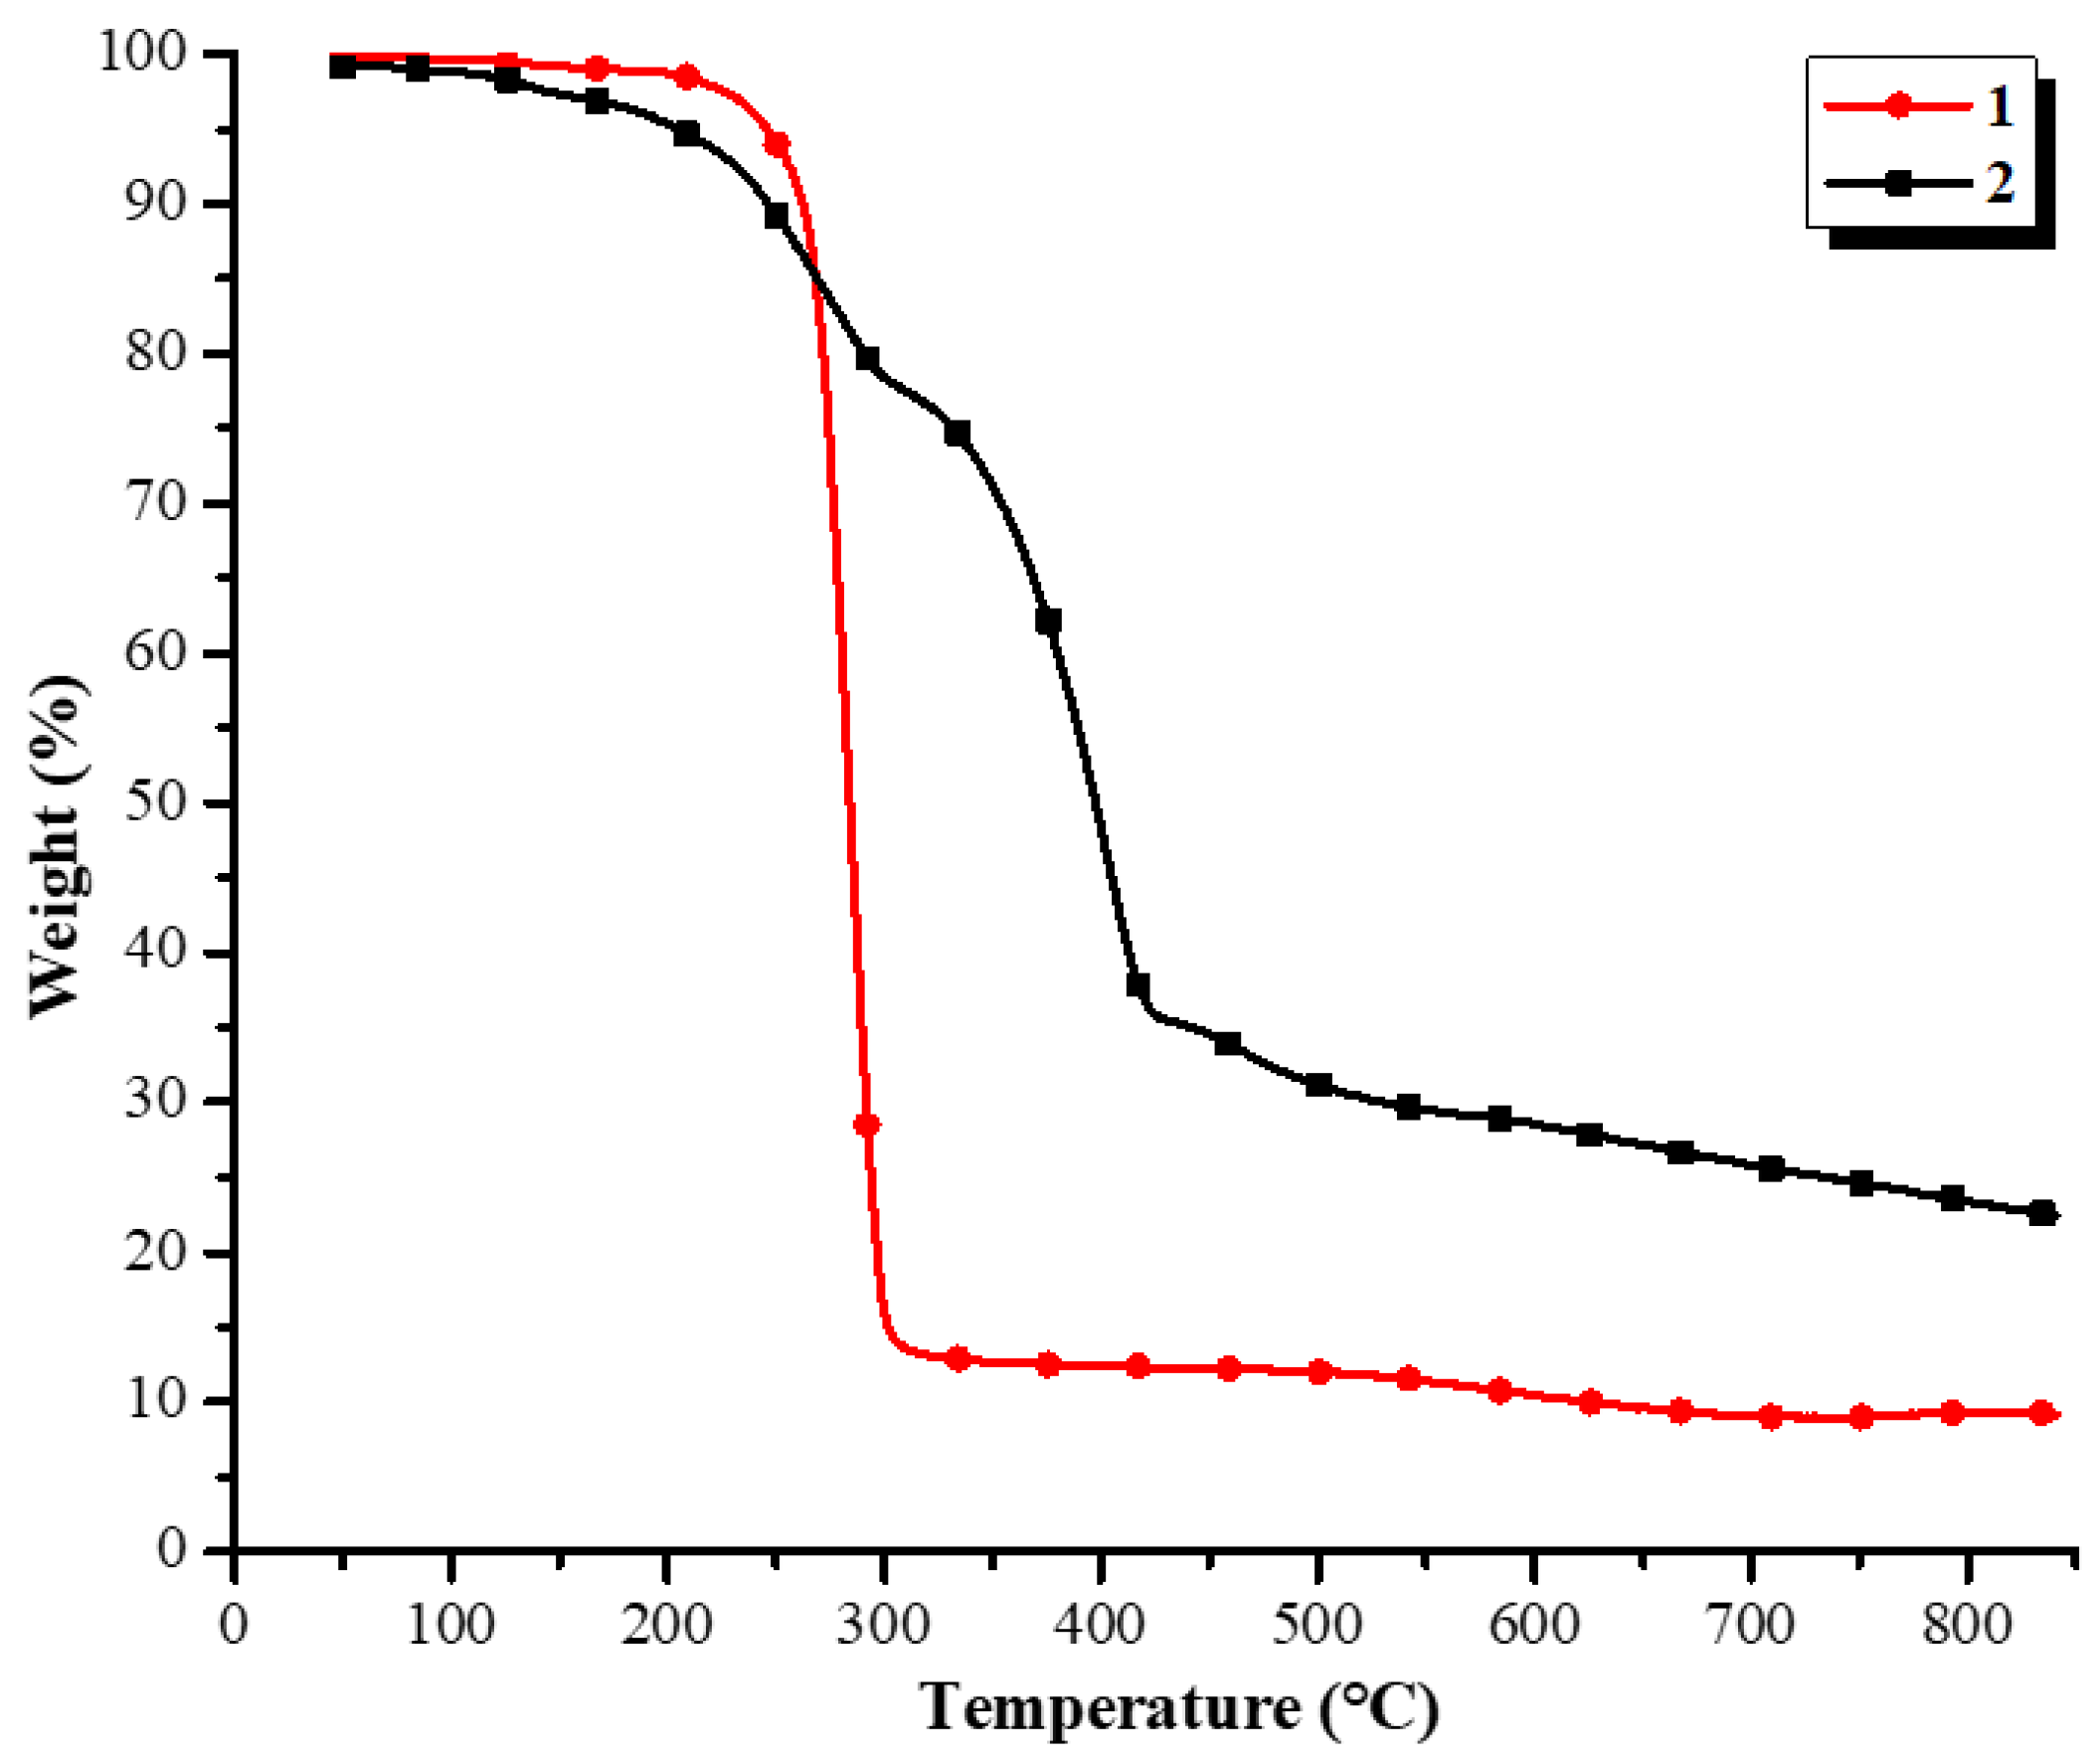
3.7. Thermal Analysis

To examine the thermal stability of 1 and 2, thermogravimetric analyses (TGA) were performed under N2 for crystalline samples with a heating rate of 10 °C min−1 from ambient temperature up to 800 °C, as shown in Figure 7. Complexes 1 and 2 were stable up to ~200 °C and ~130 °C, respectively. The TGA curve of compound 1 reveals a single main region of weight loss initiating at ~200 °C and achieves completeness at ~300 °C. Apparently, the weight loss corresponds to the simultaneous sublimation/decomposition of the lattice H2O molecule and organic ligands (HL and PPh3), since the observed weight loss (86.9%) is close to the calculated value (85.5%). According to the TGA curve, the decomposition of compound 2 occurs in two steps. The first process initiates at 137 °C with completeness at 275 °C and corresponds to the release of the lattice CH2Cl2 molecules and the POP ligand. The observed weight loss (21.0%) is in good agreement with the calculated value (20.8%). The second step (found 42.6%; theoretical, 41.9%) in the range of 320−435 °C is attributed to the loss of ligand HL. According to previous studies [54,73], the residual mass after decomposition in cuprous complexes is Cu2O for 1 (found 17.41%; calcd. 18.51%) and Cu2O + CuO for 2 (found 23.33%; calcd. 26.13%).

4. Conclusions

Two novel copper(I) compounds derived from pyridine-2,5-dicarboxylic acid as chelating ligand and auxiliary phosphine were synthesized and characterized by elemental analysis, single-crystal X-ray crystallography, and NMR, FT-IR, and UV–Vis spectroscopy. Electrochemical, spectroscopic, and computational methods were used to understand the electronic characteristics of these compounds. Single-crystal X-ray diffraction revealed that complexes 1 and 2 exhibit slightly distorted tetrahedral CuNOP2 coordination environments with significantly different P-Cu-P angles. The reduction of the P-Cu-P angles from 1 to 2 introduces a significant red shift in the UV–Vis spectra that display low-intensity bands at 364 and 383 nm, respectively, corresponding to MLCT transitions, in accordance with the TD-DFT calculations realized with EtOH. In the solid state, compounds 1 and 2 display a series of supramolecular interactions such as OH···O/O, C-H···O hydrogen bonds and C-H··· π/π···π contacts that stabilize the crystal structures. Compounds 1 and 2 are of moderate thermal stability. According to the cyclovoltammetric analyses, complexes 1 and 2 show quasi-reversible oxidation processes, which constitutes a drawback for the dye regeneration within DSSC devices. TiO2/N719-based devices co-sensitized with compounds 1 and 2 yield overall efficiencies of 63.6 and 58.6%, which are lower than the reference device, but employ only half the amount of the expensive ruthenium dye (N719). These results are relevant for the future design of co-sensitizers for the generation of large scale DSSCs. Further investigations in this direction are underway in our laboratories.

Supplementary Materials

The following supporting information can be downloaded at: https://www.mdpi.com/article/10.3390/cryst12091240/s1: Figures S1, S2 and S3, IR, 1H-NMR and 31P-NMR spectra of 1; Figures S4, S5 and S6, IR, 1H-NMR and 31P-NMR spectra of 2; Table S1, intermolecular interaction geometries of complexes 1 and 2; Figure S7, geometery-optimized structure of complexes 1 and 2 at the M06/6-31G(d) + DZVP level of theory; Figure S8, intramolecular Cu1···O1 and π···π interactions in the crystal structure of 2; Figures S9 and S10: packing diagrams of the crystal structures of 1 and 2; Figures S11 and S12: percentages of intermolecular interactions for complexes 1 and 2; Figure S13, HOMO and LUMO frontier orbital plots of complexes 1 and 2 based on TD-DFT calculations; Table S2, data from the calculated electronic absorption spectra (TD-DFT) for complexes 1 and 2; Figure S14, UV–vis absorption spectra of 1, 2 and free H2L ligand; Figure S15, Cyclic voltammograms of 1 and 2.

Author Contributions

S.S.-A., investigation, methodology, material analysis, and writing—original draft; J.J.C.-G., conceptualization, visualization, project administration, writing—original draft, and writing—review and editing; E.A.R.-S., investigation and methodology; A.C.-E., conceptualization, formal analysis, material analysis and writing—original draft; J.B.-L., conceptualization and software; H.H., X-ray analysis, visualization, writing—original draft, writing—review and editing; J.J.G., X-ray and material analysis, writing; M.F.-Á., X-ray and material analysis; V.M.-S., investigation, methodology; D.G.-M., software and validation. All authors have read and agreed to the published version of the manuscript.

Funding

This research received no external funding.

Institutional Review Board Statement

Not applicable.

Informed Consent Statement

Not applicable.

Data Availability Statement

Not applicable.

Acknowledgments

This work received financial support from Universidad Autónoma de Sinaloa, México (DGIP-PRO-A2-023) and from Consejo Nacional de Ciencia y Tecnología (CONACyT) in form of a scholarships granted to S.S.-A (701888). The authors gratefully acknowledge access to the X-ray facilities in the Chemical Research Center at Universidad Autónoma del Estado de Morelos (CIQ-UAEM), México. We also thank USAII Facultad de Química at UNAM, México, for instrumental support.

Conflicts of Interest

The authors declare no conflict of interest.

References

  1. Hoffert, M.I.; Caldeira, K.; Jain, A.K.; Haites, E.F.; Harvey, L.D.D.; Potter, S.D.; Schlesinger, M.E.; Schneider, S.H.; Watts, R.G.; Wigley, T.M.L.; et al. Energy implications of future stabilization of atmospheric CO2 content. Nature 1998, 395, 881–884. [Google Scholar] [CrossRef]
  2. Caldeira, K.; Jain, A.K.; Hoffert, M.I. Climate Sensitivity Uncertainty and the Need for Energy Without CO2 Emission. Science 2003, 299, 2052–2054. [Google Scholar] [CrossRef]
  3. Eisenberg, R.; Nocera, D.G. Preface: Overview of the Forum on Solar and Renewable Energy. Inorg. Chem. 2005, 44, 6799–6801. [Google Scholar] [CrossRef] [PubMed]
  4. Muñoz-García, A.B.; Benesperi, I.; Boschloo, G.; Concepcion, J.J.; Delcamp, J.H.; Gibson, E.A.; Meyer, G.J.; Pavone, M.; Pettersson, H.; Hagfeldt, A.; et al. Dye-sensitized solar cells strike back. Chem. Soc. Rev. 2021, 50, 12450–12550. [Google Scholar] [CrossRef]
  5. Polo, A.S.; Itokazu, M.K.; Iha, N.Y.M. Metal complex sensitizers in dye-sensitized solar cells. Chem. Rev. 2004, 248, 1343–1361. [Google Scholar] [CrossRef]
  6. Förster, C.; Heinze, K. Photophysics and photochemistry with Earth-abundant metals—Fundamentals and concepts. Chem. Soc. Rev. 2020, 49, 1057–1070. [Google Scholar] [CrossRef]
  7. Seo, J.; Noh, J.H.; Seok, S.I. Rational Strategies for Efficient Perovskite Solar Cells. Acc. Chem. Res. 2016, 49, 562–572. [Google Scholar] [CrossRef]
  8. Hagfeldt, A.; Boschloo, G.; Sun, L.; Kloo, L.; Pettersson, H. Dye-Sensitized Solar Cells. Chem. Rev. 2010, 110, 6595–6663. [Google Scholar] [CrossRef]
  9. Kokkonen, M.; Talebi, P.; Zhou, J.; Asgari, S.; Soomro, S.A.; Elsehrawy, F.; Halme, J.; Ahmad, S.; Hagfeldt, A.; Hashmi, S.G. Advanced research trends in dye-sensitized solar cells. J. Mater. Chem. A 2021, 9, 10527–10545. [Google Scholar] [CrossRef]
  10. Sharma, K.; Sharma, V.; Sharma, S.S. Dye-Sensitized Solar Cells: Fundamentals and Current Status. Nanoscale Res. Lett. 2018, 13, 1–46. [Google Scholar] [CrossRef]
  11. Portillo-Cortez, K.; Martínez, A.; Dutt, A.; Santana, G. N719 Derivatives for Application in a Dye-Sensitized Solar Cell (DSSC): A Theoretical Study. J. Phys. Chem. A 2019, 123, 10930–10939. [Google Scholar] [CrossRef] [PubMed]
  12. Yahya, M.; Bouziani, A.; Ocak, C.; Seferoğlu, Z.; Sillanpää, M. Organic/metal-organic photosensitizers for dye-sensitized solar cells (DSSC): Recent developments, new trends, and future perceptions. Dye. Pigment. 2021, 192, 109227. [Google Scholar] [CrossRef]
  13. Housecroft, C.E.; Constable, E.C. Solar energy conversion using first row d-block metal coordination compound sensitizers and redox mediators. Chem. Sci. 2022, 13, 1225–1262. [Google Scholar] [CrossRef]
  14. Sandroni, M.; Pellegrin, Y.; Odobel, F. Heteroleptic bis-diimine copper(I) complexes for applications in solar energy conversion. Comptes Rendus Chim. 2016, 19, 79–93. [Google Scholar] [CrossRef]
  15. Lazorski, M.S.; Castellano, F.N. Advances in the light conversion properties of Cu(I)-based photosensitizers. Polyhedron 2014, 82, 57–70. [Google Scholar] [CrossRef]
  16. Housecroft, C.E.; Constable, E.C. The emergence of copper(i)-based dye sensitized solar cells. Chem. Soc. Rev. 2015, 44, 8386–8398. [Google Scholar] [CrossRef]
  17. Cao, Y.; Saygili, Y.; Ummadisingu, A.; Teuscher, J.; Luo, J.; Pellet, N.; Giordano, F.; Zakeeruddin, S.M.; Moser, J.-E.; Freitag, M.; et al. 11% efficiency solid-state dye-sensitized solar cells with copper(II/I) hole transport materials. Nat. Commun. 2017, 8, 15390. [Google Scholar] [CrossRef]
  18. Colombo, A.; Dragonetti, C.; Roberto, D.; Fagnani, F. Copper Complexes as Alternative Redox Mediators in Dye-Sensitized Solar Cells. Molecules 2021, 26, 194. [Google Scholar] [CrossRef]
  19. Franchi, D.; Leandri, V.; Pia Pizzichetti, A.R.; Xu, B.; Hao, Y.; Zhang, W.; Sloboda, T.; Svanström, S.; Cappel, U.B.; Kloo, L.; et al. Effect of the Ancillary Ligand on the Performance of Heteroleptic Cu(I) Diimine Complexes as Dyes in Dye-Sensitized Solar Cells. ACS Appl. Energy Mater. 2022, 5, 1460−1470. [Google Scholar] [CrossRef]
  20. Alonso-Vante, N.; Nierengarten, J.-F.; Sauvage, J.-P. Spectral sensitization of large-band-gap semiconductors (thin films and ceramics) by a carboxylated bis(1,10-phenanthroline)copper(I) complex. J. Chem. Soc. Dalton Trans. 1994, 1649–1654. [Google Scholar] [CrossRef]
  21. Fürer, S.O.; Luu, L.Y.; Bozic-Weber, B.; Constable, E.C.; Housecroft, C.E. Improving performance of copper(I)-based dye sensitized solar cells through I3−/I− electrolyte manipulation. Dye. Pigment. 2016, 132, 72–78. [Google Scholar] [CrossRef]
  22. Linfoot, C.L.; Richardson, P.; Hewat, T.E.; Moudam, O.; Forde, M.M.; Collins, A.; White, F.; Robertson, N. Substituted [Cu(i)(POP)(bipyridyl)] and related complexes: Synthesis, structure, properties and applications to dye-sensitised solar cells. Dalton Trans. 2010, 39, 8945–8956. [Google Scholar] [CrossRef]
  23. Brauchli, S.Y.; Malzner, F.J.; Constable, E.C.; Housecroft, C.E. Copper(i)-based dye-sensitized solar cells with sterically demanding anchoring ligands: Bigger is not always better. RSC Adv. 2015, 5, 48516–48525. [Google Scholar] [CrossRef]
  24. Fürer, S.O.; Bozic-Weber, B.; Neuburger, M.; Constable, E.C.; Housecroft, C.E. Heteroleptic copper(i) sensitizers with one versus two hole-transporting units in functionalized 2,9-dimethyl-1,10-phenanthroline ancillary ligands. RSC Adv. 2015, 5, 69430–69440. [Google Scholar] [CrossRef]
  25. Sandroni, M.; Kayanuma, M.; Planchat, A.; Szuwarski, N.; Blart, E.; Pellegrin, Y.; Daniel, C.; Boujtita, M.; Odobel, F. First application of the HETPHEN concept to new heteroleptic bis(diimine) copper(i) complexes as sensitizers in dye sensitized solar cells. Dalton Trans. 2013, 42, 10818–10827. [Google Scholar] [CrossRef]
  26. Sandroni, M.; Favereau, L.; Planchat, A.; Akdas-Kilig, H.; Szuwarski, N.; Pellegrin, Y.; Blart, E.; Le Bozec, H.; Boujtita, M.; Odobel, F. Heteroleptic copper(i)–polypyridine complexes as efficient sensitizers for dye sensitized solar cells. J. Mater. Chem. A 2014, 2, 9944–9947. [Google Scholar] [CrossRef]
  27. Selvaraj, B.; Shanmugam, G.; Kamaraj, S.; Gunasekeran, A.; Sambandam, A. Effect of 1-Substituted 2-(Pyridin-2-yl)-1H-Benzo[d]imidazole Ligand-Coordinated Copper and Cobalt Complex Redox Electrolytes on Performance of Ru(II) Dye-Based Dye-Sensitized Solar Cells. Inorg. Chem. 2021, 60, 1937–1947. [Google Scholar] [CrossRef]
  28. Magni, M.; Biagini, P.; Colombo, A.; Dragonetti, C.; Roberto, D.; Valore, A. Versatile copper complexes as a convenient springboard for both dyes and redox mediators in dyes sensiatized solar cells. Coord. Chem. Rev. 2016, 322, 69–93. [Google Scholar] [CrossRef]
  29. Báez-Castro, A.; Baldenebro-López, J.; Cruz-Enríquez, A.; Höpfl, H.; Glossman-Mitnik, D.; Miranda-Soto, V.; Parra-Hake, M.; Reynoso-Soto, E.; Campos-Gaxiola, J.J. Heteroleptic Cu(I) complexes containing polypyridyl ligands and triphenylphosphine: Synthesis, structure, photophysical properties, DFT studies and applications in co-sensitized solar cells. Inorg. Chim. Acta 2017, 466, 486–496. [Google Scholar] [CrossRef]
  30. Kubas, G.J.; Monzyk, B.; Crumbliss, A.L. Tetrakis(Acetonitrile)Copper(I) Hexafluorophosphate. Inorg. Synth. 1979, 19, 90–92. [Google Scholar] [CrossRef]
  31. CrysAlisPro; Version 1.171.37.35; Agilent Technologies: Yarnton, UK, 2014.
  32. Dolomanov, O.V.; Bourhis, L.J.; Gildea, R.J.; Howard, J.A.K.; Puschmann, H. Olex2: A Complete Structure Solution, Refinement and Analysis Program. J. Appl. Cryst. 2009, 42, 339–341. [Google Scholar] [CrossRef]
  33. Sheldrick, G.M. ShelXT-Integrated space-group and crystal-structure determination. Acta Cryst. 2015, A71, 3–8. [Google Scholar] [CrossRef] [PubMed]
  34. Sheldrick, G.M. Crystal structure refinement with SHELXL. Acta Crystallogr. Sect. C Struct. Chem. 2015, C71, 3–8. [Google Scholar] [CrossRef] [PubMed]
  35. Clark, R.C.; Reid, J.S. The analytical calculation of absorption in multifaceted crystals. Acta Crystallogr. Sect. A Found. Crystallogr. 1995, A51, 887–897. [Google Scholar] [CrossRef]
  36. Macrae, C.F.; Bruno, I.J.; Chisholm, J.A.; Edgington, P.R.; McCabe, P.; Pidcock, E.; Rodriguez-Monge, L.; Taylor, R.; van de Streek, J.; Wood, P.A. Mercury CSD 2.0—New features for the visualization and investigation of crystal structures. J. Appl. Crystallogr. 2008, 41, 466–470. [Google Scholar] [CrossRef]
  37. Brandenburg, K. Diamond, version 4.3.2; Crystal Impact GbR: Bonn, Germany, 2017. [Google Scholar]
  38. Malzner, F.J.; Prescimone, A.; Constable, E.C.; Housecroft, C.E.; Willgert, M. Exploring simple ancillary ligands in copper-based dye-sensitized solar cells: Effects of a heteroatom switch and of co-sensitization. J. Mater. Chem. A 2017, 5, 4671–4685. [Google Scholar] [CrossRef]
  39. Cruz-Gutiérrez, C.A.; Félix-Navarro, R.M.; Calva-Yañez, J.C.; Silva-Carrillo, C.; Lin-Ho, S.W.; Reynoso-Soto, E.A. Carbon nanotube-carbon black hybrid counter electrodes for dye-sensitized solar cells and the effect on charge transfer kinetics. J. Solid State Electrochem. 2021, 25, 1479–1489. [Google Scholar] [CrossRef]
  40. Turner, M.J.; McKinnon, J.J.; Wolff, S.K.; Grimwood, D.J.; Spackman, P.R.; Jayatilaka, D.; Spackman, M.A. CrystalExplorer17; University of Western Australia: Crawley, WA, Australia, 2017. [Google Scholar]
  41. Hohenberg, P.; Kohn, W. Inhomogeneous Electron Gas. Phys. Rev. 1964, 136, B864–B871. [Google Scholar] [CrossRef]
  42. Kohn, W.; Sham, L.J. Self-consistent equations including exchange and correlation effects. Phys. Rev. 1965, 140, A1133–A1138. [Google Scholar] [CrossRef]
  43. Frisch, M.J.; Trucks, G.W.; Schlegel, H.B.; Scuseria, G.E.; Robb, M.A.; Cheeseman, J.R.; Scalmani, G.; Mennucci, V.B.; Petersson, G.A.; Nakatsuji, H.; et al. Gaussian 09; Revision A. 02; Gaussian Inc.: Wallingford, CT, USA, 2009. [Google Scholar]
  44. Dennington, R.; Keith, T.; Millam, J.; Eppinnett, K.; Hovell, W.L.; Gilliland, R. GaussView, version 5.0.9; Semichem, Inc.: Shawnee Mission, KS, USA, 2009. [Google Scholar]
  45. Stratmann, R.E.; Scuseria, G.E.; Frisch, M.J. An efficient implementation of time-dependent density-functional theory for the calculation of excitation energies of large molecules. J. Chem. Phys. 1998, 109, 8218–8224. [Google Scholar] [CrossRef]
  46. Burke, K.; Werschnik, J.; Gross, E. Time-dependent density functional theory: Past, present, and future. J. Chem. Phys. 2005, 123, 062206. [Google Scholar] [CrossRef] [PubMed]
  47. Zhao, Y.; Truhlar, D.G. The M06 suite of density functionals for main group thermochemistry, thermochemical kinetics, noncovalent interactions, excited states, and transition elements: Two new functionals and systematic testing of four M06-class functionals and 12 other functionals. Theor. Chem. Acc. 2008, 120, 215–241. [Google Scholar] [CrossRef]
  48. Rassolov, V.A.; Ratner, M.A.; Pople, J.A.; Redfern, P.C.; Curtiss, L.A. 6-31G* basis set for third-row atoms. J. Comput. Chem. 2001, 22, 976–984. [Google Scholar] [CrossRef]
  49. Sosa, C.; Andzelm, J.; Elkin, B.C.; Wimmer, E.; Dobbs, K.D.; Dixon, D.A. A local density functional study of the structure and vibrational frequencies of molecular transition-metal compounds. J. Phys. Chem. 1992, 96, 6630–6636. [Google Scholar] [CrossRef]
  50. Scrocco, E.; Tomasi, J. Electronic Molecular Structure, Reactivity and Intermolecular Forces: An Euristic Interpretation by Means of Electrostatic Molecular Potentials. Adv. Quantum Chem. 1978, 11, 115–193. [Google Scholar] [CrossRef]
  51. Andrés-Tomé, I.; Fyson, J.; Dias, F.B.; Monkman, A.P.; Iacobellis, G.; Coppo, P. Copper(i) complexes with bipyridyl and phosphine ligands: A systematic study. Dalton Trans. 2012, 41, 8669–8674. [Google Scholar] [CrossRef]
  52. Massoud, S.S.; Broussard, K.T.; Mautner, F.A.; Vicente, R.; Saha, M.K.; Bernal, I. Five-coordinate cobalt(II) complexes of tris(2-pyridylmethyl)amine (TPA): Synthesis, structural and magnetic characterization of a terephthalato-bridged dinuclear cobalt(II) complex. Inorg. Chim. Acta 2008, 361, 123–131. [Google Scholar] [CrossRef]
  53. Bora, J.S.; Chakrabortty, M.; Das, K.B. Ditopic carboxylate containing zigzag chain polymers with tetrahedral Co(II) and Zn(II) nodes. J. Mol. Struct. 2020, 1217, 128434. [Google Scholar] [CrossRef]
  54. Obaleye, J.A.; Lawal, M.; Jadeja, R.N.; Gupta, V.K.; Nnabuike, G.G.; Bamigboye, M.O.; Roy, H.; Yusuff, O.K.; Bhagariya, P. Crystal structure, spectroscopic, DFT calculations and antimicrobial study of the Cu(II) complex bearing second-generation quinolone ofloxacin and 2,2′-bipyridine. Inorg. Chim. Acta 2021, 519, 120264. [Google Scholar] [CrossRef]
  55. Báez-Castro, A.; Baldenebro-López, J.; Cruz-Enríquez, A.; Höpfl, H.; Glossman-Mitnik, D.; Valentín, M.-S.; Parra-Hake, M.; Campos-Gaxiola, J.J. Synthesis, structure, characterization and photophysical properties of copper(i) complexes containing polypyridyl ligands. RSC Adv. 2014, 4, 42624–42631. [Google Scholar] [CrossRef]
  56. Báez-Castro, A.; Baldenebro-López, J.; Ceballos-Mendivil, L.; Román-Bravo, P.P.; Höpfl, H.; Miranda-Soto, V.; Glossman-Mitnik, D.; Cruz-Enríquez, A.; Campos-Gaxiola, J.J. Synthesis, crystal structure, DFT studies and photophysical properties of a copper(I)–triphenylphosphane complex based on trans-(±)-2,4,5-tris(pyridin-2-yl)-2-imidazoline. Acta Crystallogr. C Struct. Chem. 2017, 73, 280–286. [Google Scholar] [CrossRef] [PubMed]
  57. Peppas, A.; Papadaki, E.; Schnakenburg, G.; Magrioti, V.; Philippopoulos, A.I. Heteroleptic copper(I) complexes incorporating sterically demanding diazabutadiene ligands (DABs). Synthesis, spectroscopic characterization and solid state structural analysis. Polyhedron 2019, 171, 412–422. [Google Scholar] [CrossRef]
  58. Pavia, D.; Lampman, G.; Kriz, G.; Vyvyan, J. Introduction to Spectroscopy; Cengage Learning: Belmont, CA, USA, 2008. [Google Scholar]
  59. Yang, L.; Powell, D.R.; Houser, R.P. Structural variation in copper(i) complexes with pyridylmethylamide ligands: Structural analysis with a new four-coordinate geometry index, τ4. Dalton Trans. 2007, 955–964. [Google Scholar] [CrossRef] [PubMed]
  60. Nohara, I.; Prescimone, A.; Häussinger, D.; Catherine, E.; Housecroft, C.E.; Constable, E.C. [Cu(POP)(N^S)][PF6] and [Cu(xantphos)(N^S)][PF6] compounds with 2-(thiophen-2-yl)pyridines. RSC Adv. 2019, 9, 13646–13657. [Google Scholar] [CrossRef]
  61. Rojas-León, I.; Guerrero-Alvarez, J.A.; Hernández-Paredes, J.; Höpfl, H. Solvent–solvent and solvent–solute interactions in a 3D chloroform clathrate with diorganotin macrocycles in the nano-sized pores. Chem. Commun. 2012, 48, 401–403. [Google Scholar] [CrossRef]
  62. Yong, G.-P.; Zhang, Y.-M.; She, W.-L. Anion–π interactions in new electron-deficient π systems: The relevance to solid phosphorescent colors. CrystEngComm 2012, 14, 3923–3929. [Google Scholar] [CrossRef]
  63. Spackman, M.A.; Jayatilaka, D. Hirshfeld surface analysis. CrystEngComm. 2009, 11, 19–32. [Google Scholar] [CrossRef]
  64. McKinnon, J.J.; Spackman, M.A.; Mitchell, A.S. Novel tools for visualizing and exploring intermolecular interactions in molecular crystals. Acta Crystallogr. Sect. B Struct. Sci. 2004, B60, 627–668. [Google Scholar] [CrossRef]
  65. Woińska, M.; Jayatilaka, D.; Spackman, M.; Edwards, A.J.; Dominiak, P.; Woźniak, K.; Nishibori, E.; Sugimoto, K.; Grabowsky, S. Hirshfeld atom refinement for modelling strong hydrogen bonds. Acta Crystallogr. Sect. A Found. Adv. 2014, A70, 483–498. [Google Scholar] [CrossRef]
  66. Gao, S.; Fan, R.Q.; Wang, X.M.; Qiang, L.S.; Wei, L.G.; Wang, P.; Yang, Y.L.; Yu Lei Wang, Y.L.; Luan, T.Z. Multifunctional Zn(II)/Cd(II) metal complexes for tunable luminescence properties and highly efficient dye-sensitized solar cells. RSC Adv. 2015, 5, 43705–43716. [Google Scholar] [CrossRef]
  67. Lv, J.; Lu, Y.; Wang, J.; Zhao, F.; Wang, Y.; He, H.; Wu, Y. Schiff base-type copper(I) complexes exhibiting high molar extinction coefficients: Synthesis, characterization and DFT studies. J. Mol. Struct. 2022, 1249, 131638. [Google Scholar] [CrossRef]
  68. Li, C.; Mackenzie, C.F.R.; Said, S.A.; Pal, A.K.; Haghighatbin, M.A.; Babaei, A.; Sessolo, M.; Cordes, D.B.; Slawin, A.M.Z.; Kamer, P.C.J.; et al. Wide-Bite-Angle Diphosphine Ligands in Thermally Activated Delayed Fluorescent Copper(I) Complexes: Impact on the Performance of Electroluminescence Applications. Inorg. Chem. 2021, 60, 10323–10339. [Google Scholar] [CrossRef]
  69. Wang, J.; Chai, C.; Xu, S.; Zhao, F.; Xia, H.; Wang, Y. Modulation of photophysical properties of copper(I) complexes containing pyridyl-imidazole (PyIm) ligands functionalized by naphthyl, phenanthryl, and anthryl groups. Inorg. Chim. Acta 2019, 484, 237–244. [Google Scholar] [CrossRef]
  70. Brunner, F.; Babaei, A.; Pertegás, A.; Junquera-Hernández, J.M.; Prescimone, A.; Constable, E.C.; Bolink, H.J.; Sessolo, M.; Ortí, E.; Housecroft, C.E. Phosphane tuning in heteroleptic [Cu(N^N)(P^P)]+ complexes for light-emitting electrochemical cells. Dalton Trans. 2019, 48, 446–460. [Google Scholar] [CrossRef] [PubMed]
  71. Kumar, A.; Vashistha, V.K.; Tevatia, P.; Singh, R. Voltammetric Determination of Molecular Modeling Parameters for Pentaazamacrocyclic Complexes of Mn(II) and Co(II). Anal. Bioanal. Electrochem. 2016, 8, 848–861. [Google Scholar]
  72. Wei, L.; Yang, Y.; Fan, R.; Na, Y.; Wang, P.; Dong, Y.; Yang, B.; Cao, W. N, N′-Bis((6-methoxylpyridin-2-yl)methylene)-p-phenylenediimine based d10 transition metal complexes and their utilization in co-sensitized solar cells. Dalton Trans. 2014, 43, 11361–11370. [Google Scholar] [CrossRef]
  73. Wang, D.-D.; Song, L.; Wang, Y.Y.; Guo, J.Y.; Shen, H.Y.; Wang, X.R.; Chai, W.X. Heteroleptic [Cu(NN)P2]+-type cuprous complexes and their structural modulation on phosphorescent color: Synthesis, structural characterization, properties, and theoretical calculations. Appl. Organomet. Chem. 2020, 34, e5561. [Google Scholar] [CrossRef]
Scheme 1. Synthetic pathways for complexes 1 and 2.
Crystals 12 01240 sch001
Figure 1. Molecular structures and metal coordination polyhedra for [Cu(HL)(PPh3)2] in 1 (top) and [Cu(HL)(POP)] in 2 (bottom). Hydrogen atoms and uncoordinated solvent molecules were omitted for clarity. Ellipsoids are shown at the 50% probability level.
Crystals 12 01240 g001
Figure 2. (a,b) Hirshfeld surface maps (dnorm) of compound 1 viewed from different perspectives. (c) Fingerprint plot. (d) Contributions of different types of intermolecular interactions.
Crystals 12 01240 g002
Figure 3. (a,b) Hirshfeld surface maps (dnorm) of compound 2 viewed from different perspectives. (c) Fingerprint plot. (d) Contributions of different types of intermolecular interactions.
Crystals 12 01240 g003
Figure 4. Plots of the molecular orbitals involved in the lowest-lying electronic absorption transitions in complexes 1 and 2.
Crystals 12 01240 g004
Figure 5. Comparison of the calculated and experimental absorption spectra in EtOH solution (6.0 × 10⁻⁵ M) for 1 and 2. Inset: amplified visible region of the absorption spectra.
Crystals 12 01240 g005
Figure 6. JV curves for DSSCs of 1 and 2 based on co–sensitized photoelectrodes with N719 in comparison to a photoelectrode containing only N719 using irradiation with 100 mW cm−2 AM 1.5G sunlight (adsorption time 24 h).
Crystals 12 01240 g006
Figure 7. TGA curves of compounds 1 and 2.
Crystals 12 01240 g007
Table 1. Characteristic absorptions (cm−1) in the IR spectra of ligand H2L and complexes 1 and 2 *.
Compoundν(C=O)ν(COO−)asyν(COO−)symν(C=N)ν(P−C)
H2L1733 (s)--1595 (m)-
PPh3----1095 (s)
11715 (m)1597 (m)1265 (s)1554 (m)1094 (m)
POP----1092 (w)
21722 (w)1589 (w)1261 (m)1566 (w)1093 (m)
* w = weak, m = medium, s = strong.
Table 2. Experimental (scXRD) and calculated (DFT M06/6-31G(d)+DZVP level) values of selected bond lengths [Å] and bond angles [°] relevant for the description of the coordination geometries of the copper(I) atoms in compounds 1 and 2.
ComplexBond (Ǻ) DFT DataAngle (°) DFT Data
1Cu1−N12.0974(15)2.130N1−Cu1−O179.03(5)79.60
Cu1−O12.0991(13)2.080N1−Cu1−P1108.50(5)106.06
Cu1−P12.2420(6)2.264N1−Cu1−P2105.35(4)108.40
Cu1−P22.2574(5)2.258O1−Cu1−P1116.69(4)117.35
O1−Cu1−P2115.71(4)119.57
P1−Cu1−P2121.40(2)117.02
2Cu1−N12.0483(15)2.130N1−Cu1−O279.41(5)80.07
Cu1−O22.1305(13)2.073N1−Cu1−P1115.16(4)113.08
Cu1−P12.2261(5)2.253N1−Cu1−P2109.92(4)102.65
Cu1−P22.2457(5)2.268O2−Cu1−P1122.07(4)119.33
O2−Cu1−P2110.98(4)119.27
P1−Cu1−P2114.25(2)114.78
Table 3. Selected electrochemical data extracted from the CVs of complexes 1 and 2.
Complex E c p r e d   (V) E a p o x   1 (V) E a p o x   2 (V) HOMO (eV)LUMO (eV)a ΔE (eV)
1−1.890.701.47−5.85−2.493.36
2−1.940.511.56−5.94−2.443.50
The CVs were recorded in EtOH solution for 1 and CH2Cl2 solution for 2 (ca. 8 × 10⁵ M) with 0.025 M (nBu4N)PF6 (T = 298 K, scan rate = 100 mV s−1). a ΔE = ELUMO-EHOMO.
Table 4. J-V performance of DSSCs based on photoelectrodes of N719 co-sensitized with 1 and 2.
Dyesjsc (mA/cm2)Voc (V)ff (%)ƞ (%)ƞRelative (%)
[a]1/N719 (1:1)1.5800.65256.62.9263.62
[a]2/N719 (1:1)1.4460.64357.92.6958.61
N7192.2650.70857.24.59100
Jsc = short circuit current, VOC = open circuit potential, ff = fill factor, η = power conversion Efficiency. [a] The electrodes based on the dye combinations 1/N719 and 2/N719 contain only 50% of N719 compared to the control experiment with only N719.
Publisher’s Note: MDPI stays neutral with regard to jurisdictional claims in published maps and institutional affiliations.

