Article

Impact of Mo-Doping on the Structural, Optical, and Electrocatalytic Degradation of ZnO Nanoparticles: Novel Approach

by
Vanga Ganesh
1,*,
Mai S. A. Hussien
2,3,
Ummar Pasha Shaik
4,
Ramesh Ade
5,
Mervat I. Mohammed
2,
Thekrayat H. AlAbdulaal
1,
Heba Y. Zahran
1,2,6,
Ibrahim S. Yahia
1,2,6,* and
Mohamed Sh. Abdel-wahab
7
1
Laboratory of Nano-Smart Materials for Science and Technology (LNSMST), Department of Physics, Faculty of Science, King Khalid University, Abha P.O. Box 9004, Saudi Arabia
2
Nanoscience Laboratory for Environmental and Bio-medical Applications (NLEBA) (Metallurgical Lab.1.), Department of Physics, Faculty of Education, Ain Shams University, Roxy, Cairo 11757, Egypt
3
Department of Chemistry, Faculty of Education, Ain Shams University, Roxy, Cairo 11757, Egypt
4
Department of Physics, Anurag Engineering College (An UGC Autonomous Institution), Ananthagiri (V&M), Suryapet(D), Suryapet 508206, Telangana, India
5
Department of Physics, Koneru Lakshmaiah Education Foundation, R V S Nagar, Aziz Nagar (PO), Moinabad Road, Hyderabad 500075, Telangana, India
6
Research Center for Advanced Materials Science (RCAMS), King Khalid University, Abha P.O. Box 9004, Saudi Arabia
7
Materials Science and Nanotechnology Department, Faculty of Postgraduate Studies for Advanced Sciences, Beni-Suef University, Beni-Suef 62511, Egypt
*
Authors to whom correspondence should be addressed.
Crystals 2022, 12(9), 1239; https://doi.org/10.3390/cryst12091239
Submission received: 8 June 2022 / Revised: 19 August 2022 / Accepted: 23 August 2022 / Published: 1 September 2022
(This article belongs to the Special Issue 1D and 2D Nanomaterials for Sensor Applications)

Abstract

:
Pure and Molybdenum (Mo)-doped zinc oxide (ZnO) nanoparticles were prepared by a cost-effective combustion synthesis route. XRD results revealed the decrement in crystallite size of ZnO with an increase in Mo-doping concentration. Optical bandgap (Eg) values were determined using optical reflectance spectra of these films measured in the range of 190–800 nm. The Eg values decreased with increasing the Mo-doping concentration. The dielectric properties of these samples were studied to determine the dielectric constant values. Raman spectra of these samples were recorded to know the structure. These sample absorption spectra were recorded for electrocatalytic applications. All the prepared samples were subjected to electrocatalytic degradation of Rhodamine B. The 0.01 wt% Mo doped ZnO showed 100% in 7 min electrocatalytic degradation.

1. Introduction

It is a known fact that all the world’s human beings strongly depend on natural resources, for example, soil, water, air, etc. Unfortunately, in recent years, contamination of these resources has been very high from textile, leather, chemical laboratories, and paper industries, which were the primary sources of water pollution. They release unprocessed wastewater directly into the water bodies [1,2,3,4]. Using this unsafe water, many health problems will occur to human beings [1,5]. Currently, wastewater treatment and recycling are getting significant attention. Therefore, great attention has to be paid to investigating cost-effective and eco-friendly techniques for water purification. Photocatalysis is a technique used for water purification that is simple and cheap. The importance of photocatalysis for water electrolysis and hydrogen fuel cells has been discussed by many researchers [6].
ZnO is one of the promising II–VI semiconducting materials, which displays a large optical band gap (3.37 eV) and exciton binding energy (60 meV), high linear refractive index, and electrical properties. These properties make ZnO suitable for electronics, photonic devices, UV laser diodes, piezoelectric transducers, light-emitting diodes sensors, solar cells, and optoelectronic devices [7,8,9,10,11]. Semiconducting nanostructures with different morphologies such as nanoparticles, nanowires, nanorods, nanobelts, nanoprisms, nanodots, and nanostructured thin films help understand the physical and chemical properties of nanoscale systems. The behavior of electron, photon, and phonon of nanoscale systems was studied and reported by the earlier workers [12]. Different methods to fabricate ZnO nanoparticles include sol-gel, ultrasonic, chemical vapor deposition, microemulsion, organometallic precursor, solvothermal, microemulsion, and spray pyrolysis electrodeposition, sonochemical, microwave-assisted, and hydrothermal [13,14,15,16,17,18,19,20,21].
ZnO acts as a photocatalyst upon the photoirradiation by transferring electrons from the valence band to the conduction band in the shorter wavelength region [13,22]. Due to the similarities in the bandgap of ZnO and TiO2, many researchers tried to replace expensiveTiO2 photocatalyst with ZnO photocatalyst. Since ZnO is a low-cost and non-toxic material, it has received significant interest. Furthermore, during UV- light irradiation, ZnO exhibits remarkable electrocatalytic ability for degrading organic pollutants in aqueous suspension by generating powerful oxidizing agents such as hydroxyl radicals and superoxide radical anions, which decompose the organic pollutants [9], but they learned that ZnO is less active under visible light than TiO2, and several attempts were made to improve ZnO properties.
The electrocatalytic activity of various ZnO crystal surfaces was investigated. They discovered that the surface atomic structures of the material had a significant impact on its photostability and electrocatalytic activity. When the surface is polar and has high surface energy, photolysis of ZnO occurs quickly [19]. Recently, reports enhanced electrocatalytic properties by adding dopants such as transition metals to ZnO lattice [13,23,24]. It is also reported that Mg-doped ZnO nanoparticles showed an adequate capacity to remove contaminating organic molecules, specifically MO (Ceramics International 47 (2021) 15668–15681). Recently, by introducing metal dopants, enhancement in electronic, magnetic, and catalytic properties of biphenylene network has been reported [25,26,27,28]. In the Mo-doped ZnO incorporation, Zn-O-M instead of Zn-O-Zn occurs, leading to new energy levels between the valence and conduction bands by lowering bandgap values. Mo-doped ZnO can be used as a photocatalyst to degrade bacteria and water purification [13,29]. Mo has an ionic radius similar to Zn2+, which is a good match. As a result, it produces stable mixed metal oxides with the composition ZnO/MoO3. Recently some workers also investigated the photocatalysis studies of Mo, Mn, Co, and Cu-doped ZnO thin films using different dye solutions and concluded that the pH of the dye solution plays a crucial role in the dye degrading mechanism [30].
In the current work, we demonstrated the synthesis of pure and Mo-doped ZnO nanoparticles by a cost-effective combustion synthesis method. The main objective of this study is pure, and Mo-doped ZnO samples were examined for water purification by using them as photocatalysts.

2. Experimental Details

2.1. Synthesis of Mo-Doped ZnO Nanostructures

The present study synthesized nanostructures of pure and Mo-doped ZnO using a low-cost combustion technique. As starting material, we prepared a homogeneous solution by adding 5gm of zinc nitrate (Zn (NO3)2.6H2O) with 5 gm of citric acid in a crucible. Various concentrations of Ammonium pentamolybdate (0 wt%, 0.001 wt%, 0.01 wt%, 0.1 wt%, 0.5 wt%, and 1 wt%) with 30 mL of distilled water were added to the homogeneous solution. The solution was continuously stirred at 170 °C on a hot plate for 2 h. Finally, these solutions were heated in a furnace at 550 °C for 2 h; the final product is well-grounded using mortar and pestle. In the current study, six different samples were prepared by varying the concentration of ammonium pentamolybdate as 0 wt% (sample named ZNCM-1), 0.001 wt% (sample named ZNCM-2), 0.01 wt% (sample named ZNCM-3) 0.1 wt% (sample named as ZNCM-4), 0.5 wt% (sample named as ZNCM-5), and 1 wt% (sample named as ZNCM-6).

2.2. Devices and Measurements

The structural properties of the present samples were examined by using a Shimadzu LabX-XRD-6000 X-ray diffractometer, with CuKa = 1.54 Å radiation in the angle range from 5° to 80°.
The structural morphology of the present samples was investigated by scanning electron microscopy techniques (SEM-Jeol. JSM-6360 type) operated at 20 kV.
Optical reflectance (190–800 nm) and the absorption spectra (200–1600 nm) were recorded using a 3600 UV/Vis/NIR spectrophotometer (Shimadzu, Japan).
The present sample’s Raman spectra were recorded using an FT-Raman spectrometer (Thermo Fisher Scientific, Waltham, MA, USA). In addition, Fourier transforms infrared (FT-IR) spectra (400 to 4000 cm−1) of the prepared samples were recorded by XDR FT-IR Spectrometer, THERMO SCIENTIFIC.
The dielectric properties were recorded using Keithley 4200-SCS in the frequency range of 1 kHz and 10 MHz.
A Rhodamine B dye (50 mg/L) was used as a typical organic pollutant in the experiment of electrocatalytic degradation. The electrocatalytic degradation processes and electrocatalysis single-cell reactor (EC) reactor were used, with 0.01 gm of catalyst provided and two graphite electrodes functioning as a working electrode and a counter electrode. The electrodes were separated by 5 cm under biasing DC voltage of 10 volts.

3. Results and Discussion

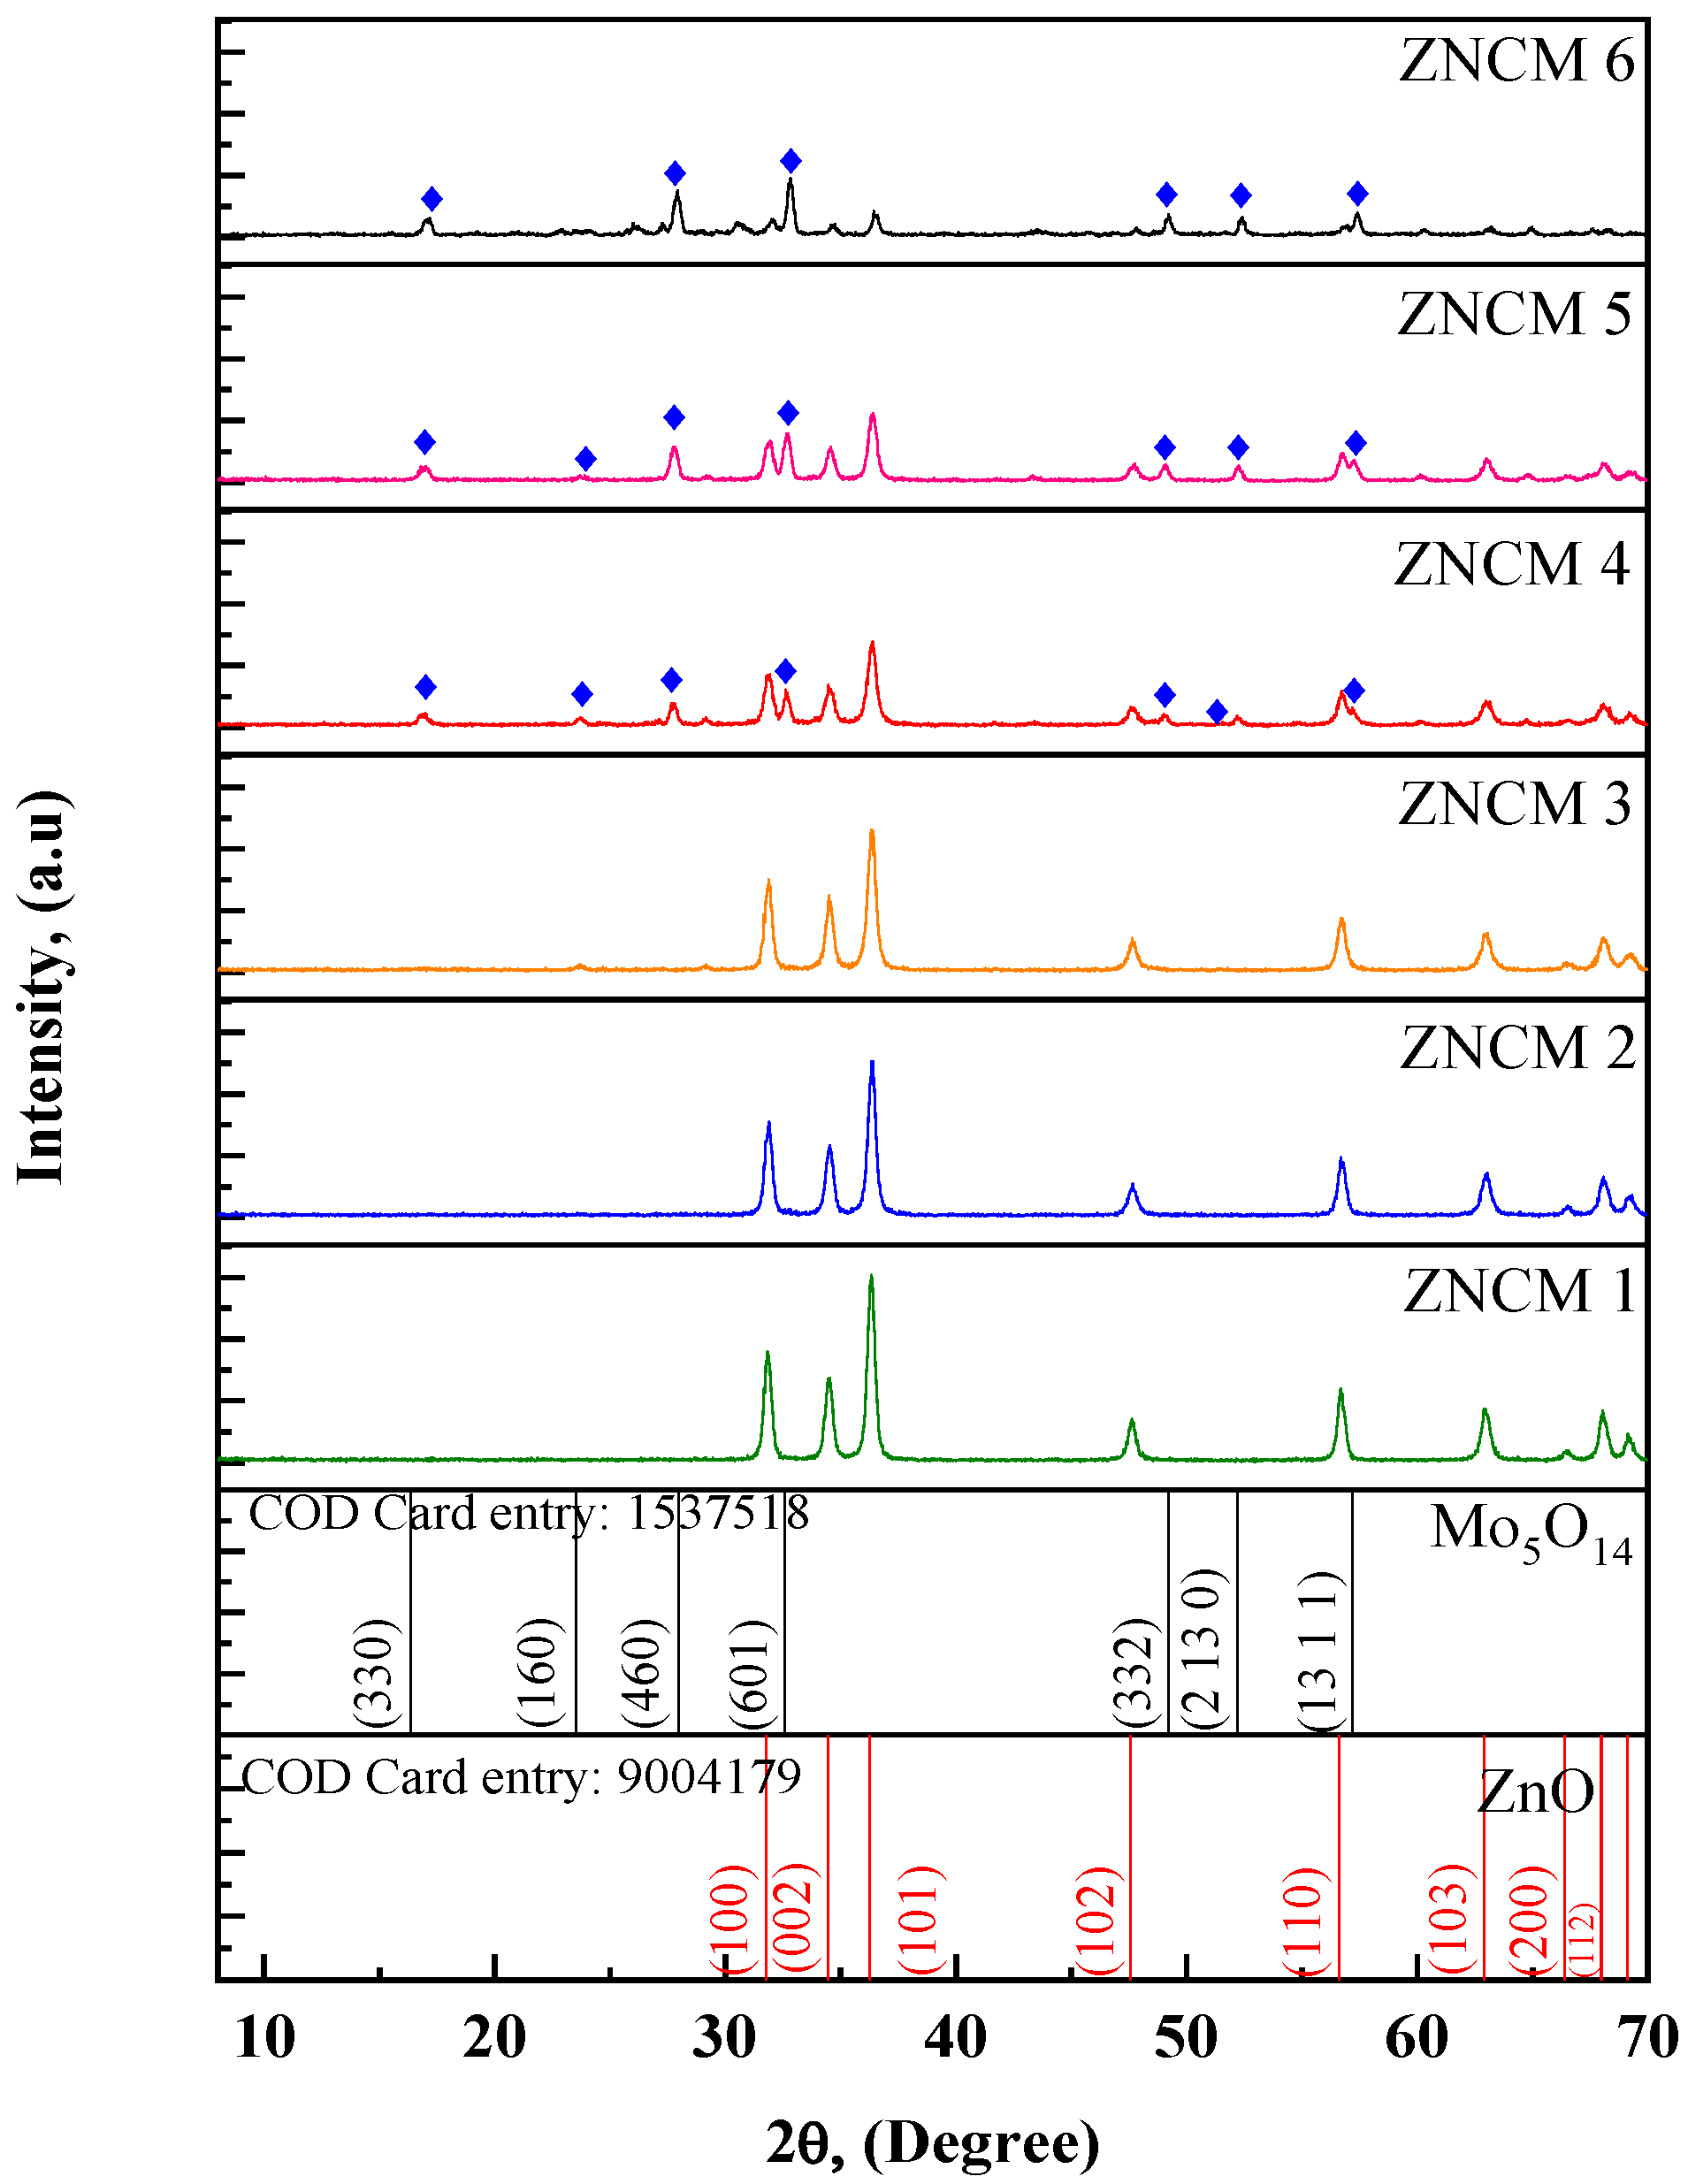
3.1. X-ray Diffraction Studies

The X-ray diffraction patterns of pure (ZNCM-1) and Mo-doped (ZNCM-2, ZNCM-3, ZNCM-4, ZNCM-5, and ZNCM-6) ZnO nanoparticles samples are demonstrated in Figure 1. The diffraction peaks of the ZNCM-1 sample matched with hexagonal ZnO structure. These peaks were indexed according to COD Card entry 9004179. We did not find any significant Mo or Zn residues from the XRD patterns of ZNCM-2 and ZNCM-3 samples. It indicates that Mo replaces Zn in the hexagonal ZnO lattice. Similar results were obtained for Mo and Al-doped ZnO and Mo-doped In2O3 films [31,32,33,34,35,36,37,38,39]. Further, the intensity of all the ZnO peaks decreased, whereas the intensity of Mo-based Mo5O14 peaks increased with an increase in dopant concentration observed in the XRD pattern of ZNCM-4, ZNCM-5, and ZNCM-6 samples. The peaks corresponding to Mo5O14 are indexed according to COD Card entry 1537518. K. Ravichandran et al. [1] reported similar results. The unit cell parameters of hexagonal ZnO calculated from the XRD pattern were a = 3.2 ± 0.2 Å and c = 5.2 ± 0.2 Å, indicating independence of dopant concentration of the samples. Scherer’s formula was used to calculate crystallite size (D), dislocation density (δ), and dislocation density (δ), using the following relationships [21,22]:
D = 0.9 λ / β cos θ
δ = 1 / D 2
ε = β cos θ / 4
Here, θ is the diffraction angle, λ is the X-ray wavelength in the nm unit, and ¦Â is the full width at half maximum (FWHM). All the calculated structural parameters of the present samples are depicted in Table 1. The average D value ZnO peaks [34] was 23 ± 2 nm for the samples ZNCM-1 and ZNCM-2. The D of ZNCM-3, ZNCM-4 and ZNCM-5 are 18 ± 2 nm. However, ZNCM-6 had a D of 14 ± 2 nm. The lower D-value for ZNCM-6 can be attributed to residues in the XRD pattern and lower the intensity of the ZnO peaks. It is clear that with increasing dopant concentration D-value of ZnO decreases. At the same time, ɛ and δ values increase with increasing Mo-dopants in the host ZnO material. The value of δ determines a defect density in a crystal, which arises due to misregistration of the lattice in one segment of another crystal section. Khalid Umar et al. (2015) observed similar results on Mo and Mn-doped ZnO and their electrocatalytic activity studies, and the possible reason for decreasing crystallite size discussed as the addition of dopant may hinder the growth of ZnO particles [35].

3.2. SEM Studies

The microstructure of prepared nano samples is displayed in Figure 2. All the microstructures exhibit highly agglomerated and soapy porous structures. The reason for this kind of structure is released out of the reaction mixture during combustion. Upon increasing dopant concentration, the size of the nanoparticles is reduced from 177, 168, 165, 154, to 135 nm for the samples ZNCM-1, ZNCM-2, ZNCM-3, ZNCM-4, to ZNCM-5, respectively. The same results were observed in the earlier reports [35,36,37,38]. There is a remarkable change in the microstructure of 1 wt% of Mo-doped ZnO sample (ZNCM-6) instead of having nanoparticles. This could be due to the occupation of Mo- in the additional interstitial site of ZnO [35,36,37,38,39,40]. Petronela Pascariu et al. [41] reported platelet structured microparticles of diameters between 4 and 5 µm for molybdenum oxide. In the present study, the microstructure of ZNCM-6 exhibits a nanoflakes structure. The observed nanoflakes are typical of the order of 300 nm few µm. It was observed that the specific surface area of Mo-doped ZnO samples increases slightly with increasing Mo concentration, which may be due to a decrease in D-values. Due to the large surface area, these samples are suitable for the electrocatalytic activity of ZnO by adsorption of a dye [39,41]

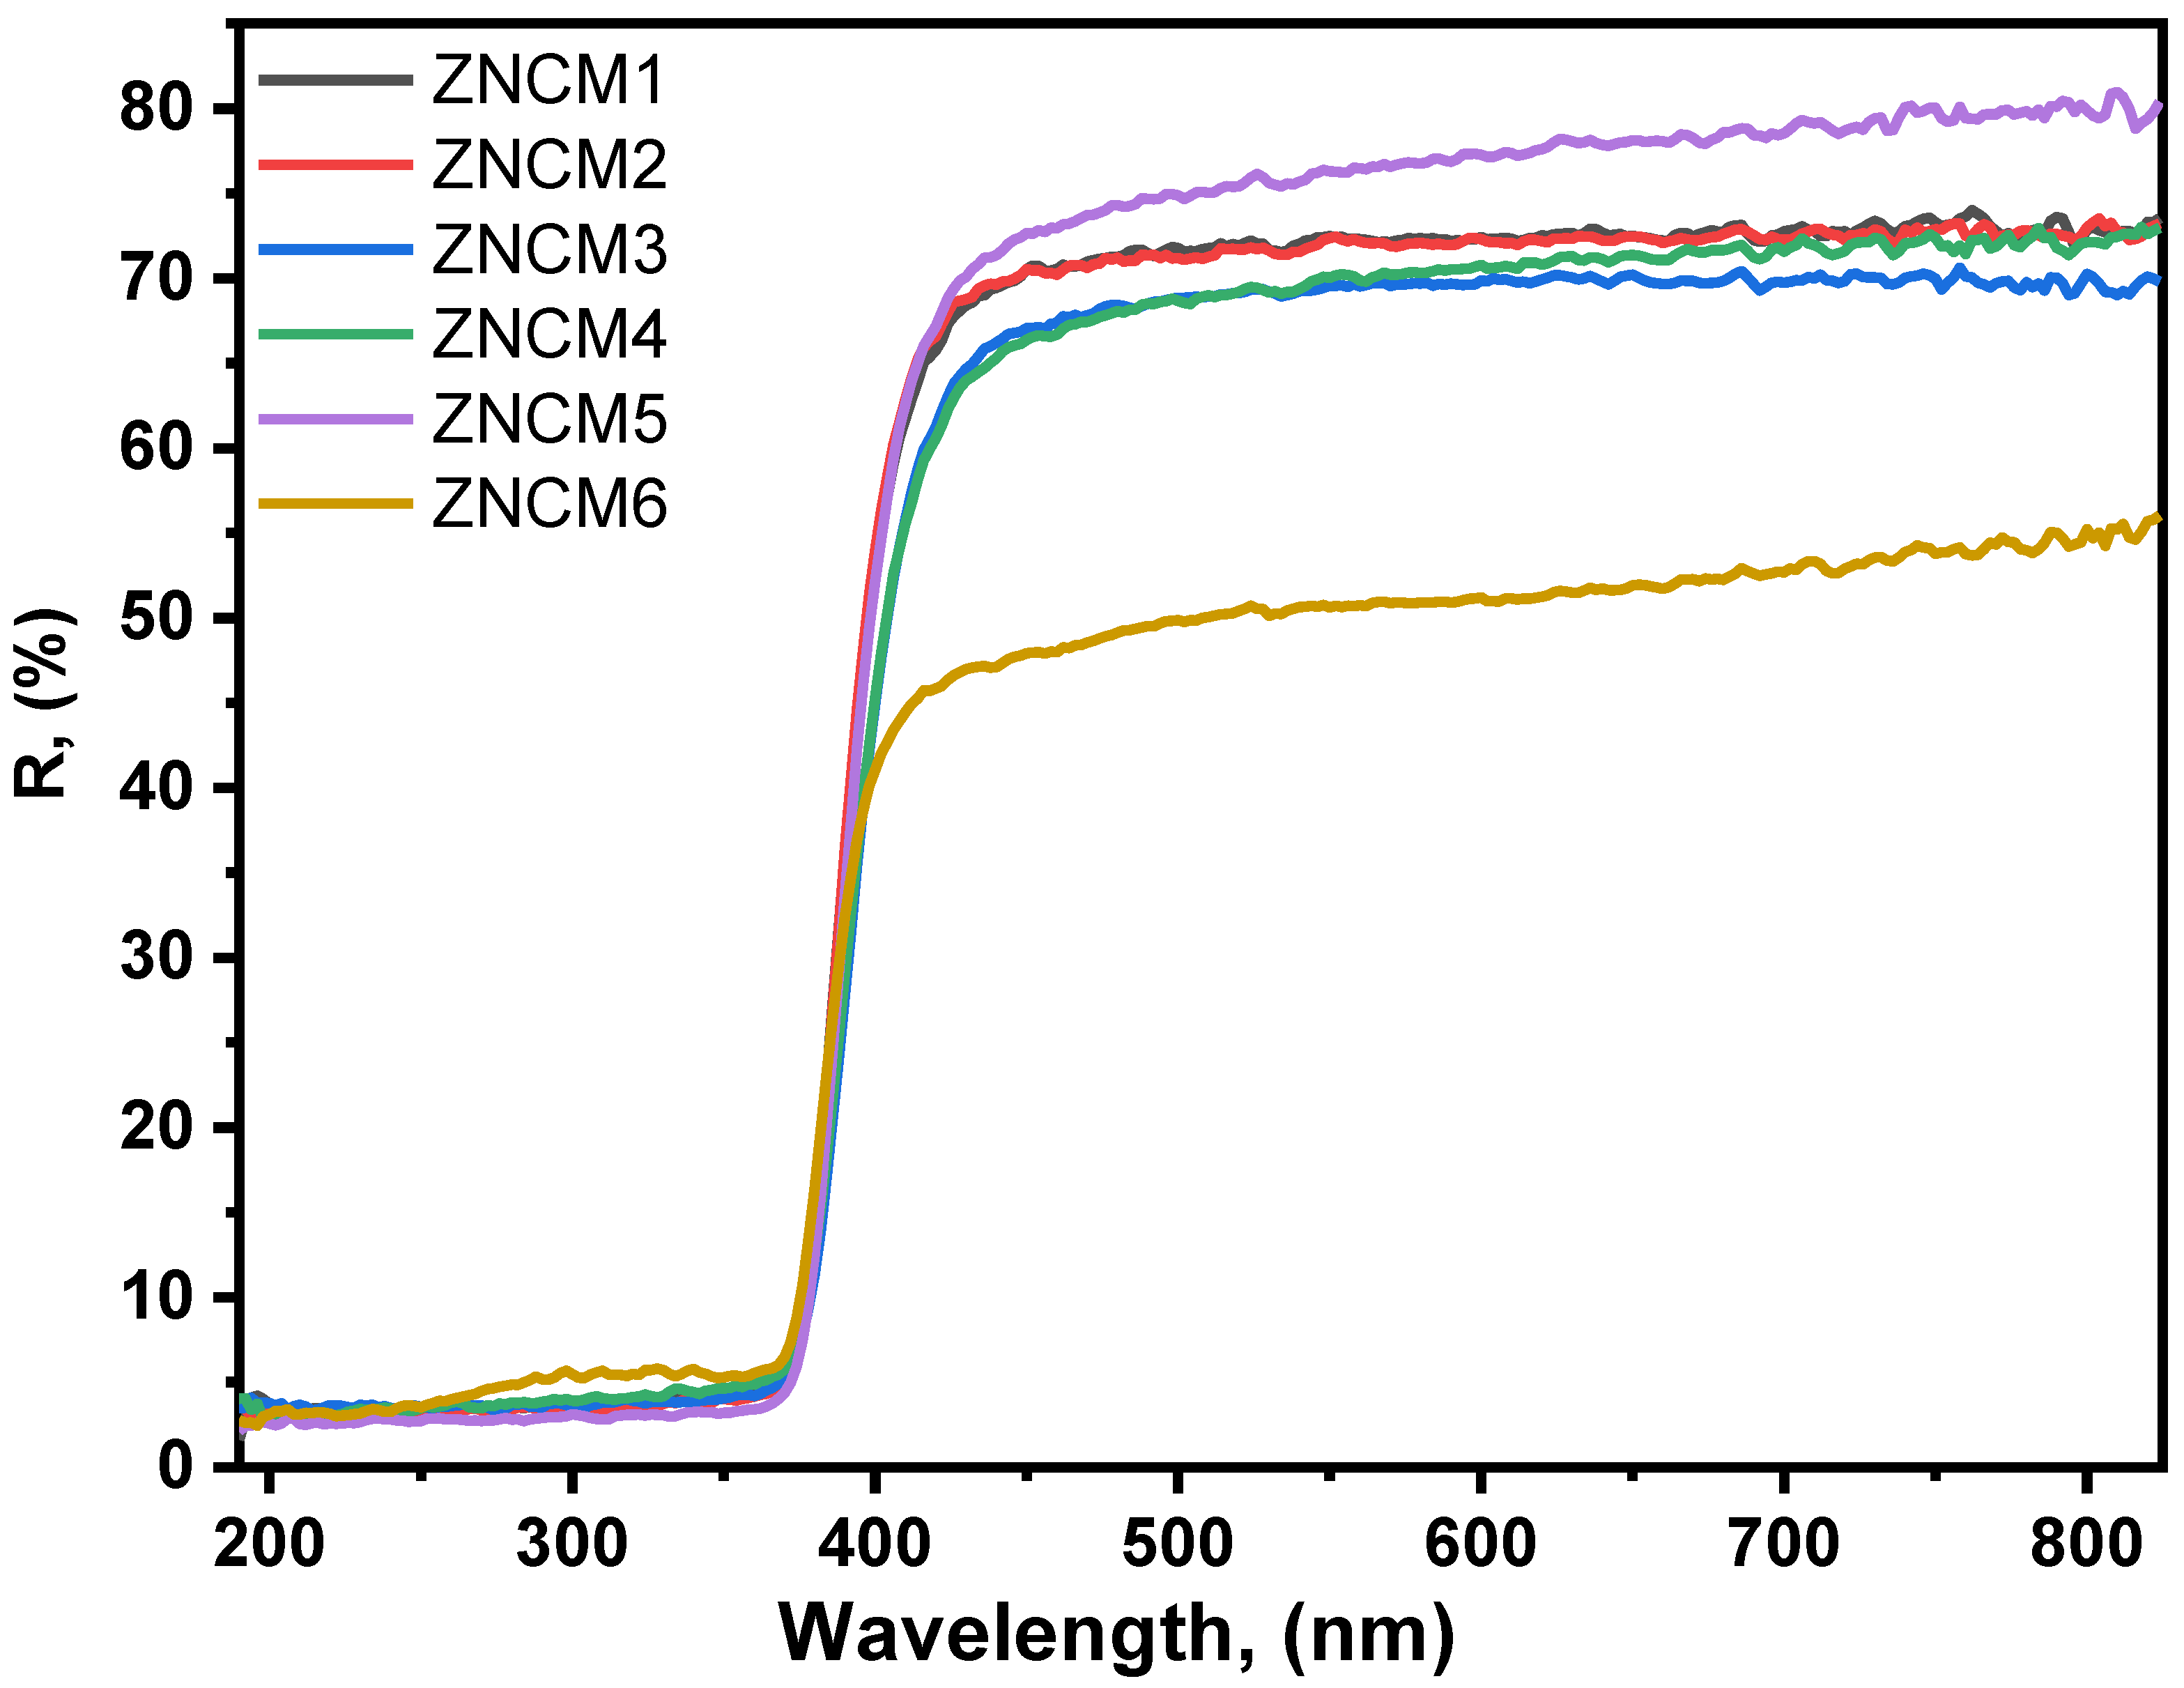
3.3. Diffuse Reflectance Analysis of Mo-Doped ZnO Nanostructures

The Optical Diffuse Reflectance (ODR) spectroscopy is a specialized optical technique for determining the electronic structure of nanostructured materials. Reflection from the loaded samples generated by diffuse illumination is well studied because of its non-destructive nature and ability to generate a mirror-like reflection from loaded samples. To determine the optical bandgap and absorption coefficient of semiconducting material, the ODR technique is used. ODR of undoped and Mo-doped ZnO nanoparticle samples as a function of light wavelength in the range of 200–800 nm are shown in Figure 3. To summarize, the optical bandgaps are produced by the absorption of light through the nanomaterial; the optical energy band gap was calculated using the Kubelka–Munk model [42], which is as follows:
F ( R ) = ( 1 R 2 ) 2 R
where F(R) is the Kubelka–Munk function, and R is the absolute reflectance. The absorption coefficient (α) is calculated by the following equation [21,22]:
α = a b s o r b a n c e t = F ( R ) t
where t is the height of the sample holder, which is equal to 2 mm, and the optical bandgap ( E g   )   is calculated from the following equation:
α h ϑ = ( ( F ( R ) h ϑ ) t ) n = A ( h ϑ E g   )   n
where h is the photon energy, ¦Ô is the photon frequency, h is Planck’s constant, and A is the band tailing factor, has values ranging from 1 × 10⁵ to 1 × 106 cm−1·eV−1. The optical transition (n) values equal 1/2 for the direct bandgap, and the plots (optical band) are shown in Figure 4. The reflectance spectra of all samples were found to be identical in the wavelength range of 200–370 nm. The optical bandgap of the samples was revealed by a sharp increase in the ODR spectra between 370 and 410 nm. In the visible region of 410–800 nm, all ZnO nanoparticles have a high reflectance. ZNCM-1, ZNCM-2, ZNCM-3, ZNCM-4, ZNCM-5, and ZNCM-6 have estimated band gap values of 3.261, 3.259, 3.252, 3.256, 3.246, and 3.235 eV, respectively. E.g., values decrease as Mo-doping concentration increases, which could be due to new energy states between the valence and conduction bands. C. Aydn et al. [43] obtained comparable results for sol-gel prepared ZnO: Fe nanoparticles. ZnO nanoparticles have high reflectance values in the visible region that decrease as dopant concentration increases, indicating that these samples are suitable for electrocatalytic applications under visible light irradiation. Similar decreasing band gap values were observed by Peyman Gholami et al. (2019) [44] on biochar-supported ZnO nanorods in the degradation of Gemifloxacin.

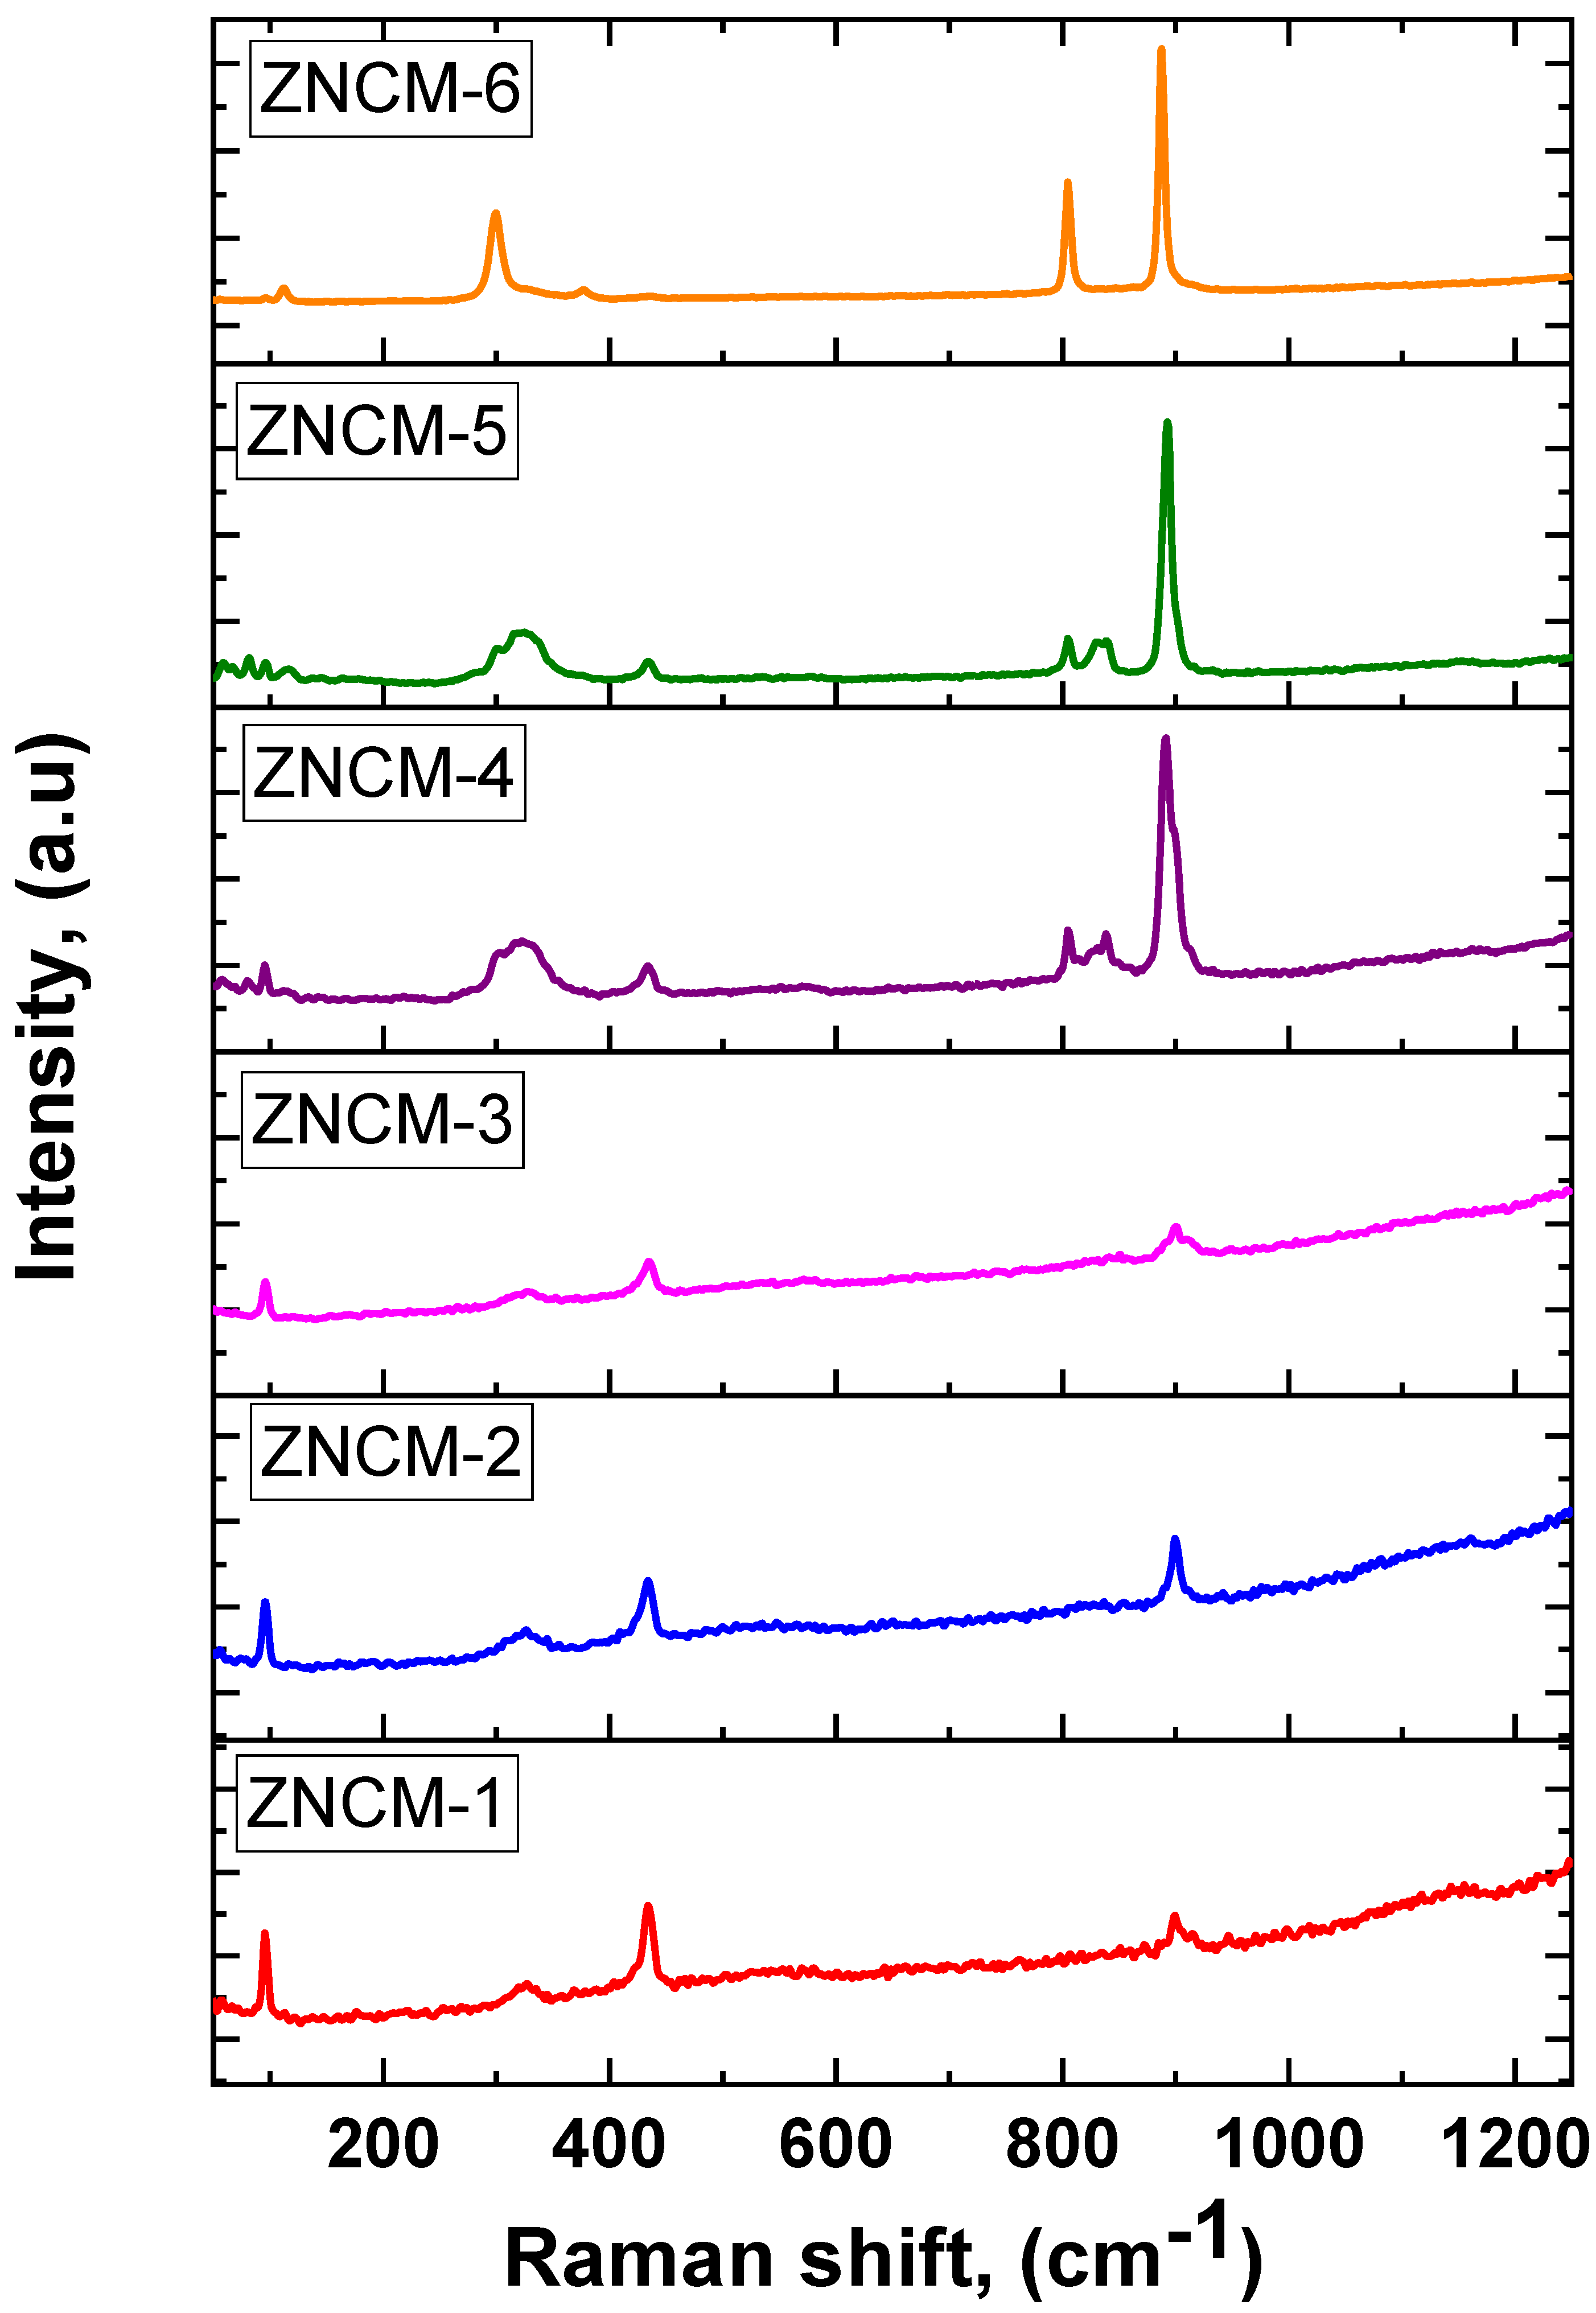
3.4. Raman Spectroscopy of Mo-Doped ZnO Nanostructures

Figure 5 depicts the Raman spectra of pure and Mo-doped ZnO samples. Wurtzite ZnO is an associate of the C6V (P63mc) space group, and its possible vibrational modes [6,37] include U opt = A1 + 2B1 + E1 + 2E2. A1, E1, and E2 are Raman active, while B1 is Raman prohibited. The Raman peaks are observed at 95cm−1, 328, 431, 808, 843, and 903 cm−1, corresponding to E2 low, E2H–E2L, E2 high, E2 low + A1 (TO), E2 high + A1 (TO), and A1 mode, respectively. These findings corroborated previous findings [7,45,46,47,48,49]. A1 and E1 are polar modes that are both infrared and Raman active, whereas E2 is non-polar and only Raman active. E2 high is the peak at 431 cm−1. Wurtzite ZnO’s characteristic peak indicates good crystallinity [50]. The intensity of the E2 high mode decreases as dopant concentration increases, whereas the intensity of the A1 mode increases.

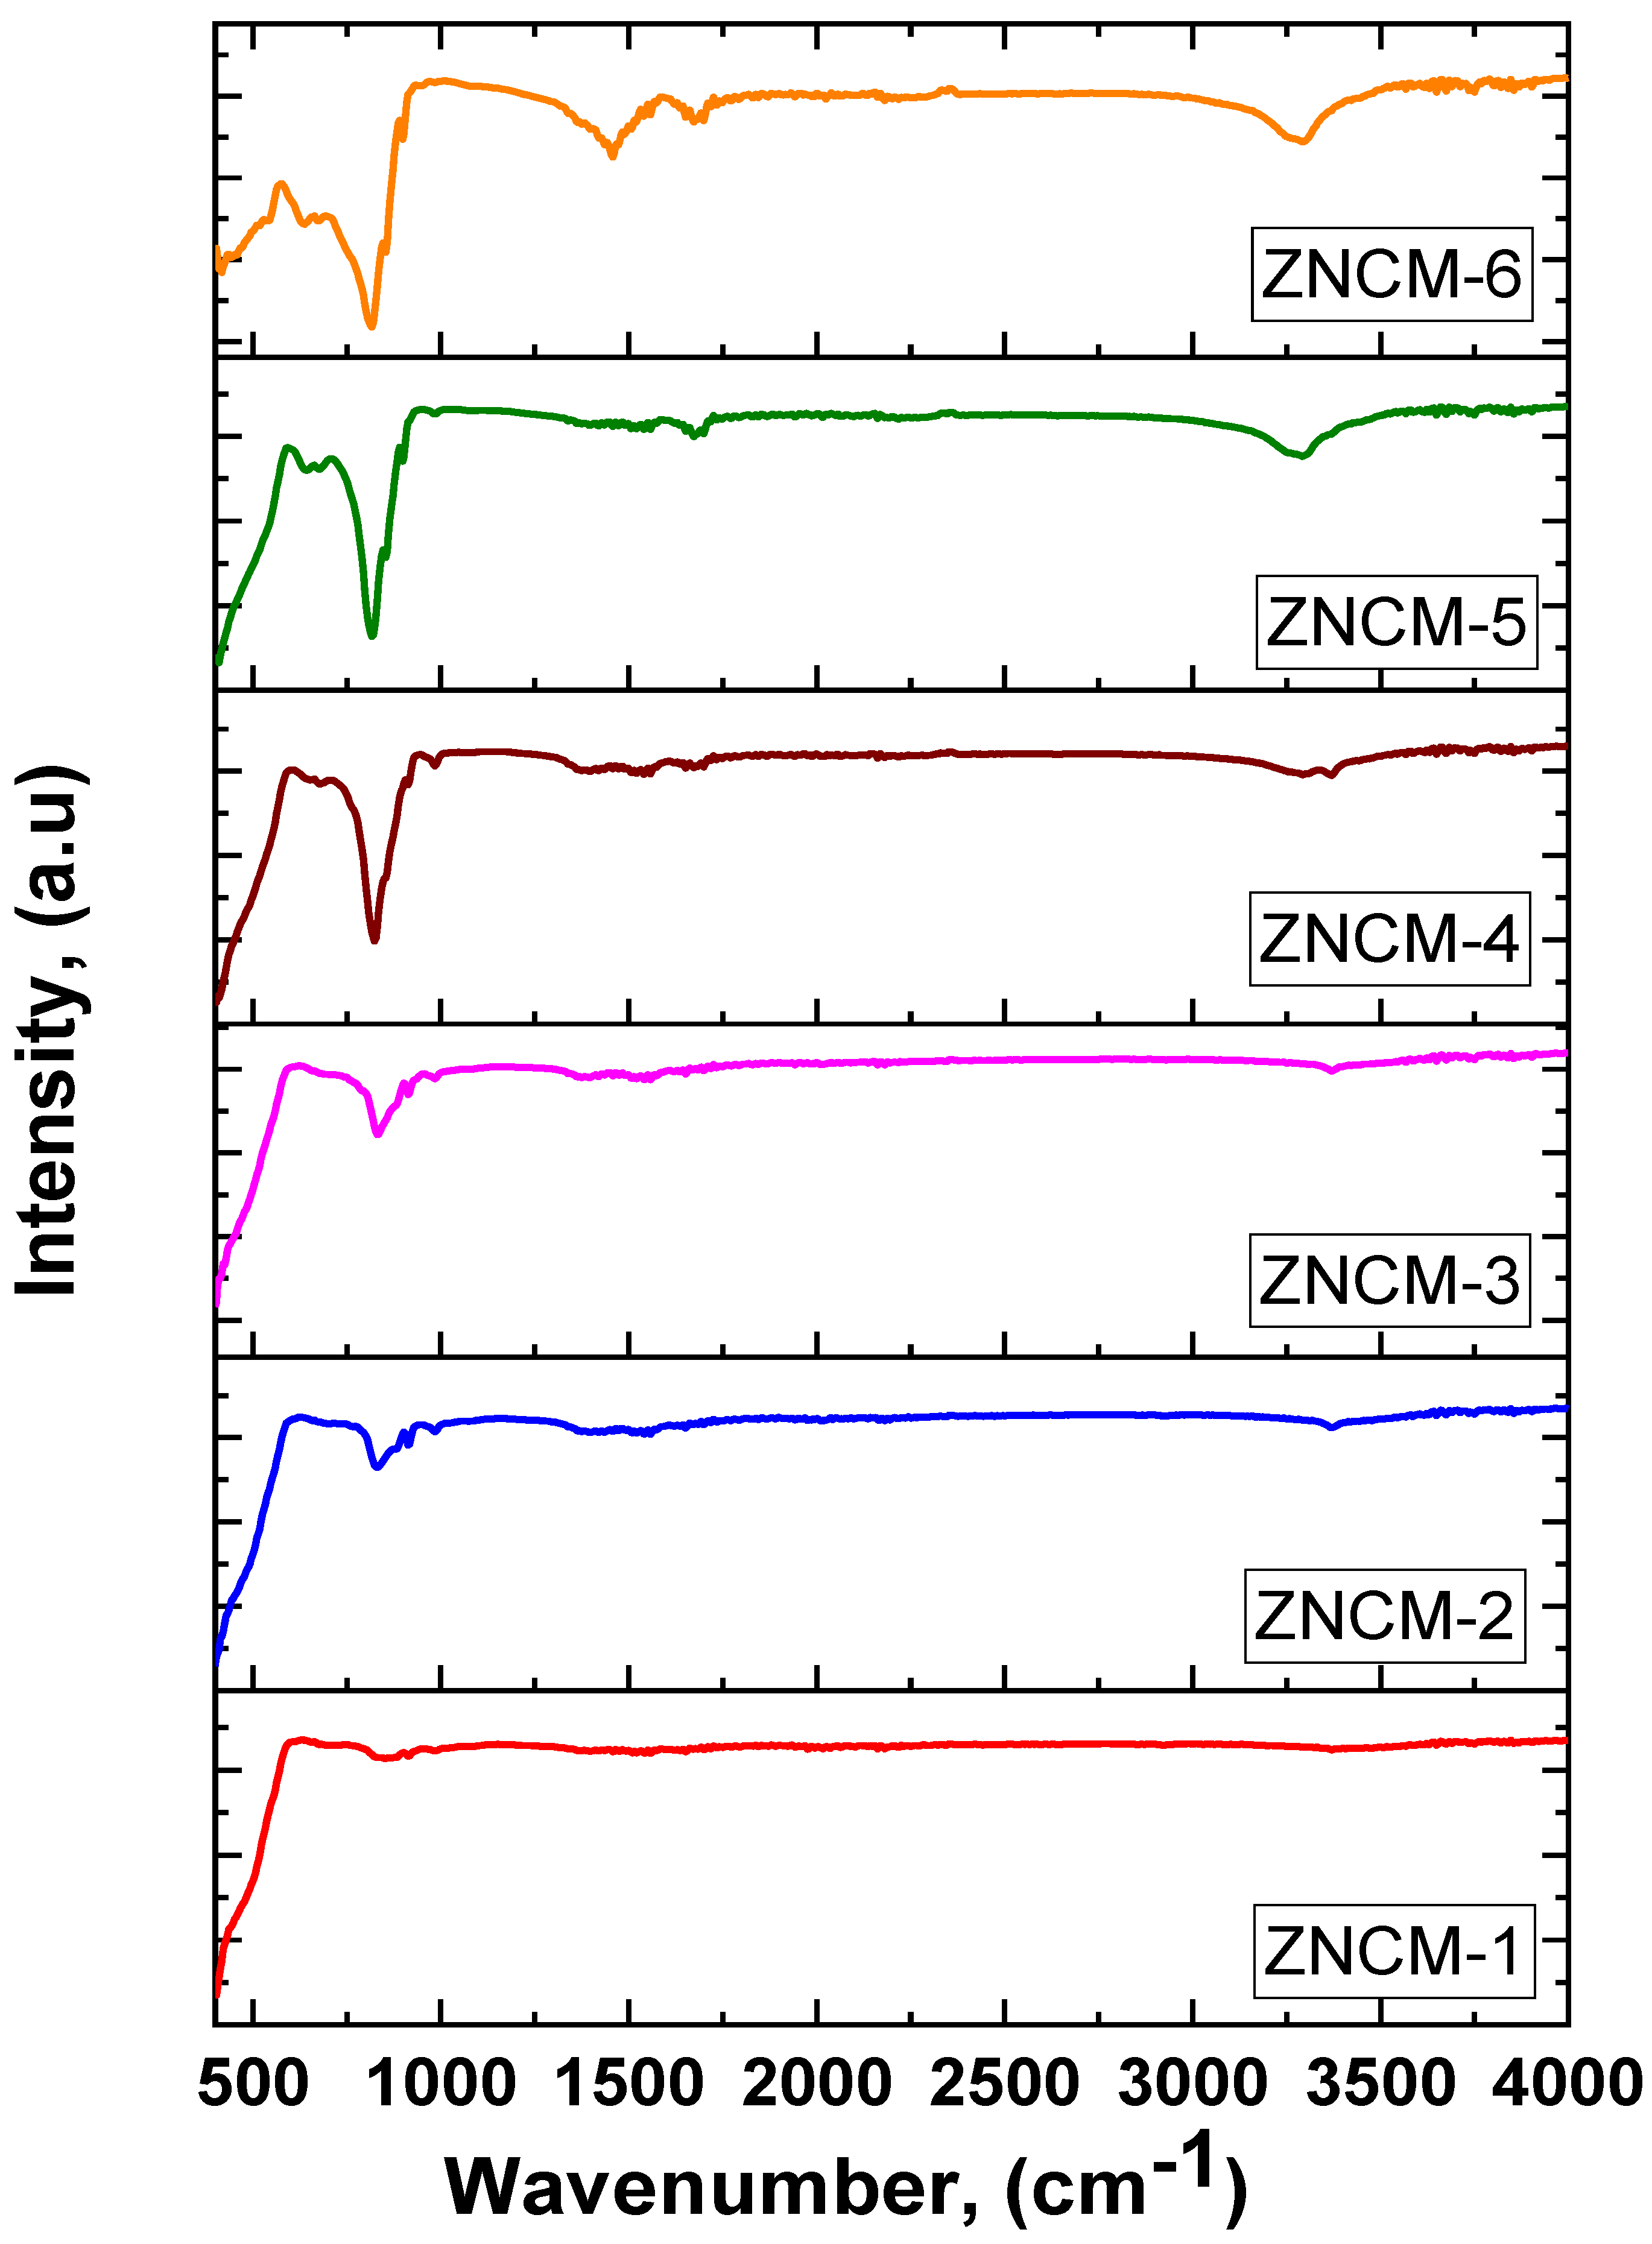
3.5. FT-IR Spectroscopy of Mo-Doped ZnO Nanostructures

The types of bonds and functional groups present in pure and Mo-doped ZnO samples were investigated using FTIR spectra. Figure 6 depicts the FTIR spectra of pure and doped ZnO nanoparticle samples. Zn–O stretching vibration is responsible for the peak at around 440 cm−1. Earlier researchers [51,52] reported characteristic peaks for MoO3 at 553, 876, 995, 1630, and 3445 cm−1. In the current study, we found one such peak at 809 cm−1, and the intensity of this peak increases as dopant concentration increases. Peaks at 1462 and 1675 cm−1 have previously been observed for ZnO nanoparticles and are attributed to asymmetrical and symmetrical stretching of the carboxylate group [53]. The stretching and bending vibrations of surface hydroxyl groups on ZnO were assigned to the peak at around 3280 cm−1. The intensity of this peak increases as dopant concentration increases. These results agree well with the XRD results. The surface area of Mo-doped ZnO samples increases, resulting in more hydroxyl groups on the samples’ surfaces. The Hydroxyl group is important in dye decomposition because it transfers photogenerated holes (h+) to an OH radical [54].

3.6. Dielectric Properties of Mo-Doped ZnO Nanostructures

The dielectric response of the ZnO nano is typically high compared to bulk materials. A surface with a large volume can produce micro-porosities, dangling bonds, and vacancy clusters. All these defects can alter the space charge distribution present in the sample. The electric field’s positive and negative poles attract negative and positive space charge distributions in interfaces. The dipole moments are created when trapped at the defect site because the volume percentage of nano-size sample interfaces is more significant than bulk materials. Because of these essential properties of nanostructured material, the dielectric constant (ε1), dielectric loss (tan δ ), and total AC electrical conductivity ( σ A C . T o t a l ) for pure and Mo-doped ZnO nanomaterials in the range of 1 MHz–10 MHz are illustrated in Figure 7a–c, respectively, using the following equations [47,48]:
ε 1 = C × l   ε 0       × A    
ε 2 =   tan   δ × ε 1   ,
σ A C . T o t a l = l Z × A ,
where the real part of the dielectric constant is ε 1 , and the imaginary component is ε 2 . A represents the electrode area, tan δ represents the loss tangent, C, l, and Z represents the sample capacitance, thickness, and impedance.
σ A C .   T o t a l = σ D C   + B ω s ,   where   σ A C   =     B ω s
The σDC denotes direct current conductivity, B is a constant, ω is the angular frequency, and s is a frequency exponent. The dielectric constant of the present samples decreased with increasing frequency and became saturated at higher frequencies (Figure 7a). The decreasing dielectric constant is explained as a high frequency, and the dipoles do not change in response to changes in the field variations. The decrease in dielectric constant values is caused by interfacial polarization/grain boundaries [40,41]. At lower frequencies, the dielectric constants of ZNCM-1, ZNCM-2, ZNCM-3, ZNCM-4, ZNCM-5, and ZNCM-6 are in the 40–48 range. The dielectric constant is frequency-dependent throughout the frequency range. It rises dramatically as the Mo content increases and stabilizes at high frequencies without significant change, allowing current samples to be used for various microwave device applications [46,55]. The frequency dependence of the dielectric loss with various concentrations of Mo is shown in Figure 7b. The dielectric loss also follows the same trend as the dielectric constant. It decreases with doping concentration at lower frequencies, indicating the dispersion phenomenon. It is worth mentioning that the dielectric constant and loss are purely dependent on Mo-doping concentration, suggesting that present samples found huge applications in microelectronic, sensors, and memory device applications. The electrical conductivity ( σ A C ) gives a different Mo concentration with frequency variation, as shown in Figure 7c. From the figure, the conductivity is increasing with increasing frequency. The increase in conductivity suggests the clear influence of Mo doping in ZnO nanoparticles.

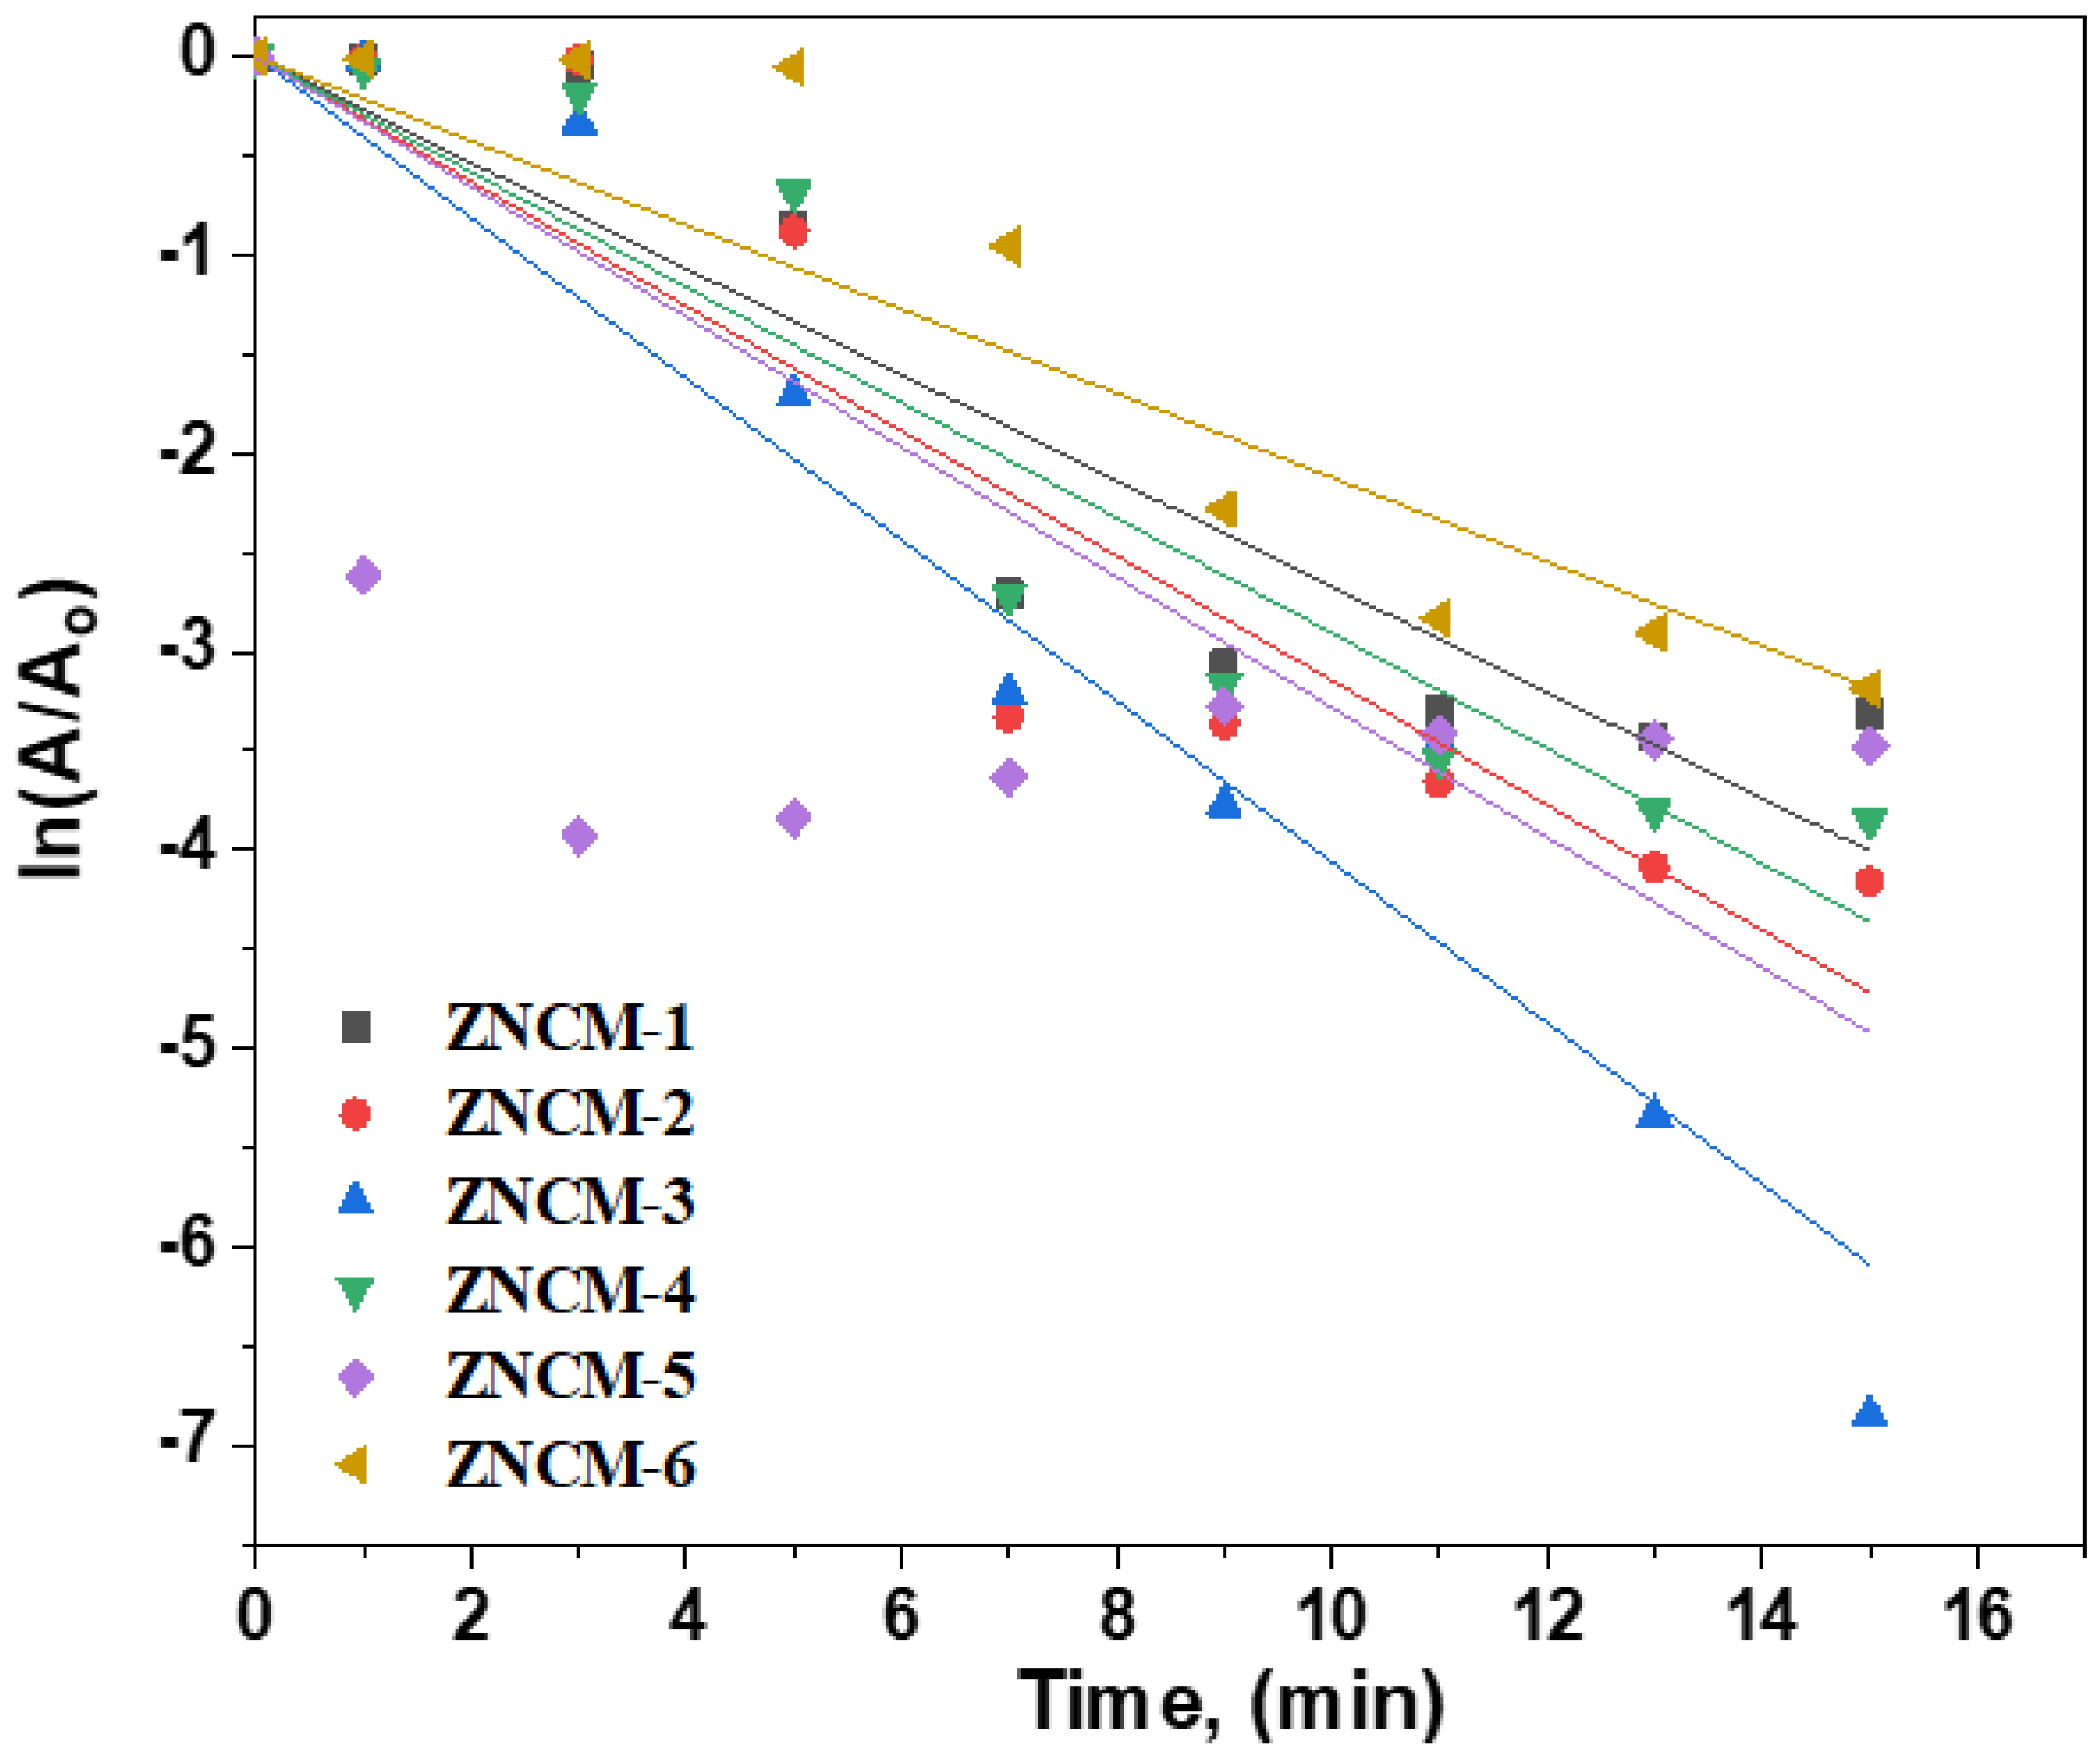
3.7. Kinetic Study of Electrocatalysis of RhB of Mo-Doped ZnO Nanostructures

The electrocatalysis (EC) degradation of RhB dye was thoroughly investigated as a model organic species for the ZNCM electrode. To encourage charge carrier transfer via the external circuit, a voltage of 10 V was applied between the photoanode and cathode in the single-cell reactor. The data collected and recorded throughout the degradation show a decrease in organic species absorbance with reaction time, indicating decreased organic species concentration. In the presence of seven different ZNCM samples, EC degraded RhB. As shown in Figure 8, EC degradation of RhB was consistent with previously reported pseudo-first-order kinetics [53,55,56].
ln(A/Ao) = −kt
The degradation efficiencies were computed using the relationship shown below [57]:
% of degradation = (Ao − At/Ao) × 100%
The initial absorbance is Ao. At is the absorbance at various time intervals is At, K is the rate constant value, and the reaction time is t. In the electrocatalytic reaction, a drop in the height of the absorbance peak at 525 nm wavelength was recorded with an increase in reaction time, providing a degradation efficiency of about 97 percent within 7 min, as shown in Figure 9. In the conduction band, excited electrons interact with electron acceptors to produce reactive species. As a result, the accumulation of electrons at the conduction band’s bottom may slow charge carrier recombination even more. As a result, charge carrier separation is an excellent method for improving the electrocatalytic degradation of RhB [58]. RhB deterioration results demonstrate rapid ZNCM-3 over 7 min, as seen in Figure 9.

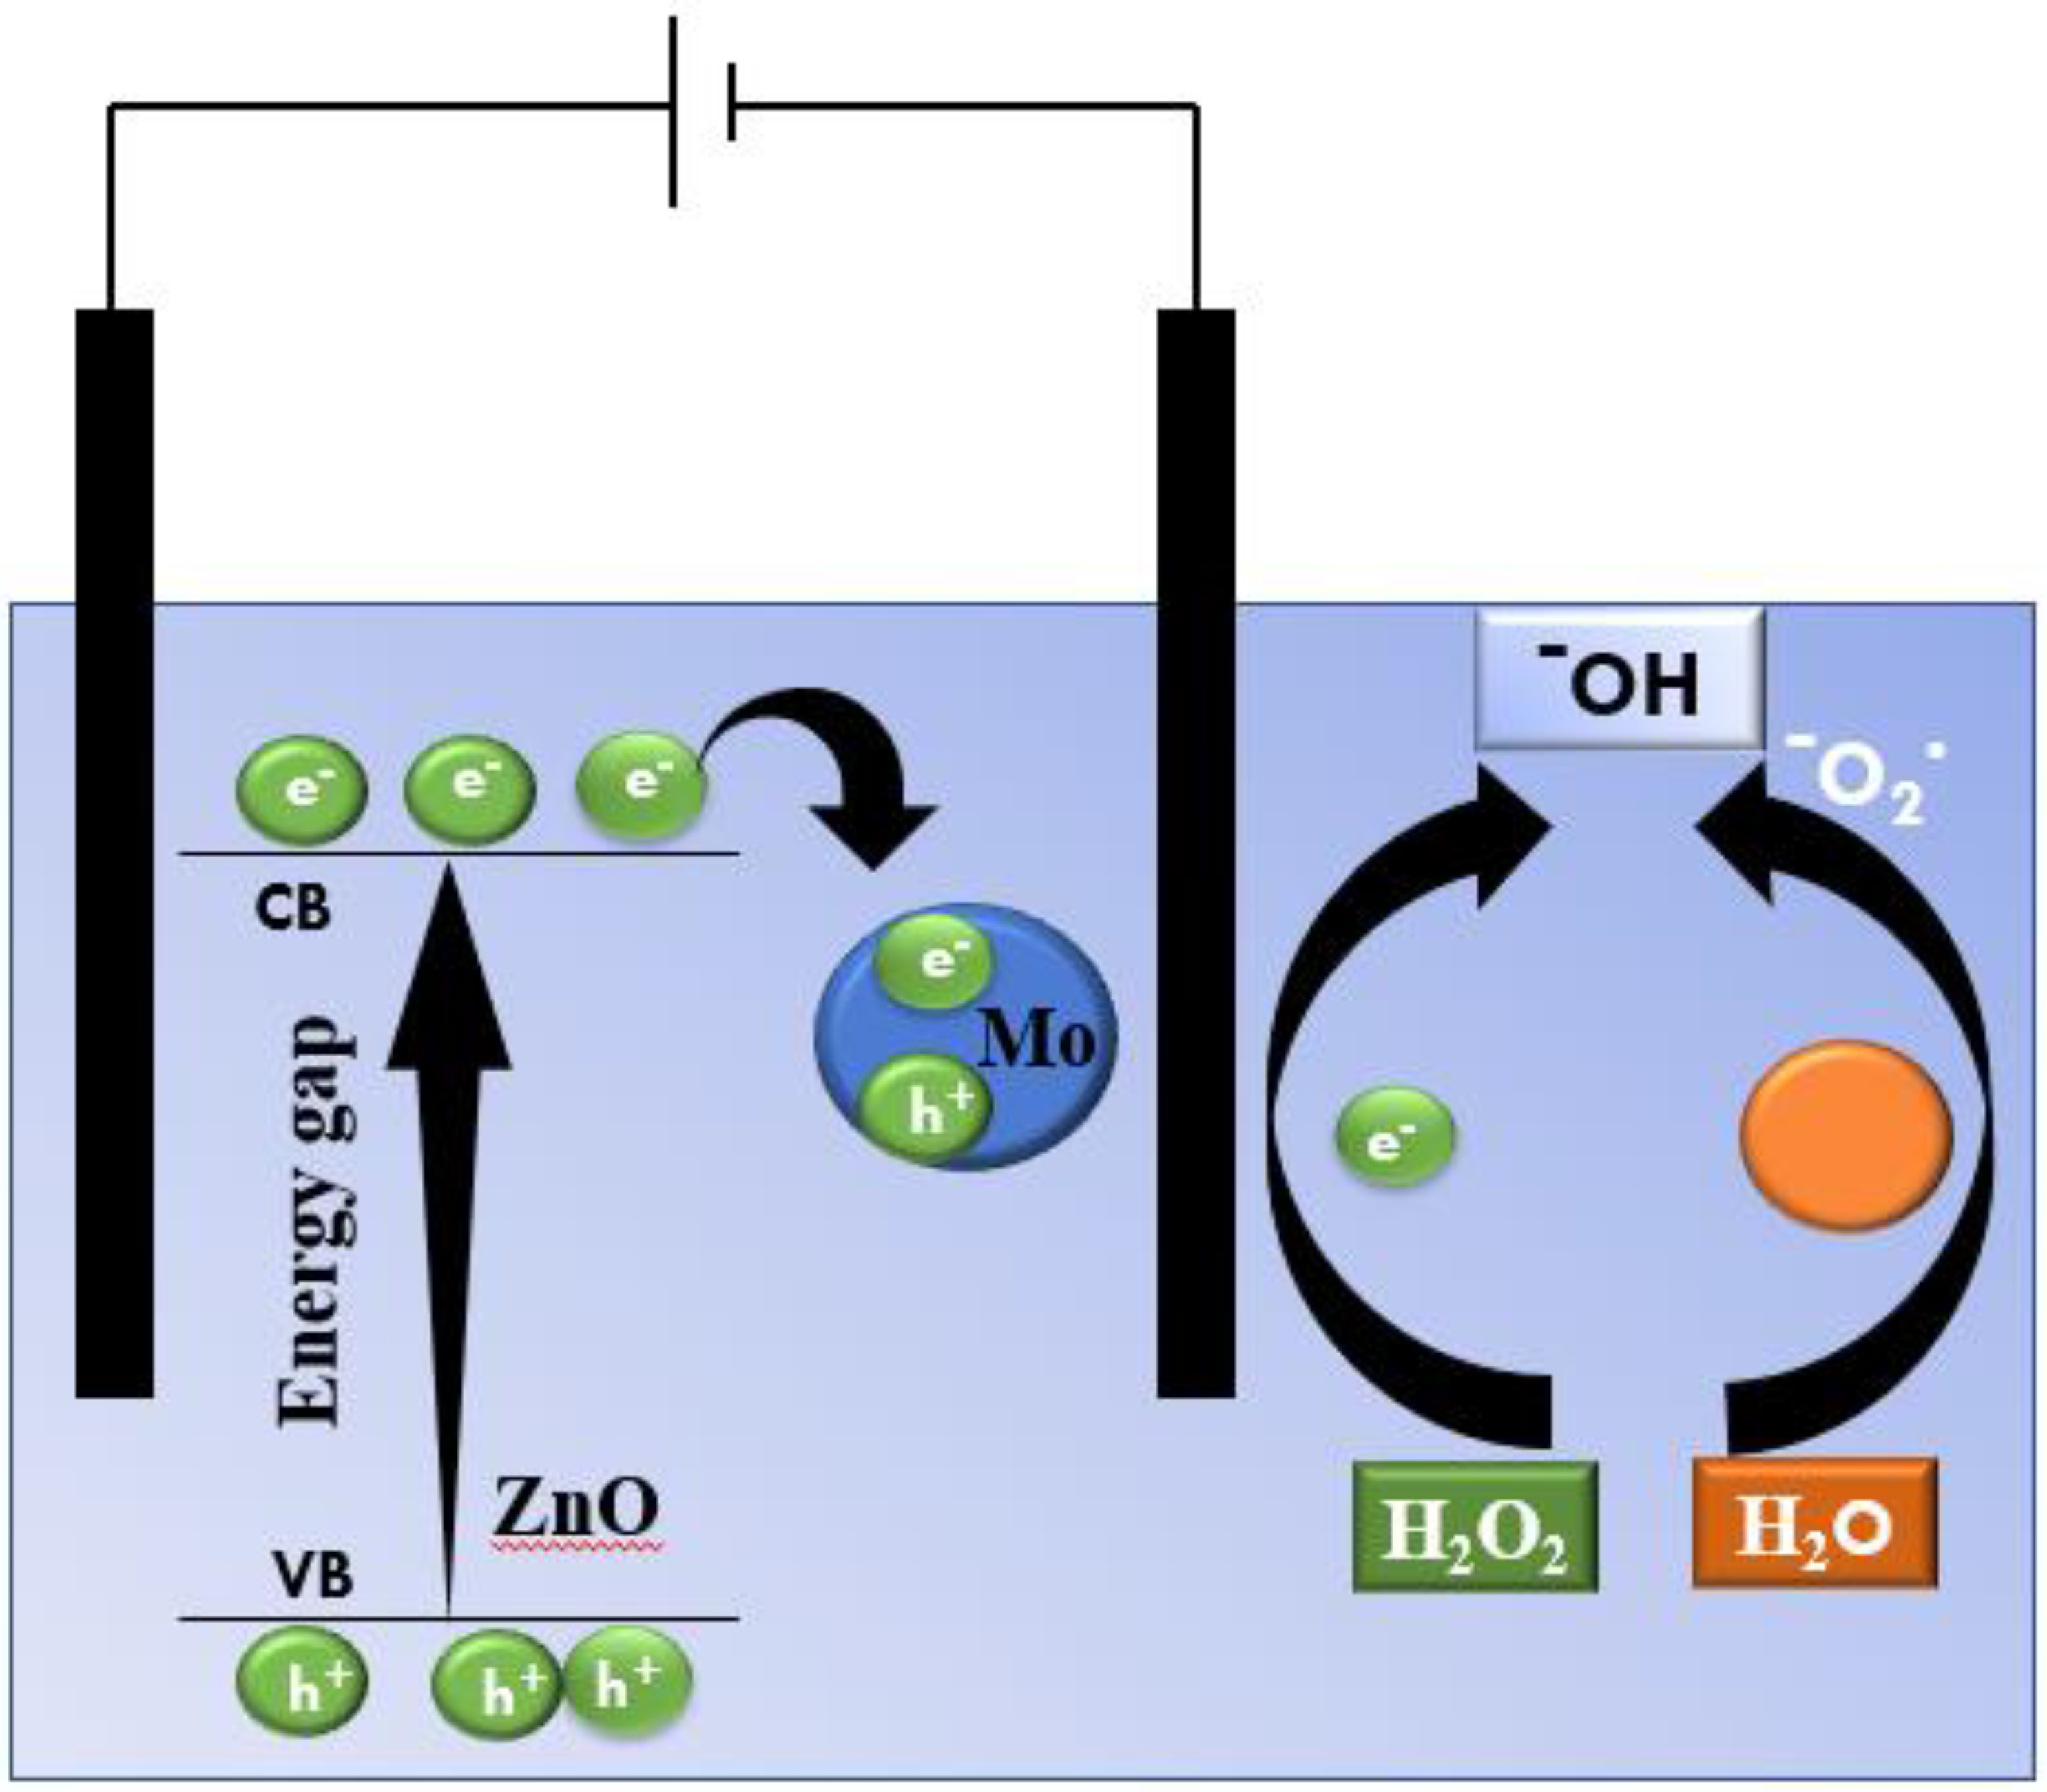
3.7.1. Mechanism of EC of RhB in the Presence of ZNCM

A significant benefit of EC is the influence of electrical energy, which results in better organic pollutant elimination efficiency [51]. Electrons are stimulated to the conduction band by electric charge, whereas empty holes reside in the valence band. When photogenerated holes interact with water molecules, they form powerful oxidants capable of breaking down refractory organic structures. Hydroxyl radicals are the second most powerful oxidants after fluorine due to their high standard reduction potential (Eo OH/H2O) of approximately 2.8 V [59,60]. Unfortunately, photogenerated holes have a short lifetime due to their rapid recombination with electrons, a disadvantage in photocatalysis. However, in EC, an applied bias potential helps push photogenerated electrons away from the anode surface, extending the lifetime of generated holes [61]. Because current creates more holes, more hydroxyl radicals can be generated inside the solution, causing organic molecules to mineralize faster. Other reactive oxygen species are produced inside the reaction system, and the holes and hydroxyl radicals attack organic compounds in EC, which contributes to the mineralization of organic molecules. Superoxide radicals and hydroperoxyl radicals are weaker oxidizing entities [62].
According to previous work, creating a gradient at the ZNCM surface efficiently isolates generated charge carriers, according to previous work [63]. Electrons from the valence band (VB) are stimulated to the conduction band after an electric path more significant than the Eg on the ZNCM, leaving holes in the VB. During the degradation process, electrons pass through the external circuit to counter electro, assisting in forming highly reactive superoxide anion radicals (O2). The valance band holes oxidize water, producing OH radicals interacting with organic contaminants to create a less harmful response. In the case of ZNCM photocatalyst, the primary degradation species are O2 and generated holes (depending on the bonding of the catalyst with the pollutant). The combined impact of electrocatalytic oxidation processes influences ZNCM degradation performance.
As previously mentioned, the following were the probable processes of RhB [64] photodegradation utilizing ZNCM in the presence of EC as mentioned in Scheme 1 and the following equations:
O2 + eO2
O2 + 2H+ + 2e→H2O2
O2 + eO2
O2 + 2H+ + 2e→H2O2
H2O2 + e→OH + OH
(OH/O2) + RhB→products
(h+/H2O2) + RhB→CO2 + H2O

3.7.2. Comparison of PEC of RhB in the Presence of ZNCM with Previous Work

Table 2 compares electrocatalytic degradation of RhB in the presence of ZNCM to other prior study samples, highlighting their contributions to the synthesis technique, electrocatalytic conditions, and RhB concentration under consideration. It was discovered that ZNCM-3 has the highest electron degradation of RhB, with a 0.4 min−1 rate of degradation and 100% degradation in 7 min. Nabil et al. [65] found that CoFe2O4 thin films electrochemically degraded an aqueous solution of rhodamine B (RhB) at a rate of 99 percent within the first three minutes of reaction time. The trapping studies revealed that the dominant active species were hydroxyl radicals, which resulted in the rapid elimination of RhB at an initial concentration of 10 mg/L. Ali et al. [66] investigated the electrochemical oxidation of Rhodamine B dye (RhB) on DSA and SnO2 electrodes as active and non-active electrode models. They discovered that by using the DSA electrode in a NaCl 0.05 mol L1 + Na2SO4 0.1 mol L1 solution as a supporting electrolyte, they could achieve 100% color removal after 90 min of electrolysis. In various operating conditions, DSA outperformed SnO2 and was shown to be more cost-effective and efficient. Zhao et al. [67] concluded that using ZnWO4 films as an anode resulted in a significant synergetic effect in rhodamine B (RhB) degradation via simultaneous electro-oxidation and photocatalysis. They discovered that RhB degradation follows the pseudo-first kinetic equation at bias potentials of 1.0, 1.5, and 2.0 V. The respective rate constants are 0.022, 0.026, and 0.138 hr−1. Furthermore, as the bias increases, the rate of RhB degradation slows. There is almost no deterioration of RhB after the first hour at 3.5 V.
Furthermore, Ahmed et al. [68] electrodeposited hydroxyapatite Ca10(PO4)6(OH)2 on stainless-steel substrates in aqueous solutions of calcium nitrate tetrahydrate and dihydrogen phosphate using the chronopotentiometry mode. They discovered that at time t = 105 min, the ratio Ct/Co decreases by 17% for a current density of 5 mA/cm2 and by 98% for a current density of 30 mA/cm2. A pseudo-first-order kinetics rule guided the degrading mechanism. Chennai et al. [69] discovered that Zn3(PO4)2H2O films (hydrated zinc phosphate, abbreviated h-ZP) are electrodeposited on different substrates and used as active anodes to electrode grade (RhB). It should be noted that after 12 min, the h-ZP/FTO electrodes have 90% RhB degradation. Qin Li et al. [70] developed cerium-doped lead dioxide (TiO2-NTs/Ce-PbO2) that degrades RhB 90 percent in 10 min. Wang et al. demonstrated improved electrocatalytic rhodamine B dye degradation [71]. The heterojunction was created using the sol-gel and hydrothermal methods. After a 5 h reaction time with an applied potential of 4.0 V, the degradation efficiency for eliminating rhodamine B dye was 93.9%.

4. Conclusions

In conclusion, pure and Mo-doped ZnO nanoparticles were prepared via the combustion route. With increasing Mo-dopant concentration, D-value of ZnO decreased. The microstructure of these samples exhibits a highly agglomerated and soapy porous structure. The ZnO nanoparticles exhibit high reflectance values in the visible region. The reflectance values of these samples decrease with the increase in dopant concentration. ZNCM-1, ZNCM-2, ZNCM-3, ZNCM-4, ZNCM-5, and ZNCM-6 have estimated band gap values of 3.261, 3.259, 3.252, 3.256, 3.246, and 3.235 eV, respectively. Eg values decrease as Mo-doping concentration increases. At lower frequencies, the dielectric constants of ZNCM-1, ZNCM-2, ZNCM-3, ZNCM-4, ZNCM-5, and ZNCM-6 are in the 40–48 range. In the case of ZNCM photocatalyst, the main degradation species are O2 and generated holes (depending on the bonding of the catalyst with the pollutant). The combined impact of electrocatalytic oxidation processes influences ZNCM degradation performance. The dielectric constant is frequency-dependent throughout the frequency range. ZNCM-3 was a promising nanoparticle in EC of rhodamine b with 0.4 min−1 exhibited 100% degradation in 7 min.

Author Contributions

Conceptualization, V.G., M.S.A.H. and I.S.Y.; methodology, U.P.S., R.A. and M.I.M.; formal analysis, T.H.A., H.Y.Z. and M.S.A. investigation, M.S.A. and I.S.Y.; writing—original draft preparation, V.G., M.S.A.H. and M.S.A.; writing—review and editing, I.S.Y. and H.Y.Z.; visualization, T.H.A., R.A. and M.I.M.; funding acquisition, I.S.Y. and V.G. All authors have read and agreed to the published version of the manuscript.

Funding

The authors extend their appreciation to the Deputyship for Research & Innovation, Ministry of Education in Saudi Arabia, for funding this research work, project number IFP-KKU-2020/6.

Institutional Review Board Statement

Not applicable.

Informed Consent Statement

Not applicable.

Data Availability Statement

Data are contained within the manuscript.

Conflicts of Interest

The authors declare no conflict of interest.

References

  1. Ravichandran, K.; Dhanraj, C.; Ibrahim, M.M.; Kavitha, P. Enhancing the electrocatalytic efficiency of ZnO thin films by adding Mo and rGO. Mater. Today Proc. 2022, 48, 234–244. [Google Scholar] [CrossRef]
  2. Saravanan, R.; Mansoob Khan, M.; Gupta, V.K.; Mosquera, E.; Gracia, F.; Narayanan, V.; Stephen, A. ZnO/Ag/CdO nanocomposite for visible light-induced electrocatalytic degradation of industrial textile effluents. J. Colloid Interface Sci. 2015, 452, 126–133. [Google Scholar] [CrossRef] [PubMed]
  3. Thejaswini, T.V.L.; Prabhakaran, D.; Maheswari, M.A. Soft synthesis of potassium co-doped Al–ZnO nanocomposites: A comprehensive study on their visible light driven electrocatalytic activity on dye degradation. J. Mater. Sci. 2016, 51, 8187–8208. [Google Scholar] [CrossRef]
  4. Bizarro, M. High electrocatalytic activity of ZnO and ZnO: Al nanostructured films deposited by spray pyrolysis. Appl. Catal. B Environ. 2010, 97, 198–203. [Google Scholar] [CrossRef]
  5. Bizarro, M.; Martínez-Padilla, E. Visible light responsive electrocatalytic ZnO: Al films decorated with Ag nanoparticles. Thin Solid Films. 2014, 553, 179–183. [Google Scholar] [CrossRef]
  6. Luo, Y.; Wu, Y.; Huang, C.; Menon, C.; Feng, S.-P.; Chu1, P.K. Plasma modified and tailored defective electrocatalysts for water electrolysis and hydrogen fuel cells. EcoMat 2022, 4, e12197. [Google Scholar] [CrossRef]
  7. Shaik, U.P.; Kumar, P.A.; Krishna, M.G.; Rao, S.V. Morphological manipulation of the nonlinear optical response of ZnO thin films grown by thermal evaporation. Mater. Res. Express 2014, 1, 046201. [Google Scholar] [CrossRef]
  8. Yan, R.; Gargas, D.; Yang, P. Nanowire photonics. Nat. Photon. 2009, 3, 569. [Google Scholar] [CrossRef]
  9. Özgür, Ü.; Alivov, Y.I.; Liu, C.; Teke, A.; Reshchikov, M.A.; Doğan, S.; Avrutin, V.; Cho, S.J.; Morkoç, H.J. A comprehensive review of ZnO materials and devices. Appl. Phys. 2005, 98, 041301. [Google Scholar] [CrossRef]
  10. Panda, D.; Tseng, T.-Y. One-dimensional ZnO nanostructures: Fabrication, optoelectronic properties, and device applications. J. Mater. Sci. 2013, 48, 6849. [Google Scholar] [CrossRef]
  11. Dhara, S.; Giri, P.K. ZnO nanowire heterostructures: Intriguing photophysics and emerging applications. Rev. Nanosci. Nanotech. 2013, 2, 1. [Google Scholar] [CrossRef]
  12. Shaik, U.P.; Krishna, G.M. Single-step formation of indium and tin-doped ZnO nanowires by thermal oxidation of indium–zinc and tin–zinc metal films: Growth and optical properties. Ceram. Int. 2014, 40, 13611–13620. [Google Scholar] [CrossRef]
  13. Jose, A.; Devi, K.R.S.; Pinheiro, S.; Narayana, S.L. Electrochemical synthesis, photodegradation and antibacterial properties of PEG capped zinc oxide nanoparticles. J. Photochem. Photobiol. B Biol. 2018, 187, 25–34. [Google Scholar] [CrossRef]
  14. Fan, L.; Song, H.; Li, T.; Yu, L.; Liu, Z.; Pan, G.; Lei, Y.; Bai, X.; Wang, T.; Zheng, Z.; et al. Hydrothermal synthesis and photoluminescent properties of ZnO nanorods. J. Lumin. 2007, 122, 819–821. [Google Scholar] [CrossRef]
  15. Yiamsawas, D.; Boonpavanitchakul, K.; Kangwansupamonkon, W. Preparation of ZnO Nanostructures by Solvothermal Method. J. Microsc. Soc. 2009, 23, 75–78. [Google Scholar]
  16. Singhal, M.; Cbbabra, V.; Kang, P.; Shah, D.O. Pergamon PI1 SOO2s-5408(96)00175-4 synthesis of ZnO nanoparticles for varistor application using zn-substituted aerosol ot microemulsion. Mater. Res. Bull. 1997, 32, 239–247. [Google Scholar] [CrossRef]
  17. Rataboul, F.; Nayral, C.; Casanove, M.-J.; Maisonnat, A.; Chaudret, B. Synthesis and characterization of monodisperse zinc and zinc oxide nanoparticles from the organometallic. J. Organomet. Chem. 2002, 643, 307–312. [Google Scholar] [CrossRef]
  18. Moghaddam, A.B.; Nazari, T.; Badraghi, J.; Kazemzad, M. Synthesis of ZnO nanoparticles and electrodeposition of polypyrrole/ZnO nanocomposite film. Int. J. Electrochem. Sci. 2009, 4, 247–257. [Google Scholar]
  19. Hu, X.L.; Zhu, Y.J.; Wang, S.W. Sonochemical and microwave-assisted synthesis of linked single-crystalline ZnO rods. Mater. Chem. Phys. 2004, 88, 421–426. [Google Scholar] [CrossRef]
  20. Wu, J.J.; Wu, J.J.; Liu, S.C.; Liu, S.C. Low-temperature growth of well-aligned ZnO nanorods by chemical vapor deposition. Synth. Met. 1999, 102, 1091. [Google Scholar] [CrossRef]
  21. Okuyama, K.; Lenggoro, W.W. Preparation of nanoparticles via spray route. Chem. Eng. Sci. 2003, 58, 537–547. [Google Scholar] [CrossRef]
  22. Talam, S.; Karumuri, S.R.; Gunnam, N. Synthesis, Characterization, and Spectroscopic Properties of ZnO Nanoparticles. Int. Sch. Res. Not. 2012, 2012, 1–6. [Google Scholar] [CrossRef] [Green Version]
  23. Ananda, S.S. Synthesis and Characterization of Mo-Doped ZnO Nanoparticles by Electrochemical Method: Photodegradation Kinetics of Methyl Violet Dye and Study of Antibacterial Activities of Mo-Doped ZnO Nanoparticles. Int. J. Nanomater. Biostruct. 2015, 5, 7–14. [Google Scholar]
  24. Tachikawa, S.; Noguchi, A.; Tsuge, T.; Hara, M.; Odawara, O.; Wada, H. Optical properties of ZnO nanoparticles capped with polymers. Materials 2011, 4, 1132–1143. [Google Scholar] [CrossRef]
  25. Vargas, M.A.; Rivera-Muñoz, E.M.; Diosa, J.E.; Mosquera, E.E.; Rodríguez-Páez, J.E. Nanoparticles of ZnO and Mg-doped ZnO: Synthesis, characterization and efficient removal of methyl orange (MO) from aqueous solution. Ceram. Int. 2021, 47, 15668–15681. [Google Scholar] [CrossRef]
  26. Ren, K.; Shu, H.; Huo, W.; Cui, Z.; Xu, Y. Tuning electronic, magnetic and catalytic behaviors of biphenylene network by atomic doping. Nanotechnology 2022, 33, 345701. [Google Scholar] [CrossRef]
  27. Mohammadi, R.; Alamgholiloo, H.; Gholipour, B.; Rostamnia, S.; Khaksar, S.; Farajzadeh, M.; Shokouhimehr, M. Visible-light-driven photocatalytic activity of ZnO/g-C3N4 heterojunction for the green synthesis of biologically interest small molecules of thiazolidinones. J. Photochem. Photobiol. A Chem. 2020, 402, 112786. [Google Scholar] [CrossRef]
  28. Doustkhah, E.; Esmat, M.; Fukata, N.; Ide, Y.; Hanaor, D.A.; Assadi, M.H. MOF-derived nanocrystalline ZnO with controlled orientation and photocatalytic activity. Chemosphere 2022, 303, 134932. [Google Scholar] [CrossRef]
  29. Sushma, C.; Girish Kumar, S. Advancements in the zinc oxide nanomaterials for efficient photocatalysis. Chem. Pap. 2017, 71, 2023–2042. [Google Scholar] [CrossRef]
  30. Jyothi, N.S.; Ravichandran, K. Optimum pH for effective dye degradation: Mo, Mn, Co and Cu doped ZnO photocatalysts in thin film form. Ceram. Int. 2020, 46, 23289–23292. [Google Scholar] [CrossRef]
  31. Xiu, X.; Pang, Z.; Lv, M.; Dai, Y.; Ye, L.; Han, S. Transparent conducting molybdenum-doped zinc oxide films deposited by RF magnetron sputtering. Appl. Surf. Sci. 2007, 253, 3345–3348. [Google Scholar] [CrossRef]
  32. Zhang, D.H.; Yang, T.L.; Ma, J.; Wang, Q.P.; Gao, R.W.; Ma, H.L. Preparation of transparent conducting ZnO: Al films on polymer substrates by rf magnetron sputtering. Appl. Surf. Sci. 2000, 158, 43. [Google Scholar] [CrossRef]
  33. Meng, Y.; Yang, X.L.; Chen, H.X.; Shen, J.; Jiang, Y.M.; Zhang, Z.J.; Hua, Z.Y. A new transparent conductive thin film In2O3: Mo. Thin Solid Film. 2001, 394, 219. [Google Scholar] [CrossRef]
  34. Cullity, B.D. Elements of X-ray Diffraction; Addison Wesley: Reading, MA, USA, 1956. [Google Scholar]
  35. Umar, K.; Aris, A.; Parveen, T.; Jaafar, J.; Majid, Z.A.; Reddy, A.V.; Talib, J. Synthesis, characterization of Mo and Mn doped ZnO and their photocatalytic activity for the decolorization of two different chromophoric dyes. Appl. Catal. A Gen. 2015, 505, 507–514. [Google Scholar] [CrossRef]
  36. Prashanth, G.K.; Prashanth, P.A.; Bora, U.; Gadewar, M.; Nagabhushana, B.M.; Ananda, S.; Krishnaiah, G.M.; Sathyananda, H.M. In vitro antibacterial and cytotoxicity studies of ZnO nanopowders prepared by combustion assisted facile green synthesis. Karbala Int. J. Mod. Sci. 2015, 1, 67–77. [Google Scholar]
  37. Nehru, L.C.; Swaminathan, V.; Sanjeeviraja, C. Rapid synthesis of nanocrystalline ZnO by a microwave-assisted combustion method. Powder Technol. 2012, 226, 29–33. [Google Scholar] [CrossRef]
  38. Naik, E.I.; Naik, H.S.B.; Swamy, B.E.K.; Viswanath, R.; Suresh Gowda, I.K.; Prabhakara, M.C.; Chetankumar, K. Influence of Cu doping on ZnO nanoparticles for improved structural, optical, electrochemical properties and their applications in efficient detection of latent fingerprints. Chem. Data Collect. 2021, 33, 100671. [Google Scholar] [CrossRef]
  39. Swapna, R.; Santhosh Kumar, M.C. Growth and characterization of molybdenum doped ZnO thin films by spray pyrolysis. J. Phys. Chem. Solids 2013, 74, 418–425. [Google Scholar] [CrossRef]
  40. Kaleemulla, S.; Rao, N.M.; Joshi, M.G.; Reddy, A.S.; Uthanna, S.; Reddy, P.S. Electrical and optical properties of In2O3: Mo thin films prepared at various Mo-doping levels. J. Alloys. Compd. 2010, 504, 351. [Google Scholar] [CrossRef]
  41. Pascariu, P.; Homocianu, M.; Olaru, N.; Airinei, A.; Ionescu, O. New Electrospun ZnO:MoO3 Nanostructures: Preparation, Characterization and Electrocatalytic Performance. Nanomaterials 2020, 10, 1476. [Google Scholar] [CrossRef]
  42. Rao, T.P.; Santhoshkumar, M.C.; Safarulla, A.; Ganesan, V.; Barman, S.R.; Sanjeeviraja, C. Physical properties of ZnO thin films deposited at various substrate temperatures using spray pyrolysis. Phys. B Condensed Matter 2010, 405, 2226. [Google Scholar]
  43. Aydın, C.; Abd El-Sadek, M.S.; Zheng, K.; Yahia, I.S.; Yakuphanoglu, F. Synthesis, diffused reflectance and electrical properties of nanocrystalline Fe-doped ZnO via sol-gel calcination technique. Opt. Laser Technol. 2013, 48, 447–452. [Google Scholar] [CrossRef]
  44. Gholami, P.; Dinpazhoh, L.; Khataee, A.; Orooji, Y. Sonocatalytic activity of biochar-supported ZnO nanorods in degradation of gemifloxacin: Synergy study, effect of parameters and phytotoxicity evaluation. Ultrason. Sonochem. 2019, 55, 44–56. [Google Scholar] [CrossRef] [PubMed]
  45. Rajalakshmi, M.; Arora, A.K.; Bendre, B.S.; Mahamuni, S.J. Optical Phonon Confinement in Zinc oxide nanoparticles. Appl. Phys. 2000, 87, 2445. [Google Scholar] [CrossRef]
  46. Pavithra, N.S.; Lingaraju, K.; Raghu, G.K.; Nagaraju, G. Citrus maxima (Pomelo) juice mediated eco-friendly synthesis of ZnO nanoparticles: Applications to electrocatalytic, electrochemical sensor and antibacterial activities. Spectrochim. Acta Part A Mol. Biomol. Spectrosc. 2017, 185, 11–19. [Google Scholar] [CrossRef]
  47. Sánchez Zeferino, R.; Barboza Flores, M.; Pal, U. Photoluminescence and Raman Scattering in Ag-doped ZnO Nanoparticles. J. Appl. Phys. 2011, 109, 014308. [Google Scholar] [CrossRef]
  48. Sharma, A.; Singh, B.P.; Dhar, S.; Gondorf, A.; Spasova, M. Effect of surface groups on the luminescence property of ZnO nanoparticles synthesized by sol-gel route. Surf. Sci. 2012, 606, L13–L17. [Google Scholar] [CrossRef]
  49. Muravitskaya, A.; Rumyantseva, A.; Kostcheev, S.; Dzhagan, V.; Stroyuk, O.; Adam, P.-M. Enhanced Raman scattering of ZnO nanocrystals in the vicinity of gold and silver nanostructured surfaces. Opt. Express 2016, 24, A168–A173. [Google Scholar] [CrossRef]
  50. Yu, C.; Yang, K.; Shu, Q.; Yu, J.C.; Cao, F.; Li, X.; Zhou, X. Preparation, characterization, and electrocatalytic performance of Mo-doped ZnO photocatalysts. Sci. China Chem. 2012, 55, 9. [Google Scholar] [CrossRef]
  51. Chen, Y.P.; Lu, C.; Xu, L.; Ma, Y.; Hou, W.H.; Zhu, J.J. Single-crystallineorthorhombic molybdenum oxide nanobelts: Synthesis and electrocatalytic properties. CrystEngComm 2010, 12, 3740–3747. [Google Scholar] [CrossRef]
  52. Xiong, G.; Pal, U.; Serrano, J.G.; User, K.B.; Williams, K.B. Photoluminescence and FTIR study of ZnO nanoparticles: The impurity and defect perspective. Phys. Status Solidi 2006, 3, 3577. [Google Scholar] [CrossRef]
  53. Hufschmidt, D.; Liu, L.; Seizer, V.; Bahnemann, D. Electrocatalytic water treatment: Fundamental knowledge required for its practical application. Water Sci. Technol. 2004, 49, 135–140. [Google Scholar] [CrossRef] [PubMed]
  54. Ravichandran, K.; Anbazhagan, A.; Dineshbabu, N.; Ravidhas, C. Influence of Mo doping on transparent conducting properties of ZnO films prepared by a simplified spray technique. J. Mater. Sci. Mater. Electron. 2015, 26, 7649–7654. [Google Scholar] [CrossRef]
  55. Hussien, M.S.A. Facile Synthesis of Nanostructured Mn-doped Ag3PO4 for Visible Photodegradation of Emerging Pharmaceutical Contaminants: Streptomycin Photodegradation. J. Inorg. Organomet. Polym. Mater. 2021, 31, 945–959. [Google Scholar] [CrossRef]
  56. AnjuChanu, L.; Joychandra Singh, W.; Jugeshwar Singh, K.; Nomita Devi, K. Effect of operational parameters on the electrocatalytic degradation of Methylene blue dye solution using Manganese doped ZnO nanoparticles. Results Phys. 2019, 12, 1230–1237. [Google Scholar] [CrossRef]
  57. Shkir, M.; Yahia, I.S.; Al-Qahtani, A.M.A. Bulk monocrystal growth, optical, dielectric, third-order nonlinear, thermal, and mechanical studies on HCl added l-alanine: An organic NLO material. Mater. Chem. Phys. 2016, 184, 12–22. [Google Scholar] [CrossRef]
  58. Jeseentharani, V.; Dayalan, A.; Nagaraja, K.S. Co-precipitation synthesis, humidity sensing and photoluminescence properties of nanocrystalline Co2+ substituted zinc (II) molybdate (Zn1−x Cox MoO4; x = 0, 0.3, 0.5, 0.7, 1). Solid-State Sci. 2017, 67, 46–58. [Google Scholar] [CrossRef]
  59. Srinivas, K.; Venugopal Reddy, P. Synthesis, Structural, and Magnetic Properties of Nanocrystalline Ti 0.95Co0.05O2-Diluted Magnetic Semiconductors. J. Supercond. Nov. Magn. 2014, 27, 2521–2538. [Google Scholar] [CrossRef]
  60. Shejwal, N.N.; Anis, M.; Hussaini, S.S.; Shirsat, M.D. Investigation on structural, UV- visible, SHG efficiency, dielectric, mechanical and thermal behavior of L-cystine doped zinc thiourea sulphate crystal for NLO device applications. Int. J. Mod. Phys. B 2016, 30, 1650159. [Google Scholar] [CrossRef]
  61. Štengl, V.; Bakardjieva, S. Molybdenum-Doped Anatase and Its Extraordinary Electrocatalytic Activity in the Degradation of Orange II in the UV and vis Regions. J. Phys. Chem. C 2010, 1145, 19308–19317. [Google Scholar] [CrossRef]
  62. Al Farsi, B.; Souier, T.M.; Al Marzouqi, F.; Al Maashani, M.; Bououdina, M.; Widatallah, H.M.; Al-Abri, M. Structural and optical properties of visible active electrocatalytic Al-doped ZnO nanostructured thin films prepared by dip coating. Opt. Mater. 2021, 113, 110868. [Google Scholar] [CrossRef]
  63. Sagadevan, S.; Vennila, S.; Lett, J.A.; Marlinda, A.R.; Hamizi, N.A.B.; Johan, M.R. Tailoring the structural, morphological, optical, thermal, and dielectric characteristics of ZnO nanoparticles using starch as a capping agent. Results Phys. 2019, 15, 102543. [Google Scholar] [CrossRef]
  64. Putri, N.A.; Fauzia, V.; Iwan, S.; Roza, L.; Ali, A.; Umar, A.A.; Budi, S. Mn-doping-induced electrocatalytic activity enhancement of ZnO nanorods prepared on glass substrates. Appl. Surf. Sci. 2018, 439, 285–297. [Google Scholar] [CrossRef]
  65. Labchir, N.; Amaterz, E.; Hannover, A.; Ait hssi, A.; Vincent, D.; Ihlal, A.; Sajieddine, M. Highly efficient nanostructured CoFe2O4 thin-film electrodes for electrochemical degradation of rhodamine B. Water Environ. Res. 2020, 92, 759–765. [Google Scholar] [CrossRef] [PubMed]
  66. Baddour, A.; Bessegato, G.G.; Rguiti, M.M.; El Ibrahimi, B.; Bazzi, L.; Hilali, M.; Zanoni, M.V.B. Electrochemical decolorization of Rhodamine B dye: Influence of anode material, chloride concentration and current density. J. Environ. Chem. Eng. 2018, 6, 2041–2047. [Google Scholar] [CrossRef] [Green Version]
  67. Xu, Z.; Zhu, Y. Synergetic degradation of rhodamine B at a porous ZnWO4 film electrode by combined electro-oxidation and photocatalysis. Environ. Sci. Technol. 2006, 40, 3367–3372. [Google Scholar]
  68. Nareejun, W.; Poncho, W. Novel electrocatalytic/solar cell improvement for organic dye degradation based on simple dip-coating WO3/BiVO4 photoanode electrode. Sol. Energy Mater. Sol. Cells 2020, 212, 110556. [Google Scholar] [CrossRef]
  69. Pedanekar, R.S.; Madake, S.B.; Narewadikar, N.A.; Mohite, S.V.; Patil, A.R.; Kumbhar, S.M.; Rajpure, K.Y. Electrocatalytic degradation of Rhodamine B by spray deposited Bi2WO6 photoelectrode under solar radiation. Mater. Res. Bull. 2022, 147, 111639. [Google Scholar] [CrossRef]
  70. Chennai, A.; Naciri, Y.; Taoufyq, A.; Bakiz, B.; Bazzi, L.; Guinneton, F.; Villain, S.; Gavarri, J.R.; Benlhachemi, A. Electrodeposited zinc phosphate hydrate electrodes for electrocatalytic applications. J. Appl. Electrochem. 2019, 42, 163–177. [Google Scholar] [CrossRef]
  71. Wang, Y.; Lu, N.; Luo, M.; Fan, L.; Zhao, K.; Qu, J.; Guan, J.; Yuan, X. Enhancement mechanism of fiddlehead-shaped TiO2-BiVO4 type II heterojunction in SPEC towards RhB degradation and detoxification. Appl. Surf. Sci. 2019, 463, 234–243. [Google Scholar] [CrossRef]
Figure 1. XRD patterns of pure and Mo-doped ZnO nanoparticle samples.
Crystals 12 01239 g001
Figure 2. SEM images (a) ZNCM-1, (b) ZNCM-2, (c) ZNCM-3, (d) ZNCM-4, (e) ZNCM-5, and (f) ZNCM-6.
Crystals 12 01239 g002
Figure 3. ODR spectra of pure and Mo-doped ZnO nano-samples.
Crystals 12 01239 g003
Figure 4. Tauc’s plots of pure and Mo-doped ZnO nano samples.
Crystals 12 01239 g004
Figure 5. Raman spectra of pure and Mo-doped ZnO nano samples.
Crystals 12 01239 g005
Figure 6. FTIR spectra of pure and Mo-doped ZnO nanoparticle samples.
Crystals 12 01239 g006
Figure 7. (a) Dielectric constant, (b) dielectric loss, and (c) electrical conductivity of pure and Mo-doped ZnO nanoparticle samples.
Crystals 12 01239 g007aCrystals 12 01239 g007b
Scheme 1. EC degradation mechanism/cell.
Crystals 12 01239 sch001
Figure 8. Kinetic study of EC degradation of RhB in the presence of ZNCM nanoparticles.
Crystals 12 01239 g008
Figure 9. The % of EC degradation of RhB in the presence of ZNCM nanoparticles.
Crystals 12 01239 g009
Table 1. The structural parameters of the pure and Mo-doped ZnO nanoparticles.
Sample FWHMd-Spacinga, (nm)c, (nm)D, (nm) ¦ Å × 10 3 ) δ   ( × 10 15 )
ZNCM-1 (0 wt% Mo)ZnO36.316 (101)0.37382.471773.24455.197923.3751.831
ZNCM-2 (0.001 wt% Mo)ZnO36.338 (101)0.37892.470353.24255.195623.0651.881
ZNCM-3 (0.01 wt% Mo)ZnO36.262 (101)0.48002.475313.24945.203818.26.43.019
ZNCM-4 (0.1 wt% Mo)ZnO36.303 (101)0.48002.472633.245235.201718.26.43.019
Mo5O1432.484 (601)0.52002.7540823.01153.957116.637.83.616
ZNCM-5 (0.5 wt% Mo)ZnO31.773 (100)0.43992.814063.24945.203819.626.72.597
Mo5O1432.570 (601)0.41442.747022.88093.933420.876.22.296
ZNCM-6 (1.0 wt% Mo)ZnO31.945 (100)0.58362.799313.23235.179514.88.94.565
Mo5O1432.708 (601)0.36002.735723.01763.910824.035.41.732
Table 2. The calculated data of rate constants of electrocatalytic degradation of Rhodamine B in the presence of ZNCM prepared samples with the previous work.
SamplesSynthesis MethodDye ConcentrationK, (min−1)% RemovalRefs.
ZNCM-1 (0 wt% Mo)Combustion methodRhodamine B (50 mgL−1)0.267197% after 15 minPresent work
ZNCM-2 (0.001 wt% Mo)Combustion methodRhodamine B (50 mgL−1)0.2906498% after 15 min
ZNCM-3 (0.01 wt% Mo)Combustion methodRhodamine B (50 mgL−1)0.40605100 % after 7 min
ZNCM-4 (0.1 wt% Mo)Combustion methodRhodamine B (50 mgL−1)0.3145598 % after 15 min
ZNCM-5 (0.5 wt% Mo)Combustion methodRhodamine B (50 mgL−1)0.3280197% after 15 min
ZNCM-6 (1.0 wt% Mo)Combustion methodRhodamine B (50 mgL−1)0.2121896% after 15 min
CoFe2O4ElectrodepositionRhodamine B (10 mgL−1) 99% after 3 min[65]
Ti/RuO2-IrO2DSA (De Nora Company)Rhodamine B 100% after 90 min[66]
ZnWO4Dip-coatingRhodamine B (5 mgL−1)0.0023after 60 min[67]
Ca10(PO4)6(OH)2ElectrodepositionRhodamine B (5 mgL−1)0.039998 % after 105 min[68]
Zn3(PO4)2·4H2OElectrodepositionRhodamine B (30 mgL−1) 90 % after 10 min[69]
TiO2-NTs/Ce-PbO2ElectrodepositionRhodamine B (30 mgL−1) 90 % after 10 min[70]
BiVO4/TiO2Sol-gel andRhodamine B (10 mgL−1) 93.9 % after 5 h[71]
hydrothermal
Publisher’s Note: MDPI stays neutral with regard to jurisdictional claims in published maps and institutional affiliations.

