Article

Temperature Effect on Short—Term Strength of Lithium Hydride with Tensile and Three—Point Bend Specimens

1
State Key Laboratory of Particle Detection and Electronics, University of Science and Technology of China, Hefei 230026, China
2
School of Nuclear Science and Technology, University of Science and Technology of China, Hefei 230027, China
*
Authors to whom correspondence should be addressed.
Crystals 2022, 12(6), 840; https://doi.org/10.3390/cryst12060840
Submission received: 23 May 2022 / Revised: 9 June 2022 / Accepted: 9 June 2022 / Published: 15 June 2022
(This article belongs to the Special Issue Feature Papers in Crystal Engineering in 2022)

Abstract

:
Strength is one important mechanical property of lithium hydride (LiH) for application as a neutron moderator and absorbent at elevated temperatures. Using the digital image correlation (DIC) method for deformation measurement, the short—term strength of LiH was investigated with both tensile and three—point bend (3PB) specimens in the range of room temperature (RT) to 600 °C. The results show that the temperature dependence of the strength from tensile and 3PB tests shows similarity. As the temperature increases, the strength changes slightly, then rises to the maximum and finally decreases due to the softening effect. The fracture surfaces of specimens show the main characteristics of trans—granular fracture at different temperatures, except for 600 °C. With increasing temperature, the fracture surfaces become rough and numerous tortuous micro—cracks are found. Especially for 3PB specimens, there are dimple—like structures with distorted grains and obvious intergranular cleavage fracture.

1. Introduction

Lithium hydride (LiH) is one of the most important nuclear materials and has gained much attention because of its low density, high thermal neutron absorption and scattering cross—section, high hydrogen capacity and no obvious secondary irradiation after neutron absorption. Based on its advantages, LiH can be used as a neutron moderator/absorbent and is considered to be the best neutron shielding material for space nuclear reactors [1,2,3,4,5,6]. However, due to the low strength, high brittleness and thermal expansion of LiH, it is susceptible to thermal—mechanical loading during production and service conditions, causing defects and cracks [1,2,7]. The formation and growth of the defects and cracks can dramatically reduce the strength, which leads to a significant decrease in reliability or even failure to brittle fracture under low stress. Therefore, it is important to study the strength performance of LiH at elevated temperatures.
There have been a few research studies on the strength determination of LiH at room temperature (RT). A uniaxial pull test was designed to establish the capability of acquiring highly credible tensile strength [8]. The influence of specimen type and size on tensile strength was studied [9]. Moreover, mechanical testing under uniaxial compression, radial compression and bending were presented [10]. Nevertheless, it is hard to determine the strength values at elevated temperatures because LiH is reactive and can ignite when exposed to moist air, thus, it needs to be tested in a vacuum or inert atmosphere [7,11]. The tensile strength of LiH was measured at RT up to 600 °C in argon with a low displacement rate of 0.2 mm/min [1,2], resulting in an excessively long test time at temperatures above 200 °C. The time—dependent creep phenomenon was possibly activated in the long time tests with increasing temperature, which contributed to the plastic deformation of specimens and prevented unstable fracture. After all, there are few data on the strength of LiH and no convincible result of short—term strength at elevated temperatures.
For ceramic materials, bending tests are preferred for strength testing as tensile tests are challenging and costly because of special modifications and adaptations for specimen geometries and gripping devices [12]. However, bending tests may have some errors and limitations for the results based on the symmetric linear elastic assumption [13]. Hence, it is essential to determine the strength of LiH using both tensile and bending tests.
In this paper, the short—term strength of LiH using tensile and three—point bending (3PB) tests was investigated in the temperature range of RT—600 °C. The digital image correlation (DIC) method, an optical and displacement measurement technique with high spatial resolution, sensitivity and precision, was applied to measure the deformation of specimens. Fractographs were also examined to identify fracture characteristics and the temperature effect on strength of LiH was investigated.

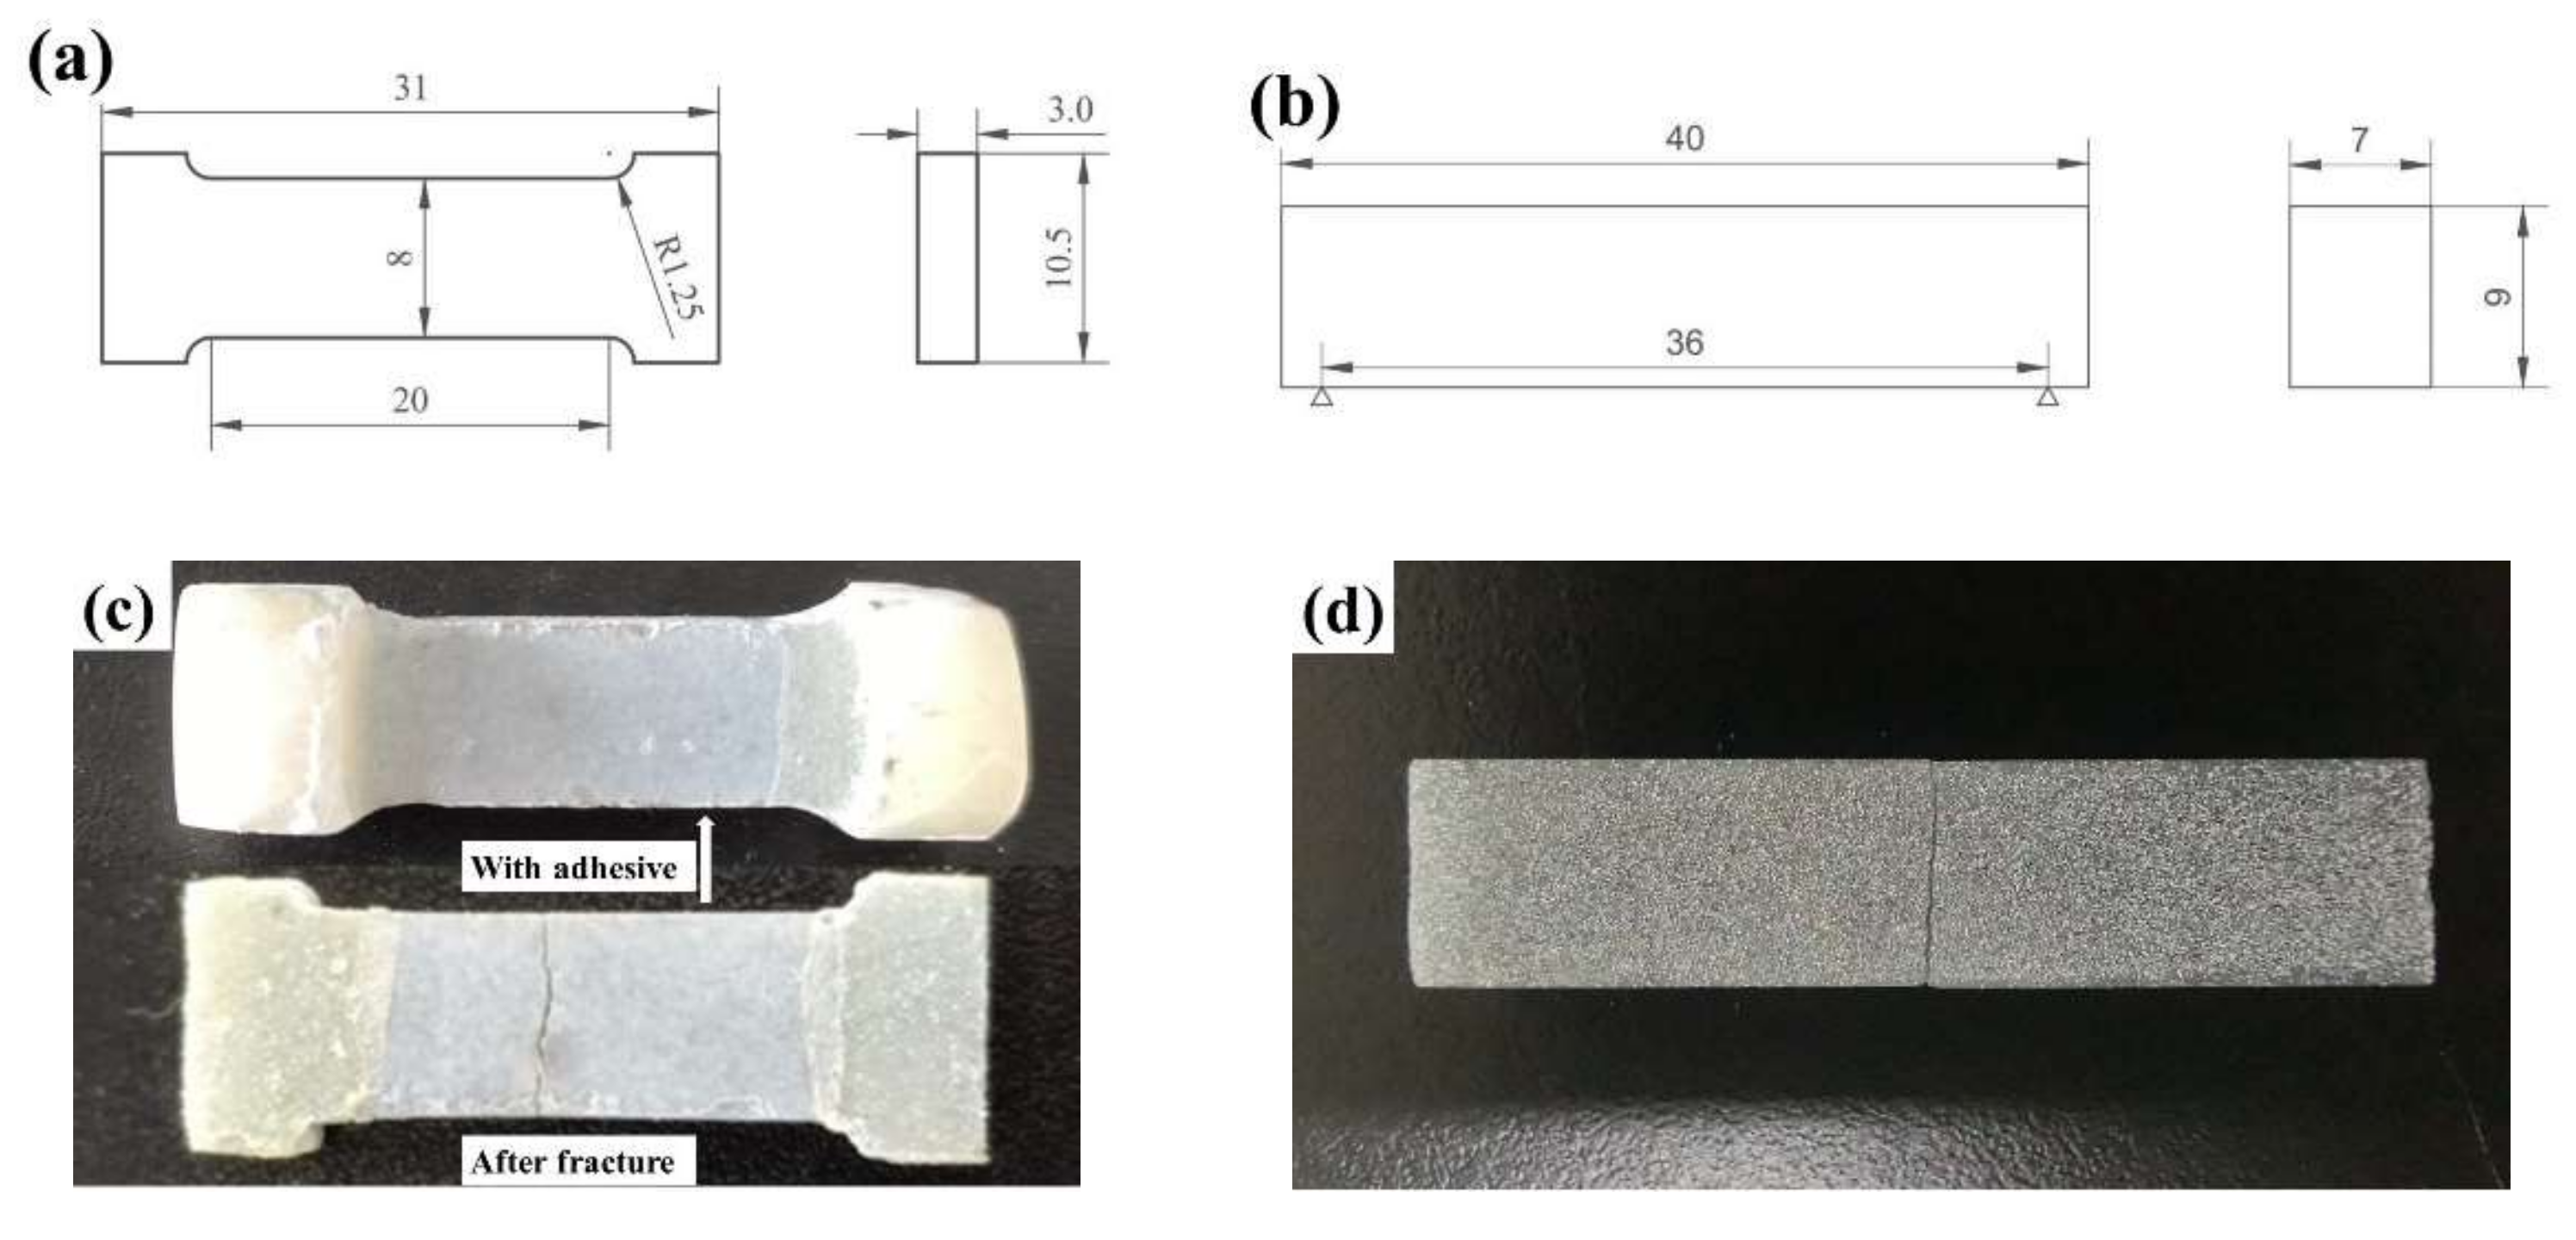
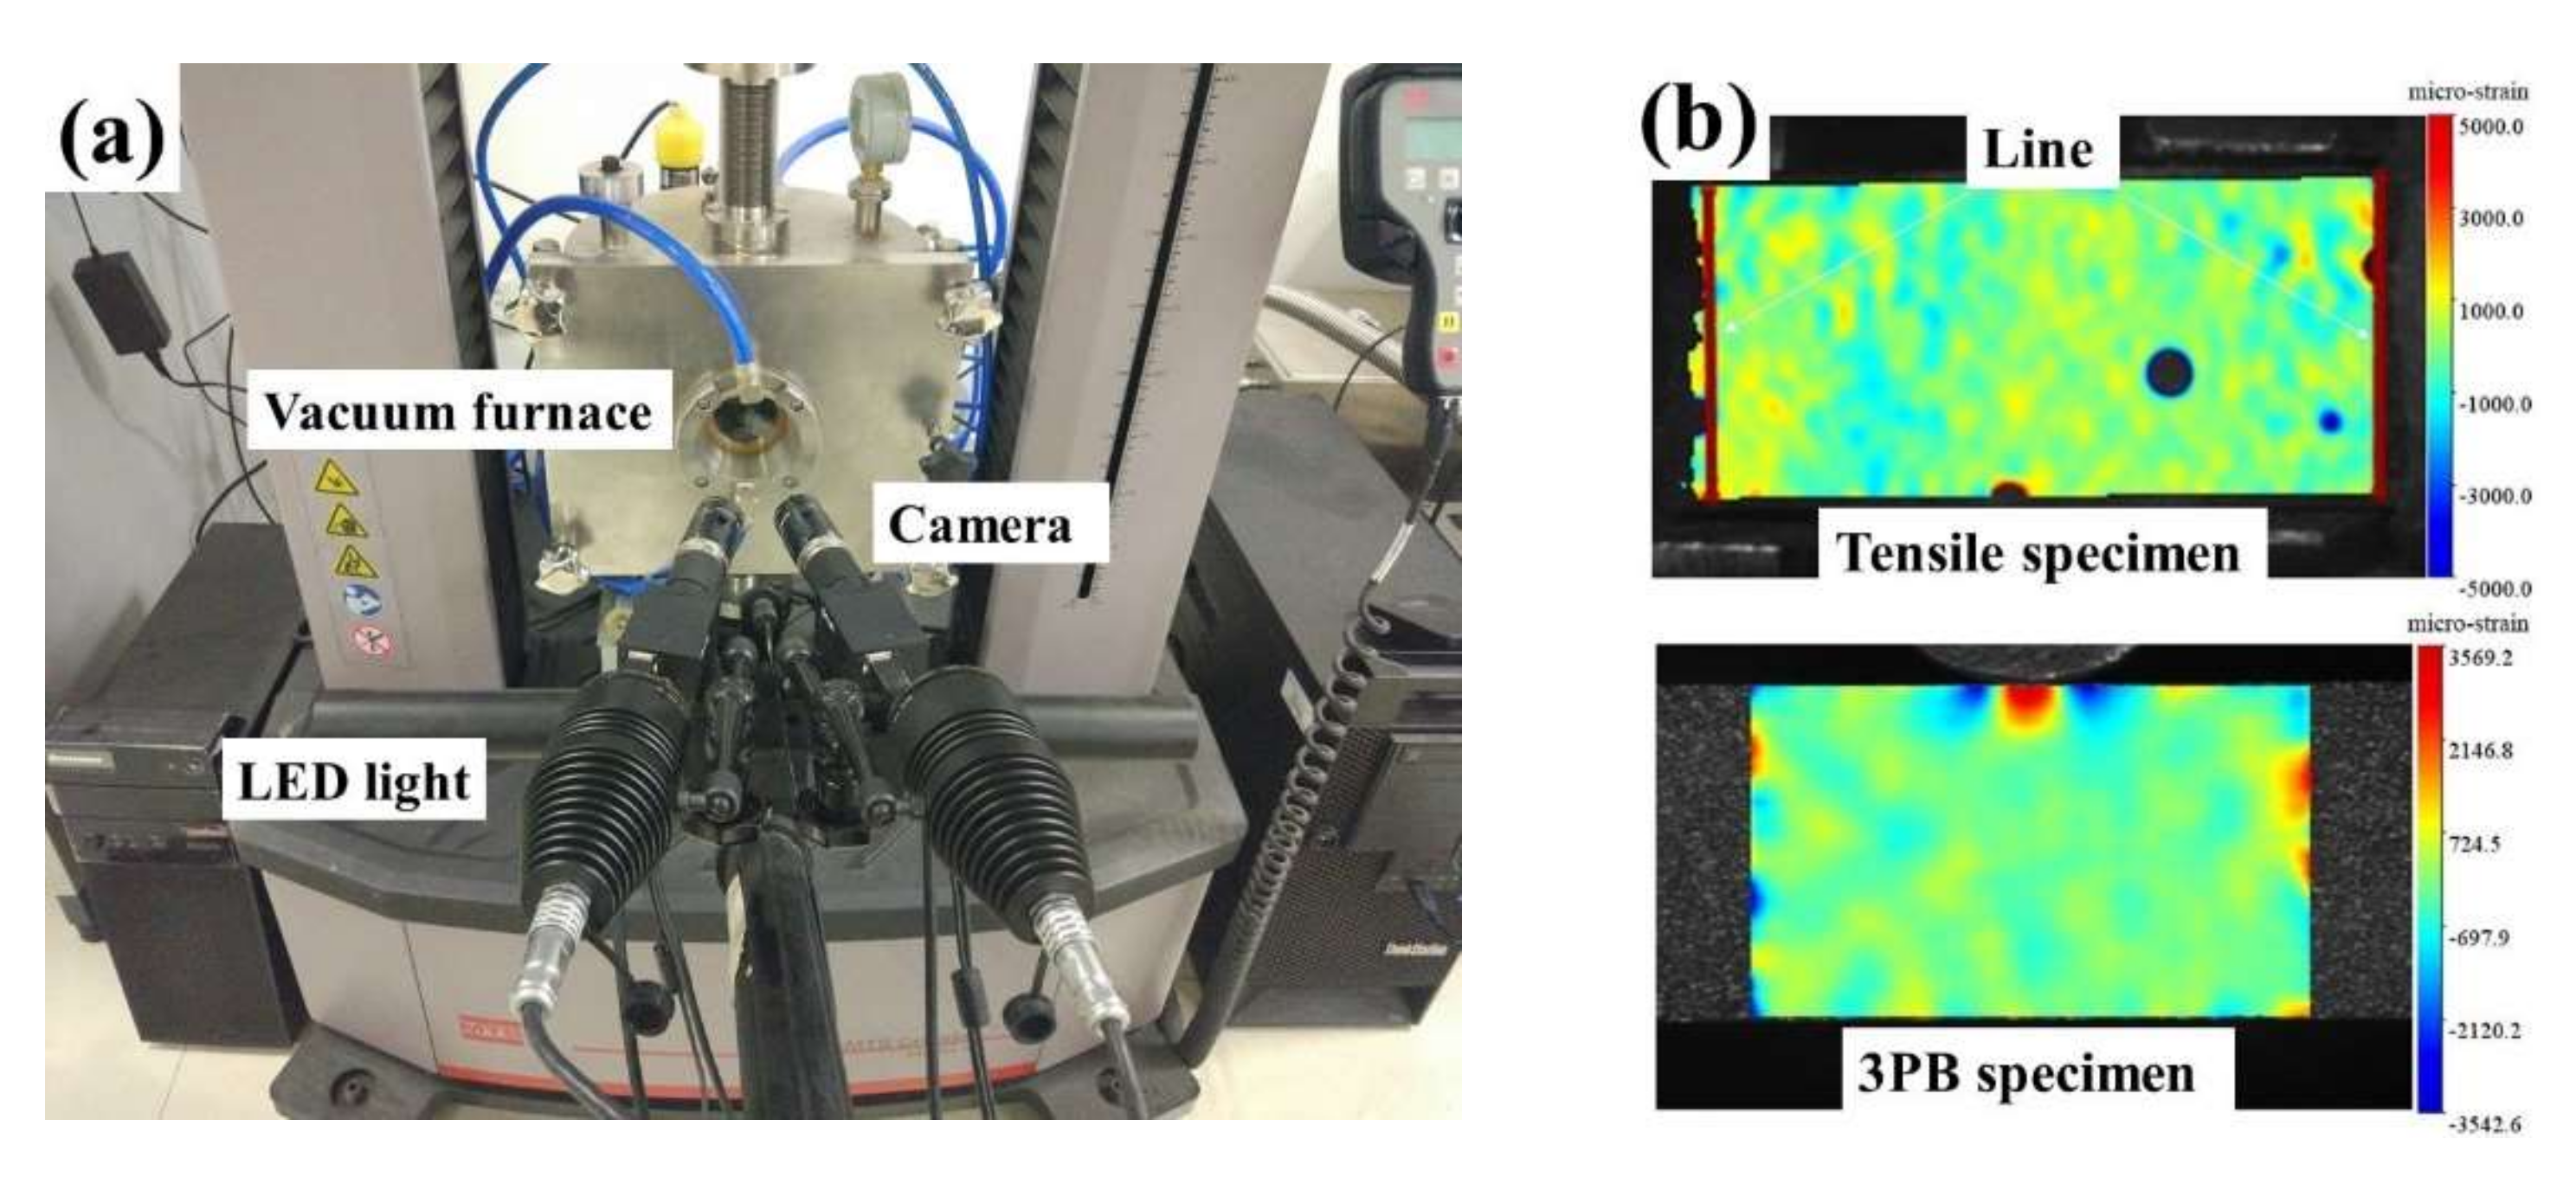
2. Materials and Methods

Tensile and three—point bend (3PB) tests were carried out on LiH specimens, produced by powder processing and sintering [7]. Due to the preparation difficulty, the size of the specimen is difficult to fully meet the requirements of the testing standards for ceramic materials [14,15]. Figure 1a shows the configuration of the tensile specimen. To reduce the localized stress concentration and make fracture occur at the gage length, the gripped regions of the tensile specimens were wrapped with anhydrous AB adhesive with the main component of epoxy resin and solidified for 24 h at room temperature (RT), as illustrated in Figure 1c. The fracture surfaces of tensile specimens after tests are clean, thus the obtained results do characterize the strength of LiH without the adhesive effects. The dimension of the 3PB specimen is shown in Figure 1b. The length is 40 mm and the span is 36 mm, which is 4 times the width of the specimen. All surfaces of the tensile and 3PB specimens were finely sanded prior to tests to remove the possible layer of lithium hydroxide.
The strains of the tensile specimens and the deflections of the 3PB specimens were obtained via the 3D—DIC method [16,17]. Figure 2a shows the experimental setup of the 3D—DIC system, consisting of two LED lights and two cameras. Images with a resolution of 2736 × 2192 pixels (0.01 mm/pixel) were taken at a frame rate of 4 Hz. As illustrated in Figure 2b, the tensile strains were measured by selecting two parallel lines at both ends over the gage length. For 3PB specimens, the mid—span deflections were obtained at the mid—height of the displacement field.
The test temperature, loading rate, stress rate and test time for tensile and 3PB specimens are listed in Table 1. The specimens were attached and loaded in a vacuum furnace in an MTS machine which can reach a force measurement accuracy within ±0.1% of the working range. After vacuuming, all specimens were heated to the target temperature and kept for 30 min at the beginning of each test. Since LiH might be susceptible to slow crack growth and creep at elevated temperatures in long time tests [11,16], the tensile strength of LiH could be influenced in very long test times up to 4500 s from RT to 600 °C with a loading rate of 0.2 mm/min [1,2]. Low loading rates would consume more test time. To avoid possible time—dependent effects, a high loading rate is necessary. When the possible time—dependent effects are excluded, the strengths vary little with the loading rate in the range of quasi—static loading. Therefore, the loading rate of tensile and 3PB tests was set to 0.5 mm/min under crosshead—displacement control at RT and 200 °C, and the loading rate was set up to 2 mm/min at temperatures above 300 °C. Typical images of tensile and 3PB specimens after fracture are demonstrated in Figure 1c,d. The morphology of the fracture surfaces was observed in a Zeiss scanning electron microscope.
Equation (1) [18] was used to calculate the tensile strength. As for 3PB tests, the commonly used elastic formula could be no longer applicable for strength calculation at elevated temperatures due to significant plastic behaviors of the specimens, so the strength was measured with Equation (2) [19]. The elastic modulus was obtained by Equation (3) [18].
σ = F b h
σ = l b h 2 F + 1 2 w d F d w
E = Δ F l 3 / 4 b h 3 Δ w
where σ is the strength, w is the deflection, F is the peak load, E is the elastic modulus, ΔF is the load increment in the linear elastic region, Δw is the corresponding deflection increment under the load ΔF, l is the span, b is the thickness of the specimen, h is the width of specimen.

3. Result and Discussion

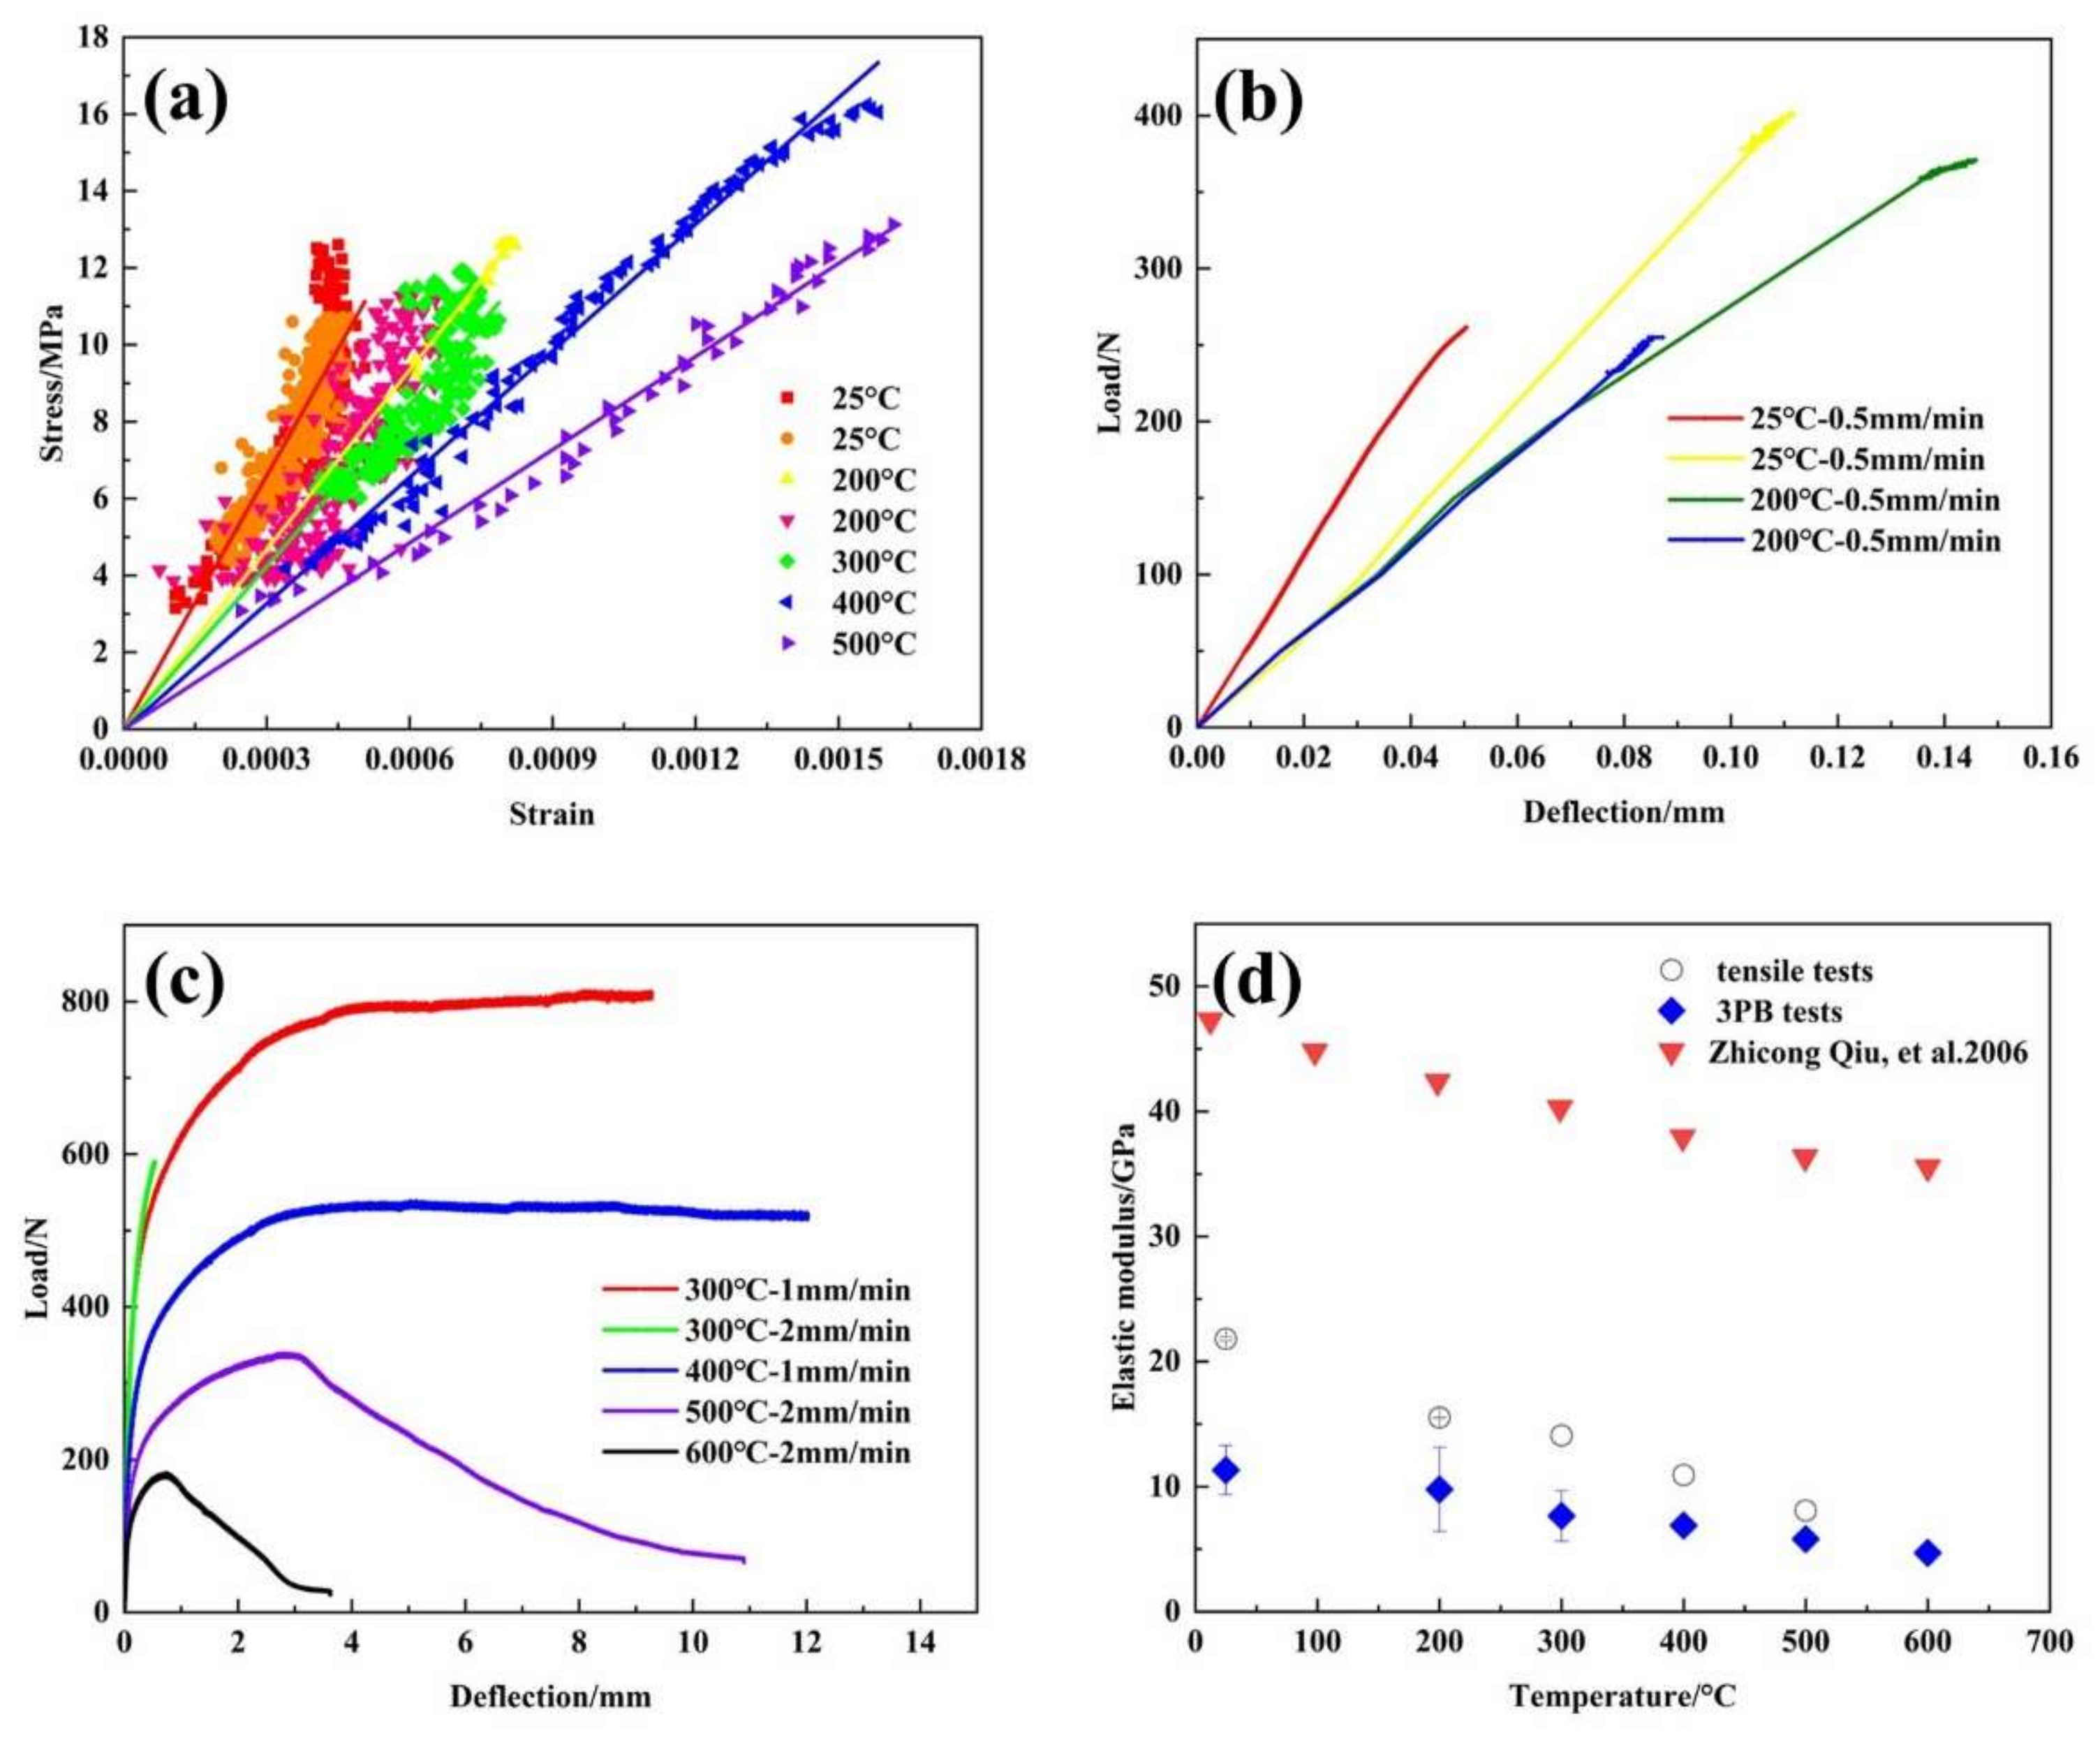
3.1. Load—Deformation Behaviors

Figure 3a demonstrates the stress–strain curves obtained from the tensile tests of LiH. Since the displacements at the gage length of the tensile specimen are extremely small, the strains measured by DIC show dispersion, so the curves are generated by linear fitting. At all tested temperatures, the stress–strain curves present linearity and brittle fracture at the maximum force. No elongation of the specimens can be detected. Failure always occurs close to the ends of the gage section at RT, 200 and 300 °C. When the temperature rises to 400 and 500 °C, better linear fitting of the curves is found and the fracture location is close to the middle of the gage length, indicating better plastic performance.
Figure 3b,c show the load versus deflection relations of 3PB specimens for LiH. The curves are generally linear at RT and 200 °C in Figure 3b, showing typical brittle fractures. When the test temperature reaches and exceeds 300 °C, there exhibits a considerable deviation from linearity to nonlinearity in the curves and LiH shows obvious inelastic deformation and plastic behavior. At 300 °C, the specimen with a loading rate of 1 mm/min displays greater plasticity than that with a loading rate of 2 mm/min and cannot be loaded to unstable fracture. With the temperature increasing beyond 300 °C, unstable fracture of the 3PB specimens fails to occur. The significant plastic deformation of the specimens would likely induce stress relaxation and blunt the crack, which suppresses local crack propagation and prevent the occurrence of crack instability at the peak load. After the peak load, the applied load decreases with increasing deflection and the decrease becomes distinct with rising temperature. This phenomenon is probably attributed to the softening effect at elevated temperatures, resulting in reduced load—bearing capacity [19].
The elastic modulus obtained from tensile and 3PB tests of LiH is plotted in Figure 3d. Although the specimens cannot fully meet the dimension and shape specifications of testing standards for ceramic materials [14,15], the acquired values of elastic modulus are still valid for comparing at different temperatures. With increasing temperature, the slopes of the curves at the elastic loading stage decrease, corresponding to a monotonic decrease of elastic modulus both for the tensile and 3PB specimens. Moreover, the slope of the change trend of elastic modulus with temperature obtained from the tensile tests is basically identical to that measured in [1,2]. The rise in temperature would intensify the thermal vibration and weaken the bonding force of atoms, leading to a reduction in the elastic modulus [20]. It can be found that the elastic modulus values are lower than those in [1,2], mainly owing to the different preparation methods of the material and the size of the specimens. Furthermore, the elastic modulus values from tensile tests are higher than that from 3PB tests. The reason may be that Equation (3) used to derive the elastic modulus from 3PB tests does not take into account the influence of shear loading on the global deflection [13].

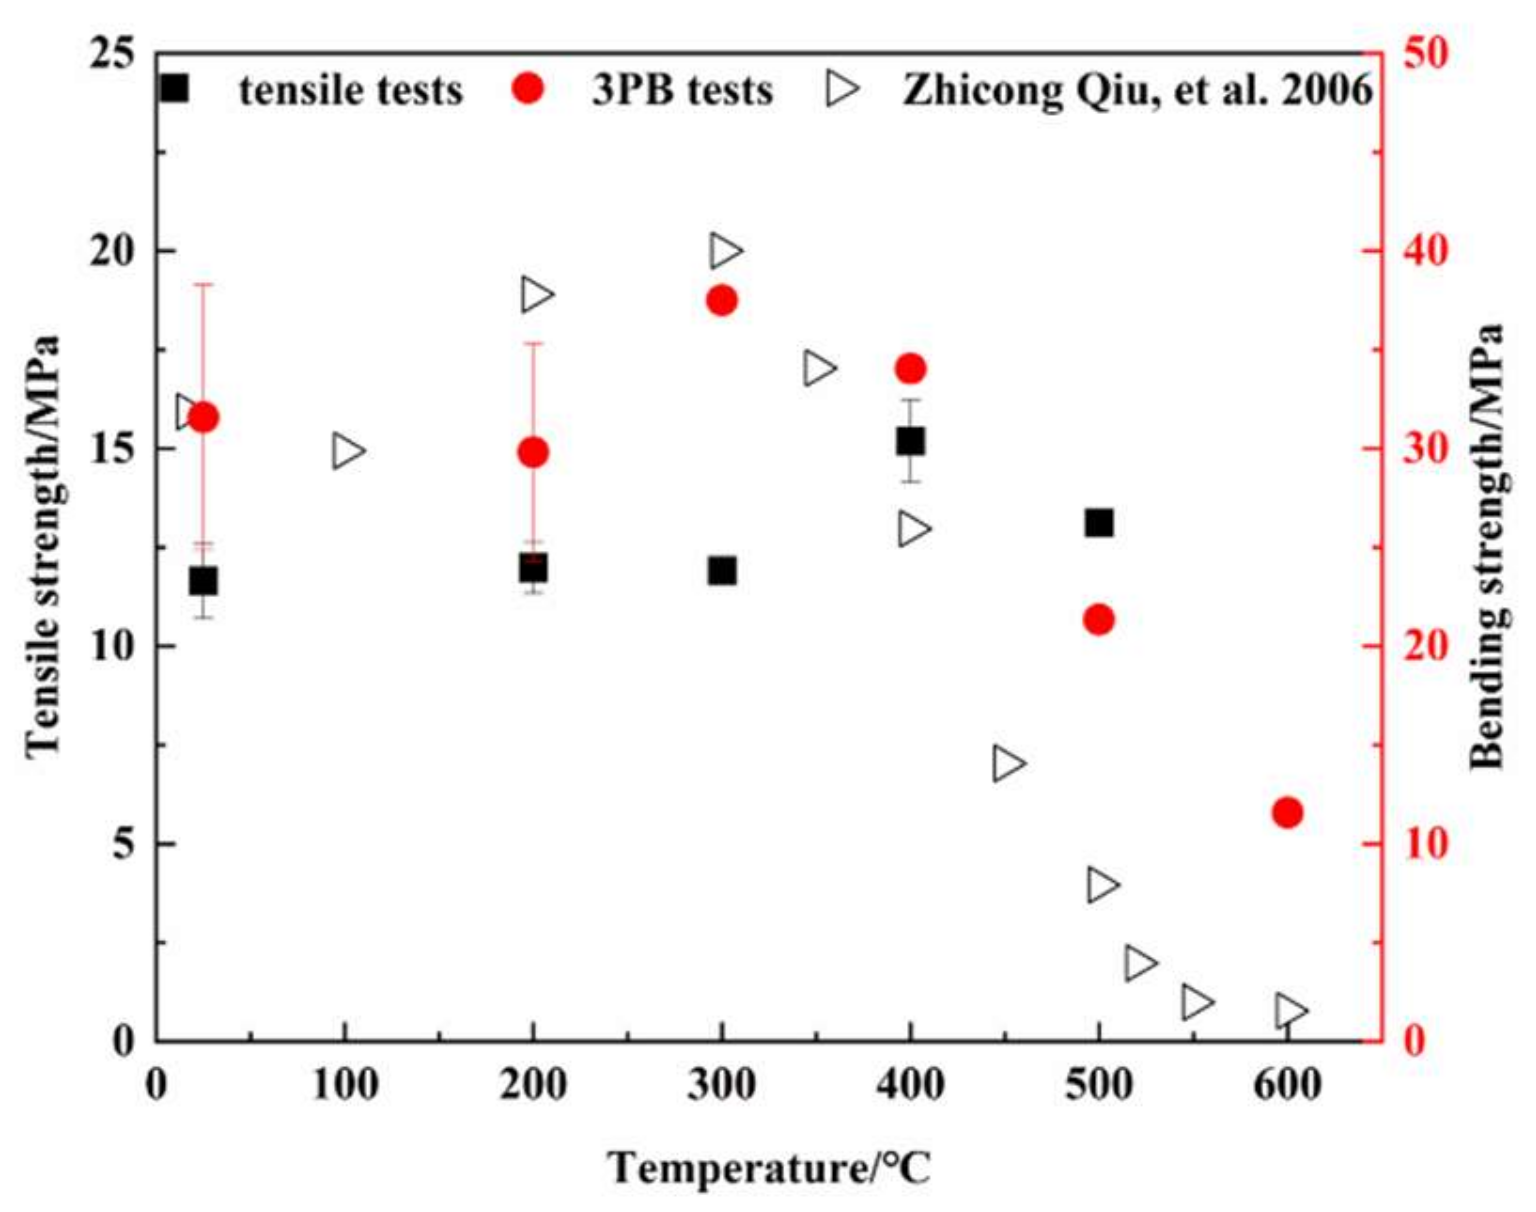
3.2. Strength—Temperature Relations
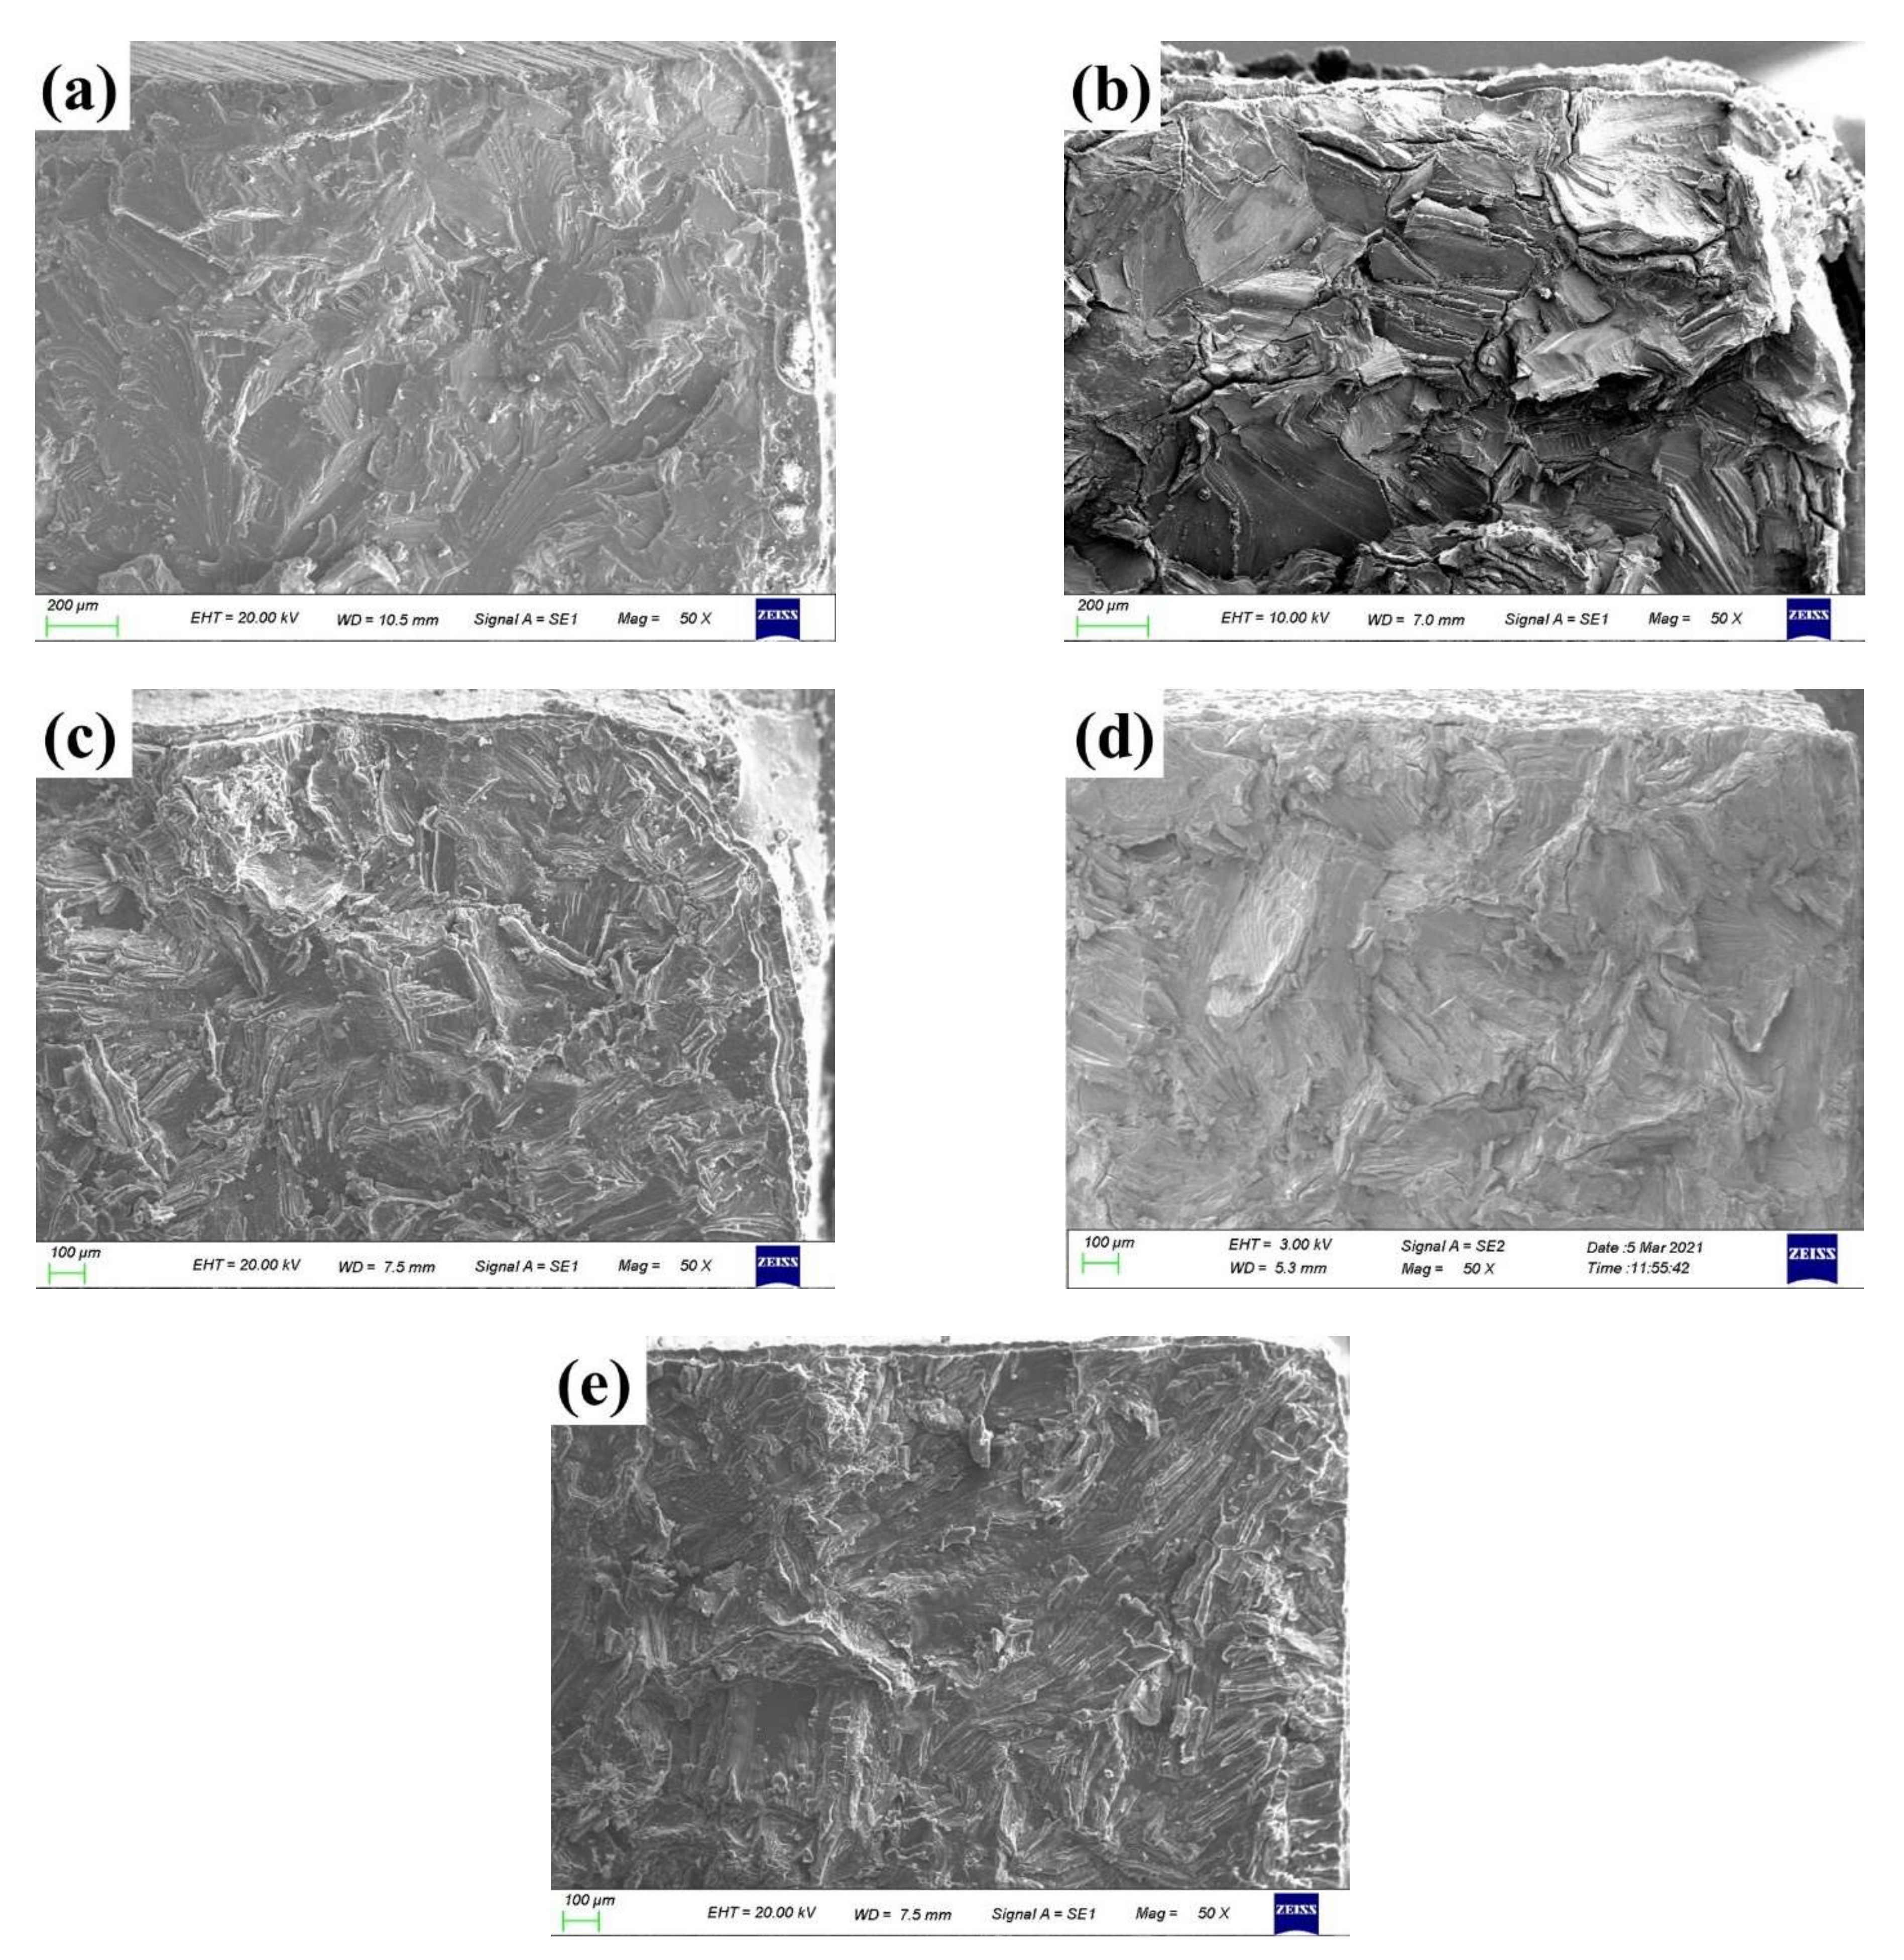
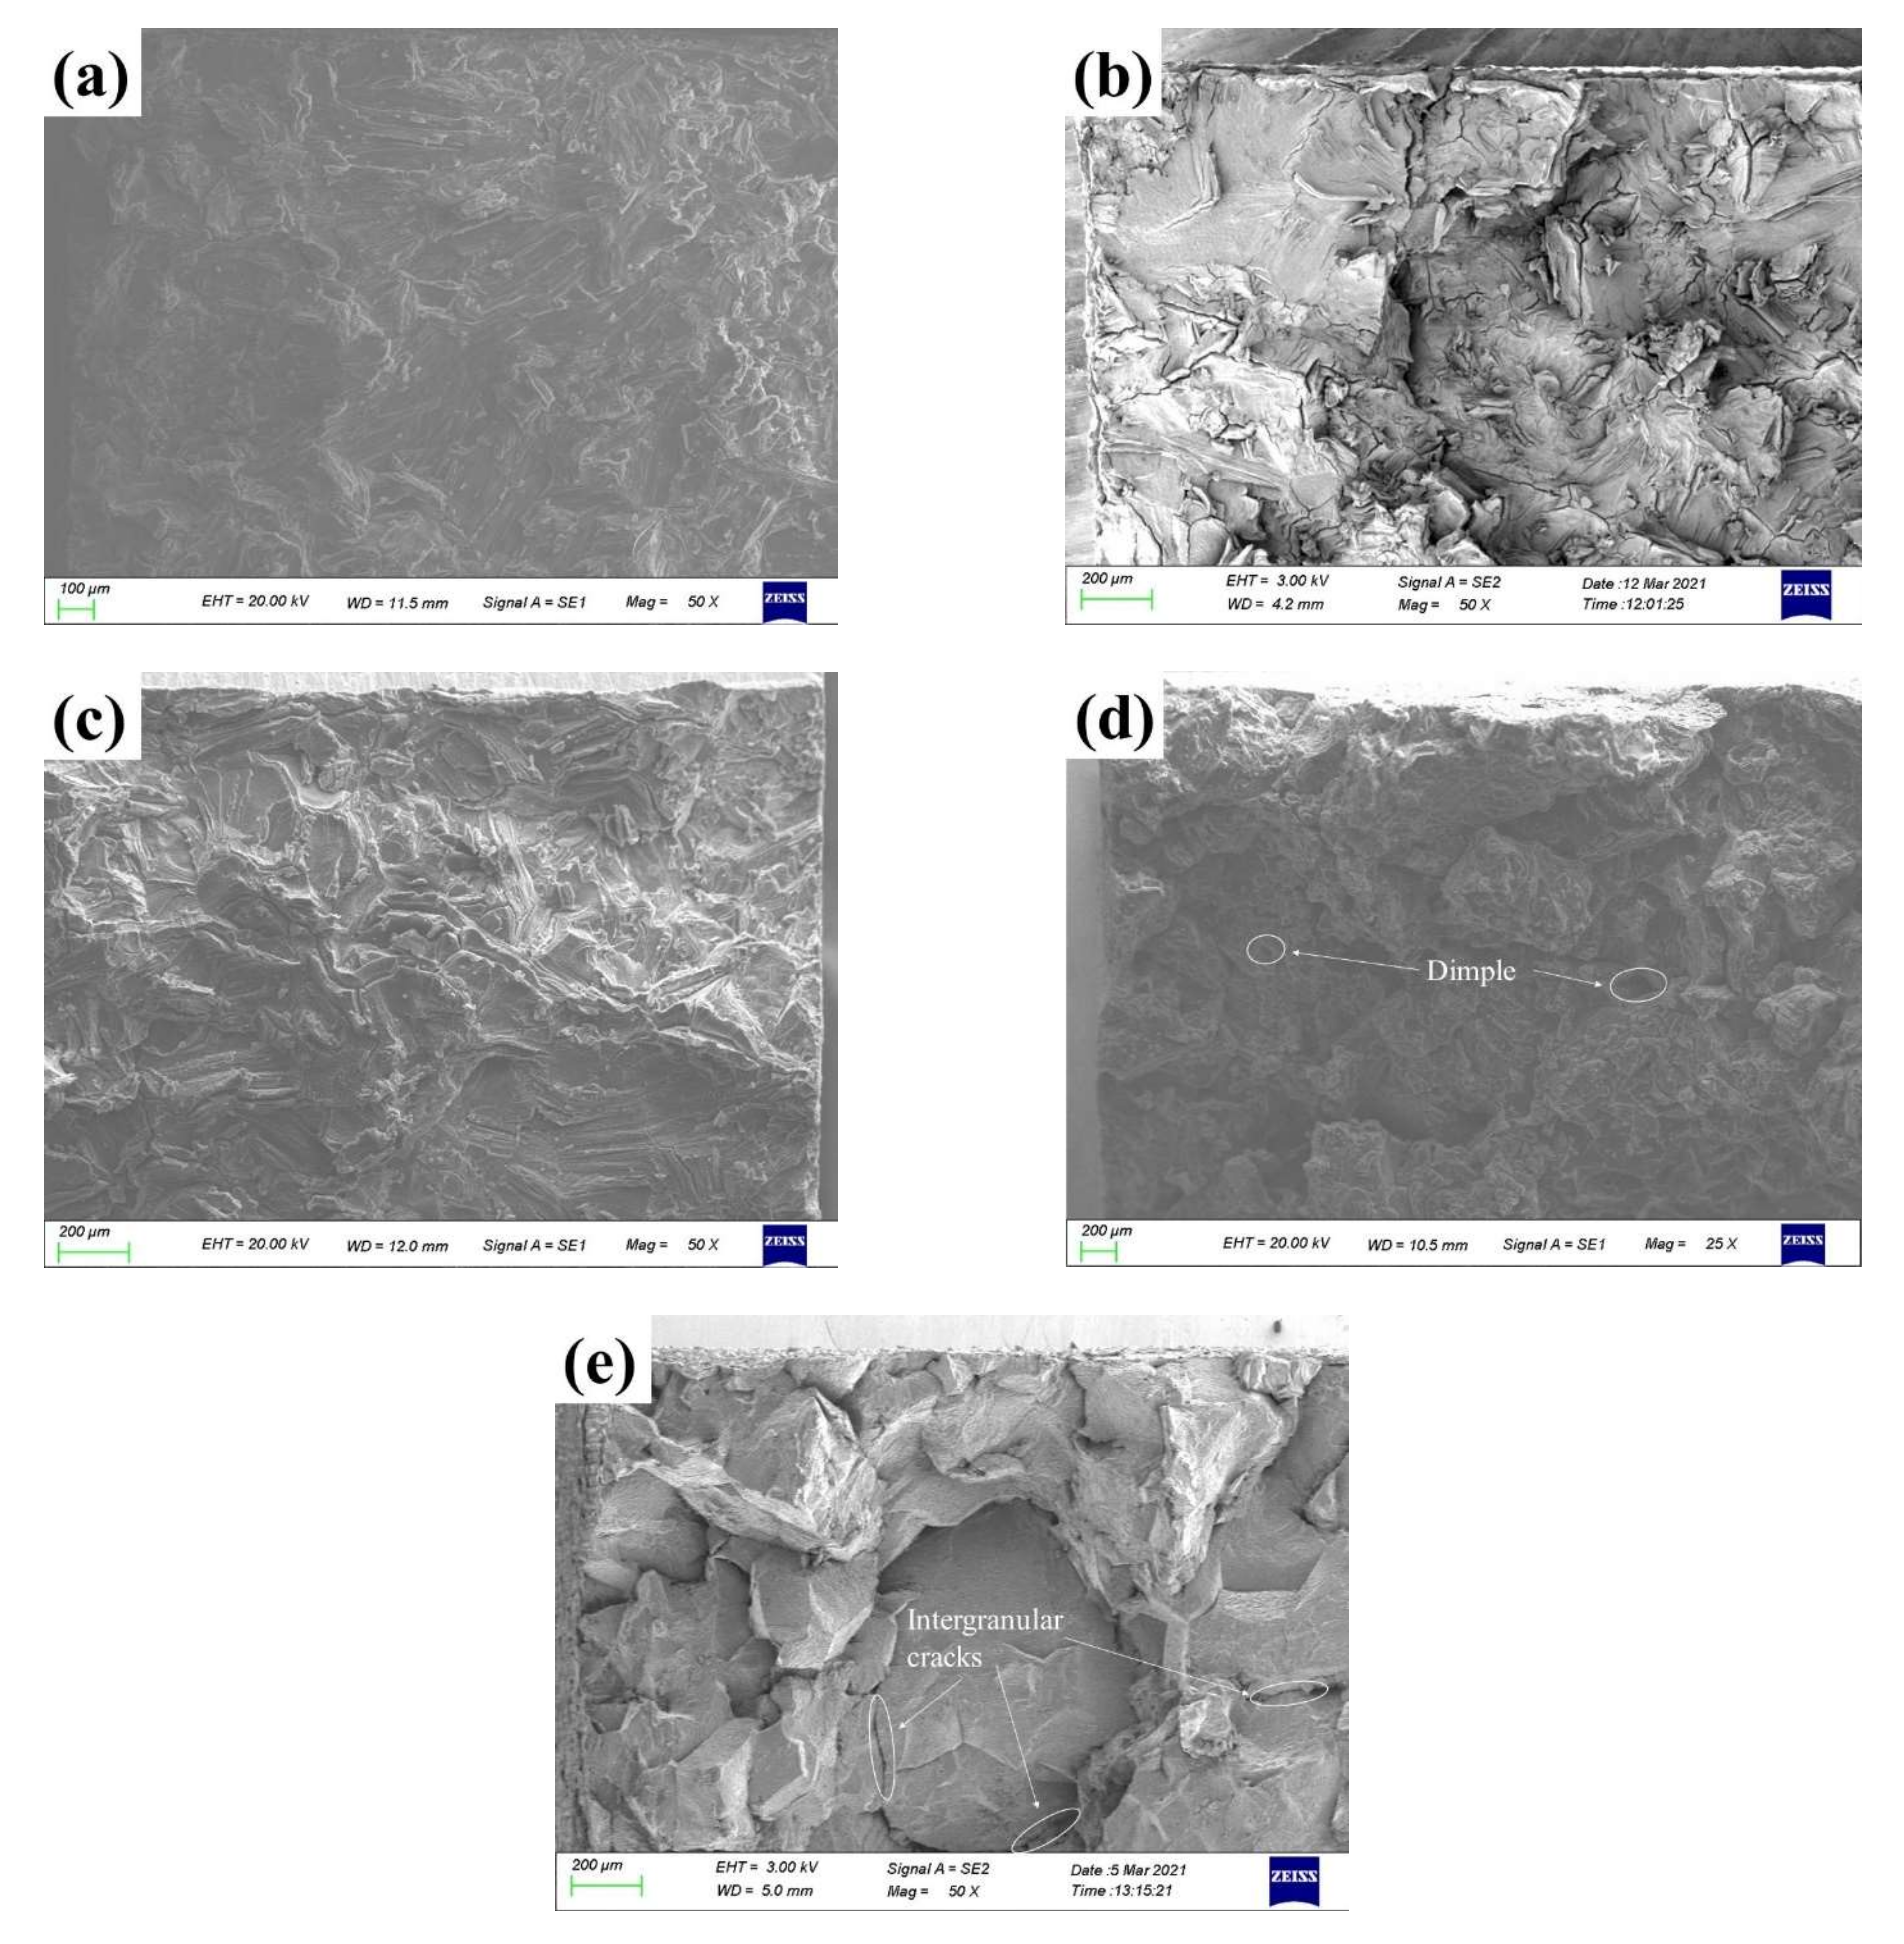
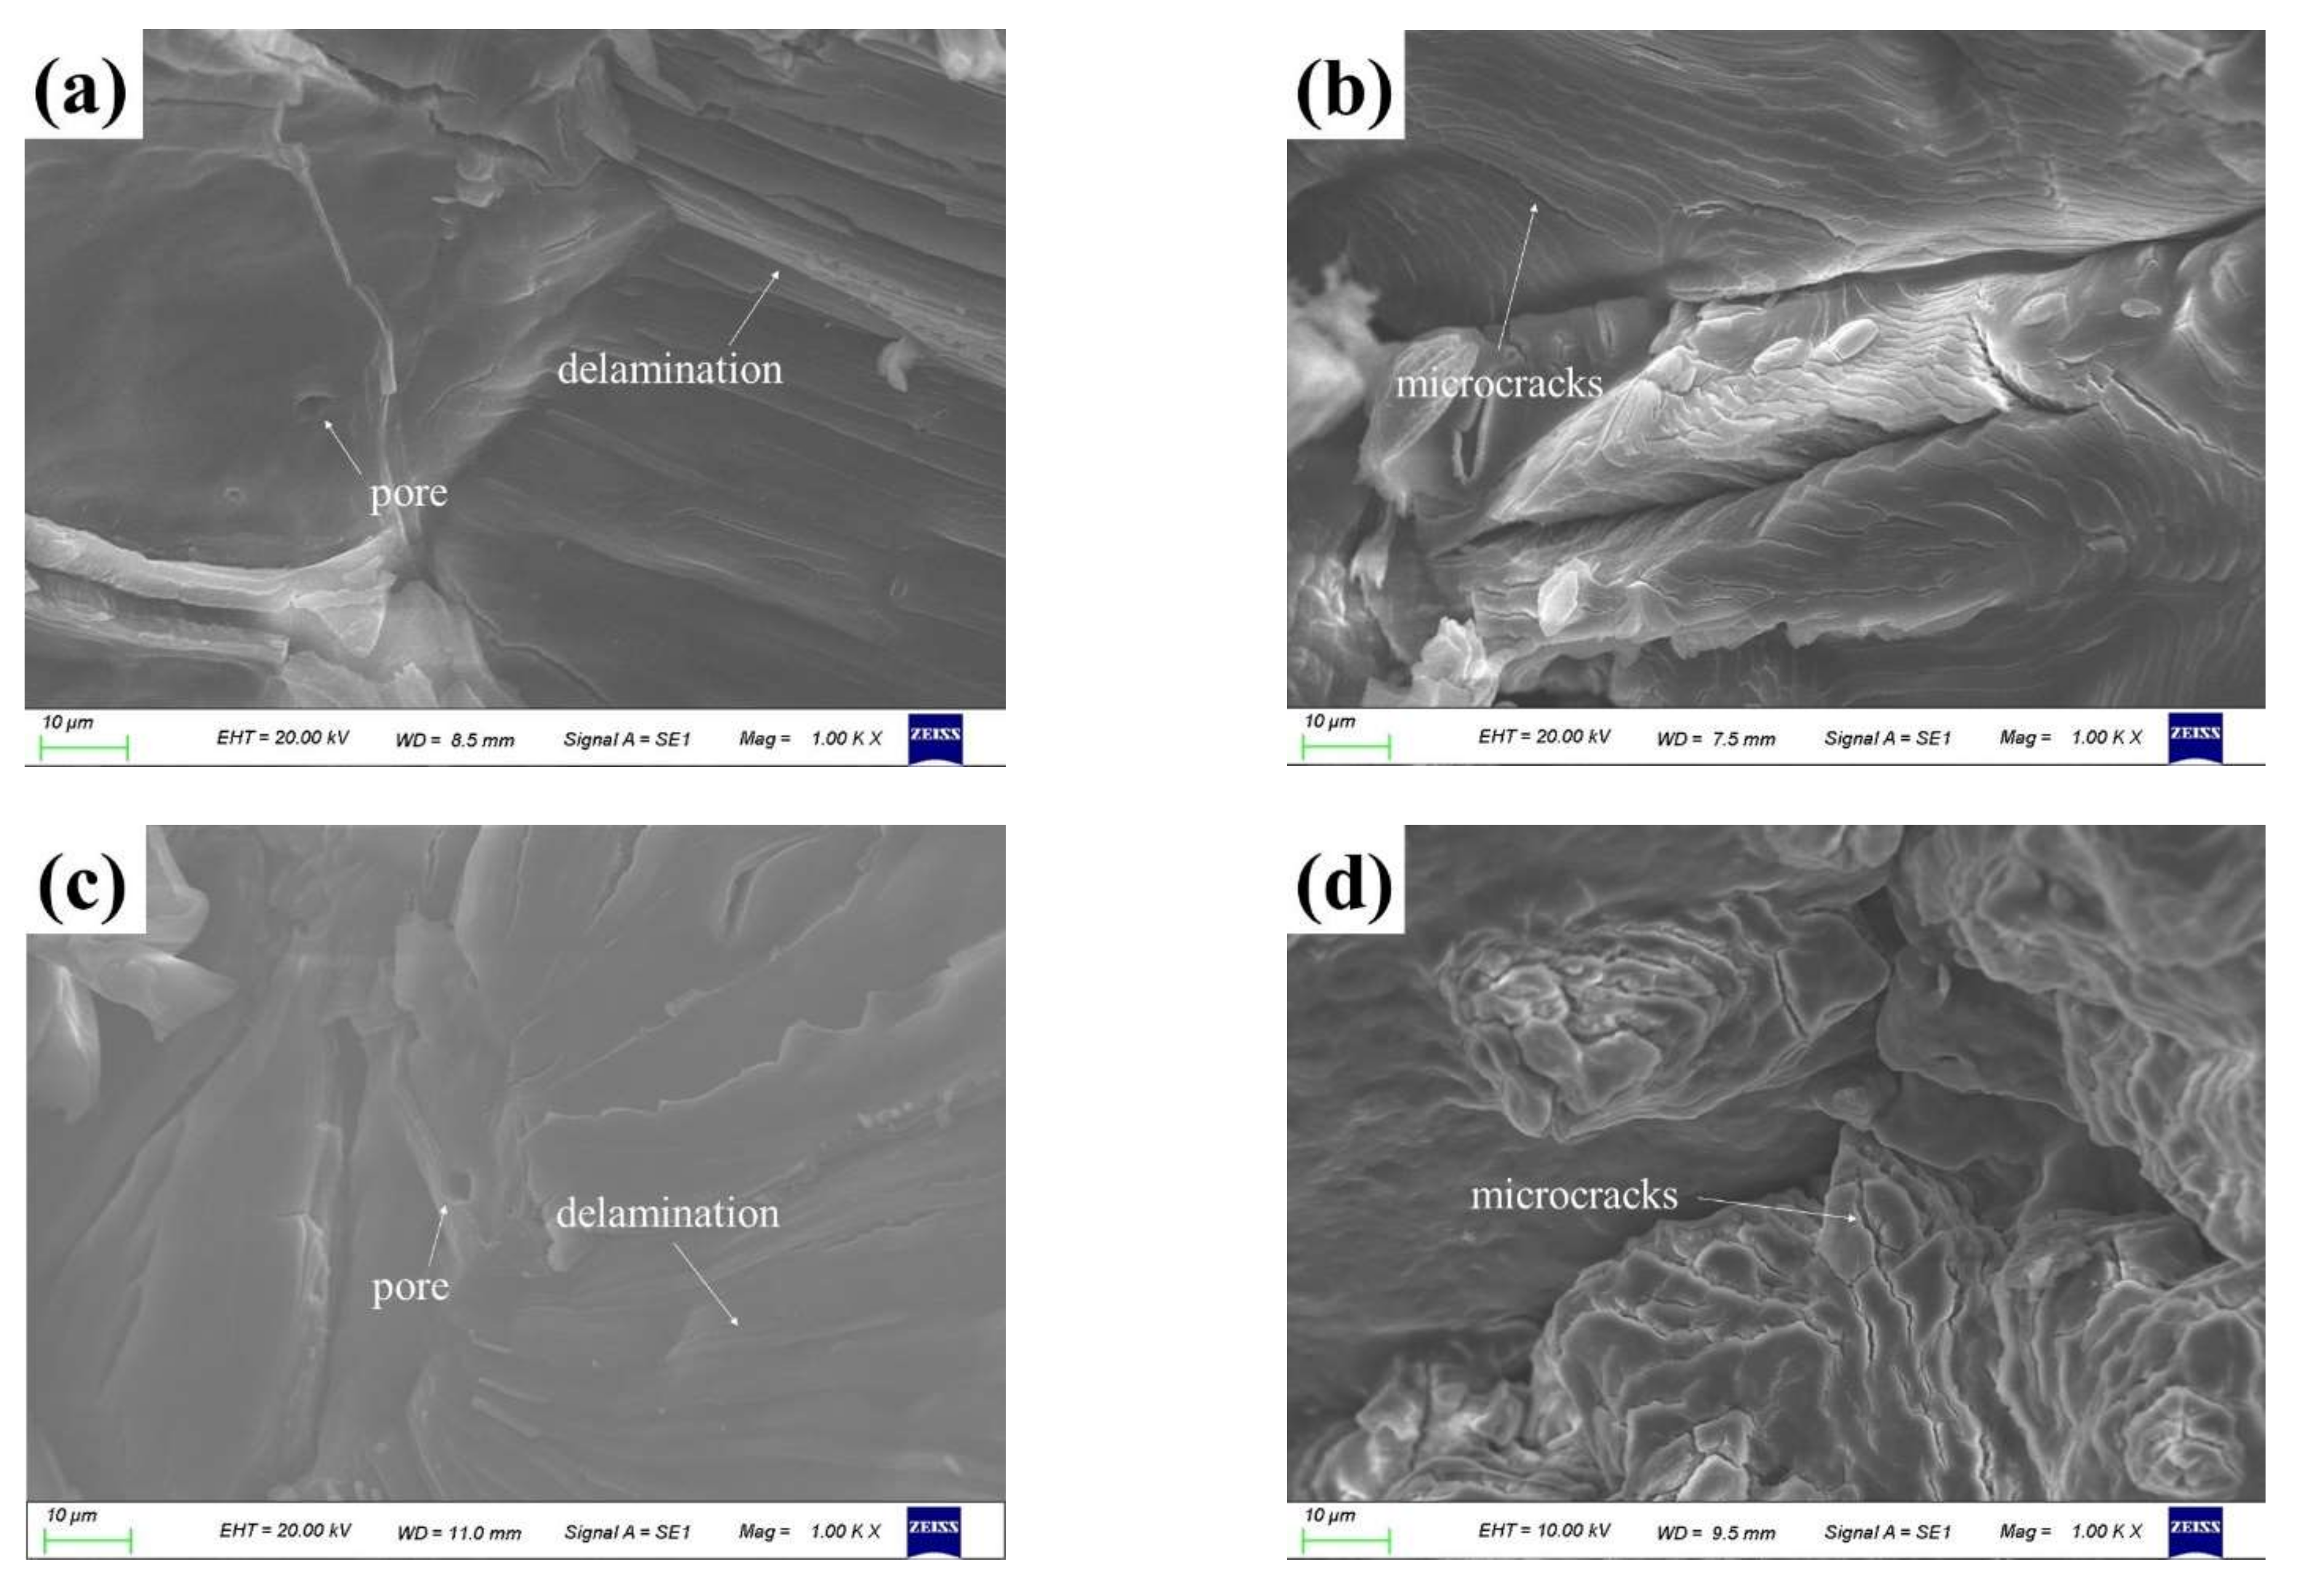
Figure 4 presents the strength of LiH from tensile and 3PB tests at all temperatures. Compared with the change trend of tensile strength with temperature in the References [1,2], the strengths from tensile tests vary little from RT to 300 °C, then increase at 400 °C, and finally decrease at 500 °C. Since the loading rate is higher at higher temperatures, the plastic behaviors in the stress–strain curves are probably limited. The strength is mainly dependent on the inherent resistance to fracture and the defects in the material [14,15], thus, a slight change in strength was found from RT to 300 °C. The change of fracture location to the middle of the gage length at 400 °C indicates better plasticity, corresponding to the rise in strength. At 500 °C, the decrease in strength is possibly due to the softening effect at elevated temperatures.
The variation trend of strength with temperature obtained by 3PB tests looks different from that of tensile strength, which is mainly attributed to the different loading conditions. However, actually, the temperature dependence of tensile and bending strength show similarities. As the temperature increases, the strengths change slightly, then rise to the maximum and finally decrease continuously. The onset of significant plasticity at 300 °C corresponding to the maximum strength is attributed to the activated dislocation motion with increasing temperature to induce large plastic deformation, thereby releasing residual stress and blunting the crack tip. With a further rise in temperature over 300 °C, dislocation is more likely to move, and unstable fracture of the specimens no longer occurs. The deformation and damage of the specimen become inhomogeneous and localized, resulting in the softening effect. As a result, it shows a decline in load—bearing capacity and the strengths drop. A similar phenomenon was observed in high—temperature behaviors of synroc—C [19].
In comparison to tensile specimens, the 3PB specimens are more prone to deform rather than fracture. Shear stress is the driving force of dislocation motion while tensile stress contributes to the occurrence of fracture [12]. Moreover, only a small part of the 3PB specimen is subjected to the maximum tensile stress with a lower probability of containing the most dangerous defects, leading to higher strengths than those by tensile tests. Furthermore, the peak strength is at 400 °C for tensile specimens and at 300 °C for 3PB specimens. The reason for the different temperatures corresponding to the maximum strength of the tensile and 3PB tests lies in the different loading stress conditions.

3.3. Fractography

To investigate the temperature effect on the short—term strength of LiH through fracture characteristics, the fracture surfaces of both tensile and 3PB specimens were analyzed using SEM. As shown in Figure 5, the fracture surfaces of the tensile specimens mainly exhibit typical trans—granular cleavage characteristics. At RT, the fracture morphology appears to be flat with sharp steps in Figure 5a. On account of the high brittleness of LiH at RT, there is no sufficient deformation, and the cleavage fracture takes place. With increasing temperature, the fracture surfaces and steps become rough, indicating a winding crack extension path. When the temperature reaches 400 and 500 °C, fewer and rougher steps are observed in Figure 5d,e, indicating growing plasticity. Possible dislocation motion is restricted at high tensile loading rates at elevated temperatures, resulting in the cracks giving priority to propagating along a certain cleavage plane.
From RT to 200 °C, the fracture surfaces of 3PB specimens are predominantly trans-granular cleavage fractures and similar to those of tensile specimens, as demonstrated in Figure 6a,b. When the temperature goes up to 300 °C, the rugged cleavage fracture surfaces and steps with a small amount of tearing features are found in Figure 6c, corresponding to improved plasticity and a significant increase in strength. Since the amount of movable slip systems increases with temperature, harmonious deformation can occur, reducing the probability of crack origination and enhancing the resistance to crack growth. A similar result was reported for Ti60 alloy in [21]. It is observed that the fracture surfaces with high roughness present both the dimple—like structures and cleavage features at 500 °C in Figure 6d, and the grains become distorted in Figure 6d, indicating the softening effect and the reduction in strength. For the specimen tested at 600 °C, there are obvious characteristics of inter-granular cleavage on the fracture surfaces in Figure 6e. It is found that the grains grow larger and obvious inter-granular cracks are formed. Damage could be coalesced at the grain boundary through diffusion and migration, followed by nucleation and growth of cracks between grains, leading to the low binding force at grain—boundary and inter—granular fracture. This phenomenon is consistent with the load—deflection curves in Figure 3c, which is manifested by a decrease in deflection value corresponding to the failure of the specimen, and a decrease in strength at 600 °C. Moreover, it is frequently associated with the high—temperature fracture manner of polycrystalline materials [22]. It can be found that both tensile and bending strength change trends with temperature are consistent with the fracture characteristics.
The high magnification SEM micrographs of the fracture surfaces of tensile and 3PB specimens exhibited similarities in deformation mechanism, which is possible evidence that the similar temperature dependence of tensile and bending strength. As illustrated in Figure 7a,c, pores and typical delamination structure can be identified at RT, while numerous micro—cracks are found and present apparent tortuosity at elevated temperatures in Figure 7b,d. Similar to the micro—cracking mechanism in polycrystalline ceramics [23], the micro—cracks may be induced by dislocation pileup and become tortuous possibly due to interaction between dislocations.

4. Conclusions

The short—term strength determination of LiH was carried out on tensile and 3PB specimens in the range of RT—600 °C. The stress–strain curves for tensile tests and the load—deflection curves for 3PB tests are analyzed, and the variation trend of strength with temperature is presented. With SEM examination of the post—fracture surfaces, the temperature effect on the short—term strength of LiH is investigated.
(1)
The temperature dependence of the strength from tensile and 3PB tests shows similarity. The strength changes little at temperatures below 400 °C for tensile specimens and below 300 °C for 3PB specimens. After exceeding the temperature corresponding to the maximum strength, the strength decreases due to the softening effect.
(2)
The different temperatures corresponding to the maximum strengths from tensile and 3PB tests are due to the different loading conditions since shear stress is the driving force for dislocation motion. Moreover, higher values of strength are measured by 3PB tests than those by tensile tests.
(3)
The fracture surfaces of specimens show the main characteristics of trans—granular fracture at different temperatures, except for 600 °C. Pores and typical delamination structures are identified at RT, while numerous micro—cracks with tortuosity are found at elevated temperatures. For 3PB specimens, the dimple—like structures with distorted grains at 500 °C and obvious inter—granular cleavage fracture at 600 °C are identified on the fracture surfaces.

Author Contributions

Funding acquisition, project administration, conceptualization, methodology, supervision, writing—review and editing, L.P.; Conceptualization, methodology, data curation, visualization, writing—original draft, D.Z.; investigation, conceptualization, writing—review and editing, W.Z.; writing—review and editing, Y.S. and Y.X. All authors have read and agreed to the published version of the manuscript.

Funding

The research was funded by the National Natural Science Foundation of China with Grant No.12175231, Anhui Natural Science Foundation of China with Grant No.2108085J05 and National Natural Science Foundation of China-NSAF with Grant No. U1730123.

Data Availability Statement

The datasets that support the results of this study are available from the corresponding author upon reasonable request.

Conflicts of Interest

The authors declare no conflict of interest.

References

  1. Zhicong, Q.; Kezhao, L.; Xisheng, W.; Lifeng, H. Studying on the high-temperature tensile property of lithium hydride. Rare Met. Mater. Eng. 2006, 10, 1560–1563. [Google Scholar]
  2. Zhicong, Q.; Hai, H.; Maobing, S.; Xisheng, W. Tensile property of lithium hydride under different environment condition. Ordnance Mater. Sci. Eng. 2006, 29, 43–46. [Google Scholar]
  3. Xiang, M.Q.; Zhang, Y.C.; Hong, M.; Liu, Z.; Leng, J.X.; Zhang, Y.; Zhang, J.; Wang, W. Fabrication and characterization of LiH ceramic pebbles by wet process. J. Nucl. Mater. 2014, 452, 343–347. [Google Scholar] [CrossRef]
  4. Lang, L.; Wenhua, L. A first-principles study of hydrogen behavior in lithium hydride. J. At. Mol. Phys. 2016, 33, 179–183. [Google Scholar]
  5. Wang, W.; Li, Q.; Li, Q.; Yang, X.; Le, G. A review of irradiation stability of lithium hydride neutron shielding material. Mater. Sci. Technol. 2016, 32, 434–437. [Google Scholar] [CrossRef]
  6. Bo, L.; Kaihui, H.; Dongwei, S.; Weicai, Y.; Yonggang, C.; Mei, L.; Jun, S. Research on measurement of residual stresses of hemispherical lithium hydride by blind-hole method. Fusion Eng. Des. 2014, 89, 365–369. [Google Scholar] [CrossRef]
  7. Messer, C.E. A Survey Report on Lithium Hydride, Medium ed.; United States Atomic Energy Commission, Technical Information Service: Washington, DC, USA, 1960; p. 64. [Google Scholar]
  8. Waldrop, D.A.; Marsicek, M.J.; Liu, K.C. Design and Evaluation of a Uniaxial Pull Test for Lithium Hydride/Deuteride; NASA STI/Recon Technical Report N; University of New Hampshire: Durham, NH, USA, 1993; Volume 93, p. 28832. [Google Scholar]
  9. Oakes, R.E., Jr. Specimen Type and Size Effects on Lithium Hydride Tensile Strength Distributions; Oak Ridge Y-12 Plant, TN (United States); U.S. Department of Energy: Washington, DC, USA, 1991; p. 45. [Google Scholar]
  10. Golubev, V.K.; Rabinovich, K.G. Influence of the initial state on the strength of pressed lithium hydride. Strength Mater. 1999, 31, 625–628. [Google Scholar] [CrossRef]
  11. Smith, R.L.; Miser, J.W. Compilation of the Properties of Lithium Hydride; Lewis Research Center: Cleveland, OH, USA, 1963. [Google Scholar]
  12. Xiulin, Z. Mechanical Properties of Materials; Nothwestern Polytechnical University Press: Xian, China, 2014. [Google Scholar]
  13. Leplay, P.; Rethore, J.; Meille, S.; Baietto, M.C. Damage law identification of a quasi brittle ceramic from a bending test using Digital Image Correlation. J. Eur. Ceram. Soc. 2010, 30, 2715–2725. [Google Scholar] [CrossRef] [Green Version]
  14. ASTM C1366-19; Standard Test Method for Tensile Strength of Monolithic Advanced Ceramics at Elevated Temperatures. ASTM International: West Conshohocken, PA, USA, 2019.
  15. ASTM C1211-18; Standard Test Method for Flexural Strength of Advanced Ceramics at Elevated Temperatures. ASTM International: West Conshohocken, PA, USA, 2018.
  16. Zhang, W.; Peng, L.; Xie, Y.; Zhou, D.; Shi, Y.; Wan, Y. Dynamic fatigue behavior of lithium hydride at elevated temperatures. Ceram. Int. 2021, 48, 10827–10833. [Google Scholar] [CrossRef]
  17. Bing, P.A.N.; Huimin, X.I.E.; Yanjie, L.I. Three-dimensional Digital Image Correlation Method for Shape and Deformation Measurement of an Object Surface. J. Exp. Mech. 2007, 22, 556–567. [Google Scholar]
  18. Hongwen, L. Mechanics of Materials; Higher Education Press: Beijing, China, 2011. [Google Scholar]
  19. Latella, B.A.; Liu, T.S. High-temperature strength behavior of synroc-C. J. Am. Ceram. Soc. 2001, 84, 117–122. [Google Scholar] [CrossRef]
  20. Jianghong, G. Fracture Mechanics of Ceramics; Tsinghua University Press: Beijing, China, 2001. [Google Scholar]
  21. Jia, R.C.; Zeng, W.D.; He, S.T.; Gao, X.X.; Xu, J.W. The analysis of fracture toughness and fracture mechanism of Ti60 alloy under different temperatures. J. Alloy. Compd. 2019, 810, 10. [Google Scholar] [CrossRef]
  22. González-Velázquez, J.L. Fractography and Failure Analysis; Springer: Berlin/Heidelberg, Germany, 2018. [Google Scholar]
  23. Ju, J.W. On micromechanical evolutionary damage models for polycrystalline ceramics. Int. J. Damage Mech. 1996, 5, 113–137. [Google Scholar] [CrossRef]
Figure 1. Dimension of the (a) tensile specimen; (b) 3PB specimen (unit: mm); (c) Image of tensile specimen with adhesive and that after fracture at 400 °C; (d) Image of 3PB specimen after fracture at RT.
Crystals 12 00840 g001
Figure 2. (a) Experimental setup of the 3D—DIC system; Strain field in form of contour plot. (b) tensile specimen and 3PB specimen.
Crystals 12 00840 g002
Figure 3. (a) Stress–strain curves of tensile specimens at RT, 200, 300, 400 and 500 °C; (b) The load versus deflection curves of 3PB specimens at RT and 200 °C; (c) The load versus deflection curves of 3PB specimens at 300, 400, 500 and 600 °C; (d) Elastic modulus obtained by tensile and 3PB tests at different temperatures.
Crystals 12 00840 g003
Figure 4. Temperature effect on strength of LiH obtained from tensile and 3PB tests.
Crystals 12 00840 g004
Figure 5. Fracture surfaces of tensile specimens for LiH at: (a) RT; (b) 200 °C; (c) 300 °C; (d) 400 °C; (e) 500 °C.
Crystals 12 00840 g005
Figure 6. Fracture surfaces of 3PB specimens for LiH at: (a) RT; (b) 200 °C; (c) 300 °C; (d) 500 °C; (e) 600 °C.
Crystals 12 00840 g006
Figure 7. High magnification SEM micrographs of fracture surfaces for tensile specimens at: (a) RT; (b) 500 °C and that for 3PB specimens at (c) RT; (d) 500 °C.
Crystals 12 00840 g007
Table 1. Test temperature, loading rate, strength, elastic modulus and stress rate of the tensile specimens and 3PB specimens.
Test TypeTemperature
(°C)
Loading Rate
(mm/min)
Strength
(MPa)
Elastic Modulus
(GPa)
Stress Rate
(MPa/s)
Test Time
(s)
TensileRT0.512.622.00.240.5
0.510.721.70.09104.1
2000.512.615.60.06183.0
0.511.315.50.179.1
3000.511.914.10.197.2
400216.210.90.437.5
500213.18.10.817.4
3PBRT0.524.911.92.211.5
0.538.38.31.623.2
2000.535.35.91.230.6
0.524.36.81.220.6
300150.77.73.4600.1
237.510.17.019.3
400134.06.93.2752.8
500221.35.84.6332.4
600211.64.71.9110.2
Publisher’s Note: MDPI stays neutral with regard to jurisdictional claims in published maps and institutional affiliations.

