Abstract
Titanium dioxide nanoparticles play a crucial role in the production of hydrogen gas evolution. Among the four polymorphic phases of TiO2 (anatase, rutile, brookite, and TiO2 (B)), the anatase phase shows good photo activity in catalytic applications. We prepared a single anatasephase of TiO2 nanoparticles usinga facile one-step ionothermal method with the existence of 1-(3,6-dioxa heptane) 3-methyl imidazolium methane sulfonate IL[DOMIMS]. The ionic liquid-based substitution reaction mechanism was utilized for the ionothermal synthesis of TiO2. The anatase phase structure and nanoparticle-like morphology of synthesized TiO2 nanomaterial were confirmed by XRD analysis and TEM studies. The vibrational frequency of the Ti–O–Ti bond at 544 cm−1 was measured usingthe FTIR spectrum, and the UV absorbance of the sample was studied usingthe UV/visible spectra. The prepared TiO2 nanoparticles showed the best results of H2 generation via awater-splitting reaction, liberating 2084 μmol·g−1·h−1 of H2 gas. TiO2 nanoparticles act as a good material for electrochemical applications such as supercapacitors and sensing of dopamine, as well as a better photocatalyst for the degradation of methylene blue.
1. Introduction
In 1972, photocatalytic water splitting was first demonstrated by Fujishima and Honda using a source of UV light and a TiO2 electrode [1]. Efficient semiconductor photocatalysts have been designed for significant progress. Among the various semiconductors, TiO2 is best-researched photocatalytic material due to its nontoxicity, environmentally benign nature, corrosion resistant, high chemical inertness, strong oxidizing power, and long-term stability [2,3,4].
TiO2 occurs in four distinct polymorphic phases: anatase (tetragonal, space group I41/amd), TiO2(B) (monoclinic, space group C2/m), rutile (tetragonal, space group P42/mnm), and brookite (orthorhombic, space group pbca) [5,6]. Among these four phases, anatase TiO2 possesses good photo catalytic applications [7,8] In comparison, the rutile phase has less reactivity due to the higher recombination rate of electron–hole pairs and a lower surface affinity for many organic compounds [9]. However, TiO2 contains low quantum efficiency, poor thermal stability, and difficult separation, whichstrongly limit its extendable applications [10]. These issues can be controlled by modifying its physical and chemical properties, such as surface area, morphology, degree of structural order, bandgap energy, porosity, and band position by means of a few appropriate reagents in the synthesis process [11].
The synthesis of TiO2 nanomaterials can be achieved using different wet chemical techniques, such as combustion, hydrothermal, sonochemical, precipitation, solvothermal, sol–gel, extraction–pyrolytic, and chemical vapor deposition methods [12,13,14,15,16,17,18]. According to the current state of the art, the synthesis of TiO2 nanomaterials using ionic liquid is a facile method to get good crystallinity [19]. Ionic liquids inhibit the aggregation of the resultant nanoparticles [20].
Ionic liquids act as soft templates;they have ordered micelle structures, low vapor pressure, thermal stability, and nonvolatile properties, which can improve the surface area of nanoparticles [21,22]. They also improve the electrical conductivity of nanoparticles when added during chemical synthesis. Researchers have synthesizedvariousinorganic metal oxides using ionic liquids. Yan Sun et al. prepared TiO2 nanoparticles using [HOOCEMIM][Cl] [23]. Macroporous TiO2 was prepared using [TF2N][C4Mim] by Zhou et al. [24]. Nakashima et al. synthesized TiO2 hollow microspheres by employing a mixture of ionic liquids, including Ti(OBu)4-[PF6][BMim] [25].
In the current research work, TiO2 nanoparticles weresynthesized using DOMIMS as an ionic liquid, and the significance of the ionic liquid for the production of hydrogen gas evolution was studied using photo catalytic water-splitting reactions. Furthermore, a thorough comparative study of the electrochemical and photocatalytic degradation work was carried out with the commercially available p-25 TiO2.
2. Method and Methodology
2.1. Synthesis of 1-(3, 6-Dioxa Heptane) 3-Methyl Imidazolium Methane Sulfonate [DOMIMS]
The procedure described in anearlier report [26] wasfollowed to prepare the abovementioned ionic liquid. First, 32 mmol of 3,6-dioxa heptyl methanesulfonatewas mixed with 32 mmol of 1-methyl imidazole, and the resulting solution was kept in an autoclave at 60 °C for 30 h. The obtained product was washed with 5 mL of ethanol and left to dry in vacuum oven, before finally collecting the colorless and very hygroscopic liquid 1-(3,6-dioxa heptane) 3-methyl imidazolium methane sulfonate. The structure of functionalized DOMIMSis shown in Figure 1.
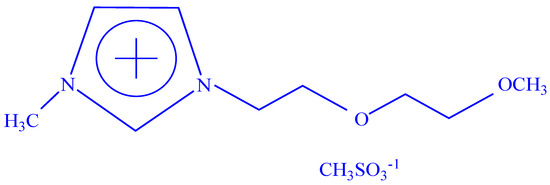
Figure 1.
Structure of DOMIMS.
2.2. Synthesis of TiO2 Nanoparticles
First, 0.5 mL of TiCl4 was introduced into amixture of 5 mL of DOMIMS ionic liquid and 1 mL of distilled water in a 10 mL of Teflon tube, and the solution was stirred until all HCl fumes dissipated. The resultant solution was kept at 120 °C for 24 h in a hot air oven. The product was centrifuged and washed with distilled water, followed by methanol and acetonitrile, before drying at 80 °C for 2 h. The obtained sample was sintered at 400 °C for 3 h and finally cooled to room temperature. The mechanism describing the reaction of TiCl4andionic liquidis shown in Figure 2.
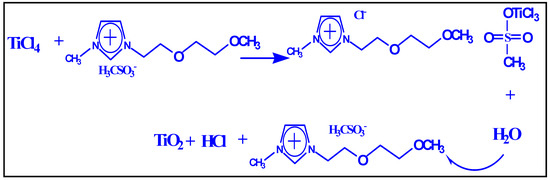
Figure 2.
Mechanism describing the reaction of TiCl4 andionic liquid.
2.3. Sample Characterization
A Rigaku Smart-Lab X-ray diffractometer with X-ray radiation of 0.15406 Å (Cu Kα) was used to analyze the crystal structure and crystal phase of TiO2. A Bruker Alpha-P spectrometer was employed to obtain FTIR spectrum of the sample. A UV/visible spectrometer was used to measure the absorption spectrum of the sample. Transmission electron microscopic (TEM) images were collected by means of an electron microscope CME-UFRGS at 100 kV.
2.4. Photocatalytic H2 Measurements
Analysis was carried out using a GC chromatograph (Agilent 6820) armed with a thermal conductivity detector. A columnar molecular sieve of size 5 Å filled with argon gas as the carrier gas was also equipped.Photocatalytic H2 generation through a water-splitting mechanism was conducted in an inward radiation type reactor along with a closed gas-circulating system. The temperature of the reaction was kept at 25 °C throughout the experiment by excluding the IR radiation with the flow of water in the water jacket of the reactor. Then, 4 mg of the TiO2 nanoparticle sample was added to 6 mL of distilled water and stirred for about 20 min to get complete dispersion. The above solution was mixed with a sacrificial agent (2 mL of ethanol). Before irradiation, the oxygen content in the system was completely removed via adegassing process using argon gas bubbling for about 15 min. The quantity of hydrogen gas produced was measured using a 50 μL gastight syringe at 0.5 h intervals.
3. Results and Discussion
XRD pattern of TiO2 nanoparticles prepared using theionothermal process is shown in Figure 3. Diffraction peaks of the XRD pattern were readily indexed to the anatase phase of TiO2, and the corresponding lattice parameters were found to be a = 3.73, c = 3.97 with aspace group of I41/amd. According to the Debye–Scherrer formula (Equation (1)), the average crystallite size of TiO2 nanoparticles was found to be ~8 nm.
where β is the full width at half maximal of the intensity, λ is the wavelength, and D is the crystallite size.
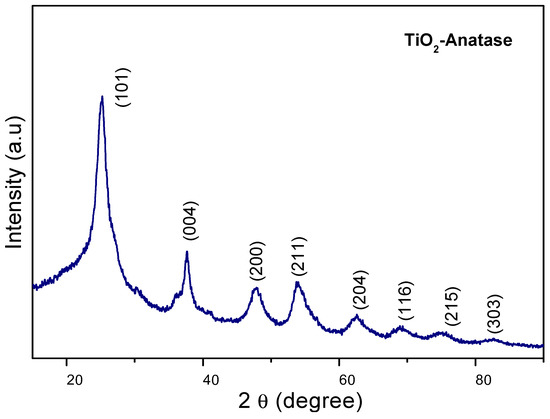
Figure 3.
XRD pattern of TiO2 nanoparticles.
FTIR spectrum (Figure 4) shows the band at 544 cm−1 attributed to Ti–O–Ti stretching vibration [27]. The band at 1134 cm−1 is the characteristic peak of aliphatic (Ionic liquid) in-plane vibrations [28]. The bands at 1400 cm−1 and 1640 cm−1 are attributed to the in-plane vibrations and C–H stretching of the imidazolium ring, respectively [29]. The band at 3400 cm−1 is indexed to the stretching vibration of the O–H bond.
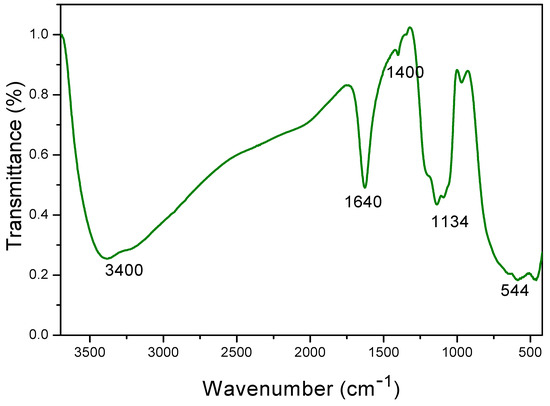
Figure 4.
FTIR Spectrum of TiO2 nanoparticles.
The UV/visible spectrum of TiO2 nanoparticles (Figure 5) exhibitedanabsorption band at 210 nm, indicating the presence of ionic liquid. The absorbance at 270 nm is attributed to the presence of titanium dioxide. This peak shows a blue shift compared to bulk titanium dioxide due to the size effect [30]. Theweak absorption at 500 nm is due to the presence of V-type centers in TiO2, which are created dueto the trapping of holes of the TiO2 in the cationic vacancies of the material [31].
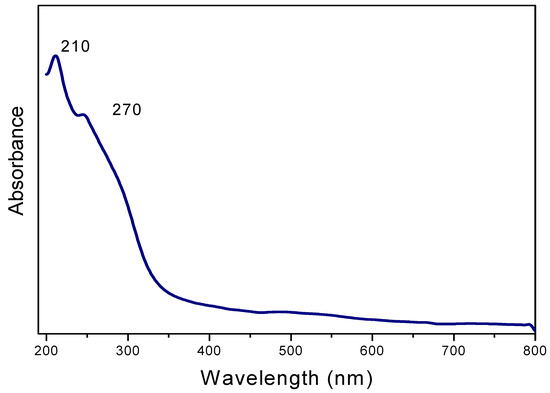
Figure 5.
UV/visible spectrum of TiO2 nanoparticles.
The nanoparticle-like morphology of TiO2 was measured using transmission electron microscopy, as shown in Figure 6. The average diameter of nanoparticles was 10–15 nm. It appearsthat the prime nanoparticles werebundled to form bigger agglomerates through the creation phase itself [32]. The size of the nanoparticles obtained from the TEM images matched well with the average crystallite size of nanoparticles found from the XRD pattern.
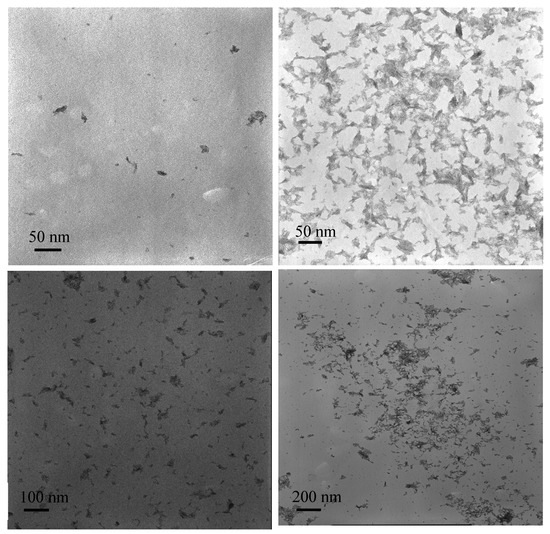
Figure 6.
TEM images of TiO2 nanoparticles.
4. Hydrogen Evolution Studies
The photocatalytic hydrogen evolution activity of TiO2 nanoparticles was determined in aqueous solutions with the addition of easily oxidizable reducing agents using metal–oxide semiconductors. The photogenerated holes wereoxidizedsacrificial agents such as ethanol, instead of water [33]. These sacrificial agents wereused in the examination of photocatalytic hydrogen and oxygen evolution reactions. The amount of hydrogen gas liberated wasplotted with UV exposure time, evidently showing that the evolution of H2 gas increased with respect to time. It was observed thatthe synthesized TiO2 nanoparticles liberated 2084 μmol·g−1·h−1of H2gas in 2.5 h (Figure 7). When the UV light wasturned off, the generation of H2 gas halted, indicating that the generation of H2 was induced by UV irradiation, confirming the photo-electrochemical reaction.
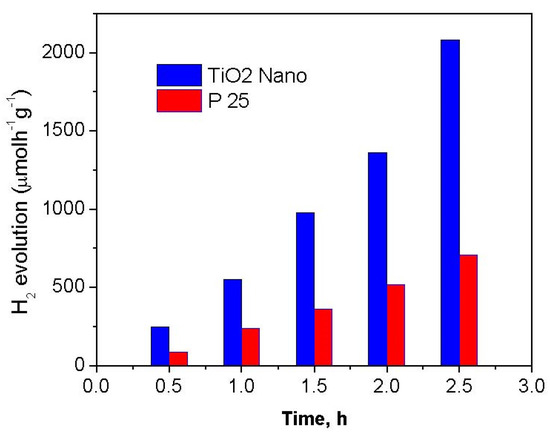
Figure 7.
Hydrogen generation of commercial (P-25) and TiO2 nanoparticles.
Acomparison of the hydrogen evolution of TiO2 nanoparticles synthesized using the hydrothermal method with various functionalized ionic liquids is shown in Table 1. This comparison indicates that the H2 gas evolution in the current study washigher compared to other TiO2 nanoparticles prepared using different ionic liquids [12,34,35]. This suggests that high crystallinity in the anatase phase leads to higher production of H2gas [36].

Table 1.
Comparison of the hydrogen evolution of TiO2 nanoparticles synthesized by hydrothermal method using various functionalized ionic liquid.
5. Electrochemical Applications
5.1. Supercapacitance Energy Storage Applications
Electrochemical impedance analysis was performedto identify the electrochemical conductivity of the material for the as-synthesized TiO2 in comparison with commercially available TiO2. A Nyquist plot was constructed. The higher-frequency region of the Nyquist plot indicates resistance due to charge transfer (Rct) of the material, whereas the lower-frequency region indicates the capacitance of the material. Figure 8a shows that commercially available TiO2 had an Rct of 93 Ω, while TiO2 had a Rct of 85 Ω. From this, it was confirmed that synthesized TiO2 was the best material for further supercapacitor studies with low impedance, as it offered less resistance during the electrochemical reaction. CV curves obtained at various scan rates (20, 50, 100, 300, 500, 1000, 2000, 3000, 5000, and 10,000 mV·s−1) are shown in Figure 8b. A small-CV area was observed at 20 mV·s−1; the area of the CV subsequently increased with the scan rate, upto the highest scan rate (10,000 mV·s−1), indicating thestability of the modified electrode [37]. The specific capacitance (Csp) of the electrode modified with TiO2 was calculated using Equation (2).
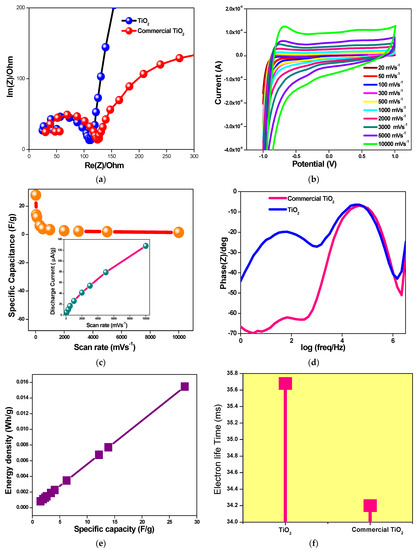
Figure 8.
(a) Nyquist impedances; (b) CV at various scan rates; (c) variation of specific capacitance (inset, discharge currents) with scan rates; (d) Bode plot; (e) variation of energy density vs. scan rates; (f) electron lifetime plot.
At 20 mV·s−1, Cspwas established to be 27.8 F/g. At 50, 100, 300, and 500 mV·s−1, Cspvalueswere found to be 14, 12.2, 6.26, and 4.07 F/g, respectively. At higher scan rates such as 1000, 2000, 3000, and 5000 mV·s−1, Csp valueswere found to be 3.38, 2.61, 2.3, and 1.96, respectively. Even at the highest scan rate of 10,000 mV·s−1, the TiO2-modified electrode showed a Cspof 1.5 F/g. This is due to the fact that, as the scan rate increased, the interaction rate between the electrode material of the constructed electrode and the electrolyte decreased. This is called diffusion limitation, caused by the ineffective diffusion of the electrolyte into the electrode surface, which decreases the specific capacitance of the material at higher scan rates.
The variation of specific capacitance with scan rate is shown in Figure 8c. The inset of the figureshows the variation of discharge current with scan rate, which was found to be linear. This reveals that a linear increased output of current from the electrode is possible during the electrochemical reaction with the increase in scan rate. The variation of energy densities of the material with scan rate isshown in Figure 8e, revealing a linear plot. The energy density of TiO2 was found to be 15.45 mWh/g at a Csp of 27.81 F/g. Bode plots were plotted (Figure 8d) to study the electron lifetime of the materials, which were used to determine the electrochemical activity of the materials during the reaction, as shown in Figure 8f. Et values were found to be 35.68 and 34.2 ms for TiO2 and commercial TiO2, respectively. Thus, electrons in the TiO2 nanomaterial had an additionalelectron lifetime of 1.48 ms, and they possessed a sufficient lifetime for the electrochemical activity toward the electrolyte. Therefore, the activity of electronsfrom TiO2 in the electrolyte is greaterwhen compared to commercial TiO2, giving risetothe superior electrochemical activity of TiO2.
5.2. Electrochemical Sensing of Dopamine
Dopamine is a bioanalyte, which acts as both a neurotransmitter and a hormone. Because of its high importance in the psychological system, it is necessary to detect it at very low concentrations. Electrochemical sensing is one of the methods used to detect analytes at low concentrations by applying voltammetric techniques using modified electrodes. In this report, a glassy carbon electrode (GCE) was modified with the synthesized TiO2 nanomaterial and used as a working electrode, along with Ag/AgCl and platinum wire, which acted as reference and counter electrodes, respectively. The CV technique was employed to detect the dopamine.
At very first, a bare GCE was tested in the presence of 5 mM dopamine and phosphate buffer solution at pH 7.0. A small peak was observed at a potential of 0.55 V with a low peak current (Ipa) of 0.824 μA. Then, a GCE modified with TiO2 (TiO2/GCE) was tested using the same solution with a phosphate buffer solution at pH 7.0. Ipa was observed at 0.022 mA with an anodic peak potential of 0.667 V, indicating the existence of dopamine at a very low scan rate (ν) of 50 mV·s−1,as shown in Figure 9a. Anearly71-fold more intense current peak was produced compared to bare GCE, indicating the high sensitivity of TiO2 toward the detection of dopamine. The cathodic peak current (Ipc) was observed at −0.0138 mA with a cathodic peak potential of 0.27 V. The onset potential (Eonset) was observed at 0.29 V [38].
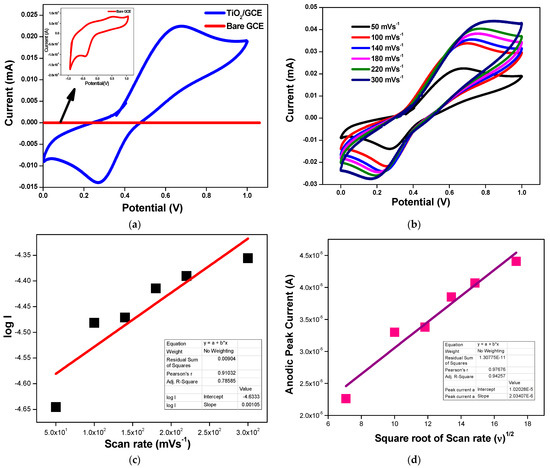
Figure 9.
(a) Comparison of CVs; (b) variation of scan rates; (c) plot of log I vs. scan rate; (d) anodic peak current vs. ν½.
Further CV analysis was performed by subjecting the TiO2/GCE to different scan rates ranging from 100 to 300 mV·s−1, while keeping the concentration of dopamine constant. Ipa values were found to increase with the scan rate. A shifting in Ipa toward a more positive potential was observed along with the increased area. A plot of log of Ipavs. scan rate is shown in Figure 9c and fitted using a linear equation. These scan rate variations with peak currents were in accordance with the Randles–Sevcik equation, and the plot of Ipa vs. ν1/2 was found to be linear, as shown in Figure 9d. These outcomes propose that the electrochemical oxidation and reduction of dopamine taking place at the surface of the TiO2/GCE was diffusion-controlled. Hence, TiO2is an efficient candidate for the sensing of dopamine.
6. Photocatalytic Dye Degradation
TiO2, a well-known material, shows a good degradation property due to its semiconducting nature. The ionic liquid-assisted synthesis of TiO2 was tested directly for the degradation of acationic thiazine dye, methylene blue (MB). A fine comparison was made between the commercially available TiO2 and prepared TiO2 using a dye solutionwith a low concentrationof 5 ppm. A catalytic load of 5 mg of commercially available TiO2 or prepared TiO2 was dispersed in the dye solution. Then, the solutionswere inserted into a UV/visible photoreactor consisting of an UV lamp as a light source and allowed to attain adsorption–desorption equilibrium conditions in the dark for half an hour. A UV/visible spectrometer was employed to obtain the absorbance of the solution every half an hour. of the percentage dye degradation could be obtained using Equation (3).
The degradation mechanism for the degradation of MB using TiO2 as photocatalyst is proposed below.
TiO2 absorbs asuitable amount of energy in the form of UV light, and the electrons present in the valence band of TiO2 are excited into the conduction band of the semiconductor, as shown in Figure 10. Thiscreates holes in the valence band, which are responsible for the photooxidation of water molecules into hydroxyl radicals. Furthermore, electrons in the valence band reduce the oxygen molecule into hydroxyl radicals viathe formation of intermediate species such as superoxide radicals. These hydroxyl radicals are ultimately responsible for the degradation of MB dye. The chemical reactions during the degradation of the dye arepresented in Equations (4)–(11).
TiO2 + hν (UV) → TiO2 (h+νb+ e−cb).
TiO2 (e−cb) + O2→·O2−.
·O2−+ H+↔HOO·.
2HOO·→ H2O2 +O2.
H2O2→ 2·OH.
TiO2 (h+νb) + H2O →·OH +H+.
Dye +·OH +.O2−→ CO2 + H2O (byproduct).
Dye+ TiO2 (h+νb) →oxidation product.
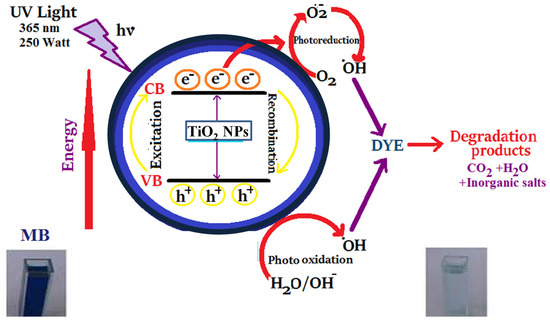
Figure 10.
Mechanism of MB degradation.
A plot of percentagedegradation of the dye vs. time is shown in Figure 11a, clearly indicating the superior degradation efficiency of the prepared TiO2 when compared to the commercial bulk TiO2 nanomaterial. When the material acquired a nano size, both the chemicaland the electronic properties changed, which induced the different behavior of the electrons present in the sample as compared to the bulk semiconducting material. Electrons and holes present in the material were responsible for the conversion of intermediate species such as superoxide radicals into hydroxyl radicals. Then, hydroxyl radicals were able to degrade the organic dye into nontoxic degradation products.
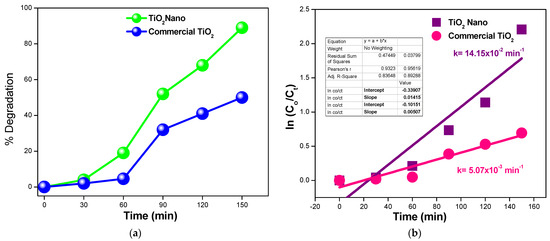
Figure 11.
(a) Percentage degradation of dye vs. time; (b) kinetics of degradation of MB dye.
The kinetics of the degradation reaction was studied by plotting a graph of ln(C0/Ct) vs. time (Figure 11b). It can be observed that the degradation reaction followed pseudo-first-order kinetics with rate constants of 14.15 × 10⁻² and 5.07 × 10⁻³ min−1 for the degradation of MB using the prepared TiO2 and commercial TiO2 catalysts, respectively. This clearly indicates that the rate of degradation of MB using TiO2 was tenfold stronger than that using commercial TiO2. This proves that the prepared TiO2 nanoparticles are very much desirable candidates for the degradation of MB.
7. Conclusions
In summary, this article reported the obtention of the anatase phase of TiO2 nanoparticles using anionothermal method withDOMIMS ionic liquid at 120 °C for 24 h. Single anatase-phase TiO2 nanoparticles wereconfirmed by XRD, and the presence of IL in the sample was measured using the FTIR and UV/visible spectra. TEM images indicated thatthe size of the TiO2 nanoparticles wasin the range of 10–15 nm. The synthesized TiO2 nanoparticles generated 2084 μmol·g−1·h−1 of H2 gas in2.5 h. These results allow concluding that the self-assembling nature of the ILenhanced the physical and chemical characteristics of TiO2 nanoparticles by limiting the aggregation of nanoparticles for improved hydrogen generation. TiO2 nanoparticles showeda good response toward energy storage supercapacitance applications with an energy density and Csp of 15.45 mWh/g and 27.81 F/g, respectively. They are also a potential candidate for the detection of dopamine with a high current response. Lastly, they showed good photocatalytic activity toward the degradation of MB.
Author Contributions
Conceptualization, G.N.; methodology, T.L.S. and T.J.; validation, F.A.A. and N.A.; formal analysis, M.A.A.; investigation, M.J.; resources, M.A.A. and M.J.; data curation, F.A.A.; writing—original draft preparation, T.L.S. and T.J.; funding acquisition, A.A. All authors have read and agreed to the published version of the manuscript.
Funding
The authors would like to acknowledge the support of the Ministry of Education, Kingdom of Saudi Arabia for this research through a grant (PCSED-021-18) under the Promising Center for Sensors and Electronic Devices (PCSED) at Najran University, Kingdom of Saudi Arabia. The authors also thank the Distinguished Scientist Fellowship Program (DSFP) at KSU for financial support.
Institutional Review Board Statement
Not applicable.
Informed Consent Statement
Not applicable.
Data Availability Statement
Not applicable.
Acknowledgments
The authors would like to acknowledge the support of the Ministry of Education, Kingdom of Saudi Arabia for this research through a grant (PCSED-021-18) under the Promising Center for Sensors and Electronic Devices (PCSED) at Najran University, Kingdom of Saudi Arabia. The authors also thank the Distinguished Scientist Fellowship Program (DSFP) at KSU for financial support. Soundarya T.L. is thankful forthe financial support from the Department of Science and Technology (DST) throughthe INSPIRE Fellowship (Registration Number: IF200049). G. Nagaraju acknowledges (i) BRNS-BARC, DAE, Bombay, Govt. of India (37(2)/14/25/2015/BRNS dated 3 December 2015) and (ii) DST Nanomission, Govt. of India (No. SR/NM/NS-1262/2013) for thefinancial support to carry out this research.
Conflicts of Interest
The authors declare no conflict of interest.
References
- Ravishankar, T.; Nagaraju, G.; Dupont, J. Photocatalytic activity of Li-doped TiO2 nanoparticles: Synthesis via ionic liquid-assisted hydrothermal route. Mater. Res. Bull. 2016, 78, 103–111. [Google Scholar] [CrossRef]
- Smith, A. Textbook of Biochemistry with Clinical Correlations; Portland Press Limited: London, UK, 1983. [Google Scholar]
- Burbach, J.P.H. Genetic pathways in the developmental specification of hypothalamic neuropeptide and midbrain catecholamine systems. Eur. J. Pharmacol. 2000, 405, 55–62. [Google Scholar] [CrossRef]
- Mohen, B.; Saeed, M.; Marzieh, M. Inorg Application of electrochemical techniques at a nanostructure-based modified sensor for analyte quantitation. Met-Org. Nano-Metal Chem. 2016, 46, 1026–1032. [Google Scholar]
- Lahlou, S.; Lima, P.F.A.; Interaminense, L.F.L.; Duarte, G.P. Blunted central bromocriptine-induced tachycardia in conscious, malnourished rat. Pharmacol. Toxicol. 2003, 92, 189–194. [Google Scholar]
- Salzman, C.D.; Belova, M.A.; Paton, J.J. Blunted central bromocriptine-induced tachycardia in conscious, malnourished rats. Curr. Opin. Neurobiol. 2005, 15, 721–729. [Google Scholar] [CrossRef] [PubMed][Green Version]
- Wightman, R.M.; May, L.J.; Michael, A.C. Detection of dopamine dynamics in the brain. Anal. Chem. 1988, 60, 769A–793A. [Google Scholar] [CrossRef] [PubMed]
- Bhalodia, N.R.; Shukla, V.J. Antibacterial and antifungal activities from leaf extracts of Cassia fistula.: An ethnomedicinal plant. Adv. Pharm. Technol. Res. 2011, 2, 104–109. [Google Scholar] [CrossRef] [PubMed]
- Hurum, D.C.; Agrios, A.G.; Crist, S.E.; Gray, K.A.; Rajh, T.; Thurnauer, M.C. Probing reaction mechanisms in mixed phase TiO2 by EPR. J. Electron Spectrosc. Relat. Phenom. 2006, 150, 155–163. [Google Scholar] [CrossRef]
- Eslami, H.; Moztarzadeh, F.; Kashi, T.S.J.; Khoshroo, K.; Tahriri, M. Hydrothermal synthesis and characterization of TiO2-derived nanotubes for biomedical applications, Synthesis and Reactivity in Inorganic. Met-Org. Nano-Metal Chem. 2015, 46, 1149–1156. [Google Scholar] [CrossRef]
- Baig, N.; Kammakakam, I.; Falath, W. Nanomaterials: A review of synthesis methods, properties, recent progress, and challenges. Mater. Adv. 2021, 2, 1821–1871. [Google Scholar] [CrossRef]
- Cheng, B.; Le, Y.; Yu, J.; Hazard, J. Preparation and enhanced photocatalytic activity of Ag@ TiO2 core–shell nanocomposite nanowires. J. Hazard. Mater. 2010, 177, 971–977. [Google Scholar] [CrossRef] [PubMed]
- JCosterton, W.; Stewart, P.S.; Greenberg, E.P. Bacterial biofilms: A common cause of persistent infections. Science 1999, 284, 1318–1322. [Google Scholar] [CrossRef] [PubMed]
- Patzke, G.R.; Zhou, Y.; Kontic, R.; Conrad, F. Angew. Oxide nanomaterials: Synthetic developments, mechanistic studies, and technological innovations. Chem. Int. Ed. 2011, 50, 826–859. [Google Scholar] [CrossRef] [PubMed]
- Borghols, W.J.H.; Lutzenkirchen-Hecht, D.; Haake, U.; Chan, W.; Lafont, U.; Kelder, E.M.; van Eck, E.R.H.; Kentgens, A.P.M.; Mulder, F.M.; Wagemaker, M. Lithium storage in amorphous TiO2 nanoparticles. J. Electrochem. Soc. 2010, 157, A582–A588. [Google Scholar] [CrossRef]
- Lafont, U.; Mountjoy, D.; Chadwick, A.V.; Kelder, E.M. In situ structural changes upon electrochemical lithium insertion in nanosized anatase TiO2. J. Phys. Chem. C 2009, 114, 1372–1378. [Google Scholar] [CrossRef]
- Li, B.; Ning, F.; He, Y.; Du, H.; Yang, Q.; Ma, J.; Kang, F.; Hsu, C. Synthesis and characterization of long life Li4Ti5O12/C composite using amorphous TiO2 nanoparticles. Int. J. Electrochem. Sci. 2011, 6, 3210–3223. [Google Scholar]
- Serga, V.; Burve, R.; Krumina, A.; Romanova, M.; Kotomin, E.A.; Popov, A.I. Extraction–pyrolytic method for TiO2 polymorphs production. Crystals 2021, 11, 431. [Google Scholar] [CrossRef]
- Raveendran, P.; Fu, J.; Wallen, S.L. Completely "green" synthesis and stabilization of metal nanoparticles. Am. Chem. Soc. 2003, 146, 13940–13941. [Google Scholar] [CrossRef] [PubMed]
- Makarov, V.V.; Love, A.J.; Sinitsyna, O.V.; Makarova, S.S.; Yaminsky, I.V.; Taliansky, M.E.; Kalinina, N.O. ‘Green’ Nanotechnologies: Synthesis of Metal Nanoparticles Using Plants. Acta Naturae 2014, 1, 35–44. [Google Scholar] [CrossRef]
- Marr, P.C.; Marr, A.C. Ionic liquid gel materials: Applications in green and sustainable chemistry. Green Chem. 2016, 18, 105–128. [Google Scholar] [CrossRef]
- Łuczak, J.; Paszkiewicz, M.; Krukowska, A.; Malankowska, A.; Zaleska-Medynska, A. Ionic liquids for nano-and microstructures preparation. Part 1: Properties and multifunctional role. Adv. Colloid Interface Sci. 2016, 230, 13–28. [Google Scholar] [CrossRef]
- Nagaraju, G.; Ebeling, G.; Goncalves, R.V.; Teixeira, S.R.; Weibel, D.E.; Dupont, J. Controlled growth of TiO2 nanomaterials in ionic liquids for photocatalytic H2 generation. J. Mol. Catal. A Chem. 2013, 378, 213–220. [Google Scholar] [CrossRef]
- Yong, Z. Recent Advances in Ionic Liquids for Synthesis of Inorganic Nanomaterials. Curr. Nanosci. 2005, 1, 35–42. [Google Scholar]
- Dupont, J. From molten salts to ionic liquids: A “nano” journey. Acc. Chem. Res. 2011, 44, 1223–1231. [Google Scholar] [CrossRef] [PubMed]
- Qi, L.; Xu, Z.; Jiang, X.; Hu, C.; Zou, X. Preparation and antibacterial activity of chitosan nanoparticles. Carbohydr. Res. 2004, 339, 2693–2700. [Google Scholar] [CrossRef]
- Ivanova, T.; Harizanova, A.; Koutzarova, T.; Vertruyen, B. Preparation and characterization of ZnO–TiO2 films obtained by sol-gel method. J. Non-Cryst. Solids 2011, 357, 2840–2845. [Google Scholar] [CrossRef][Green Version]
- Singh, S.K.; Dhepe, P.L. Novel Synthesis of Immobilized Brønsted-Acidic Ionic Liquid: Application in Lignin Depolymerization. ChemistrySelect 2018, 3, 5461–5470. [Google Scholar] [CrossRef]
- Fujishima, A. Electrochemical photolysis of water at a semiconductor electrode. Nature 1972, 238, 37–38. [Google Scholar] [CrossRef] [PubMed]
- Łapiński, M.; Kościelska, B.; Winiarski, A.; Sadowski WJ AP, P.A. XPS Study of superconducting LiTi2O4 and LiTi2-xCuxO4 Sol-gel derived powders and thin films. Acta Phys. Pol. A 2014, 126, A107–A109. [Google Scholar] [CrossRef]
- González, R.; Monge, M.A.; Santiuste, J.E.M.; Pareja, R.; Chen, Y.; Kotomin, E.; Kukla, M.M.; Popov, A.I. Photoconversion of F-type centers in thermochemically reduced MgO single crystals. Phys. Rev. B 1999, 59, 4786. [Google Scholar] [CrossRef]
- Svecova, L.; Cremel, S.; Sirguey, C.; Simonnot, M.O.; Sardin, M.; Dossot, M.; Bion, F.M. Comparison between batch and column experiments to determine the surface charge properties of rutile TiO2 powder. J. Colloid Interface Sci. 2008, 325, 363–370. [Google Scholar] [CrossRef]
- Yu, J.C.; Ho, W.; Jiang, Z.; Zhang, L. Effects of F- doping on the photocatalytic activity and microstructures of nanocrystalline TiO2 powders. Chem. Mater. 2002, 14, 3808–3816. [Google Scholar] [CrossRef]
- Sahoo, N.; Apparao, K. Process-parameter optimization of Sb2O3 films in the ultraviolet and visible region for interferometric applications. Appl. Phys. A 1996, 63, 195–202. [Google Scholar] [CrossRef]
- Serpone, N.; Lawless, D.; Khairutdinov, R. Size effects on the photophysical properties of colloidal anatase TiO2 particles: Size quantization versus direct transitions in this indirect semiconductor. J. Phys. Chem. 1995, 45, 16646–16654. [Google Scholar] [CrossRef]
- Lei, Y.; Zhang, L.D.; Meng, G.W.; Li, G.H.; Zhang, X.Y.; Liang, C.H.; Chen, W.; Wang, S.X. Tailoring luminescence properties of TiO2 nanoparticles by Mn doping. Appl. Phys. Lett. 2001, 78, 1125–1127. [Google Scholar] [CrossRef]
- Soundarya, T.L.; Ravikiran, Y.T.; Nirmala, B.; Nagaraju, G. Green synthesis of LiZnVO4 nanoparticles and its multiple applications towards electrochemical sensor, supercapacitor, humidity sensing, photoluminescence and antioxidant activities. J. Mater. Sci. Mater. Electron. 2022, 33, 10902–10918. [Google Scholar] [CrossRef]
- Soundarya, T.L.; Nirmala, B.; Alharthi, F.A.; Nagaraj, B.; Nagaraju, G. HRSL supported fabrication of LiZnVO4 nanoparticles: Applications to photoluminescence, dye elimination and biosensing. Mater. Sci. Eng. B 2022, 280, 115718. [Google Scholar] [CrossRef]
Publisher’s Note: MDPI stays neutral with regard to jurisdictional claims in published maps and institutional affiliations. |
© 2022 by the authors. Licensee MDPI, Basel, Switzerland. This article is an open access article distributed under the terms and conditions of the Creative Commons Attribution (CC BY) license (https://creativecommons.org/licenses/by/4.0/).