Article

Ab-Initio Study of Calcium Fluoride Doped with Heavy Isotopes

1
TU Wien, Atominstitut, Stadionallee 2, 1020 Vienna, Austria
2
TU Wien, Institute for Theoretical Physics, Wiedner Hauptstraße 8-10/136, 1040 Vienna, Austria
3
TU Wien, Center for Computational Materials Science and Engineering, Wiedner Hauptstraße 8-10/134, 1040 Vienna, Austria
*
Author to whom correspondence should be addressed.
Crystals 2022, 12(8), 1128; https://doi.org/10.3390/cryst12081128
Submission received: 15 July 2022 / Revised: 4 August 2022 / Accepted: 6 August 2022 / Published: 11 August 2022
(This article belongs to the Special Issue Defects in Crystals)

Abstract

:
Precision laser spectroscopy of the 229-thorium nuclear isomer transition in a solid-state environment would represent a significant milestone in the field of metrology, opening the door to the realization of a nuclear clock. Working toward this goal, experimental methods require knowledge of various properties of a large band-gap material, such as calcium fluoride doped with specific isotopes of the heavy elements thorium, actinium, cerium, neptunium, and uranium. By accurately determining the atomic structure of potential charge compensation schemes by using a generalized gradient approximation within the ab-initio framework of density functional theory, calculations of electric field gradients on the dopants become accessible, which cause a quadrupole splitting of the nuclear-level structure that can be probed experimentally. Band gaps and absorption coefficients in the range of the 229-thorium nuclear transition are estimated by using the G 0 W 0 method and by solving the Bethe–Salpeter equation.

1. Introduction

The 229-thorium isotope has an exceptionally low-lying metastable nuclear excited state (229mTh) [1]. Current best estimates assign its value as 8.2 ( 2 )   e V [2,3,4], being comparable to electronic transition energies and notably within the range of laser spectroscopy [1,5,6]. Taking advantage of this unique property, a number of precision spectroscopy experiments have been proposed, which could help detect certain types of dark matter or physics beyond the standard model [6,7].
Several experimental challenges prohibit an immediate measurement, most notably because of the fact that the isomeric energy is not precisely known [8,9,10,11]. Doping 229 Th into a solid-state host crystal would allow one to probe a mesoscopic number of nuclei ( 10 10 to 10 15 ) and lock the nuclei into the crystal lattice for observation [6,12]. Photons absorbed and emitted during excitation and de-excitation must pass the host material unperturbed; hence its band gap needs to exceed the isomer energy. Because of additional desirable features, a suitable host crystal is the calcium fluoride (CaF2) compound [13,14].
Localized electronic states around the dopants may be energetically located in the band gap of pristine CaF2, reducing the material’s optical transmission range [13]. Even so, previous estimates for the energetically favored structural arrangement indicate transparency at the isomer energy [13].
However, the extreme scarcity (only ∼ m g being globally available for research) and the need for further energy measurements prompted other proposals to populate the Th nuclei to their first excited state [6]. Apart from direct laser excitation, there are two experimentally viable sources of 229mTh: α -decay of the 233-uranium isotope and β decay of 229-actinium, which both are to decay within the host crystal after doping [6,15,16]. Thus, optical properties of doped CaF2 crystals with these dopants and their favorable charge compensation schemes after decay also need to be considered.
Apart from photon detection upon de-excitation, another way to verify that the 229 Th nuclei are in the excited state is by measuring the interaction of the crystal electric field with the nuclear quadrupole moment (nuclear quadrupole resonance spectroscopy) [17]. Importantly, the resonance frequency depends only on the known quadrupole moment of the nucleus and the electric field gradient (EFG) at the nucleus position [18]. In order to set up experimental devices and provide reference samples, more accessible elements that have similar properties with respect to their nuclear quadrupole moments are neptunium and uranium [19].
Finally, impurities of oxygen and cerium, the latter originating from the chemical process to prepare 229 Th for doping, cannot be completely ruled out [20], which may give rise to undesirable optical features of the doped system.

2. Materials and Methods

All simulations are performed with the Vienna Ab-initio Simulation Package (VASP) version 6.1.0 [21,22,23,24,25], implementing density functional theory within the projector augmented wave method [26]. We use the generalized gradient approximation (GGA) of the exchange correlation functional as devised by Perdew et al. [27] (PBE) for structural optimization and for the calculation of electric field gradients (EFGs) 2 V / x i x j . The single-shot variant of the G W approximation [28] ( G 0 W 0 ) with PBE orbitals is used for band-gap calculations and the absorption coefficient is estimated via solution of the Bethe–Salpeter Equation (BSE) [29]. Selected results are moreover calculated with the hybrid functional HSE06 [30] in order to provide a reference for PBE calculations when a G 0 W 0 comparison is not computationally feasible. Geometry optimization is performed with a conjugate gradient algorithm and a convergence criterion of 10 3 e V Å 1 as the maximum force acting on an ion.
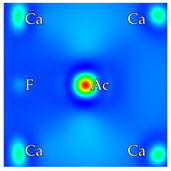
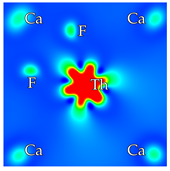
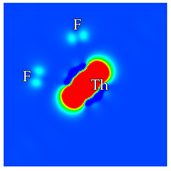
Initial positions (before relaxation) for interstitial ions are along the lattice vectors of the conventional cubic cell of pristine CaF2, at the regular Ca-F distance from the dopant. Calcium vacancies are considered at nearest-neighbor positions. In total, there are 6 and 12 possibilities for interstitial fluorines and calcium vacancies, respectively. In cases where a fluorine is removed from the crystal, only the nearest neighbor F anions to the dopant are considered, of which there are 8. Reducing these numbers further depends on the symmetry of each scheme separately. Based on previous analysis and the local chemical environment, it is reasonable to assume that the dopant will be situated on a Ca site (substitutional doping) [13]. The number of investigated charge compensation schemes depends on the amount of surplus fluorine and the extra charges introduced by the dopant. The following is a complete list of compensation schemes considered in this work (in Kröger–Vink notation [31]) along with the number of symmetrically unique initial positions: no compensation (1), F i (1), 2 F i (2), 3 F i (2), V Ca (1), 2 V Ca (4), V Ca + F i (3), V Ca + 2 F i (7), V Ca + 3 F i (8), V Ca + V F (3), 2 V Ca + 1 F i (13) and O F (1).
Atoms that are ejected from the crystal due to substitutional doping or the creation of vacancies, as well as residuary ions from the compound that initially contained the dopant, must be accounted for in order to compare total energies between the compensation schemes, which are calculated as E inside + E environment . Here “inside” refers to all atoms considered in the VASP calculation, and “environment” refers to the energetically favored compounds, created by the beforementioned remnants.
Concerning the predictive capabilities of the resulting total energies, noteworthy drawbacks stem from the idealized model of a static, infinitely extending bulk and not necessarily from methodical reasons. In particular, surface energies and kinetic effects are completely unaccounted for in this model. For instance, experimental evidence suggests there is a high mobility of fluorine anions in the crystal bulk during annealing whereas displacements of calcium ions may be hindered due to their increased mass and ionic radius [32]. On the other hand, formation energies predicted by GGA-DFT are expected to deviate from the experiment by 0.1   e V [33], smaller than most energy differences between compensation schemes observed in this work.
Initially, structures are relaxed at relatively high doping concentrations, with one impurity per 31 calcium atoms in a 2 × 2 × 2   =   2 3 structure of the conventional unit cell of CaF2. For computational reasons, optical calculations are also performed with this system size. In order to determine the EFG, energetically favorable structures are again relaxed in a 3 3 super structure (1 dopant per 107 Ca atoms).
The energy cutoff is converged at 675 e V with the criterion that the total energy deviates at most by 3   ×   10 3   e V /atom to a reference calculation. All doped systems are studied by using a Γ -point sampling of the first Brillouin zone. Furthermore, we use Gaussian smearing with a smearing parameter of 0.05   e V , which may be smaller in cases where partial occupancies would be observed by using this setting. In fully compensated systems and for pristine CaF2, spin polarization is not considered. Scalar relativistic effects are considered but corrections due to spin-orbit coupling are neglected.
Because a main concern of this work are optical properties, we use pseudopotentials of the GW type whenever possible. For calcium, we choose the Ca_sv_GW variant whereas for fluorine, the F_GW_new type is used. Cerium also has a Ce_GW type available; for all other heavy elements, we choose the standard Ac, U, Th and Np versions.
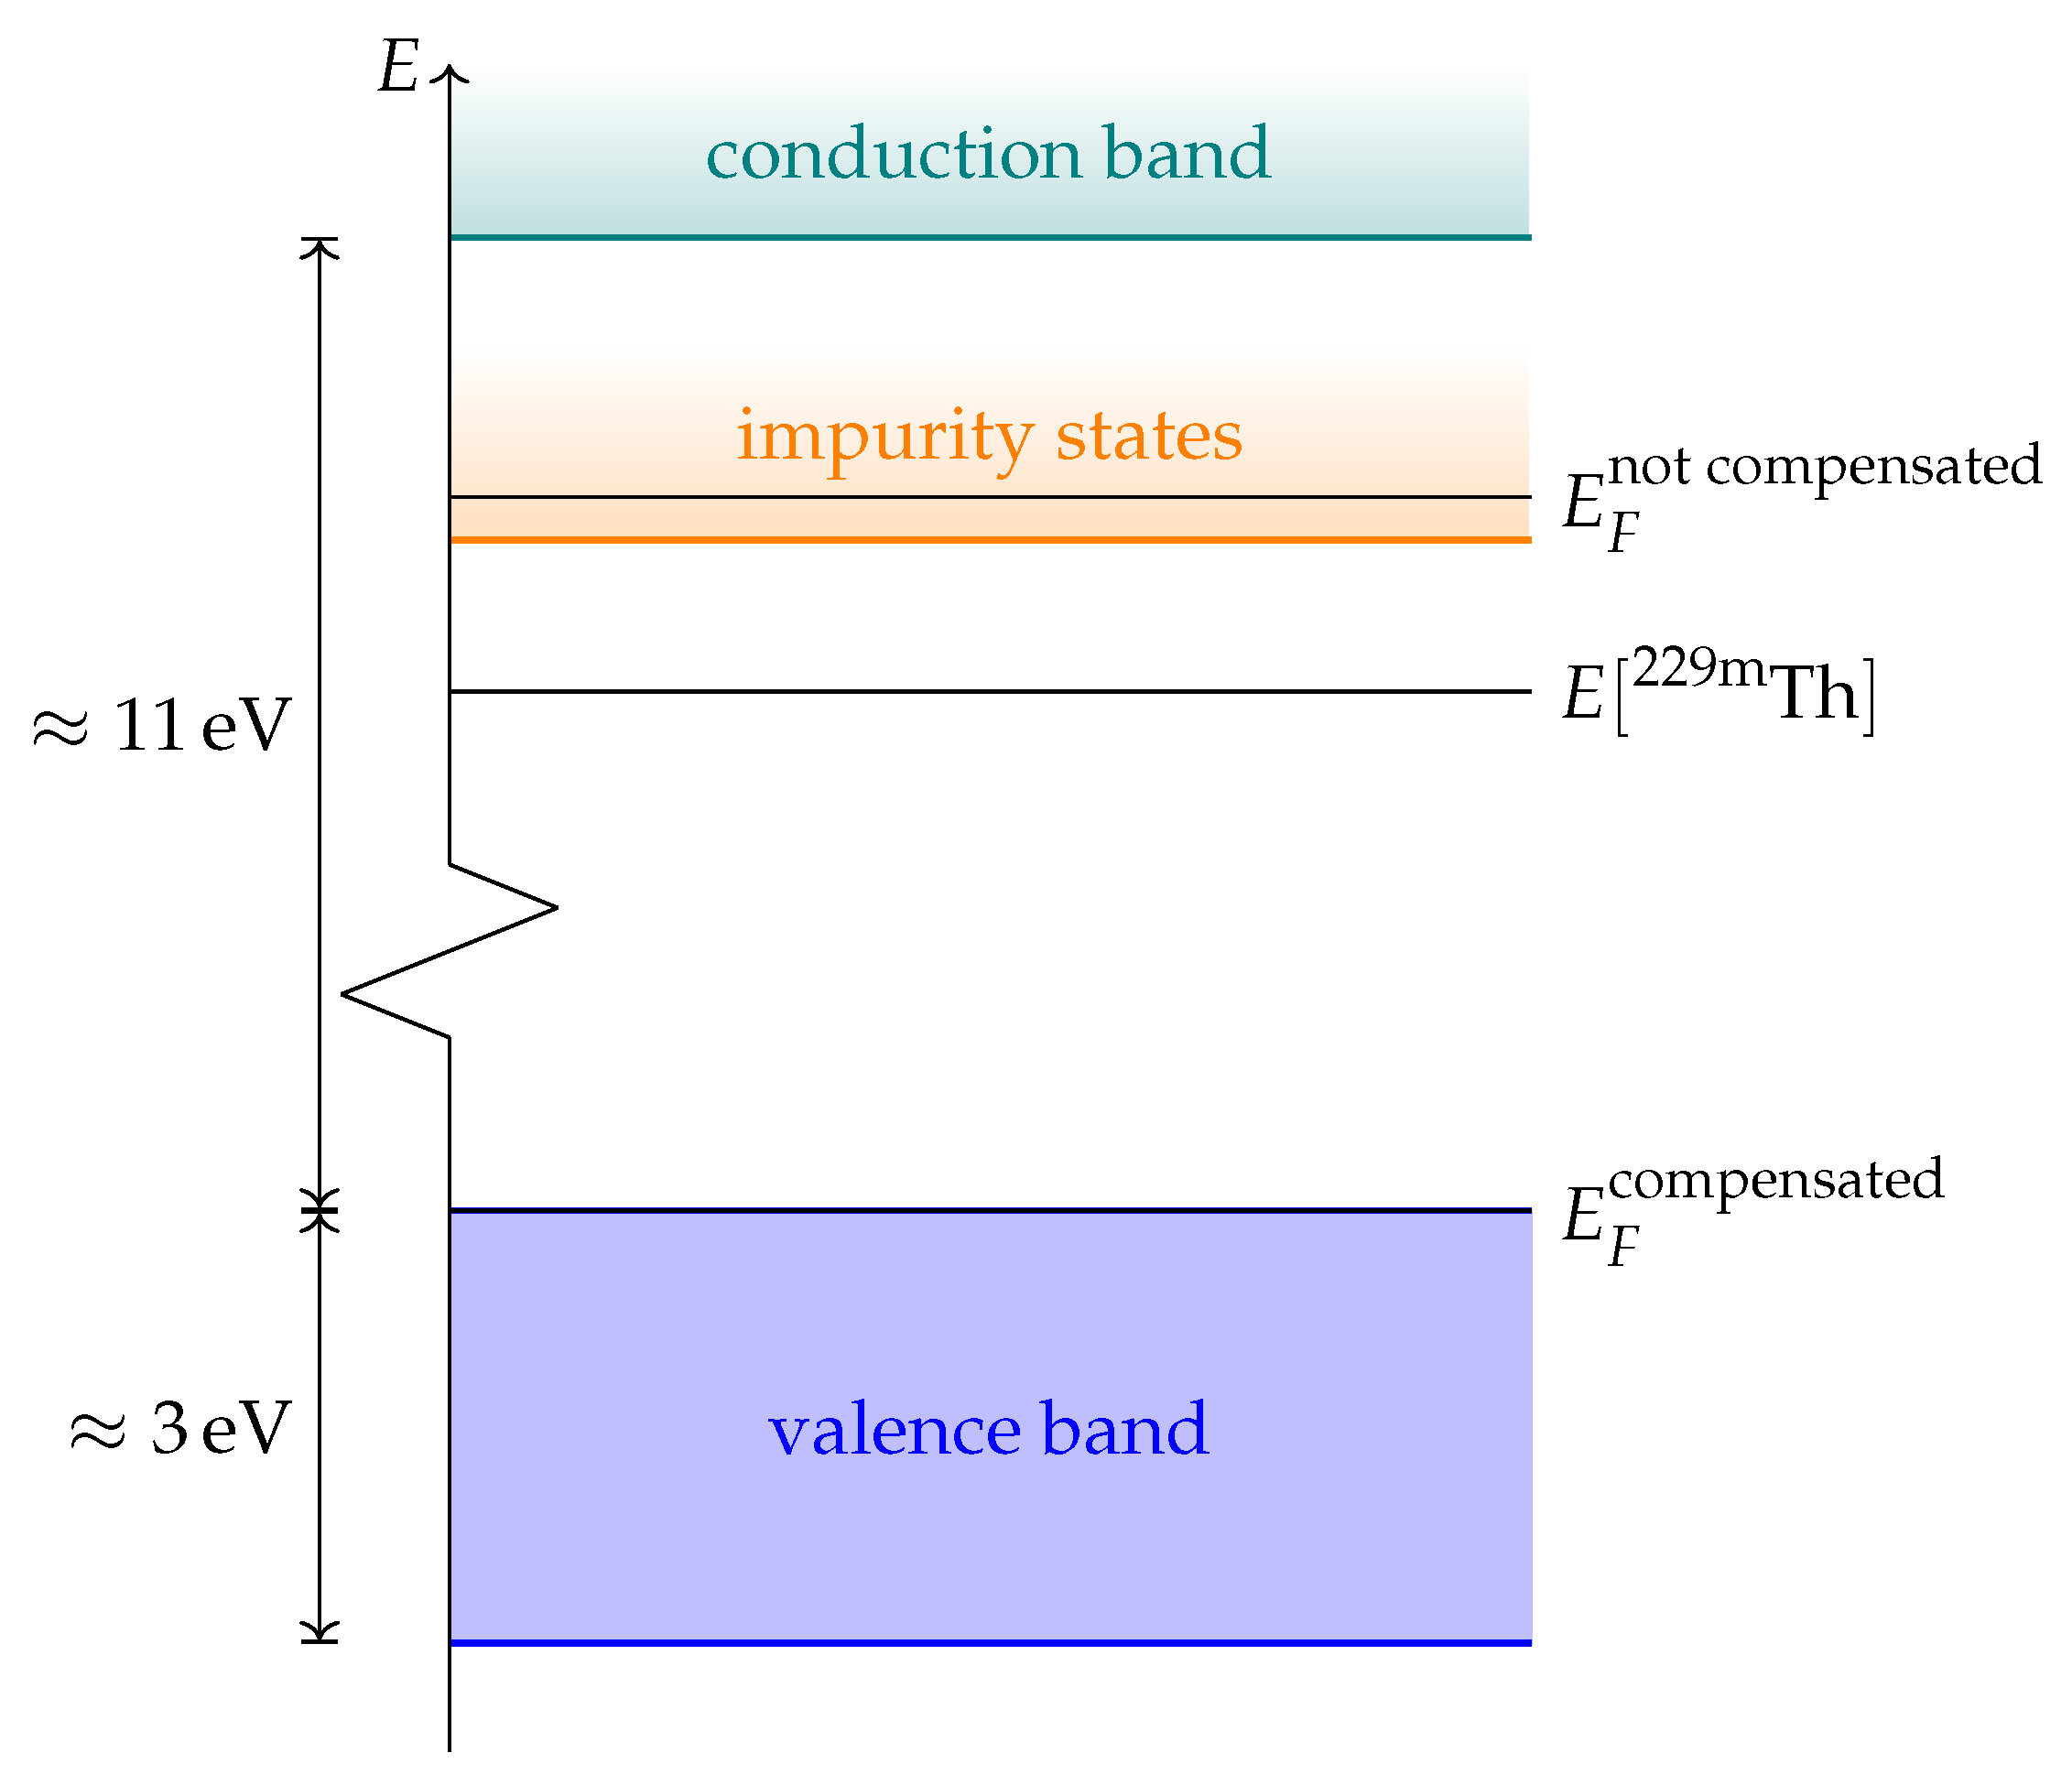
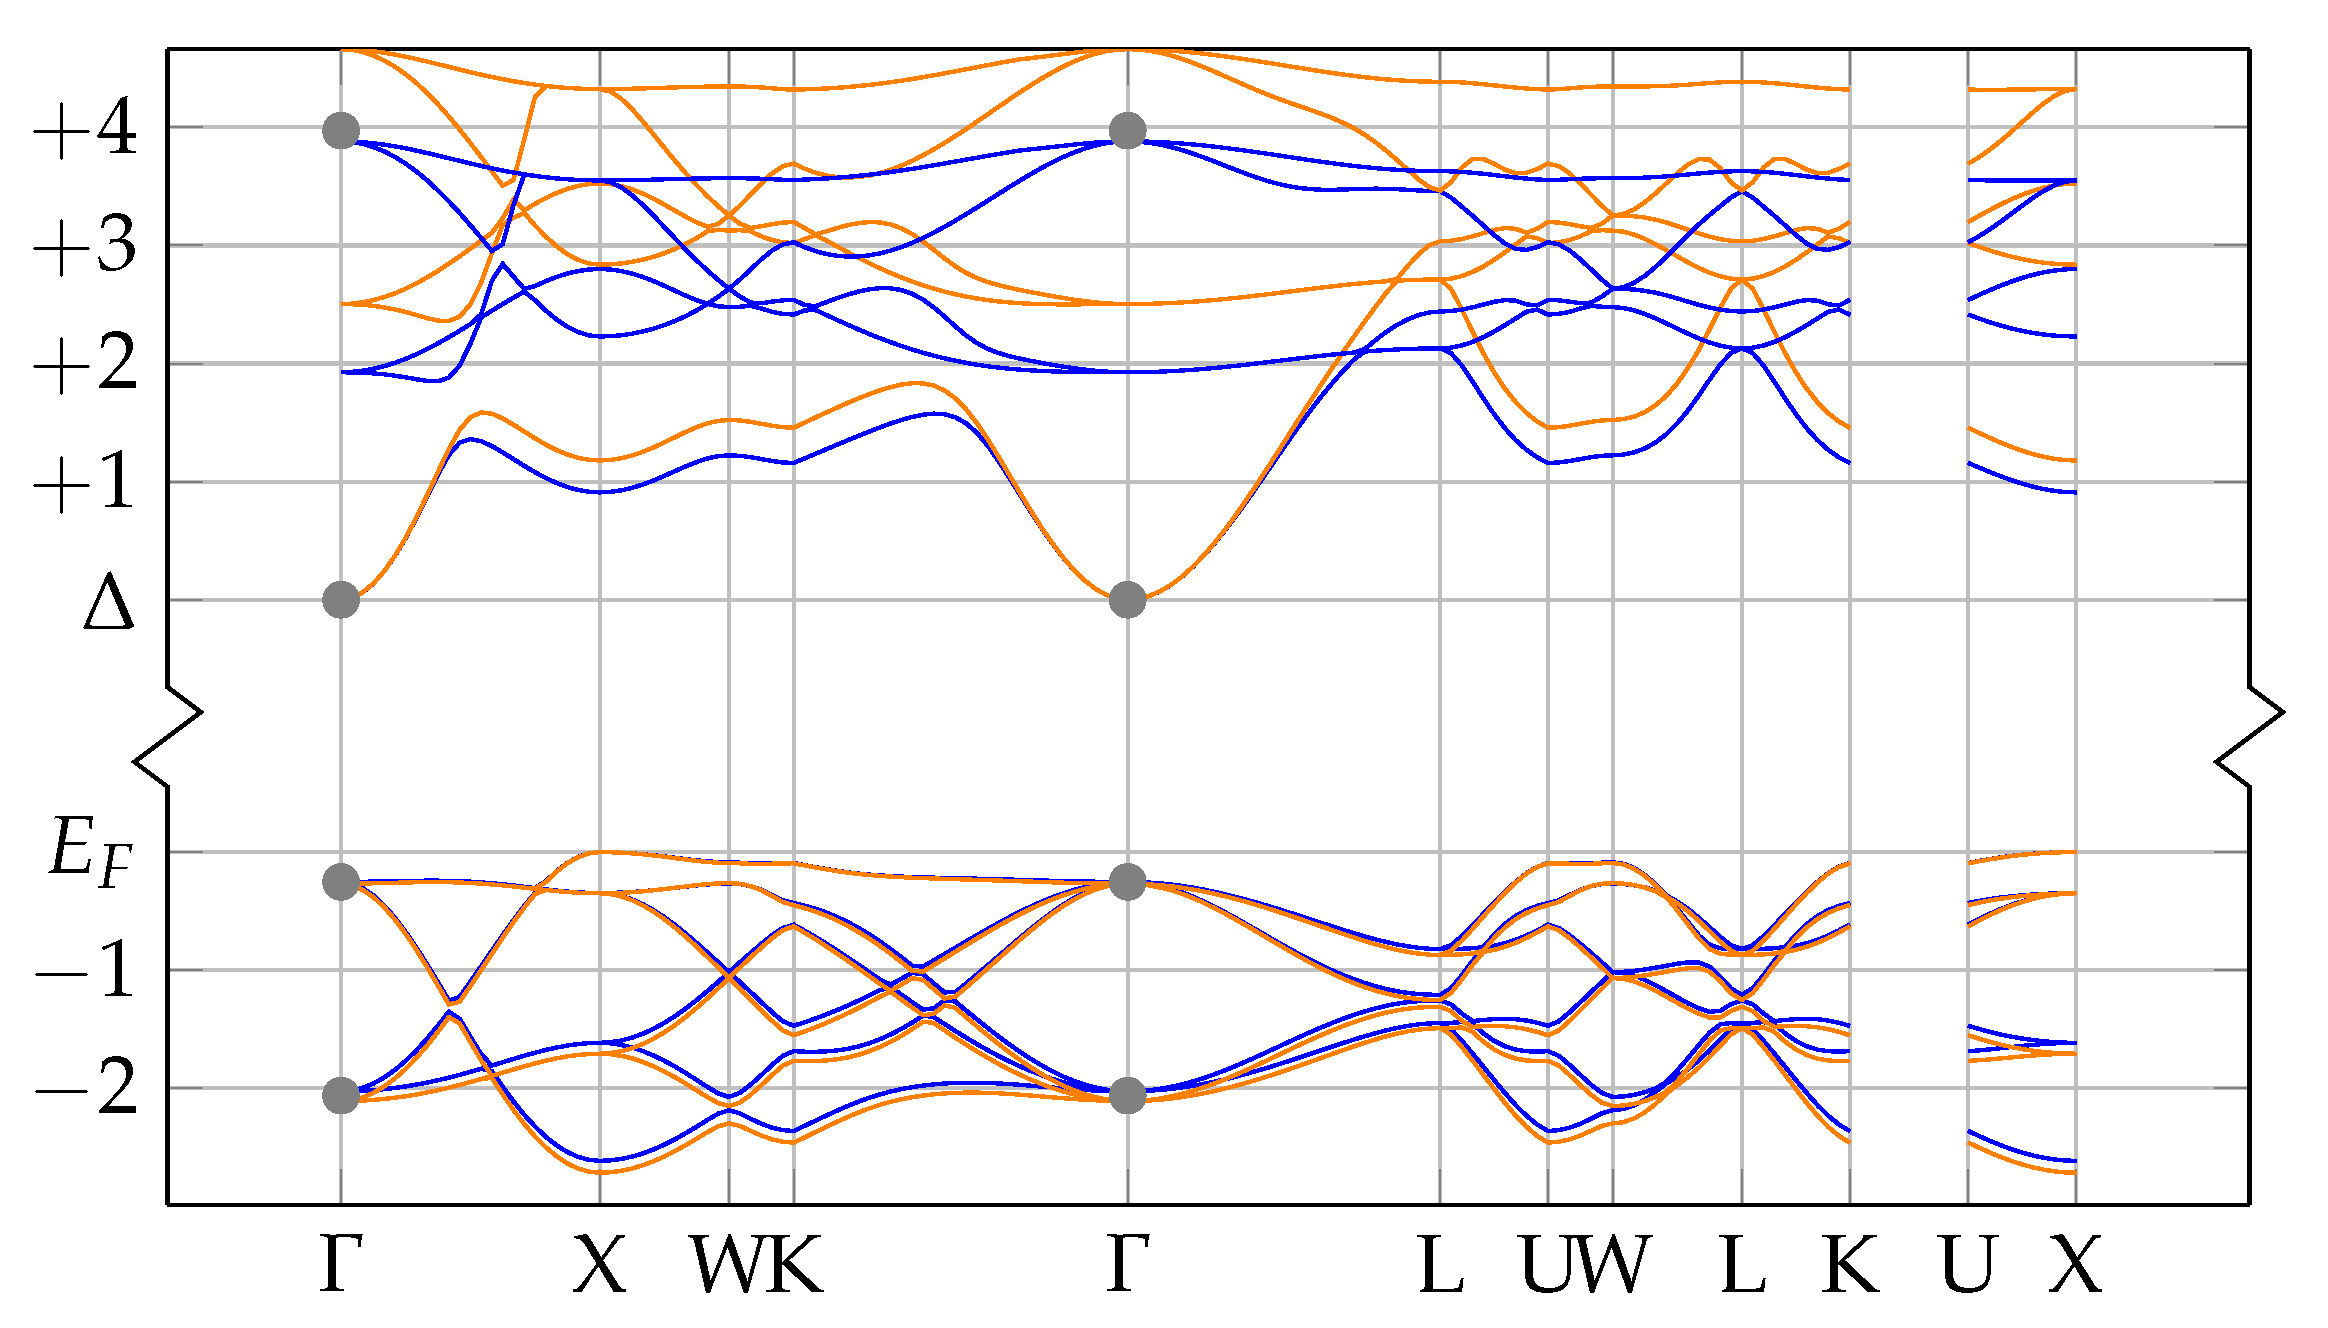
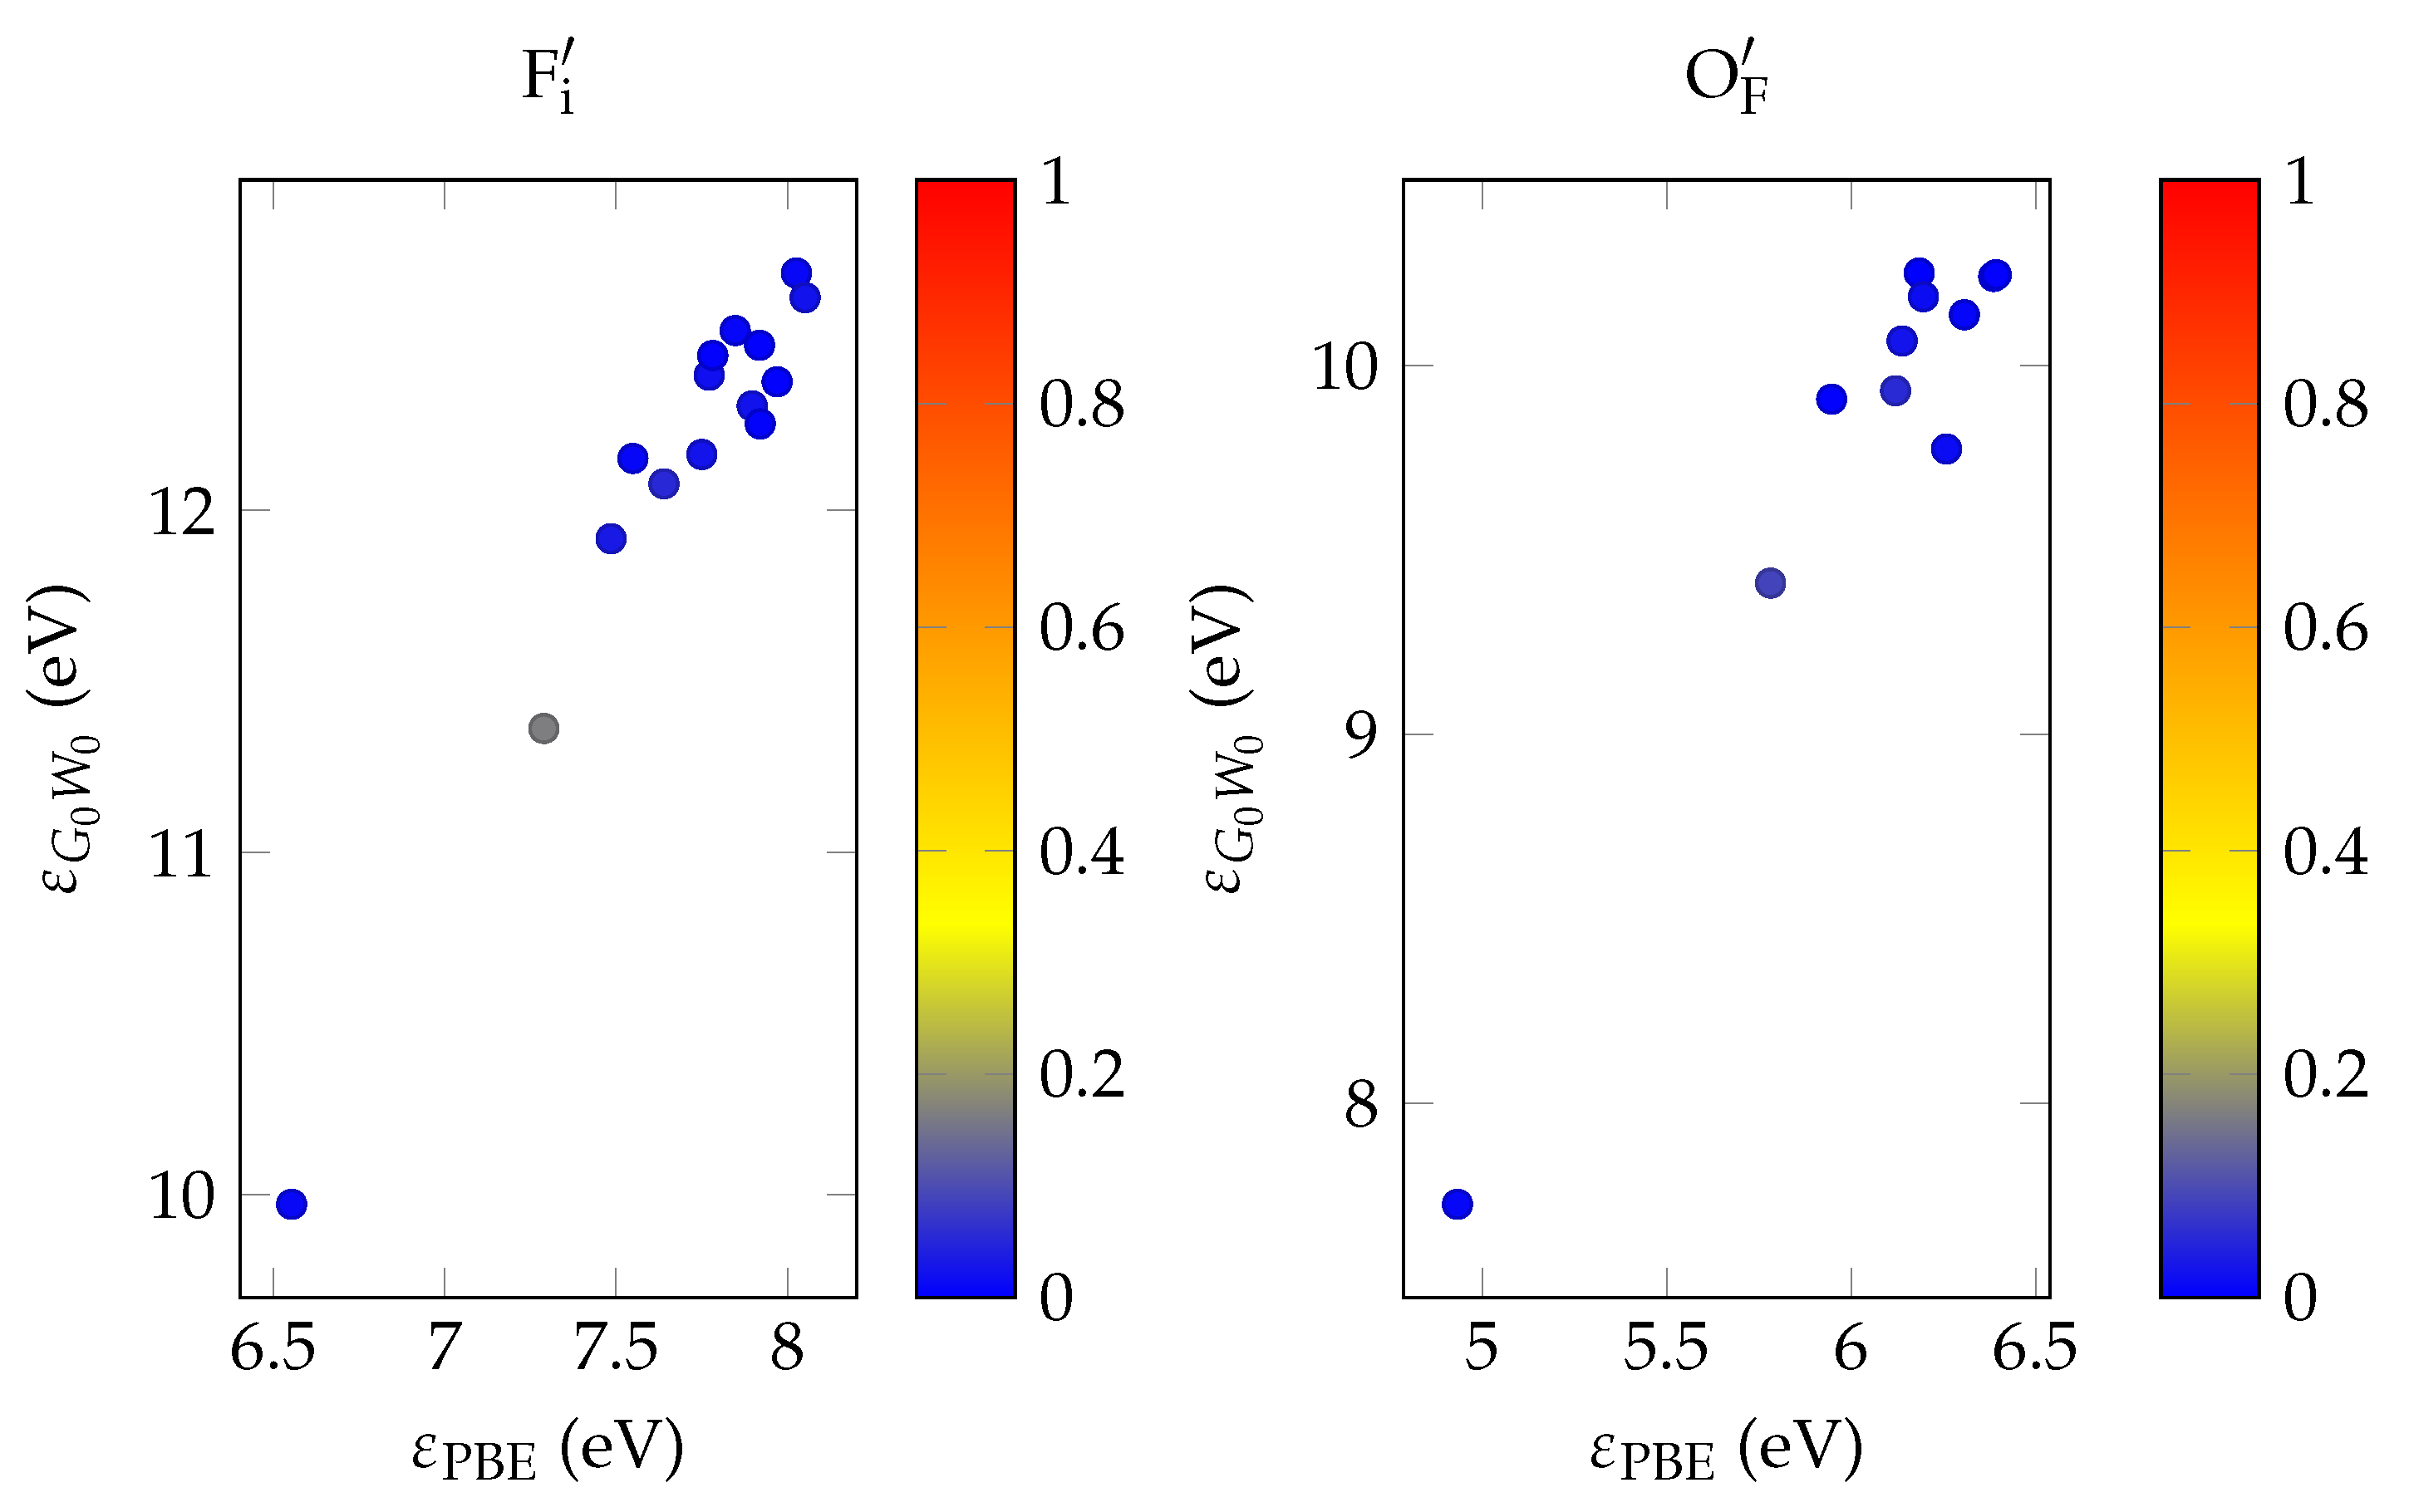
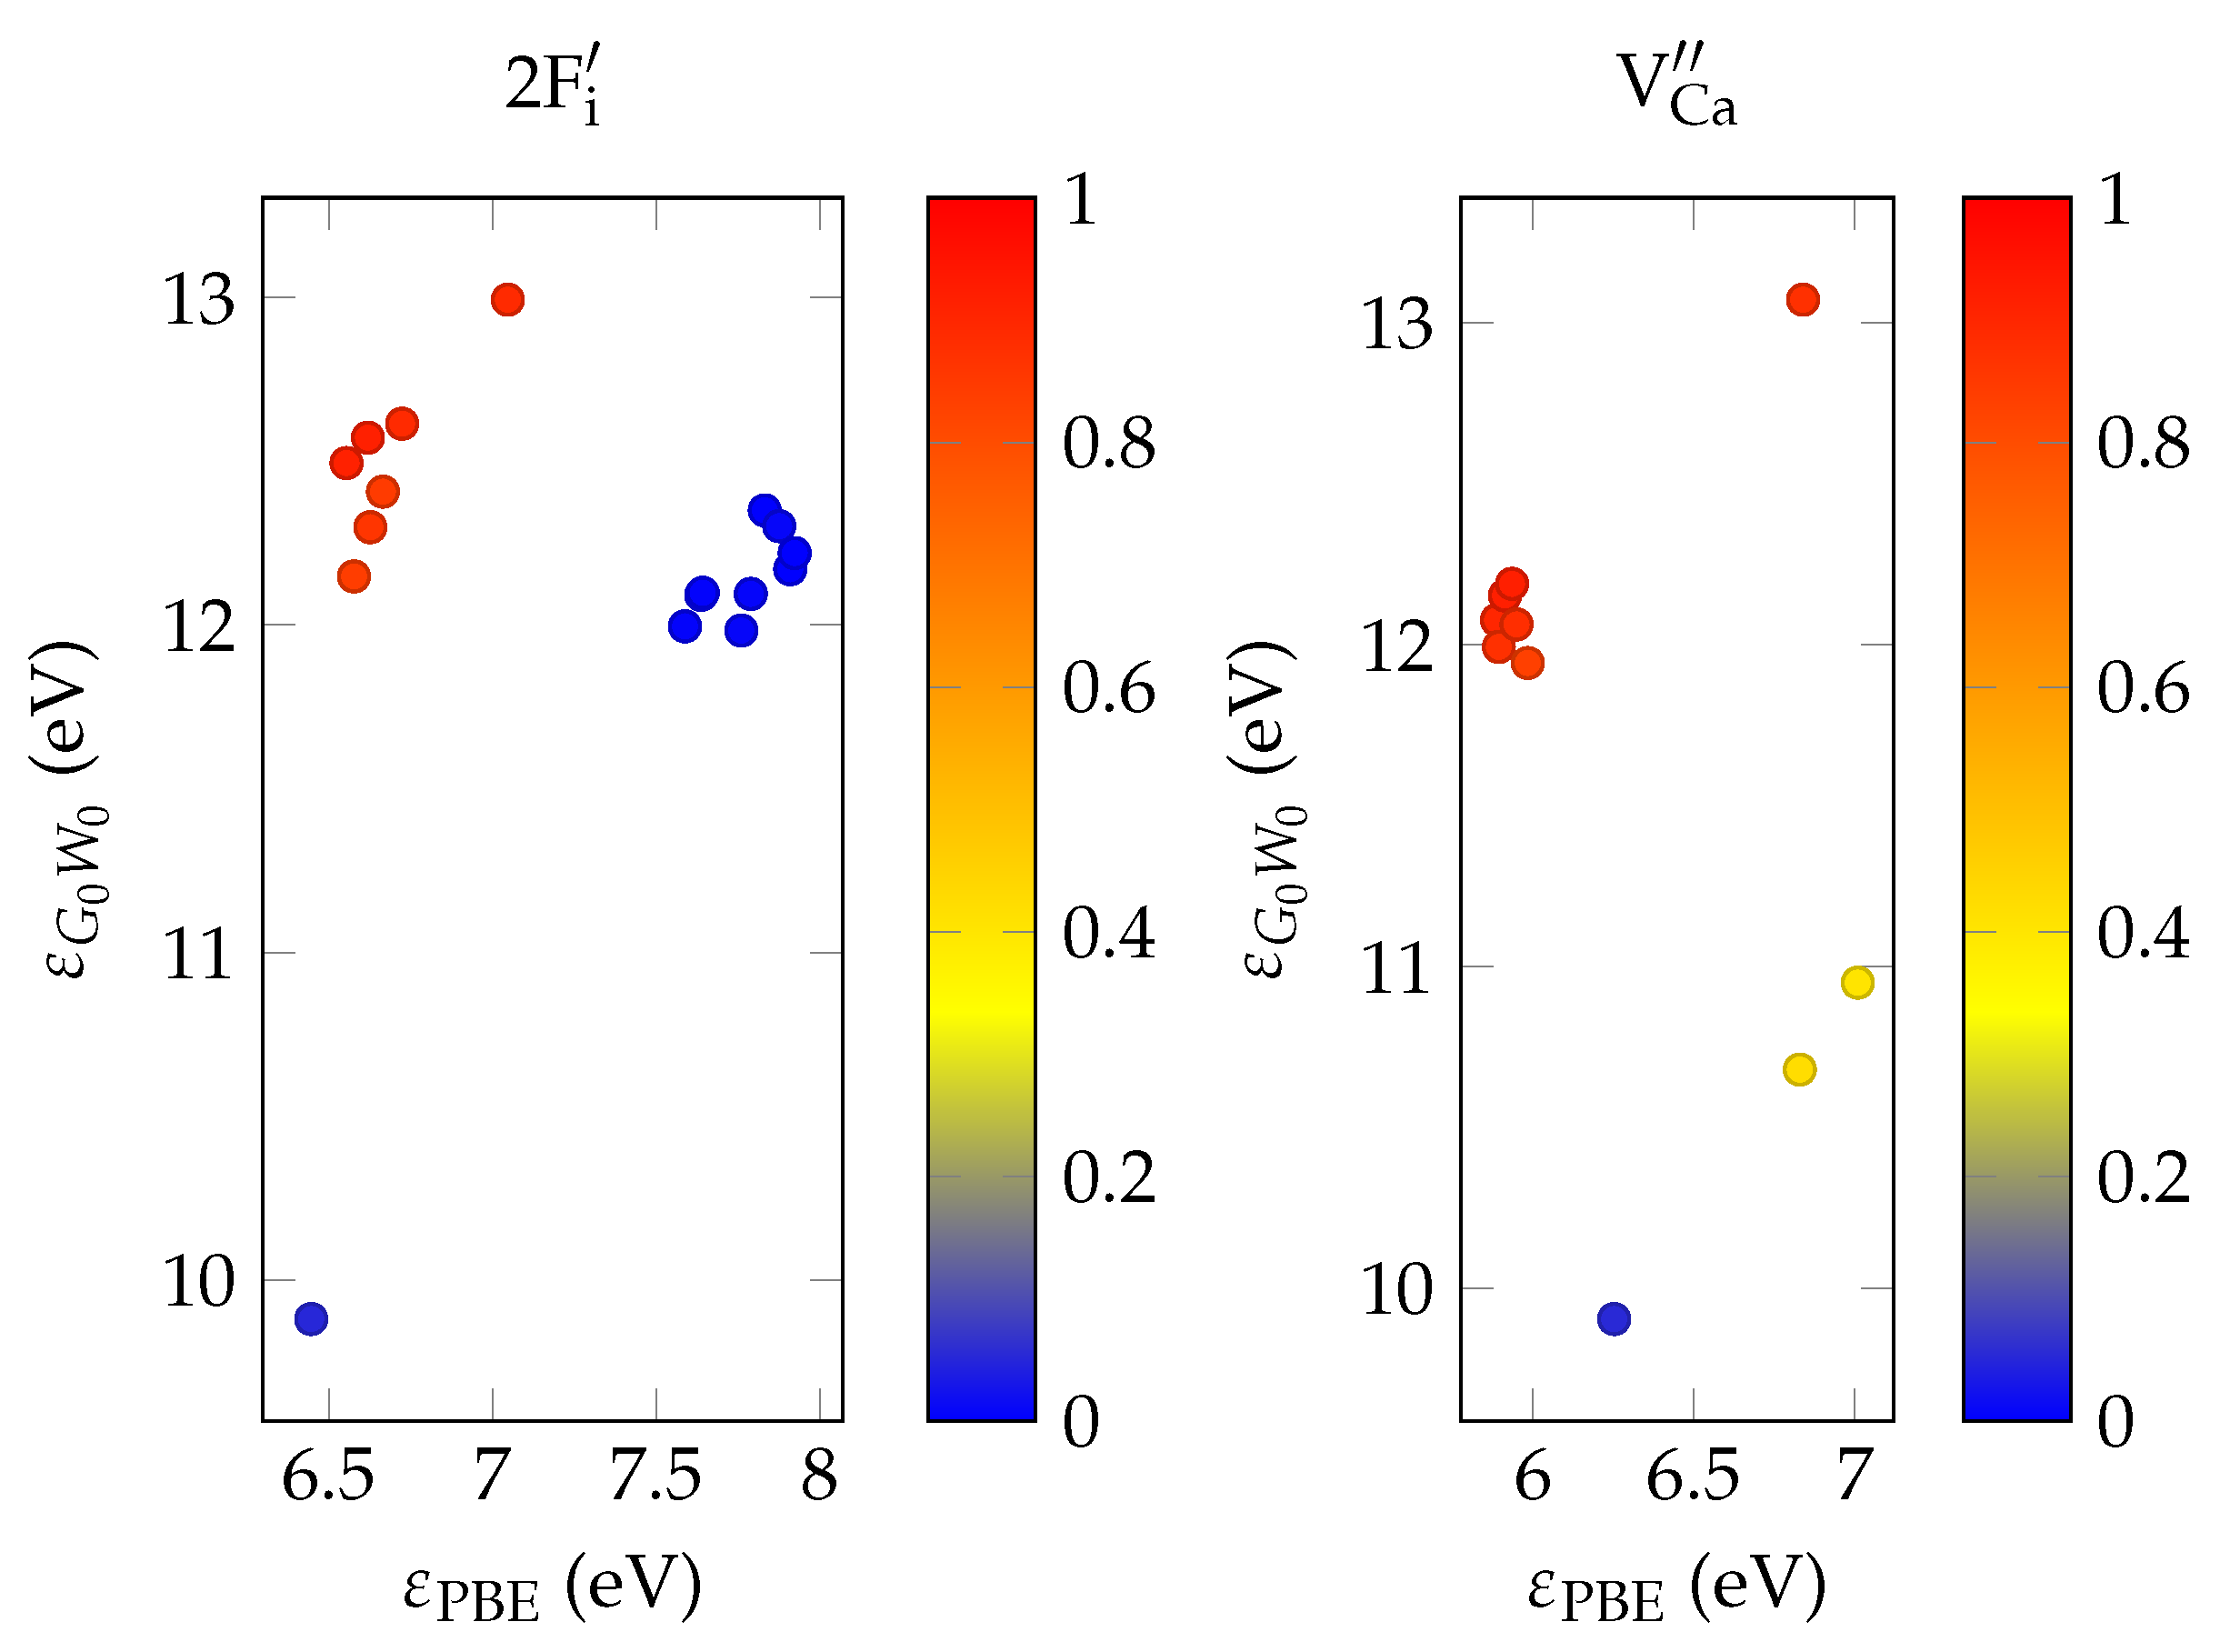
In order to evaluate the important transmissive properties in a fully compensated system, it is sufficient to consider whether the energy differences of the localized defect states to the valence band are larger than the expected isomer energy. However, if not all charges are compensated, the ground state features electrons in localized impurity states, with relatively small energy differences to other localized states or to the conduction band of the host crystal as is depicted in Figure 1. In this case, transparency at the isomer energy range can only be deduced by considering the energy-dependent absorption coefficient.
It has been shown that PBE + G 0 W 0 calculations give fairly close estimates to the experimental band gap for a range of semiconductors and insulators [34]. In the general case, the optical absorption coefficient is reasonably well approximated via the solution of the Bethe–Salpeter by equation using G 0 W 0 energies [29].
G 0 W 0 
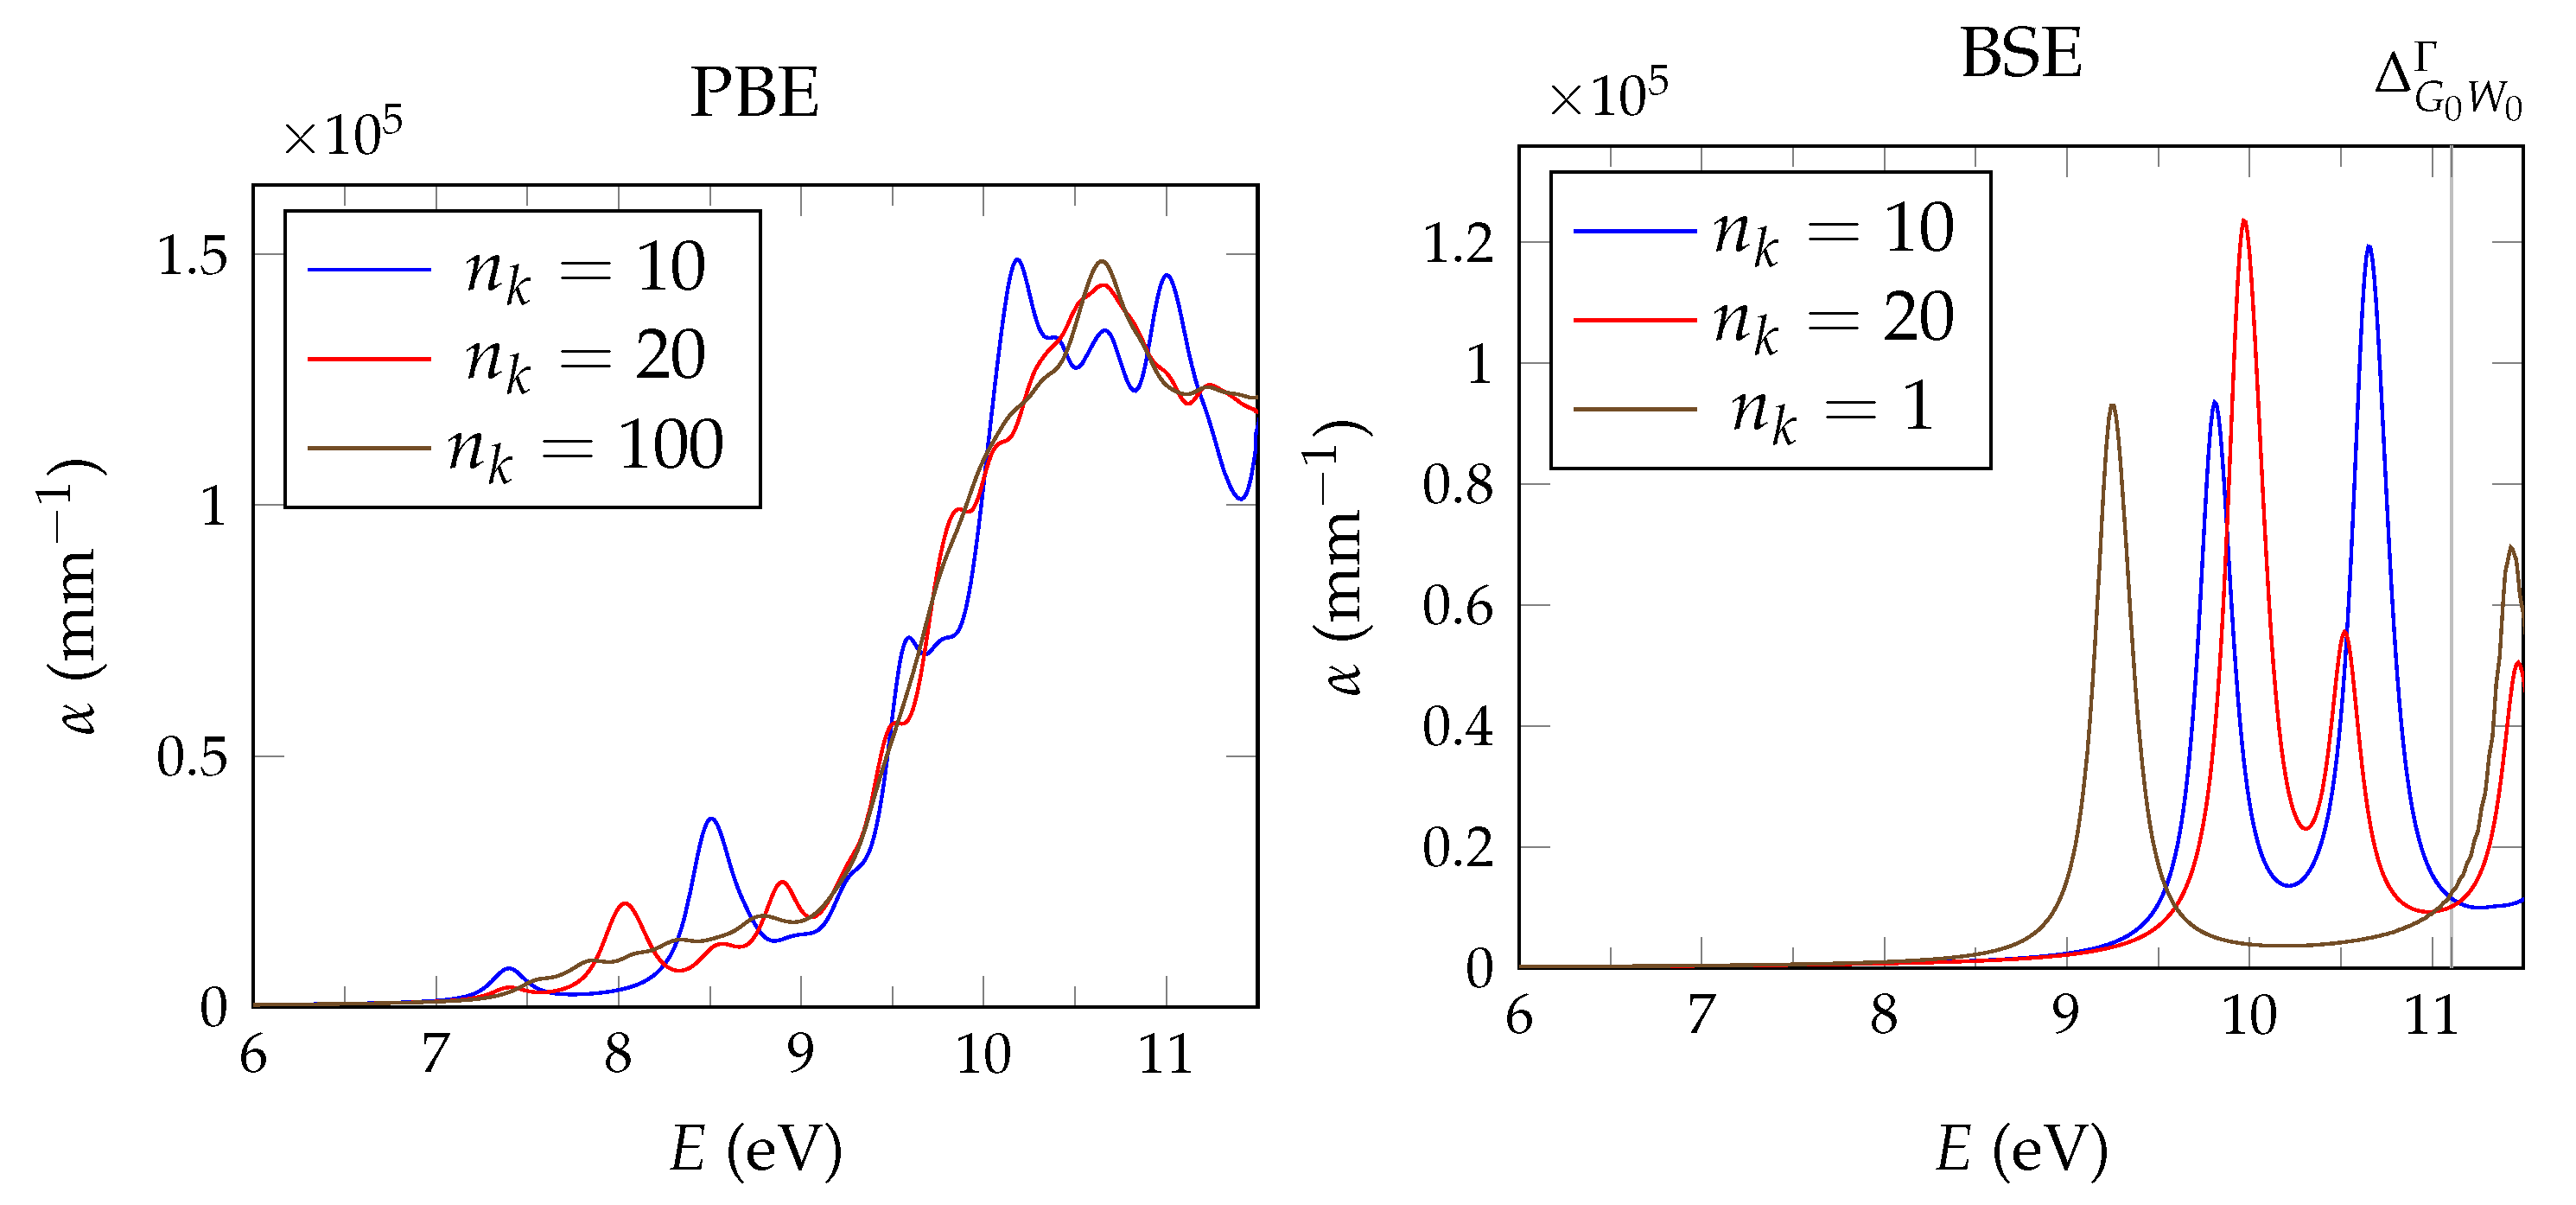
calculations are performed with the spectral method and 24 frequency grid points. Studies in pristine CaF2 use a total of 1536 bands, whereas for doped systems we reduce the computational requirements based on convergence tests by lowering the cutoff to 585 e V and 270 e V for the response function and using a total of 34,560 bands.
The BSE absorption coefficients are computed by considering the full valence band of the system and an even greater number of conduction band states for electron-hole pairs, as is explained in Section 3.1.
Unfortunately, the G 0 W 0 + BSE approach demands considerable memory resources. Even ≈ 6 TB of random-access memory limit the calculation of doped super structures to the Γ -point in reciprocal space. As a consequence, absorption coefficients are not fully converged and must be interpreted with care.

3. Results

3.1. Pristine CaF2

By using the setup mentioned above, we find satisfying structural accuracy, with an equilibrium lattice constant of 5.51 Å and a bulk modulus of 77 GPA as compared to the experimentally reported values of 5.46 Å and 84 GPA, respectively [35,36].
In Figure 2, the band structure for the functionals PBE, HSE, and energy values in the G 0 W 0 method at the Γ -point are shown. We follow the path as suggested by Setyawan and Curtarolo [37] in reciprocal space and evaluate energies at 152 equidistant points.
For PBE, HSE and the G 0 W 0 method, valence band energy levels are almost identical. Naturally the band gap is different and in addition we observe a distinction in difference from first to second lowest energy value in the conduction band Δ ε 12 = ε 2 ε 1 at Γ , with Δ ε 12 PBE 2 e V , Δ ε 12 HSE 2.5 e V and Δ ε 12 G 0 W 0 4 e V .
Compared to the structural properties or the total energy, convergence of the absorption coefficient is not as easily attained; in particular, far more points in reciprocal space are needed. Disregarding phonon-mediated indirect excitations, this can be qualitatively understood in terms of Figure 2. The smallest direct band gap is at the Γ -point and because the first energy level in the conduction band shows a steep ascent, a fine spacing around Γ is needed in order to accurately sample enough transition possibilities around the band edge.
In the subsequent sections, doped super structures of CaF2 are studied. Ideally, a Γ -only approximation would be used, substantially reducing computational and memory requirements. For the following optical calculations, the largest conceivable system is the 2 3 super structure of the conventional cell, containing 12 × 8 = 96 atoms. Its joint density of states JDOS ( E ) o , v , k δ [ E ( E v k E o k ) ] , where the indices o and v indicate occupied and unoccupied (“virtual”) states respectively, is depicted in Figure 3.
In Figure 4, we test this approximation on the absorption coefficient. In the independent particle picture (PBE) and for the primitive cell, a 7 3 Monkhorst–Pack mesh with n k = 20 k -points and even a 5 3 mesh with n k = 10 k -points already shows rough convergence when compared to a 15 3 mesh ( n k = 120 ), importantly for the onset of absorption. BSE absorption coefficients would need an even finer mesh size for convergence as there is still a prominent deviation between the n k = 20 and n k = 10 cases. In comparison, an experiment found the onset of absorption at 9.72   e V [32]. Additionally, the Γ -only approximation on the super cell shows the first peak at close to 1 eV lower in value than the n k = 20 calculation. Regrettably, the inclusion of more k -points or a larger cell would exceed the memory limitations of the used computational infrastructure at ≈ 6 TB. Using a smaller cell is also not possible, as defect atoms would be in immediate proximity, breaking the assumption of dilute doping. We thus have to continue with these parameters, keeping the mentioned uncertainties in mind.
In the investigated energy range, the BSE absorption coefficients are converged with respect to the number of n o = 6 and n v = 9 occupied and virtual orbitals, respectively, for the primitive cell and n o = 192 , n v = 229 for the 2 3 super structure. In the latter case, this resembles the inclusion of all electron-hole (e-h) pairs up to 19.56 eV; the maximum considered energy difference of an e-h pair is 22.38 eV. Correspondingly, in Figure 3 it can be observed that all electronic transitions up to the local minimum slightly below 20 e V are encompassed in determining the solution of the BSE.

3.2. Actinium Doping

In the experiment performed at ISOLDE-CERN, Ac ions with a kinetic energy on the order of 30 k e V are implanted into a CaF2 crystal [16]. We assume that Ac ions recombine with ambient electrons and enter the crystal in a neutral state. Ac has an oxidation number of   +   3 and is expected to replace a calcium as Ac Ca . Because there are no accompanying fluorines, an F i scheme must originate from a unit of the CaF2 crystal. In order to include a vacancy in this study we also calculate V Ca + V F . Furthermore, oxygen impurities from molecules in the ambient air may also be introduced as a by-product into the lattice; in this case, a fully compensated scheme is O F .
Energies of the different charge compensation schemes are presented in Table 1. Disregarding ambient oxygen, a F i scheme is almost equal in energy as the uncompensated variant. Though fully compensated, the V Ca + V F structure incurs an energy penalty of 0.7818242900 eV, possibly due to the number of defects. Interestingly, all doped crystals are lower in energy than their pristine constituents. We reason that this is due to Ac being considered in the gas phase, which is unfavorable as compared to a solid configuration.
When oxygen is taken into account, the O F scheme is clearly favored, with an energy difference of about 1.00377834 eV to the F i and uncompensated schemes. This time, the energy difference to the constituents is even greater than in the previous case, due to the reactivity of molecular oxygen.
By using the G 0 W 0 approximation in both fully compensated F i and O F structures, we obtain band gaps at the Γ -point Δ F i = 9.97   e V and Δ O F = 7.73   e V (see Figure 5). Thus, the oxygen impurity lowers the band gap by such an extent that the crystal may no longer be transparent for the isomer energy. At this point, it is appropriate to note that most impurity states are in fact not localized, contrary to what is observed for all other heavy isotopes considered in this work.
The absorption coefficient (Figure 6) differs only slightly from the pristine CaF2 case. In the optical range, the material absorbs only weakly. At higher energies, the absorption coefficient follows that of pristine CaF2, indicating transmission at the expected isomer energy.

3.3. Uranium Doping

In an experiment aiming to populate the 229mTh state via α -decay of 233U, uranium atoms are introduced to the CaF2 crystal via UF3 powder [15]. In principle, oxidation numbers for uranium of up to   +   6 are observed, and it is no longer possible to fully compensate the extra charge on the U Ca site solely with interstitial fluorines from the powder. Next to the obvious 1 F i , 2 F i , 3 F i , 1 V Ca and 2 V Ca possibilities, we also study mixed arrangements 1 F i + V Ca , 2 F i + V Ca and 1 V F + V Ca . The results are shown in Table 2.
Clearly, the F i structure is energetically preferred. For this configuration, we calculate the EFG to be V z z = 225.10   V / Å 2 . The high symmetry of this compensation scheme restricts η = 0 .
Absorption coefficient calculations demonstrate a local maximum toward the edge of the band gap of undoped CaF2, indicating a slight loss of transparency (see Figure 7). Considering the uncertainty regarding sampling of reciprocal space, an interaction with the isomer photon cannot be ruled out.

3.4. Thorium Doping

In the experiments proposed in Dessovic et al. [13], Stellmer et al. [20] and Nickerson et al. [38], thorium is doped into CaF2 at its melting point T = 1691   K with ThF4 powder in an atmosphere deprived of oxygen [39]. Thorium’s oxidation state is   +   4 ; thus in principle there are enough fluorines available to compensate the two extra charges upon Th Ca doping. Overall, relevant charge compensations are 1 F i , 2 F i and V Ca . Total energies can be viewed in Table 3.
As previously suggested, the 2 Fi’ configuration shows the lowest energy, and we also find the bent arrangement of interstitial fluorines to be favored [13]. Its EFG values are V z z = 114.60   V / Å 2 and η = 0.31 .
In Figure 8, calculations within the G 0 W 0 approximation show a band gap of Δ 2 F i = 9.88 eV and Δ V Ca = 9.90 eV for the fully compensated structures; thus both systems are expected to be transparent at the isomer energy range. Interestingly, the ordering of quasi-particle and Kohn–Sham energy levels is not the same. A possible explanation is that one of the defect states shows significantly less localization than the others and its quasi-particle energy is reduced. Highly localized states show a considerable increase in their G 0 W 0 energy, such that they are now located within the conduction band of CaF2.
Because both 229Ac and 233U can decay into the 229Th isomer, the optical properties of the preferred charge compensation mechanism in CaF2 ( F i ) also needs to be investigated.
For the results of Figure 9, it has to be noted that after the PBE self-consistency cycle, two electronic energy levels lie extremely close together and partial occupancies are unavoidable, even with an exceedingly small smearing parameter. The G 0 W 0 method alleviates this issue to some extent, although not completely, which would explain the discrepancy of the peak location for the absorption coefficients in the doped system compared to the CaF2 case.

3.5. Neptunium Doping

To calibrate experimental apparatuses, neptunium is used as a dummy because it has similar properties with respect to the quadrupole moments of thorium [19]. It is also doped into CaF2 melt as NpF3. Neptunium’s electron configuration is [Rn]7s 2 5f 4 6d 1 , leaving a maximum of five charges to be compensated upon substitutional replacement Np Ca . Therefore, we consider F i , 2 F i , 3 F i , and V Ca , 2 V Ca as well as V Ca + F i , V Ca + 2 F i , V Ca + 3 F i , 2 V Ca + F i and V Ca + V F ;. Results are shown in Table 4.
As was the case for U doping, the energetically favored scheme is the F i configuration, and its EFG on the Np position is V z z = 190.21   V / Å 2 with symmetry restricting η = 0 .

3.6. Cerium Doping

In many wet-chemical processes cerium is used as a carrier; hence, we expect Ce impurities to be introduced as CeF4, similar as Th. Thus, the same charge compensation schemes as in Section 3.4 are relevant and their energies are displayed in Table 5.
Contrary to Section 3.4, the V Ca structure is energetically favored, although the energy difference to 2 F i is relatively small. The G 0 W 0 method increases excited state energies quite substantially when compared to the PBE case (Figure 10). Still, both charge compensation schemes have a lower band gap than what is expected by the isomer energy, with Δ V Ca = 6.97   e V and Δ 2 F i = 7.04   e V . Thus, Ce impurities may negatively affect the transmission qualities of the solid-state nuclear clock and should be avoided in the processing of thorium.

4. Discussion

4.1. Energies & Structures

For all dopants except actinium (which is implanted in the ISOLDE facility at CERN), a fluoride compound in a specific stoichiometric ratio is mixed into the host crystal melt, creating the possibility for a substituted Ca atom to bind with F2. Because the enthalpy of formation of calcium fluoride is particularly large [36], compensation schemes that create integer number units of CaF2 while minimizing the amount of defects are generally favored. Doping in a fluorinated atmosphere impacts the energetic comparison to a large extent as Table 6 demonstrates on the example of U:CaF2.
For large doping concentrations, the possibility for clustering of impurities increases. In particular when the dopant’s charge is only partially compensated, it is likely energetically favorable when dopants share interstitial fluorine atoms. Even in the case of fully compensated defects, we found an energy difference of only 0.17 eV between a 2 Th Ca + 4 F i structure and the 2 × ( Th Ca + 2 F i ) case, the latter being favored. This notably small difference demonstrates that the present study is limited to dilute doping.

4.2. Electric Field Gradients

Because the EFG is susceptible to its chemical environment, we check its convergence with respect to the cell size and the functional used. The results for Th:CaF2 in the 2 F i structure is shown in Table 7. We conclude that the simplest converged setup is a PBE calculation of a 3 3 super cell of the conventional CaF2 cell without considering spin-orbit coupling (SOC).

4.3. Optical Properties

4.3.1. Charge Density

Compared to the other heavy isotopes considered in this work, excited dopant states of Ac:CaF2 have a distinct property, which is reflected in its charge density. In Table 8, slices of charge densities of the first (unoccupied) excited states through dopants and all present charge compensating atoms for fully compensated Ac-, Th-, and Ce-doped CaF2 are shown. Even though the interstitial fluorine in Ac:CaF2 breaks the symmetry of the lattice, the charge density around the nucleus is surprisingly spherical. Though both depicted states of Th:CaF2 and Ac:CaF2 show less localization relative to Ce:CaF2, the excited states of Th:CaF2 and Ce:CaF2 are reminiscent of hybridized d- and f-orbitals, whereas that of Ac:CaF2 appears to be s-like. Out of all defect states in Th:CaF2, the one depicted has by far the least localization and lowest energy, whereas most Ac:CaF2 defect states are delocalized, as is shown in Figure 5 and Figure 8, respectively.

4.3.2. Spin-Orbit Coupling

Although it was shown that the EFG remains mostly unaffected by relativistic effects due to SOC of the heavy isotopes’ valence electrons, the same cannot be equally stated for the reported optical properties, which neglected these contributions. However the present computational limits do not allow for including SOC contributions in the G 0 W 0 -BSE calculations. We note that in fully compensated Ac:CaF2 and Th:CaF2, the first unoccupied states are delocalized, weakening SOC corrections on their comparatively large band gaps. In fact, inclusion of SOC in a PBE calculation of Th:CaF2 + 2 F i causes a reduction of the band gap by 0.31   e V when compared to a scalar relativistic PBE calculation. Ce:CaF2 shows localized valence f-electrons but the system is estimated to interact with isomer photons regardless of SOC effects. On the other hand, absorption coefficients of partially compensated defects could be noticeably affected by electronic level splitting and the treatment of spinors. A more detailed study including excitonic and SOC effects on the same footing requires further methodological developments and is beyond the scope of the current work.

5. Conclusions

In order to estimate important quantities toward the realization of a thorium nuclear clock, we compare charge compensation schemes for specific stoichiometries when calcium fluoride is doped with heavy isotopes of actinium, uranium, thorium, neptunium, and cerium and find energetically favorable schemes: no compensation for Ac:CaF2; one interstitial fluorine in Ac:CaF2, U:CaF2 and Np:CaF2; two interstitial fluorines and a calcium vacancy in Th:CaF2 and Ce:CaF2. Furthermore, we report electric field gradients for U:CaF2 and Np:CaF2 for future nuclear quadrupole resonance spectroscopy. Although Ac:CaF2 is expected to be transparent for the 229m-thorium energy, computational restrictions pose limits to a similar estimation for the partially compensated U:CaF2 and Th:CaF2 crystals. Utilization of improved hardware on modern scientific clusters is required for further analysis.

Author Contributions

Conceptualization, T.S.; methodology, A.G.; software, M.P. and A.G.; validation, M.P. and A.G.; formal analysis, M.P.; investigation, M.P. and A.G.; resources, A.G., P.M. and T.S.; data curation, M.P.; writing—original draft preparation, M.P.; writing—review and editing, A.G., P.M. and T.S.; visualization, M.P.; supervision, A.G., P.M. and T.S.; project administration, T.S.; funding acquisition, T.S. All authors have read and agreed to the published version of the manuscript.

Funding

This work is part of the ThoriumNuclearClock project that has received funding from the European Research Council (ERC) under the European Union’s Horizon 2020 research and innovation programme (Grant agreement No. 856415). The research was supported by the Austrian Science Fund (FWF) Projects: I5971 (REThorIC).

Institutional Review Board Statement

Not applicable.

Informed Consent Statement

Not applicable.

Data Availability Statement

The data presented in this study are available on request from the corresponding author.

Acknowledgments

The present work was calculated on the Vienna Scientific Cluster (VSC).

Conflicts of Interest

The authors declare no conflict of interest. The funders had no role in the design of the study; in the collection, analyses, or interpretation of data; in the writing of the manuscript, or in the decision to publish the results.

Abbreviations

The following abbreviations are used in this manuscript:
PBEExchange-correlation functional as devised by Perdew, Burke and Ernzerhof
HSE06Exchange-correlation functional as devised by Heyd, Scuseria and Ernzerhof
BSEBethe-Salpeter equation
EFGElectric field gradient
JDOSJoint density of states
e-helectron-hole

References

  1. Helmer, R.G.; Reich, C.W. An Excited State of 229Th at 3.5 eV. Phys. Rev. C 1994, 49, 1845–1858. [Google Scholar] [CrossRef] [PubMed]
  2. Seiferle, B.; Moritz, D.; Scharl, K.; Ding, S.; Zacherl, F.; Löbell, L.; Thirolf, P.G. Extending Our Knowledge about the 229Th Nuclear Isomer. Atoms 2022, 10, 24. [Google Scholar] [CrossRef]
  3. Sikorsky, T.; Geist, J.; Hengstler, D.; Kempf, S.; Gastaldo, L.; Enss, C.; Mokry, C.; Runke, J.; Düllmann, C.E.; Wobrauschek, P.; et al. Measurement of the 229Th Isomer Energy with a Magnetic Microcalorimeter. Phys. Rev. Lett. 2020, 125, 142503. [Google Scholar] [CrossRef] [PubMed]
  4. Seiferle, B.; von der Wense, L.; Bilous, P.V.; Amersdorffer, I.; Lemell, C.; Libisch, F.; Stellmer, S.; Schumm, T.; Düllmann, C.E.; Pálffy, A.; et al. Energy of the 229Th Nuclear Clock Transition. Nature 2019, 573, 243–246. [Google Scholar] [CrossRef]
  5. Peik, E.; Okhapkin, M. Nuclear Clocks Based on Resonant Excitation of γ-Transitions. Comptes Rendus Phys. 2015, 16, 516–523. [Google Scholar] [CrossRef]
  6. Beeks, K.; Sikorsky, T.; Schumm, T.; Thielking, J.; Okhapkin, M.V.; Peik, E. The Thorium-229 Low-Energy Isomer and the Nuclear Clock. Nat. Rev. Phys. 2021, 3, 238–248. [Google Scholar] [CrossRef]
  7. Fadeev, P.; Berengut, J.C.; Flambaum, V.V. Effects of Variation of the Fine Structure Constant α and Quark Mass mq in Mössbauer Nuclear Transitions. Phys. Rev. C 2022, 105, L051303. [Google Scholar] [CrossRef]
  8. Stellmer, S.; Kazakov, G.; Schreitl, M.; Kaser, H.; Kolbe, M.; Schumm, T. Attempt to Optically Excite the Nuclear Isomer in 229Th. Phys. Rev. A 2018, 97, 062506. [Google Scholar] [CrossRef]
  9. Jeet, J.; Schneider, C.; Sullivan, S.T.; Rellergert, W.G.; Mirzadeh, S.; Cassanho, A.; Jenssen, H.P.; Tkalya, E.V.; Hudson, E.R. Results of a Direct Search Using Synchrotron Radiation for the Low-Energy 229Th Nuclear Isomeric Transition. Phys. Rev. Lett. 2015, 114, 253001. [Google Scholar] [CrossRef]
  10. Tkalya, E.V.; Schneider, C.; Jeet, J.; Hudson, E.R. Radiative Lifetime and Energy of the Low-Energy Isomeric Level in 229Th. Phys. Rev. C 2015, 92, 054324. [Google Scholar] [CrossRef]
  11. Yamaguchi, A.; Kolbe, M.; Kaser, H.; Reichel, T.; Gottwald, A.; Peik, E. Experimental Search for the Low-Energy Nuclear Transition in 229Th with Undulator Radiation. New J. Phys. 2015, 17, 053053. [Google Scholar] [CrossRef]
  12. Peik, E.; Tamm, C. Nuclear Laser Spectroscopy of the 3.5 eV Transition in Th-229. EPL 2003, 61, 181. [Google Scholar] [CrossRef]
  13. Dessovic, P.; Mohn, P.; Jackson, R.A.; Winkler, G.; Schreitl, M.; Kazakov, G.; Schumm, T. 229Thorium-doped Calcium Fluoride for Nuclear Laser Spectroscopy. J. Phys. Condens. Matter 2014, 26, 105402. [Google Scholar] [CrossRef]
  14. Hehlen, M.P.; Greco, R.R.; Rellergert, W.G.; Sullivan, S.T.; DeMille, D.; Jackson, R.A.; Hudson, E.R.; Torgerson, J.R. Optical Spectroscopy of an Atomic Nucleus: Progress toward Direct Observation of the 229Th Isomer Transition. J. Lumin. 2013, 133, 91–95. [Google Scholar] [CrossRef]
  15. Stellmer, S.; Schreitl, M.; Kazakov, G.A.; Sterba, J.H.; Schumm, T. Feasibility Study of Measuring the 229Th Nuclear Isomer Transition with 233U-Doped Crystals. Phys. Rev. C 2016, 94, 014302. [Google Scholar] [CrossRef]
  16. Verlinde, M.; Kraemer, S.; Moens, J.; Chrysalidis, K.; Correia, J.G.; Cottenier, S.; De Witte, H.; Fedorov, D.V.; Fedosseev, V.N.; Ferrer, R.; et al. Alternative Approach to Populate and Study the 229Th Nuclear Clock Isomer. Phys. Rev. C 2019, 100, 024315. [Google Scholar] [CrossRef]
  17. Peik, E.; Zimmermann, K.; Okhapkin, M.; Tamm, C. Prospects For A Nuclear Optical Frequency Standard Based On Thorium-229. In Frequency Standards and Metrology; World Scientific, Asilomar Hotel and Conference Grounds: Pacific Grove, CA, USA, 2009; pp. 532–538. [Google Scholar] [CrossRef]
  18. Smith, J.A.S. Nuclear Quadrupole Resonance Spectroscopy. General Principles. J. Chem. Educ. 1971, 48, 39. [Google Scholar] [CrossRef]
  19. Müller, R.A.; Maiorova, A.V.; Fritzsche, S.; Volotka, A.V.; Beerwerth, R.; Glowacki, P.; Thielking, J.; Meier, D.M.; Okhapkin, M.; Peik, E.; et al. Hyperfine Interaction with the 229Th Nucleus and Its Low-Lying Isomeric State. Phys. Rev. A 2018, 98, 020503. [Google Scholar] [CrossRef]
  20. Stellmer, S.; Schreitl, M.; Schumm, T. Radioluminescence and Photoluminescence of Th:CaF2 Crystals. Sci. Rep. 2015, 5, 15580. [Google Scholar] [CrossRef]
  21. Kresse, G.; Hafner, J. Ab Initio Molecular Dynamics for Liquid Metals. Phys. Rev. B 1993, 47, 558–561. [Google Scholar] [CrossRef]
  22. Kresse, G.; Hafner, J. Ab Initio Molecular-Dynamics Simulation of the Liquid-Metal–Amorphous-Semiconductor Transition in Germanium. Phys. Rev. B 1994, 49, 14251–14269. [Google Scholar] [CrossRef]
  23. Kresse, G.; Furthmüller, J. Efficient Iterative Schemes for Ab Initio Total-Energy Calculations Using a Plane-Wave Basis Set. Phys. Rev. B 1996, 54, 11169–11186. [Google Scholar] [CrossRef]
  24. Kresse, G.; Furthmüller, J. Efficiency of Ab-Initio Total Energy Calculations for Metals and Semiconductors Using a Plane-Wave Basis Set. Comput. Mater. Sci. 1996, 6, 15–50. [Google Scholar] [CrossRef]
  25. Kresse, G.; Joubert, D. From Ultrasoft Pseudopotentials to the Projector Augmented-Wave Method. Phys. Rev. B 1999, 59, 1758–1775. [Google Scholar] [CrossRef]
  26. Blöchl, P.E. Projector augmented-wave method. Phys. Rev. B 1994, 50, 17953–17979. [Google Scholar] [CrossRef]
  27. Perdew, J.P.; Burke, K.; Ernzerhof, M. Generalized Gradient Approximation Made Simple. Phys. Rev. Lett. 1996, 77, 3865–3868. [Google Scholar] [CrossRef]
  28. Hedin, L. New Method for Calculating the One-Particle Green’s Function with Application to the Electron-Gas Problem. Phys. Rev. 1965, 139, A796–A823. [Google Scholar] [CrossRef]
  29. Rohlfing, M.; Louie, S.G. Electron-Hole Excitations in Semiconductors and Insulators. Phys. Rev. Lett. 1998, 81, 2312–2315. [Google Scholar] [CrossRef]
  30. Heyd, J.; Scuseria, G.E.; Ernzerhof, M. Hybrid Functionals Based on a Screened Coulomb Potential. J. Chem. Phys. 2003, 118, 8207, Erratum in J. Chem. Phys. 2006, 124, 219906. [Google Scholar] [CrossRef]
  31. Kröger, F.A.; Vink, H.J. Relations between the Concentrations of Imperfections in Crystalline Solids. In Solid State Physics; Seitz, F., Turnbull, D., Eds.; Academic Press: Cambridge, MA, USA, 1956; Volume 3, pp. 307–435. [Google Scholar] [CrossRef]
  32. Beeks, K.A.A.G. The Nuclear Excitation of Thorium-229 in the CaF2 Environment. Ph.D. Thesis, TU Wien, Vienna, Austria, 2022. [Google Scholar] [CrossRef]
  33. Freysoldt, C.; Grabowski, B.; Hickel, T.; Neugebauer, J.; Kresse, G.; Janotti, A.; Van de Walle, C.G. First-Principles Calculations for Point Defects in Solids. Rev. Mod. Phys. 2014, 86, 253–305. [Google Scholar] [CrossRef]
  34. Shishkin, M.; Kresse, G. Self-Consistent GW Calculations for Semiconductors and Insulators. Phys. Rev. B 2007, 75, 235102. [Google Scholar] [CrossRef]
  35. Batchelder, D.N.; Simmons, R.O. Lattice Constants and Thermal Expansivities of Silicon and of Calcium Fluoride between 6° and 322°K. J. Chem. Phys. 1964, 41, 2324–2329. [Google Scholar] [CrossRef]
  36. Haynes, W.M.; Lide, D.R.; Bruno, T.J. (Eds.) CRC Handbook of Chemistry and Physics, 97th ed.; CRC Press: Boca Raton, FL, USA, 2016. [Google Scholar] [CrossRef]
  37. Setyawan, W.; Curtarolo, S. High-Throughput Electronic Band Structure Calculations: Challenges and Tools. Comput. Mater. Sci. 2010, 49, 299–312. [Google Scholar] [CrossRef]
  38. Nickerson, B.S.; Pimon, M.; Bilous, P.V.; Gugler, J.; Beeks, K.; Sikorsky, T.; Mohn, P.; Schumm, T.; Pálffy, A. Nuclear Excitation of the 229Th Isomer via Defect States in Doped Crystals. Phys. Rev. Lett. 2020, 125, 032501. [Google Scholar] [CrossRef]
  39. Naylor, B.F. Heat Contents at High Temperatures of Magnesium and Calcium Fluorides1. J. Am. Chem. Soc. 1945, 67, 150–152. [Google Scholar] [CrossRef]
  40. Momma, K.; Izumi, F. VESTA 3 for Three-Dimensional Visualization of Crystal, Volumetric and Morphology Data. J. Appl. Cryst. 2011, 44, 1272–1276. [Google Scholar] [CrossRef]
Figure 1. Level scheme of doped CaF2 crystals. Energies of impurity states depend on the system and compensation scheme. For some configurations, these states may lie below the isomer energy E [ 229 m Th ] whereas for others they may even overlap with the conduction band. Note that the impurity states do not form a band in the traditional sense but rather consist of flat hybridized atomic orbitals. In schemes that do not fully compensate the extra electrons introduced by the dopant, the Fermi level E F is located at an impurity state. Approximate widths for valence band and band gap are calculated by the G 0 W 0 method with PBE orbitals.
Crystals 12 01128 g001
Figure 2. Band structure of pristine CaF2 calculated with the PBE (blue) and HSE (orange) functionals and the G 0 W 0 method at the Γ -point (gray). In each of these methods, the Fermi level and the band gap Δ are set to be equal in order to enable a visual comparison. Note the discontinuity on the y-axis in the band gap, which we calculate as Δ PBE = 7.14 eV, Δ HSE = 9.23 eV and Δ G 0 W 0 = 11.07 eV. The PBE and HSE values are for the indirect band gap X Γ , and the smallest direct band gap at Γ is larger by 0.25 eV.
Crystals 12 01128 g002
Figure 3. Joint density of states (JDOS) of a 2 3 super structure of the conventional CaF2 cell. Energy values are obtained at Γ from a G 0 W 0 calculation with PBE orbitals.
Crystals 12 01128 g003
Figure 4. Convergence checks for the absorption coefficient of the pristine CaF2 crystal. The G 0 W 0 band gap is marked by a vertical line. Note that a primitive unit cell is used except for the BSE calculation with a single k -point, which was obtained by using a 2 3 super structure of the conventional unit cell.
Crystals 12 01128 g004
Figure 5. ε G 0 W 0 over ε PBE for Ac:CaF2 for two fully compensated configurations F i (left) and O F (right). ε G 0 W 0 refers to differences between unoccupied quasi-particle energies to the valence band maximum. Similarly, ε PBE refers to differences between unoccupied Kohn–Sham eigenvalues to the valence band maximum. Color values indicate the degree of localization on the dopant. Most of the defect states are not localized on the Ac ion. The band gap of the O F scheme is significantly reduced.
Crystals 12 01128 g005
Figure 6. Absorption coefficient calculated with G 0 W 0 + BSE for the Ac:CaF2 crystal without charge compensations and compared to the pristine CaF2 case. To illustrate the contribution of the dopant on the absorption spectrum, the difference α Ac:CaF2 α CaF2 is computed in the figure on the right-hand side (negative values are omitted).
Crystals 12 01128 g006
Figure 7. Absorption coefficient calculated with G 0 W 0   + BSE for the U:CaF2 crystal plus a F i charge compensating anion and comparison to the pristine CaF2 case. The cubic symmetry of the host crystal is broken by the interstitial fluorine; hence two principal axes x and z are necessary to describe the absorption coefficient. To illustrate the contribution of the dopant on the absorption spectrum, the difference α U:CaF2 α CaF2 is computed in the figure on the right-hand side (negative values are omitted).
Crystals 12 01128 g007
Figure 8. Quasi-particle energies ε G 0 W 0 over Kohn–Sham eigenvalues ε PBE for Th:CaF2 for the fully compensated configurations 2 F i and V Ca . Color values indicate the degree of localization on the dopant. Both schemes show a band gap larger than the estimated 229mTh energy.
Crystals 12 01128 g008
Figure 9. Absorption coefficient calculated with G 0 W 0   +   BSE for the Th:CaF2 crystal with a F i charge compensation and compared to the pristine CaF2 case. To illustrate the contribution of the dopant on the absorption spectrum, the difference α Th:CaF2 α CaF2 is computed in the figure on the right-hand side, and negative values are not shown.
Crystals 12 01128 g009
Figure 10. Quasi-particle energies ε G 0 W 0 over Kohn–Sham eigenvalues ε PBE for Ce:CaF2 for two fully compensated configurations, V Ca (top) and 2 F i (bottom). Color values indicate the degree of localization on the dopant. The band gap of these systems is substantially reduced and is presumably smaller than the thorium-isomer energy.
Crystals 12 01128 g010
Table 1. Energies of relevant charge compensation possibilties of a 2 3 super structure of the conventional CaF2 cell doped with Ac in an environment where oxygen is not present (top) and where it is present in its molecular allotrope (bottom).
Energy (eV)InsideEnvironment
1.4332CaF2Ac + CaF2
0.01 Ac Ca CaF2 + Ca
0.00 Ac Ca + F i 1 2 CaF2 + 3 2 Ca
0.78 Ac Ca + V Ca + V F 3 2 (CaF2 + Ca)
8.3532CaF2Ac + CaF2 + 1 2 O2
1.02 Ac Ca CaF2 + CaO
1.00 Ac Ca + F i 1 2 CaF2 + CaO + 1 2 Ca
1.79 Ac Ca + V Ca + V F 3 2 CaF2 + CaO + 1 2 Ca
0.00 Ac Ca + O F 3 2 CaF2 + 1 2 Ca
Table 2. Energies of relevant charge compensation possibilties of a CaF2 cell doped with U via the UF3 compound. It is assumed that oxygen is removed from the environment.
Energy (eV)InsideEnvironment
0.0032CaF2UF3
12.45 U Ca CaF2 + 1 2 F2
1.00 U Ca + F i CaF2
2.60 U Ca + 2 F i 1 2 CaF2 + 1 2 Ca
6.22 U Ca + 3 F i Ca
2.65 U Ca + V Ca 3 2 CaF2 + 1 2 Ca
11.74 U Ca + 2 V Ca 3 2 CaF2 + 3 2 Ca
6.66 U Ca + 1 F i + V Ca CaF2 + Ca
11.01 U Ca + 2 F i + V Ca 1 2 CaF2 + 3 2 Ca
2.01 U Ca + V F + V Ca 2CaF2
Table 3. Energies of relevant charge compensation possibilties of CaF2 doped with ThF4 in an oxygen-deprived environment.
Energy ( e V )InsideEnvironment
0.0032CaF2ThF4
13.63 Th Ca CaF2 + F2
7.69 Th Ca + F i CaF2 + 1 2 F2
1.37 Th Ca + 2 F i CaF2
1.54 Th Ca + V Ca 2CaF2
Table 4. Energies of relevant charge compensation possibilties of CaF2 doped with Np via the NpF3 compound. It is assumed that oxygen is removed from the environment.
Energy ( e V )InsideEnvironment
0.0032CaF2NpF3
6.50 Np Ca CaF2 + 1 2 F2
1.10 Np Ca + F i CaF2
3.41 Np Ca + 2 F i 1 2 CaF2 + 1 2 Ca
7.90 Np Ca + 3 F i Ca
3.42 Np Ca + V Ca 3 2 CaF2 + 1 2 Ca
14.29 Np Ca + 2 V Ca 3 2 CaF2 + 3 2 Ca
8.55 Np Ca + 1 F i + V Ca CaF2 + Ca
13.58 Np Ca + 2 F i + V Ca 1 2 CaF2 + 3 2 Ca
19.75 Np Ca + 3 F i + V Ca 2Ca
19.90 Np Ca + 1 F i + 2 V Ca CaF2 + 2Ca
1.91 Np Ca + V F + V Ca 2CaF2
Table 5. Energies of relevant charge compensation possibilties of CaF2 doped with CeF4 in an oxygen-deprived environment.
Energy ( e V )InsideEnvironment
0.0032CaF2CeF4
9.14 Ce Ca CaF2 + F2
3.67 Ce Ca + F i CaF2 + 1 2 F2
1.27 Ce Ca + 2 F i CaF2
1.21 Ce Ca + V Ca 2CaF2
Table 6. Energies of selected charge compensation possibilties for a 2 3 super structure of the conventional CaF2 cell doped with uranium in a fluorinated environment where oxygen is not present.
Energy (eV)InsideEnvironment
0.00 U Ca + 2 F i + V Ca 2CaF2 + (n − 3)F2
0.51 U Ca + 4 F i CaF2 + (n − 3)F2
7.65 U Ca + F i CaF2 + (n − 3/2)F2
Table 7. EFG values for Th:CaF2 + 2 F i for various cell sizes, functionals and with an investigation into the inclusion of spin-orbit coupling (SOC).
SizeFunctionalSOC V z z ( V / Å 2 ) η
2 3 PBENo157.650.10
2 3 PBEYes156.430.11
3 3 PBENo114.600.31
3 3 HSE06No115.970.31
4 3 PBENo111.050.37
Table 8. Slices in a (001)-plane of charge densities for the first unoccupied state in fully compensated configurations of CaF2 doped with Ac ( F i ), Th (2 F i ), and Ce (2 F i ) impurities. Only a part of the unit cell around the dopant is shown. In each figure, the colors correspond to the same values of the charge density. However, just for Ac:CaF2 are red and blue colors actually coinciding with the overall maximum and minimum values. For Th:CaF2 and Ce:CaF2, red is used starting from roughly 50% and 4% of the overall maximum respectively; hence these charge densities are even more localized than the figure suggests. Evidently, the shape of the charge density for Ac:CaF2 exhibits a striking difference compared to the others cases. Drawing produced by VESTA [40].
Ac:CaF2Th:CaF2Ce:CaF2
Crystals 12 01128 i001 Crystals 12 01128 i002 Crystals 12 01128 i003
Publisher’s Note: MDPI stays neutral with regard to jurisdictional claims in published maps and institutional affiliations.

