Article

Fluorosubstitution of the Molecular Core in Chiral Esters with Short Terminal Carbon Chains: Influence on Physical Properties

by
Aleksandra Deptuch
1,2,*,
Marcin Piwowarczyk
1,
Małgorzata Jasiurkowska-Delaporte
1,
Jungeun Kim
3,
Magdalena Urbańska
4,
Maciej Skolarczyk
2,†,
Teresa Jaworska-Gołąb
2 and
Monika Marzec
2
1
Institute of Nuclear Physics Polish Academy of Sciences, PL-31342 Kraków, Poland
2
M. Smoluchowski Institute of Physics, Jagiellonian University, PL-30348 Krakow, Poland
3
Application Laboratories, Rigaku Corporation, Tokyo 196-8666, Japan
4
Institute of Chemistry, Military University of Technology, PL-00908 Warsaw, Poland
*
Author to whom correspondence should be addressed.
Current affiliation: Faculty of Materials Science and Ceramics, AGH University of Science and Technology, PL-30059 Krakow, Poland.
Crystals 2022, 12(8), 1028; https://doi.org/10.3390/cryst12081028
Submission received: 27 June 2022 / Revised: 20 July 2022 / Accepted: 21 July 2022 / Published: 24 July 2022
(This article belongs to the Section Liquid Crystals)

Abstract

:
Comparative study of chiral liquid crystalline (S)-(1)-4’-(1-methylheptylcarbonyl) biphenyl-4-yl 4-[4-(2,2,3,3,4,4,4-heptafluorobutoxy)butyl-1-oxy] benzoate (4HH) and (S)-4’-(1-methylheptyloxycarbonyl)biphenyl-4-yl 4-[4-(2,2,3,3,4,4,4-heptafluorobutoxy) butyl-1-oxy]-2,3-difluorobenzoate (4FF) is performed by complementary methods. For 4HH melting of the low-temperature crystal phase and subsequent cold crystallization (from antiferroelectric smectic C A * phase to the high-temperature crystal phase) are reported, crystallization kinetics is examined and a monotropic hexatic SmX A * phase is observed on cooling. For 4FF rich polymorphism in the solid state is investigated mainly by simultaneous X-ray diffraction and differential scanning calorimetry measurements. Influence of fluorosubstitution on structural, electro-optic and dielectric properties of the smectic phases is reported. Unit cell parameters of crystal phases of 4HH and 4FF are determined. The reported results show that the double fluorosubstitution slows down the Goldstone mode and PH phason in the smectic phases and facilitates crystallization.

1. Introduction

Chiral esters 3FmX1PhX26 (m = 2–7, X1, X2 = H, F) [1,2,3,4,5], abbreviated further as mX1X2, exhibit smectic phases with ferro- and/or antiferroelectric properties with the tilt angle close to 45° (orthoconic smectics), so they are promising materials for use in the new generation of liquid crystal displays (LCDs) [6,7]. Especially the antiferroelectric smectic C A * ( SmC A * ) phase stable in a wide temperature range is desired for practical applications because it enables easier introduction of a greyscale than the ferroelectric SmC * phase [8]. The antiferroelectric properties of a liquid crystal were reported on the first time for the MHPOBC compound, where the tristable switching in an electric field was observed [9,10]. Afterwards, numerous compounds with a molecular structure based on MHPOBC (the chiral molecule consisting of the three aromatic rings forming the molecular core and two terminal chains) were reported to exhibit the SmC A * phase [1,2,3,10,11,12].
The proper planar alignment of the SmC A * phase for application in LCDs is difficult due to appearance of the chevron defects, which lead to light leakage in the dark state of a display. However, this problem can be solved, and the perfect dark state can be obtained if the tilt angle in the SmC A * phase is equal to 45° (for practical purposes—between 42° and 48°). The orthoconic SmC A * phase is optically uniaxial; therefore, the chevron defects in the sample’s alignment, even if they are present, do not decrease the quality of the dark state [6,7].
The SmC A * phase with a high tilt angle of 40–45° is often observed for the MHPOBC-based compounds with a partially fluorinated nonchiral terminal chain and their mixtures. Additional fluorosubstitution of the aromatic molecular core may also change the tilt angle values [1,2,3,11,12]. The example of such compounds is the mX1X2 family [1,2,3]. The smectic phases of these esters have been the subject of the numerous experimental studies [1,2,3,4,5]; however, the recent discovery of the SmC α * subphase in 5FF [13] as well as the glass transition of the SmC A * phase of mHF homologues (m = 5, 6, 7) [14,15] and of the hexatic SmX A * phase of 5HH [16] prove that new phenomena can be found even in the already widely studied compounds. Moreover, the behaviour of mX1X2 compounds in the solid state still demands further study. In this paper, we present the results regarding the phase transitions and physical properties of 4HH and 4FF (Figure 1). The phase sequence of these compounds, on heating, is as follows: crystal (62.7 °C) SmC A * (108.4 °C) SmC * (130.5 °C) isotropic liquid for 4HH and crystal (79.4 °C) SmC A * (87.6 °C) SmC * (104.0 °C) isotropic liquid in 4FF [3]. Despite the high melting temperature, 4HH and 4FF were successfully used as components of orthoconic mixtures [3].
The aim of this research is to study how fluorosubstitution in the molecular core affects the structural, electro-optic and dielectric properties of the smectic phases as well as the polymorphism of the crystal phases in 4HH and 4FF. The experimental methods applied are differential scanning calorimetry (DSC), polarizing optical microscopy (POM) with electro-optic measurements, X-ray diffraction (XRD) and frequency domain dielectric spectroscopy (FDDS). Additionally, for 4HH, the cold crystallization kinetics is studied, and for 4FF, the simultaneous XRD-DSC measurements are applied for the study of transitions between the crystal phases in heating.

2. Materials and Methods

Polycrystalline 4HH and 4FF samples were synthesized as described in [1,2].
DSC measurements with 3, 6, 10, 15, 20 °C/min rates were carried out on DSC 8000 PerkinElmer calorimeter for the samples of 6.84 mg (4HH) and 6.55 mg (4FF) tightly pressed in aluminium crucibles. The calibration was done based on the melting points of indium and water.
POM observations and electro-optic measurements were performed on Nikon Eclipse LV100POL polarizing microscope with Fine Instruments WTMS-14C temperature controller, DSO6102A digital oscilloscope, 33120A Agilent generator and F20ADI FLC Electronics amplifier. The samples were introduced by the capillary effect into the ITO electro-optic cells (AWAT Company) of 5 μm thickness with polymer layer providing the planar alignment. The tilt angle was determined using the electric field (Ep-p = 8 V/μm) by observation of the Clark–Lagerwall effect [17]. Spontaneous polarization was measured using the reversal current method [18,19] (Ep-p = 8 V/μm for 4HH, Ep-p = 10 V/μm for 4FF, f = 50 Hz) and the switching time was determined as the position of the local maximum on the sample’s voltage response to the rectangular signal [20] (Ep-p = 8 V/μm, f = 50 Hz). Additional texture observations for 4HH were done during cooling with 6 °C/min rate with PZO polarizing microscope equipped with Linkam THM 600 temperature stage. The recorded movie was analysed with TOApy program [21].
FDDS measurements were carried out on cooling using Agilent 4294A impedance analyser with Fine Instruments IMTA-300 temperature controller in the 40–107 Hz range. The AWAT cells with golden electrodes, thickness of 5 μm and polymer layer providing planar alignment were filled by the capillary effect. For chosen temperatures, the dielectric spectra in the function of the external DC bias field up to 7.6 V/μm were registered. For 4FF, additional measurements for the sample of 80 μm thickness pressed between two gold electrodes without aligning layer were performed in the 40–107 Hz range on cooling with Novocontrol Technologies dielectric spectrometer with the liquid nitrogen cooling system.
X-ray diffraction patterns of samples in capillaries (0.3 mm diameter, borosilicate glass) were registered in the 2θ = 2–30° range with Empyrean 2 (PANalytical) diffractometer in the geometry of the horizontal rotating capillary (CuKα, parabolic mirror on the incident beam). Temperature was controlled using Cryostream 700 Plus (Oxford Cryosystems) attachment. Complementary XRD patterns in the 2θ ≈ 2–3° range were collected for flat samples (on silicon wafers) with D8 Discover diffractometer (θ/2θ measurement, CuKα, parallel beam) with Anton Paar DCS350 heating stage. The XRD data were analysed in WinPLOTR [22], FullProf [23] and Expo [24]. The indexing of diffraction peaks was performed with Treor [25] procedure.
Simultaneous XRD-DSC measurements [26,27] of the 4FF sample in an aluminium crucible were performed with SmartLab (Rigaku) diffractometer (CuKα) equipped with DSC attachment. The 2D diffraction patterns were registered in parallel optics geometry with 2D Hybrid Pixel Array Detector HyPix-3000 during cooling and heating in the 0–120 °C range with 2 °C/min rate.

3. Results and Discussion

3.1. Liquid Crystalline Phases of 4HH and 4FF

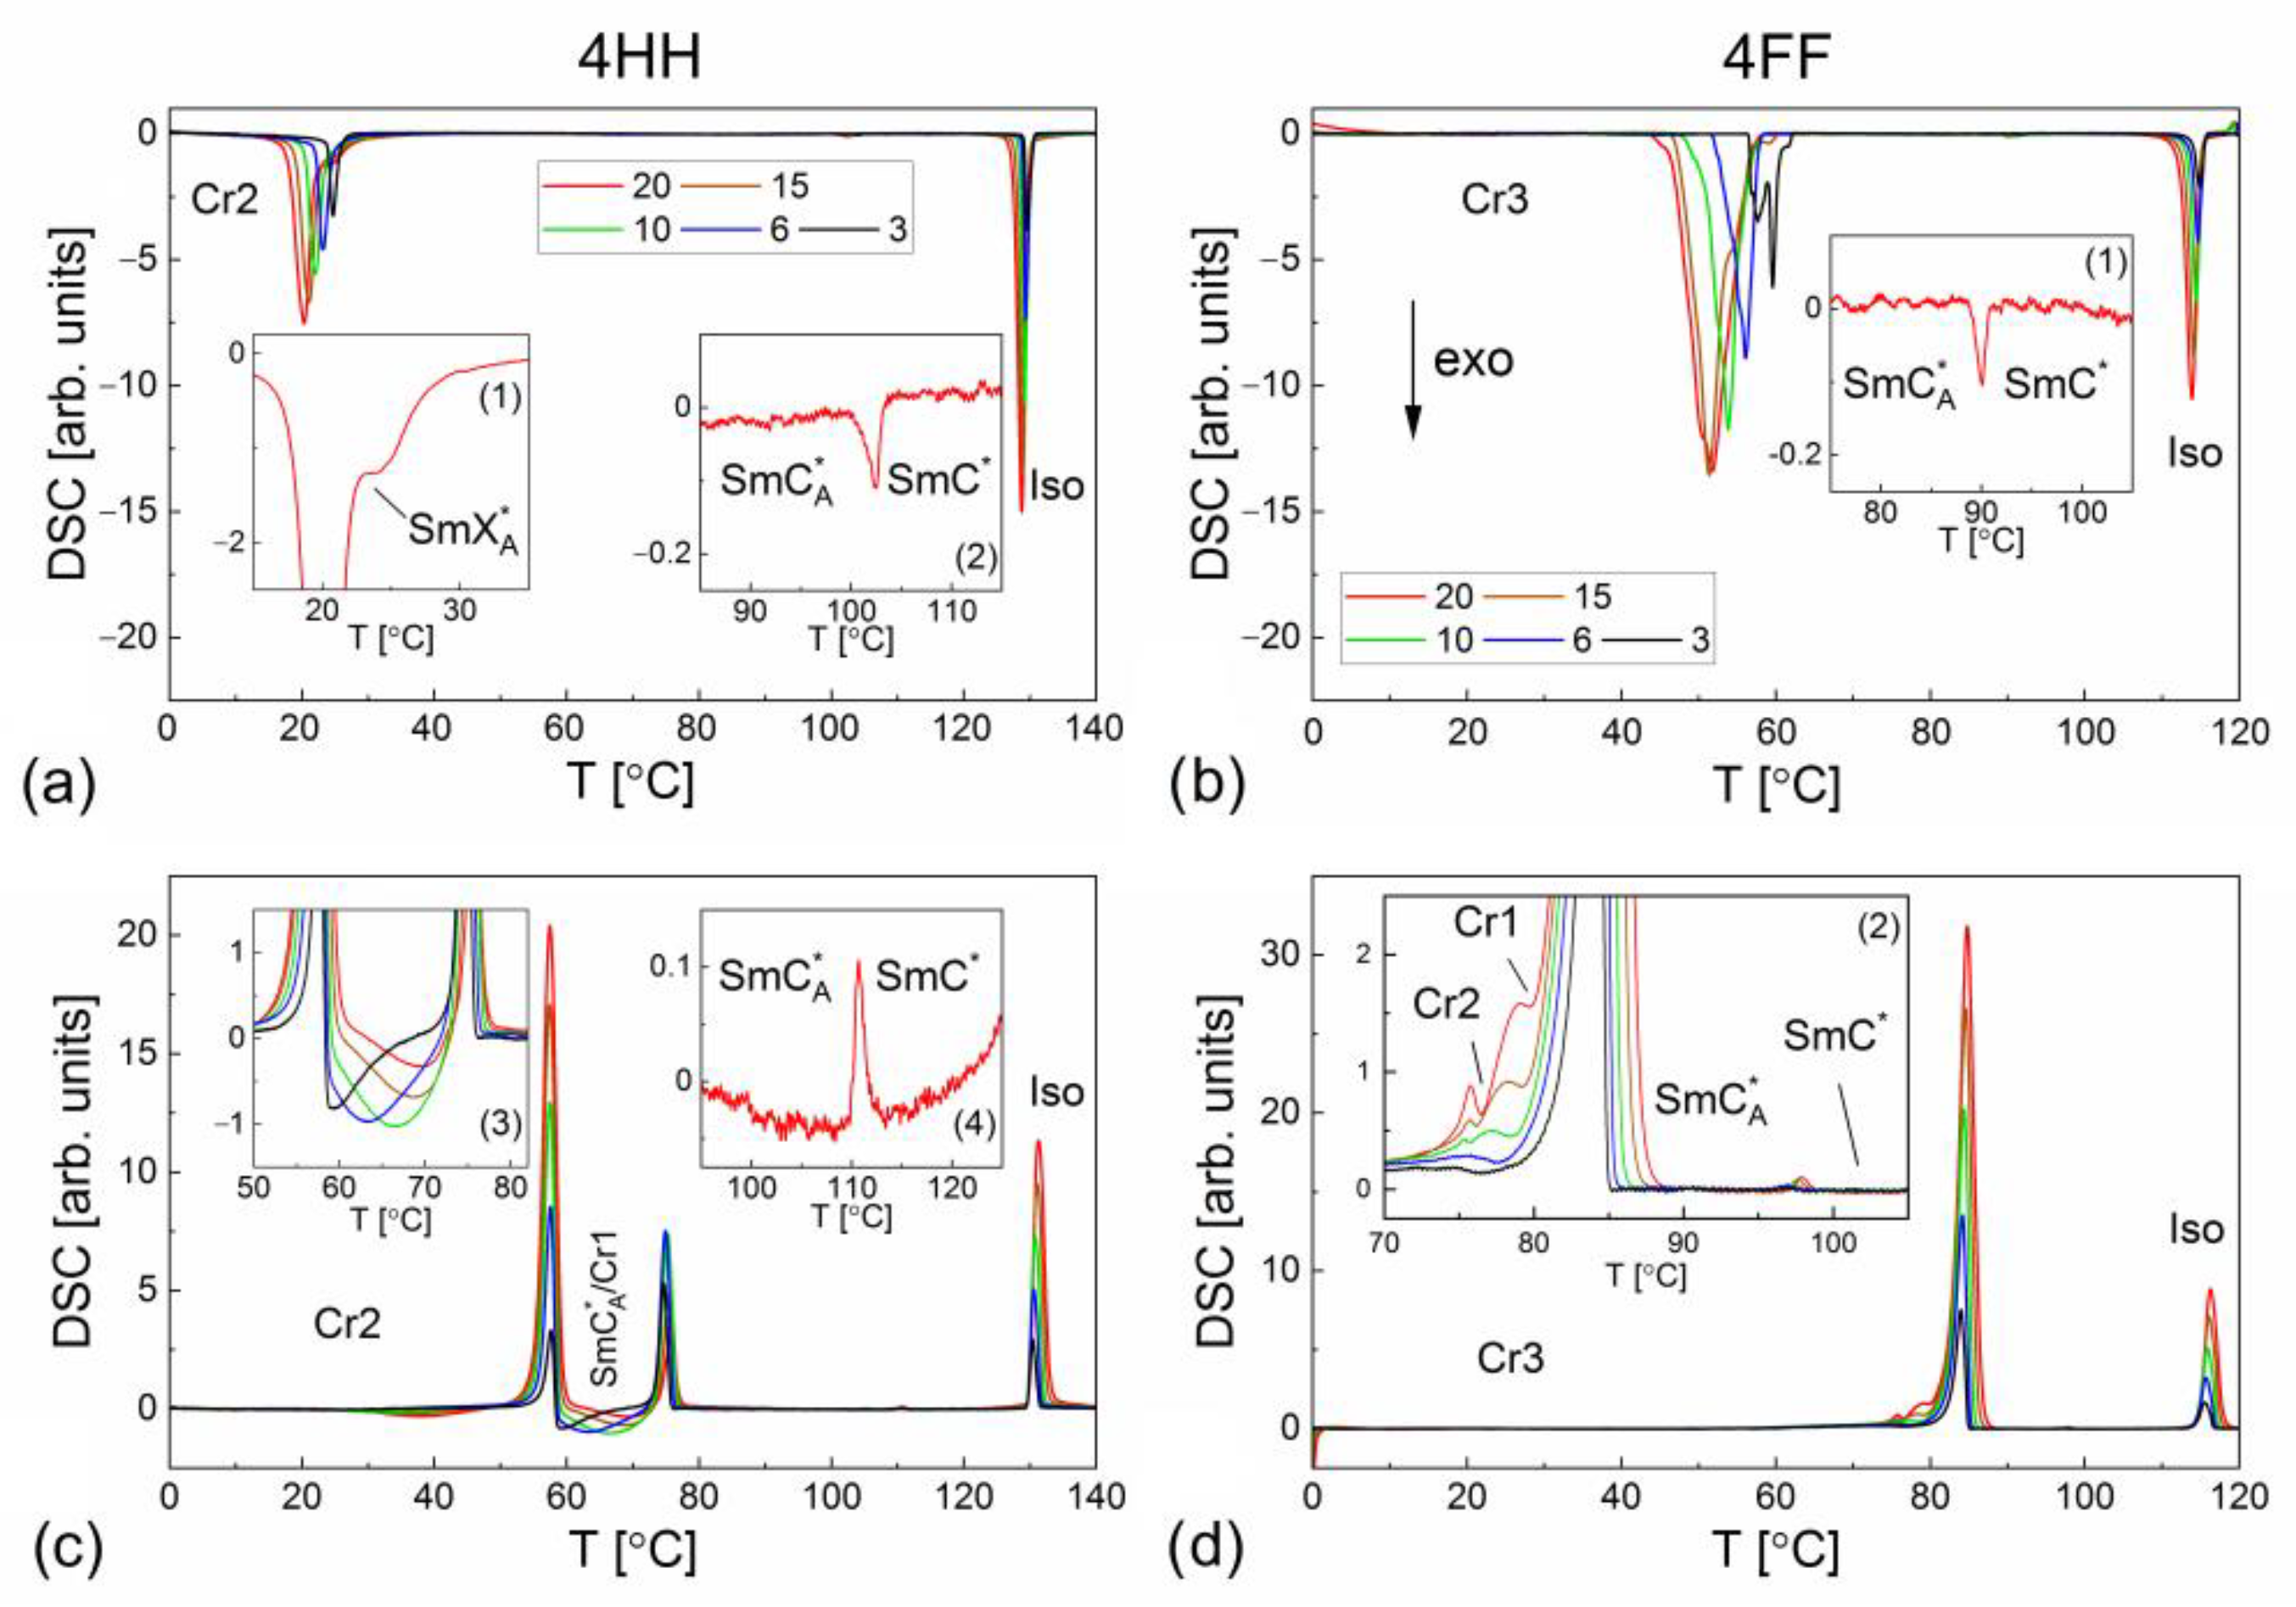
3.1.1. Polymorphism of the Smectic Phases

Ferroelectric SmC * and antiferroelectric SmC A * phases of 4HH and 4FF are enantiotropic ones, as they are observed both during cooling and heating (Figure 2, the first and last rows). The crystal phases, which appear at lower temperatures, are numbered in the order of decreasing temperature (the crystal phase observed at the highest temperatures for each compound is denoted as Cr1, etc.). The same notation of the crystal phases of both compounds does not indicate the same crystal structures (they were not solved). The transition between the SmC * and SmC A * phases is visible in the DSC curves as small anomalies (insets (2) and (4) in Figure 3) corresponding to the enthalpy change of ca. 0.04 kJ/mol. The Iso → SmC * SmC A * transition temperatures are shifted towards lower values for 4FF compared to 4HH (Table 1). The short-range order present in the isotropic liquid and within smectic layers results in a wide maximum in the XRD patterns at 2θ ≈ 18–20° (Figure 4). For the SmC * and SmC A * phases, there is also a low-angle sharp peak at 2θ ≈ 2.9°, resulting from the quasi-long-range positional lamellar order [28]. Conventional XRD does not allow us to distinguish between synclinic and anticlinic order of molecular tilt in neighbour smectic layers [29]; therefore, patterns of the SmC * and SmC A * phases are similar. Only the resonant X-ray diffraction, which is sensitive for the orientation of molecules in the smectic layers, enables detection of the anticlinic order [29]. However, the SmC * SmC A * transition leads to a change of the sample’s birefringence, so it is clearly visible as a change of colour of the POM textures (Figure 2).
For 4HH, as the cooling rate increases, an additional anomaly becomes visible in the DSC curves in a proximity to a larger anomaly originating from crystallization (inset (1) in Figure 3a). Because the area of this anomaly is small ( Δ H ≈ 1.5 kJ/mol), it can be interpreted as the transition between the SmC A * phase and monotropic, more-ordered smectic phase, denoted here as SmX A * . It could be the hexatic phase reported previously for the 5HH compound from the same series [16]. In the POM observations for 4HH, a change of texture, visible mainly as a colour saturation, is observed below 30 °C (Figure 2a, 26 °C). That supports the hypothesis of the third smectic phase. On further cooling, another transition is visible at 23 °C. The change in texture is mostly in colour (Figure 2a, 20 °C) and the overall texture still resembles these observed for SmC A * and SmX A * . However, Δ H value at this transition obtained by DSC is 11.1 kJ/mol, the largest enthalpy change on cooling, which implies the crystallization of 4HH.
To check the hypothesis of the SmC A * SmX A * → Cr2 sequence on cooling in 4HH, an additional POM measurement was performed using another piece of equipment. The textures were registered as a movie during cooling from 140 °C to 0 °C with 6 °C/min rate. Next, TOApy program [21] was used for image analysis (Figure 5). As the textures of 4HH differ mostly in colour, the ‘rgb’ algorithm was applied, which decomposes each frame into three numbers describing summed values of red, green and blue components attributed to each pixel (e.g., a red pixel is described by 255, 0, 0 numbers, for details of algorithm see [21]). The most visible transition is Iso → SmC * , showing as a step-like increase in intensity. The SmC * SmC A * transition causes the change of the texture’s colour (Figure 5a,b), visible as a step in the temperature dependencies of the red and green components. Below ca. 40 °C, the texture becomes continuously lighter in colour (Figure 5d,e), which is connected with increase in intensity of all components. It might be interpreted as the SmC A * SmX A * transition, although even numerical analysis does not enable determination of its exact temperature. Finally, in the crystal phase, all three rgb components have almost constant values.

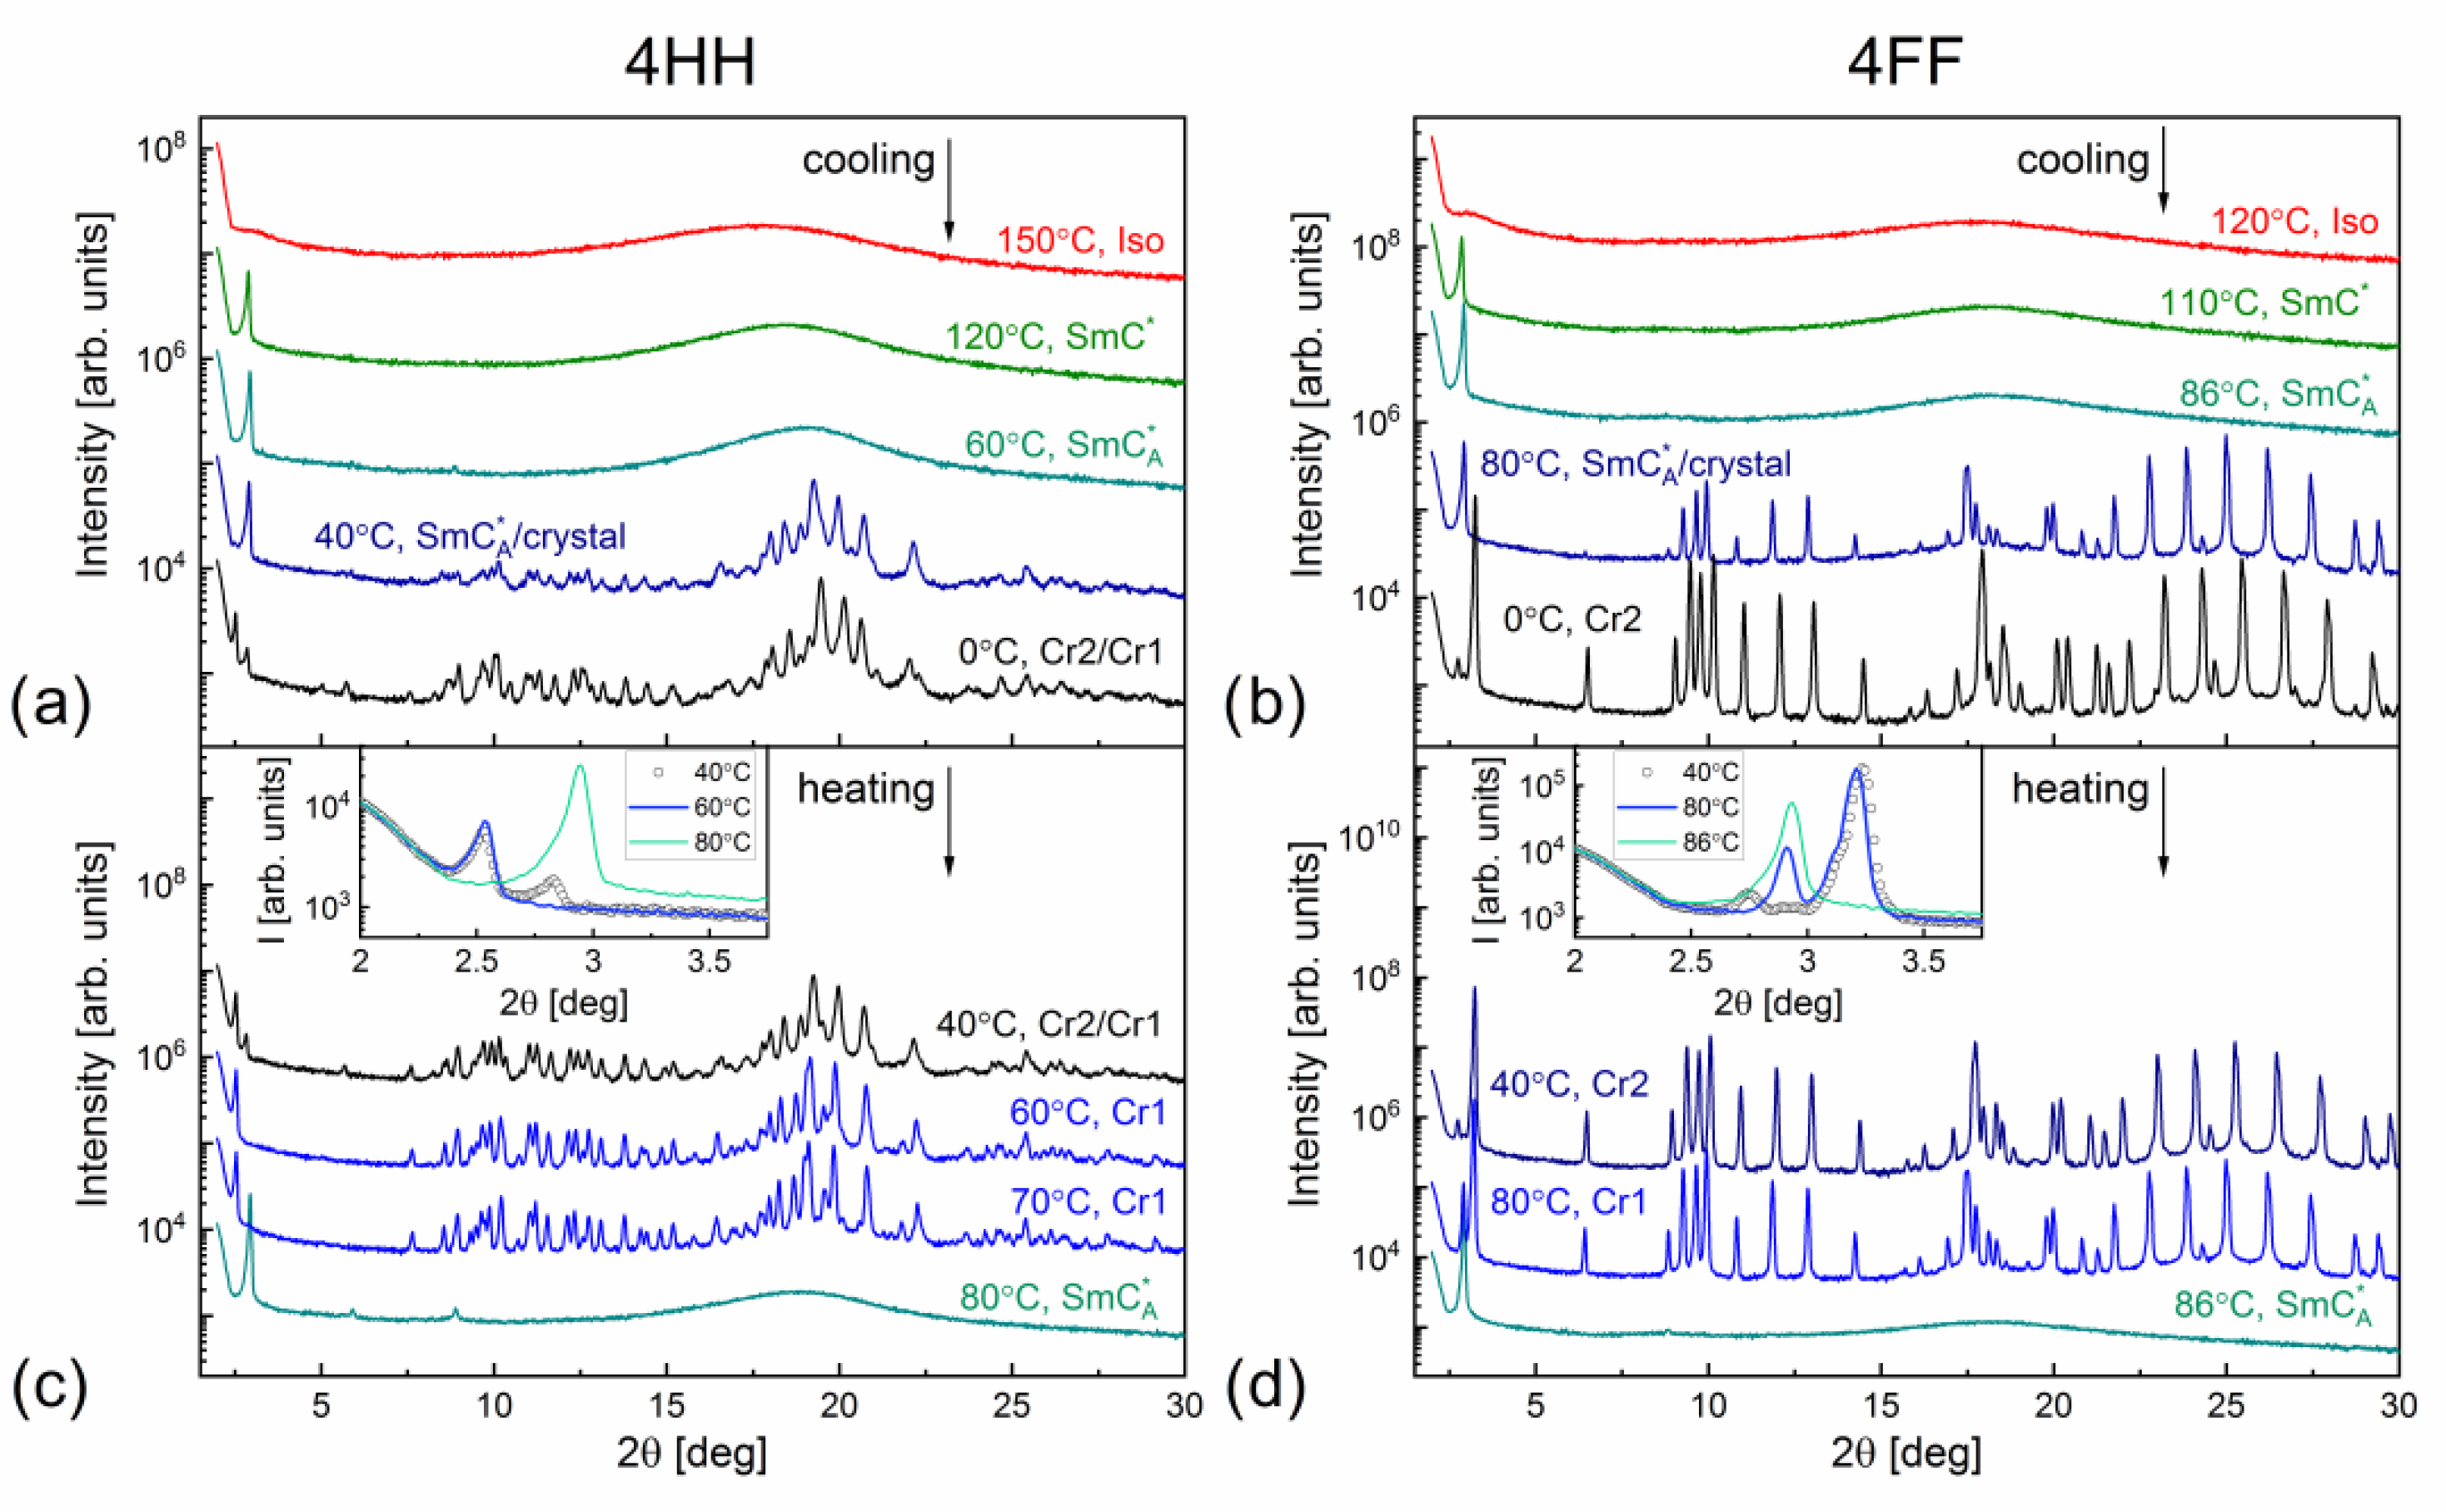
3.1.2. Structural Properties of the Smectic Phases

To determine the smectic layer spacing D , the XRD patterns collected for the flat sample on cooling were used as they provide larger signal-to-background ratio in the low-angle range compared to the sample in a capillary in our experimental setup. The values of D were obtained with the uncertainty of 0.2 Å using the Bragg equation D = λ C u K α / 2 s i n θ D , where θ D is the position of the peak at 2θ ≈ 3° [28]. The smectic layer spacing of both compounds takes values of 30–31 Å (Figure 6a). It initially decreases with decreasing temperature, which is typical for tilted smectic phases [5,13,14,30,31]. At 105 °C for 4HH and at 92 °C for 4FF, a small discontinuity is visible both in the layer spacing and the integrated intensity of the diffraction peak (also Figure 6a), which is a sign of the SmC * SmC A * transition. For 4HH, below 60 °C the layer spacing increases with decreasing temperature. That resembles the temperature dependence of D observed in other compounds [32,33] for which the presence of the hexatic tilted smectic phase (with the short-range positional order and long-range bond-orientational order within layers [28]) had been previously confirmed by XRD results. It suggests that the SmX A * phase of 4HH can be indeed either the hexatic SmF A * or SmI A * phase. The rapid decrease in the intensity of the low-angle peak observed below 42 °C for 4HH and below 67 °C for 4FF is caused by crystallization.
The short-range order within smectic layers was examined on the basis of the diffuse maximum at 2θ ≈ 18° in the patterns registered in 2θ = 2–30° on cooling (Figure 4). The wide peak was fitted with the Lorentz curve 1 / ( 1 + ξ 2 ( q q 0 ) ) 2 in the scattering vector q space, where q = 4 π s i n θ d / λ C u K α , q 0 is the peak position and ξ is the correlation length within the smectic layers [28]. The average distances between the long molecular axes in the smectic layers obtained as d = 2 π / q 0 are ca. 4.7–5 Å and decrease slightly with decreasing temperature. The correlation length ξ is smaller for 4FF than in 4HH (Figure 6b), although for both compounds, ξ increases with decreasing temperature, from 3.9 Å to 4.2 Å for 4FF and from 4.6 Å to 6.6 Å for 4HH. The maximal ξ value determined for 4HH is larger also than those obtained for mHF homologues (m = 2, 4–7) [14,15] or 5FF [13], and it is closer to the ξ values determined in the proximity to the SmC * → hexatic smectic phase transition in 3FO6C1 [33]. It further supports the hypothesis that the SmX A * phase of 4HH is a hexatic one.

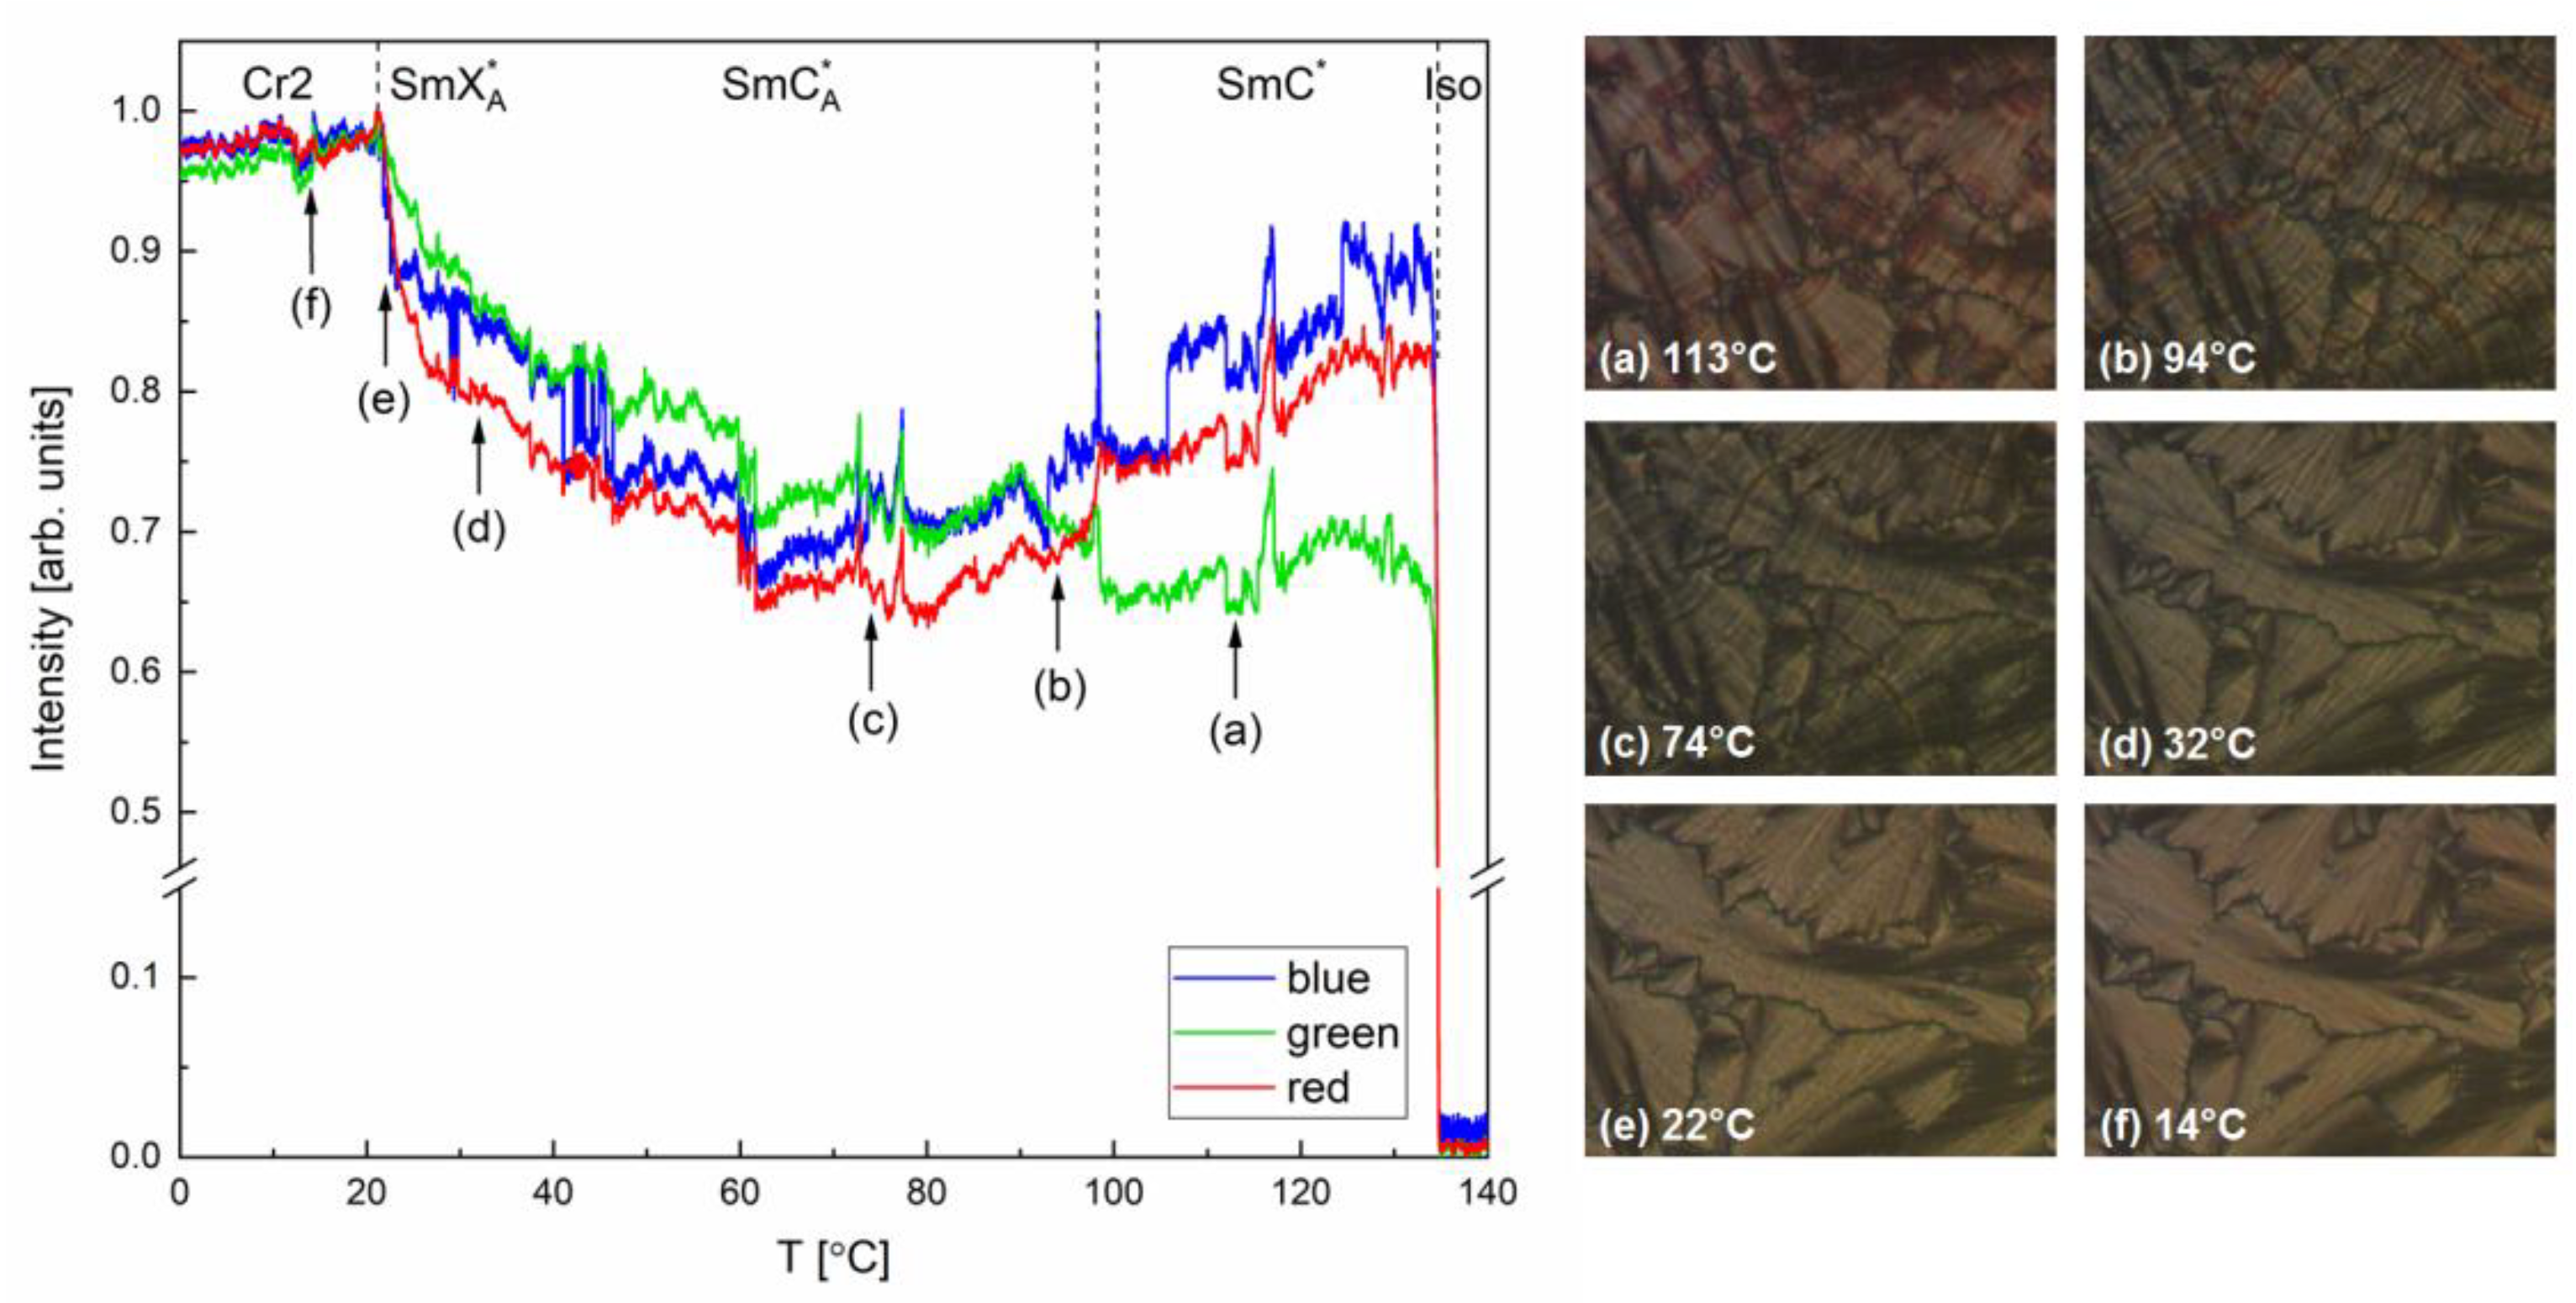
3.1.3. Electro-Optic Properties

Just below the isotropic liquid → SmC * transition, the tilt angle (Figure 6c) has already a high value of 37° for 4HH and 32° for 4FF. During further cooling, the tilt angle increases until it saturates below ca. 80 °C at the average value of 43.6° for 4HH and 40.9° for 4FF. Spontaneous polarization P s (Figure 6c) equals ca. 120 nC/cm2 for 4HH and 90 nC/cm2 for 4FF in the vicinity of the clearing temperature. It increases with decreasing temperature, and below 100 °C, the increase is almost linear. The maximal value of P s is 296 nC/cm2 for 4HH and 221 nC/cm2 for 4FF. Interestingly, for 4FF, P s does not decrease to zero during crystallization, and a small peak in the sample’s response is still observed. The P s value determined for the crystal phase of 4FF is 0.9 nC/cm2 at 67 °C and decreases gradually to 0.3 nC/cm2 at 42 °C. Below this temperature, the peak in the sample’s response becomes too small to determine the polarization with a reasonable uncertainty and disappears completely below 32 °C. The polarization in a crystal phase can be caused by incomplete crystallization, i.e., some small preserved domains of the SmC A * phase. Switching time τ s w of 4HH and 4FF show almost identical temperature dependence in the 74–113 °C range (Figure 6d), increasing during cooling from ca. 1 ms to 3.5–3.7 ms. On further cooling, 4FF crystallizes, while for 4HH, the τ s w value increases to 5.9 ms at 58 °C.

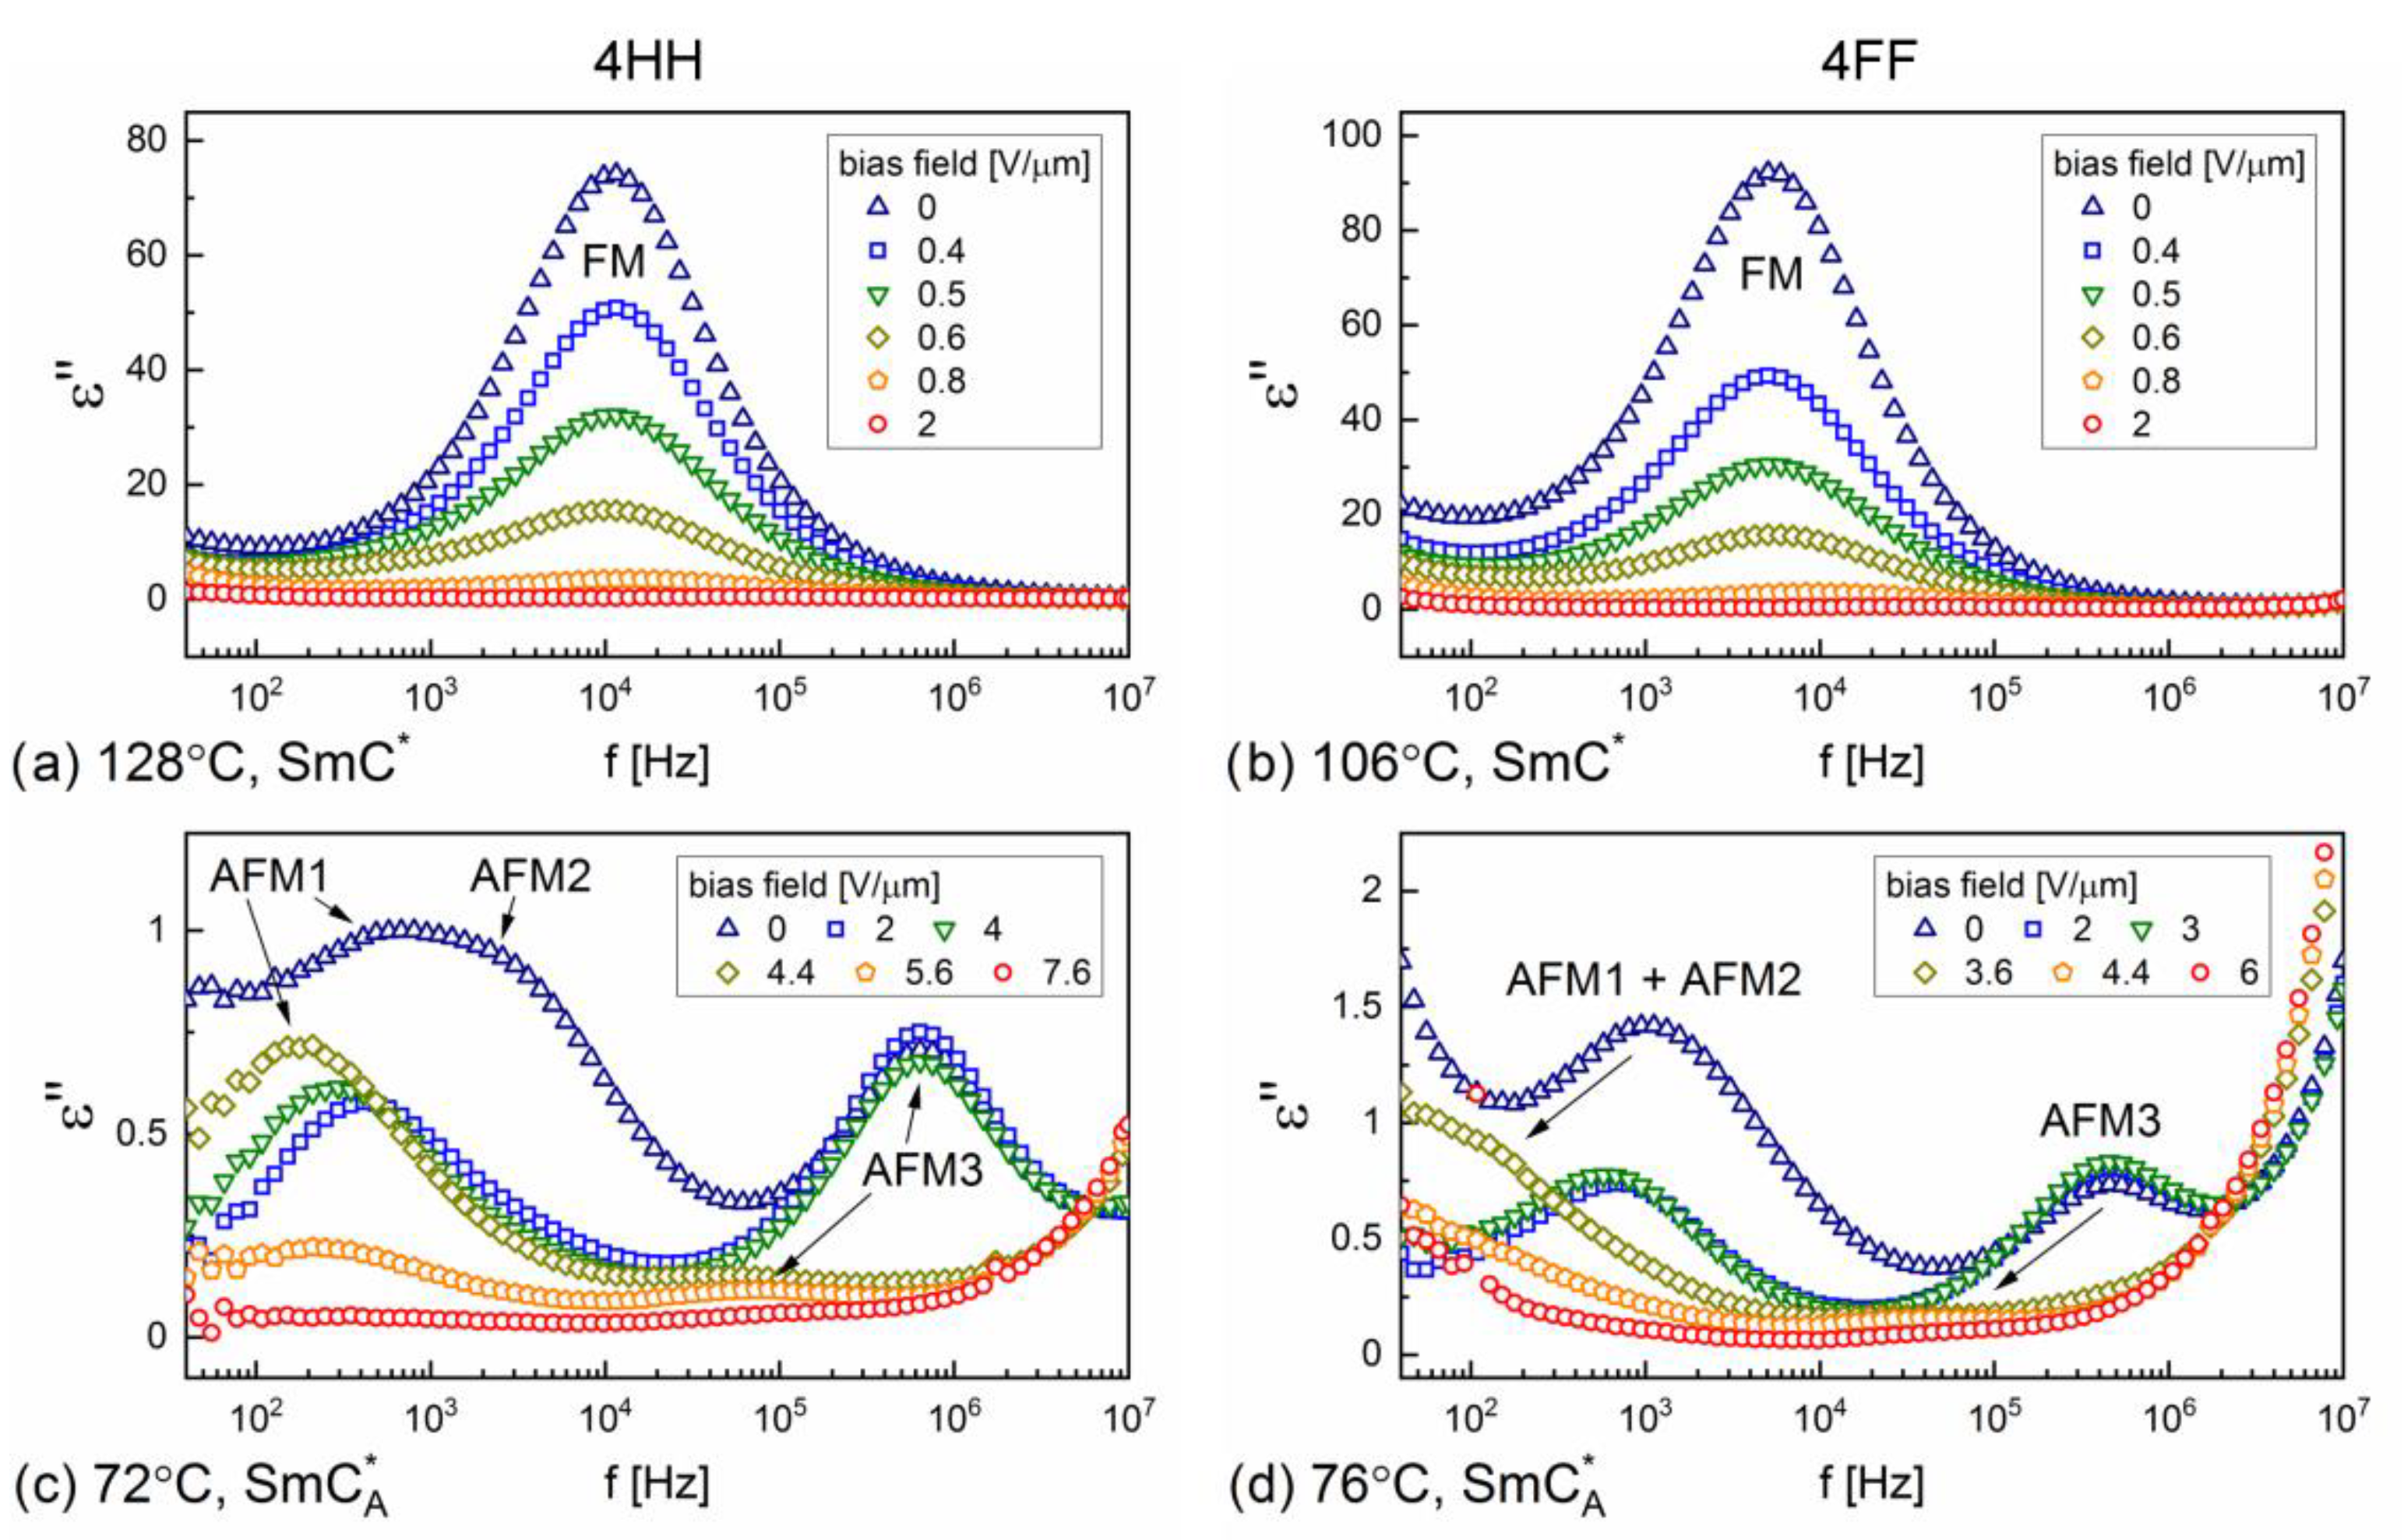
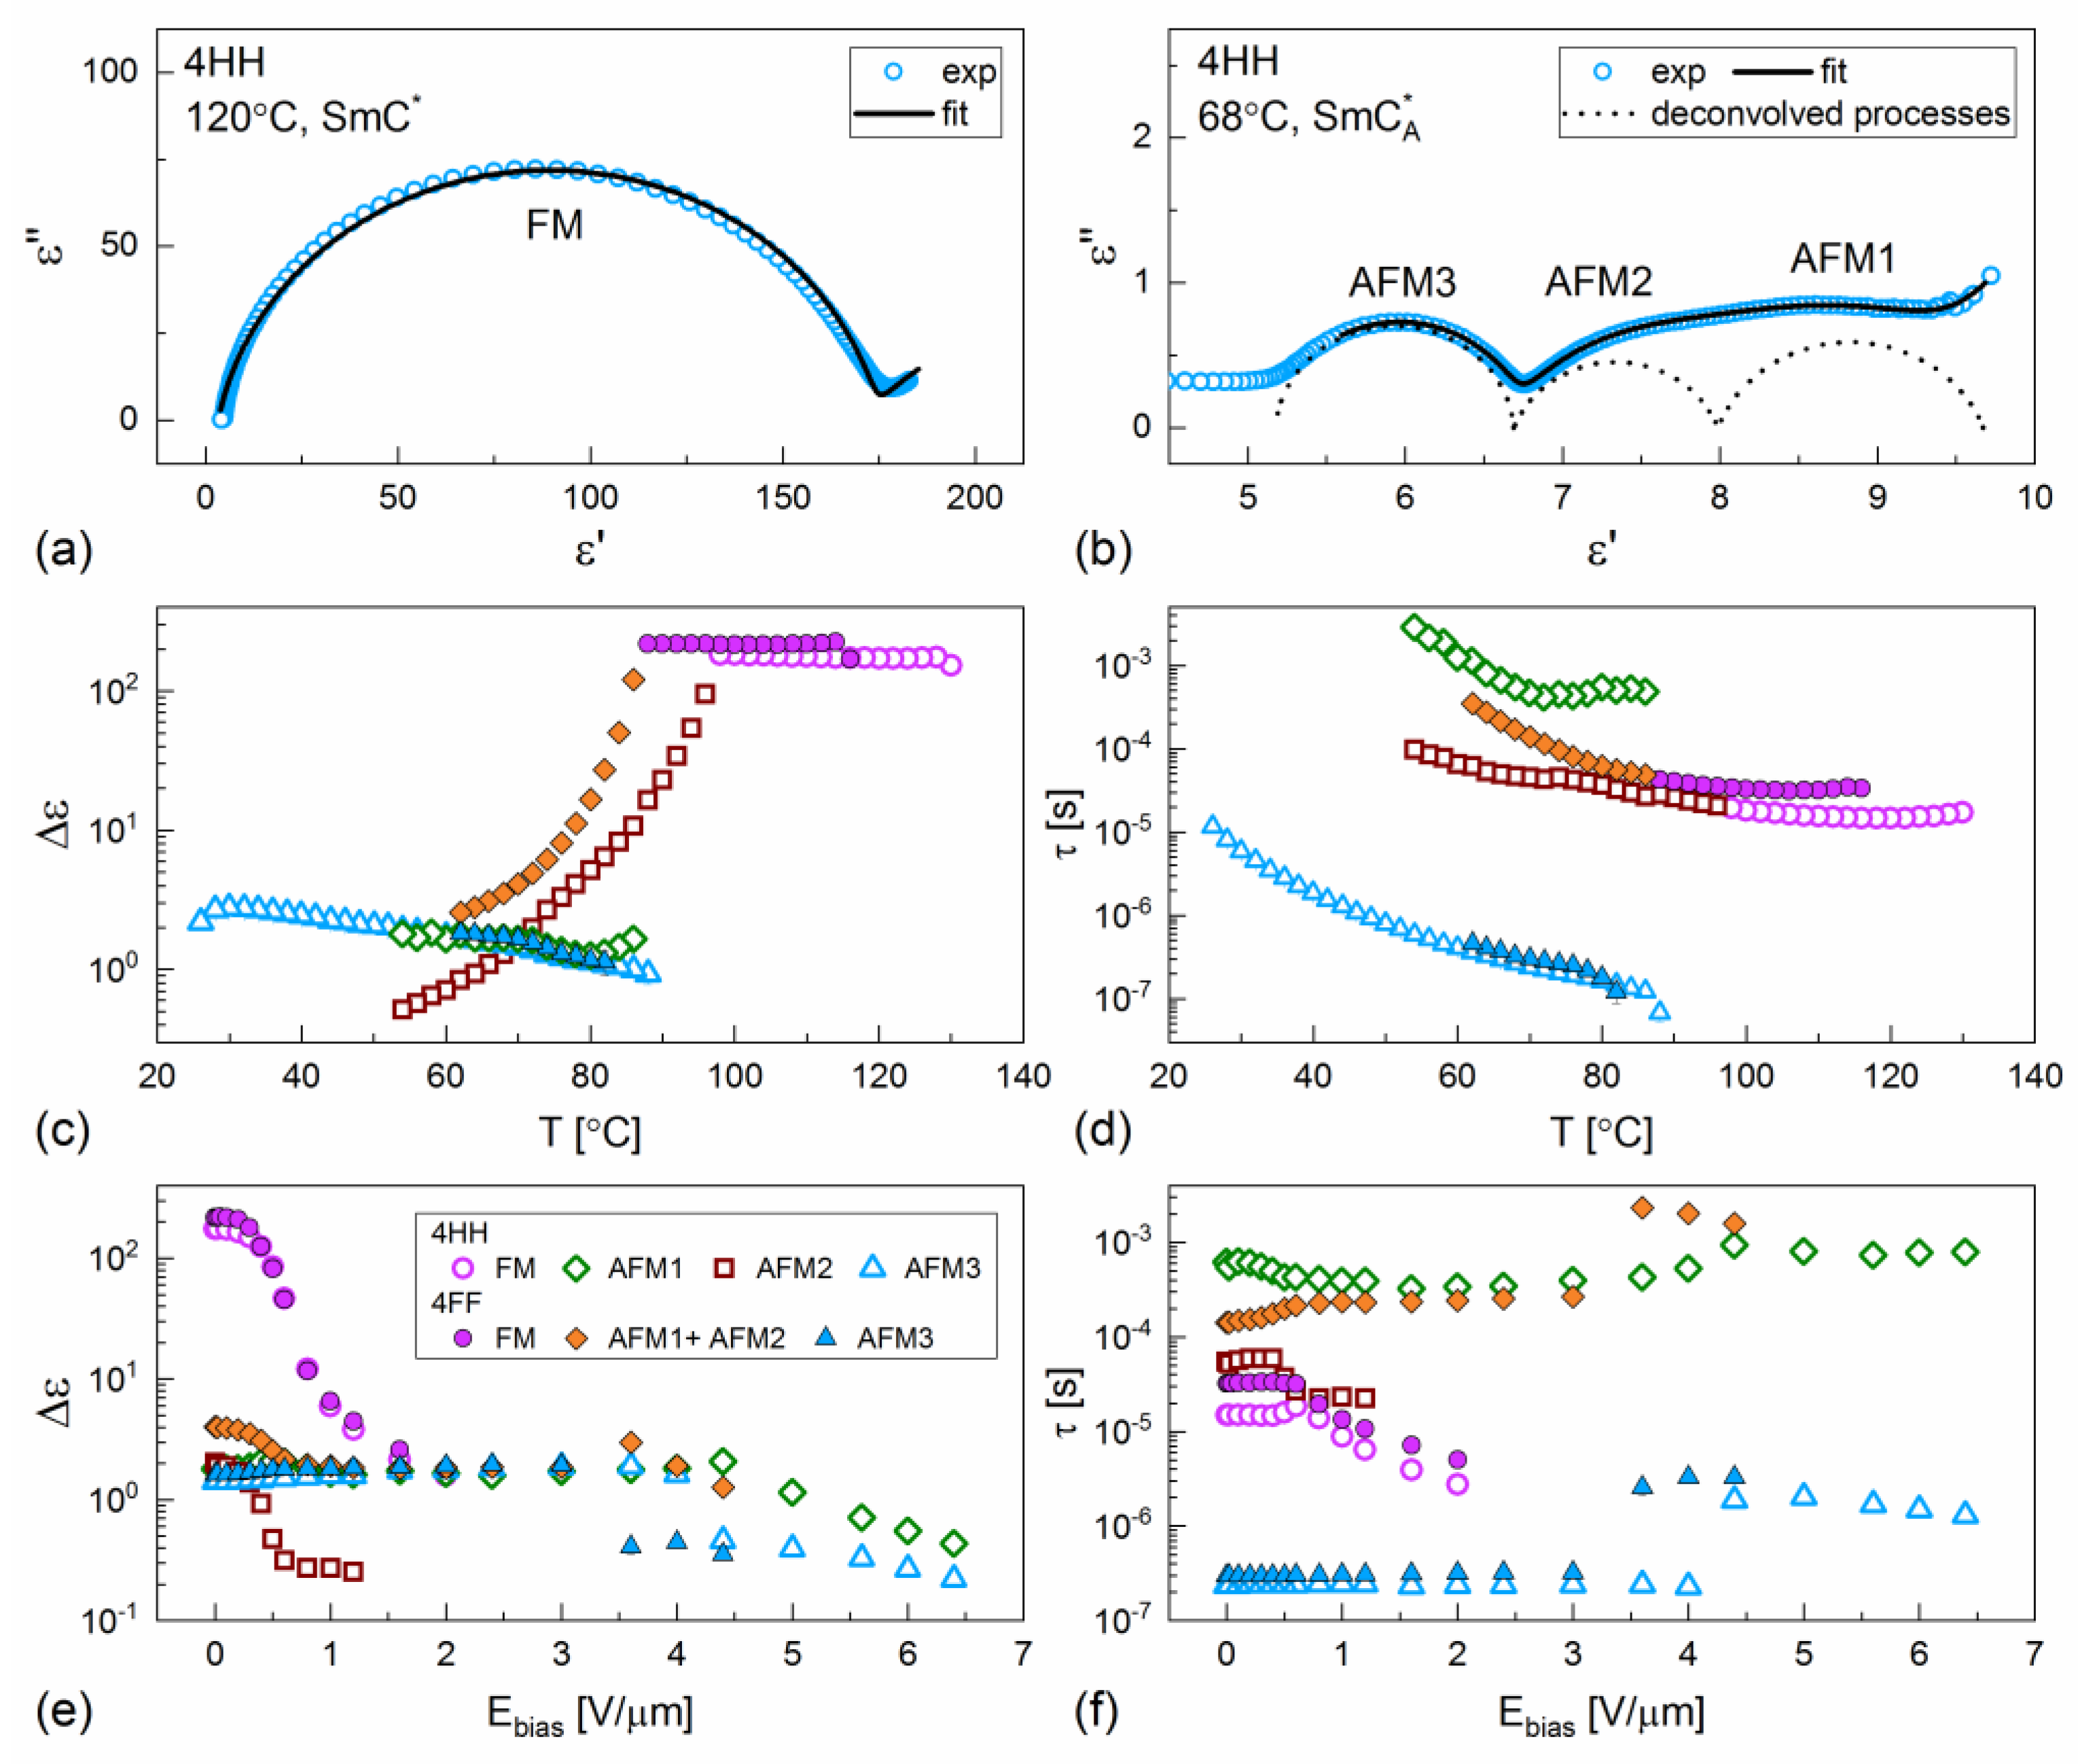
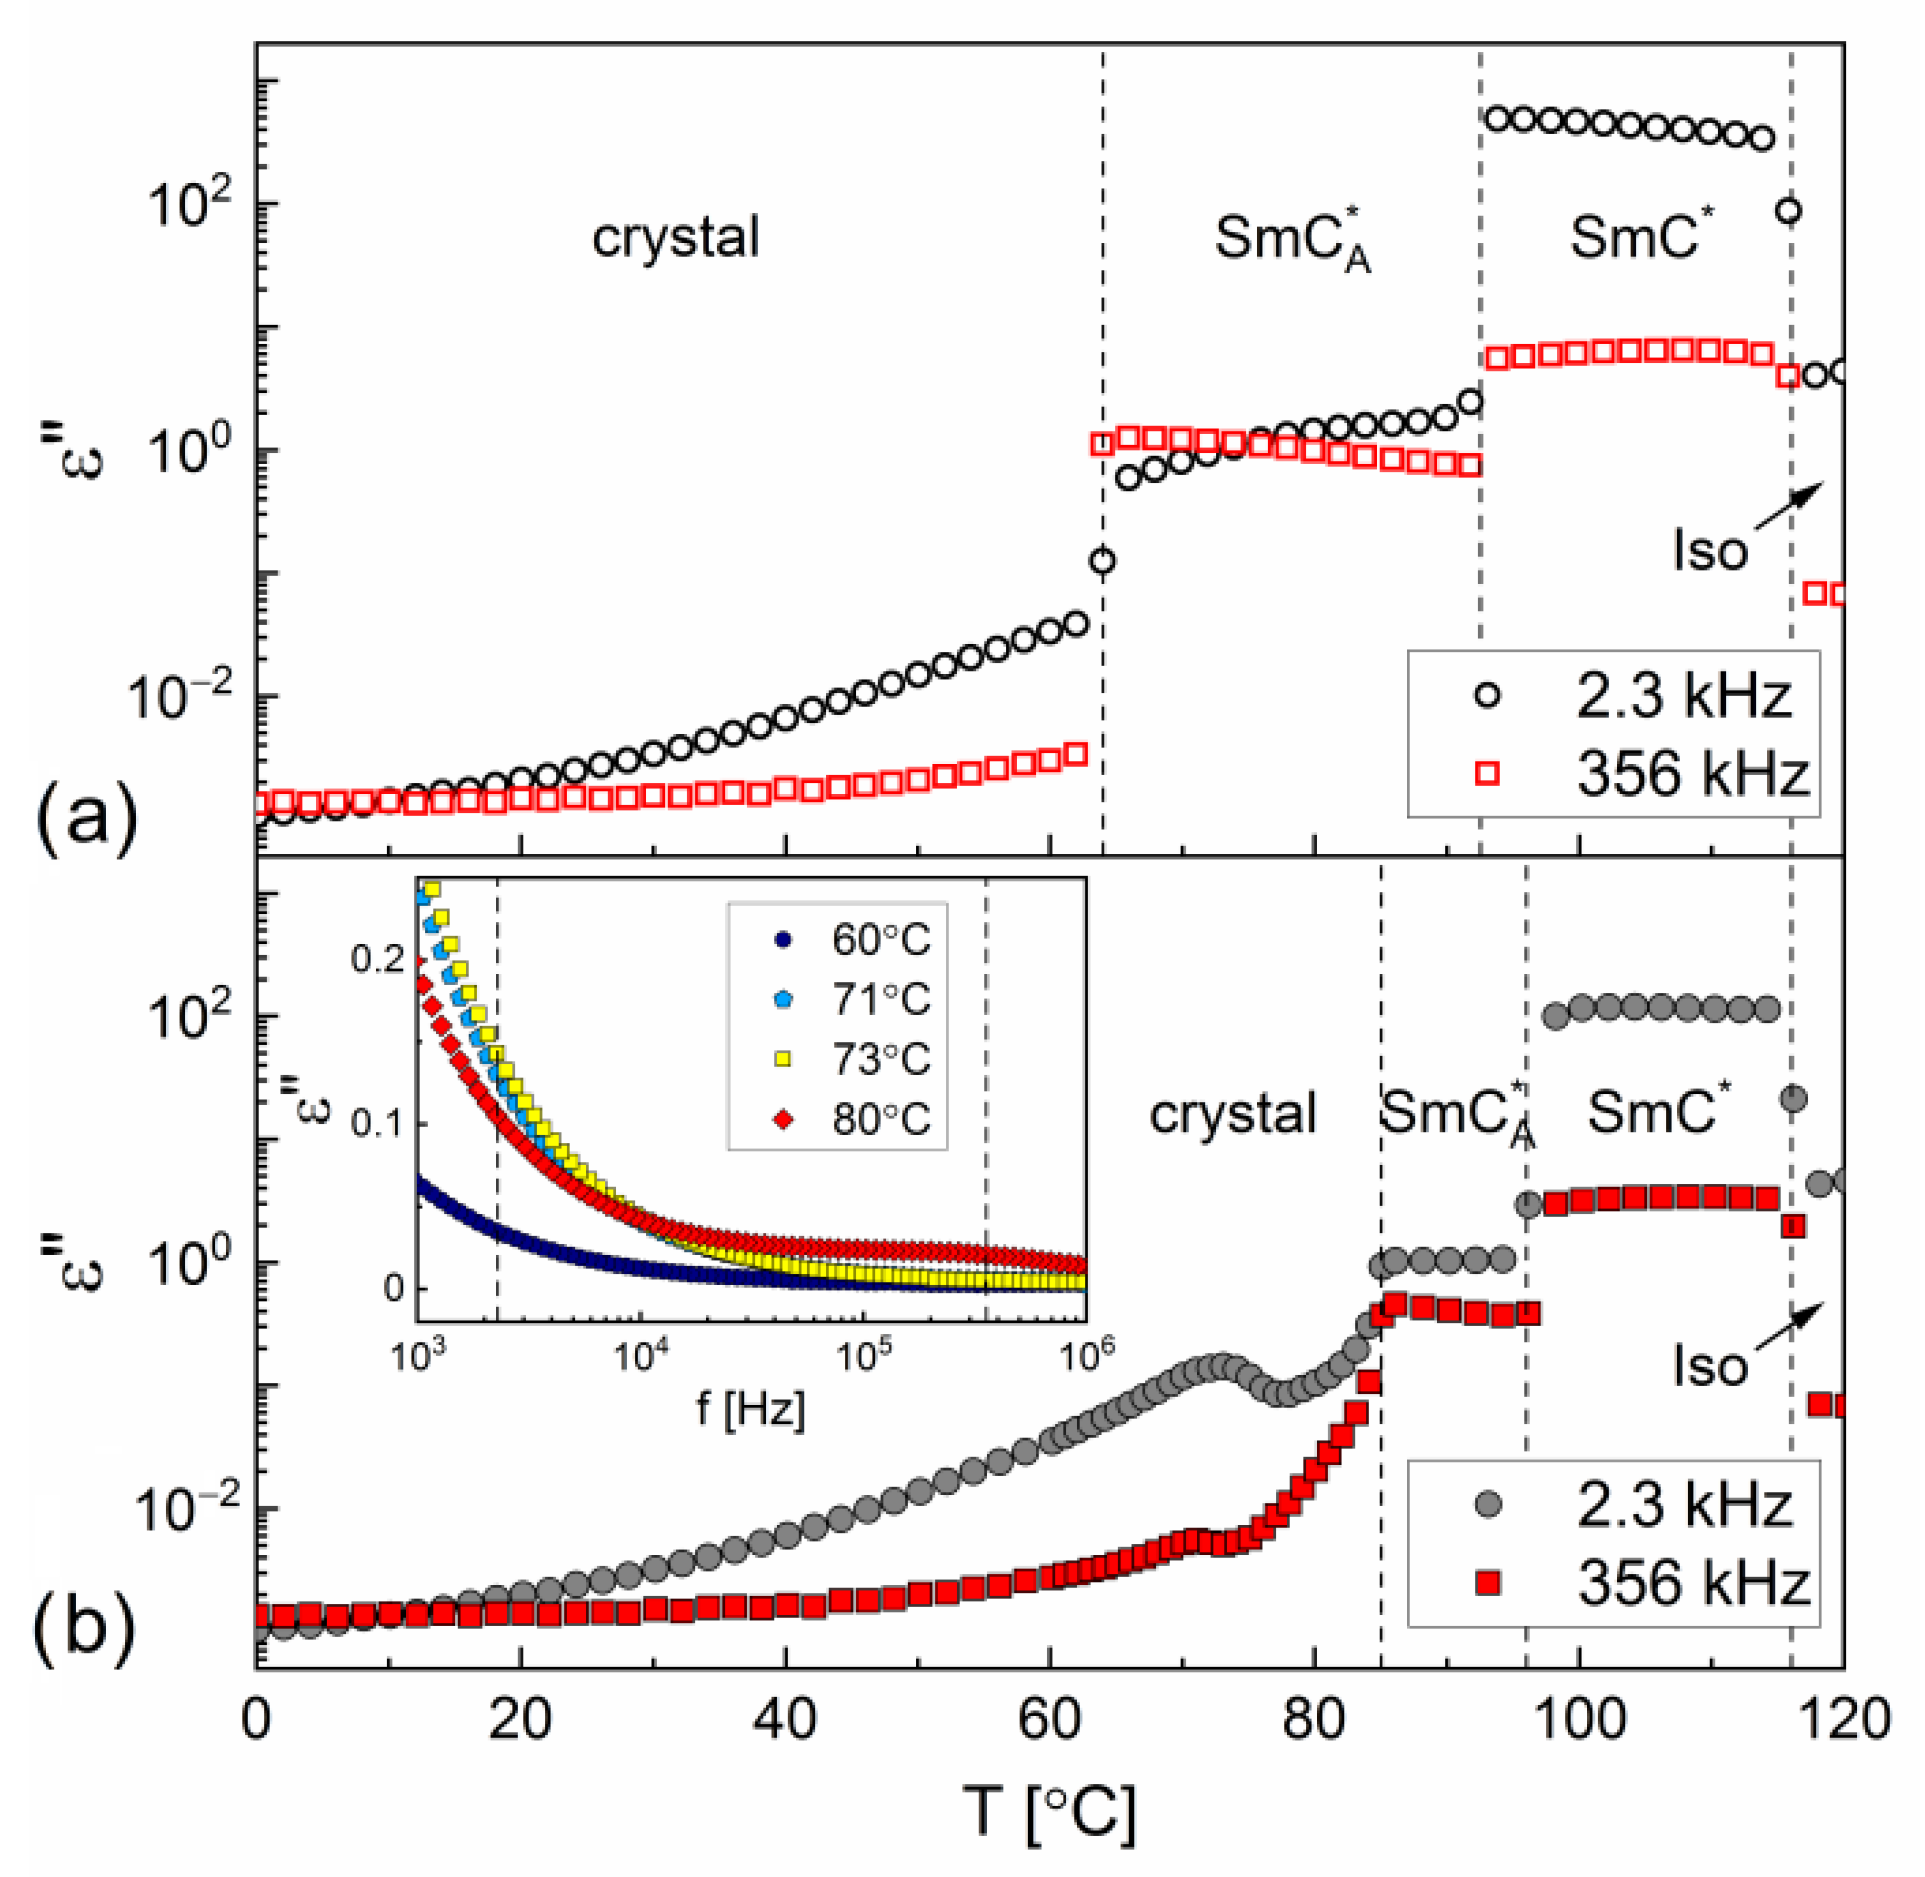
3.1.4. Dielectric Relaxation Processes

Exemplary dielectric absorption registered on cooling is presented in Figure 7 for chosen values of the bias field E b i a s . In the SmC * phase of both compounds, a relaxation process named here FM is observed (Figure 7a,b). In the SmC A * phase, the dielectric spectra of 4HH consist of three relaxation processes denoted as AFM1, AFM2 and AFM3, counting from the lowest frequency (Figure 7c), while for 4FF, there are only two distinct absorption peaks (Figure 7d). In order to identify the relaxation processes, the values of their dielectric increment Δ ε and relaxation time τ vs. temperature and E b i a s were obtained by fitting the Cole–Cole model [34] to the experimental spectra:
ε * ( f ) = ε + j Δ ε j 1 + ( 2 π i f τ j ) 1 α j i σ ϵ 0 2 π f + C ( 2 π f ) 1.5 .
In the Equation (1), ε is the permittivity at the high frequency limit, Δ ε j , τ j and α j are the dielectric increment, relaxation time and relaxation time distribution parameter of the j-th process, respectively, while f is frequency, σ is the ionic conductivity, and the last term describes the electrode polarization capacitance [34,35,36,37]. Representative Cole–Cole plots for 4HH are shown in Figure 8.
Neither the dielectric increment nor relaxation time of the FM process vary considerably with temperature (Figure 8c,d). The Δ ε values are much larger than for processes observed in the SmC A * phase. Additionally, the FM process is suppressed by the bias field (Figure 7a and Figure 8e). These features of FM are typical for the Goldstone mode, which is one of the collective processes possible in the SmC * phase and which is related to the fluctuations of the azimuthal angle along the surface of the tilt cone [37,38]. The relaxation time of the FM/Goldstone mode (Figure 8f) starts decreasing with increasing bias field above 0.6 V/μm, at which Δ ε of FM is reduced by ca. 75% in comparison to the value without the presence of the bias field.
At the SmC * SmC A * transition, the FM/Goldstone mode transforms directly into the AFM2 process observed in the SmC A * phase (Figure 8c,d). The measurements in the bias field (Figure 8e,f) show that AFM1 and AFM3 behave similarly. The dielectric increment of AFM3 increases weakly with increasing E b i a s up to 4 V/μm and its relaxation time does not change as well. Above 4 V/μm, AFM3 is almost completely suppressed, and its relaxation time increases by one order of magnitude. For AFM1, initial weak strengthening with increasing E b i a s (up to 0.5 V/μm), subsequent decrease of Δ ε and another slight strengthening up to 4.4 V/μm occurs. The fluctuations of fitted Δ ε values can be partly caused by the proximity of AFM2. At 4 V/μm, the increase of τ and significant decrease of Δ ε of AFM1 with increasing E b i a s is observed. Two collective relaxation processes typical for the SmC A * phase are denoted as PL (with lower frequency) and PH (with higher frequency), and they are usually interpreted respectively as in-phase and anti-phase collective fluctuations of molecules around the tilt cone in neighbour smectic layers [4,33,39,40,41]. It was previously reported for W1000-B mixture [42] (consisting of 5HF, 7FH and 3HH) that PL and PH processes show analogous dependence on the bias field and change abruptly their behaviour above a certain E b i a s (although for W1000-B total suppression of PL and PH was actually observed instead of shifting towards lower frequencies). From the results shown in Figure 8e,f, it should therefore be concluded that AFM1 and AFM3 are similar processes, namely PL and PH, respectively. The remaining AFM2 process behaves in the bias field like the Goldstone mode (Figure 8e, f), which enables to identify it as the hereditary Goldstone mode [39], whose presence is caused by the remaining SmC * small domains co-existing with the SmC A * phase.
For 4FF, the higher-frequency relaxation process in the SmC A * phase shows similar behaviour vs. temperature and vs. bias field as the AFM3 process for 4HH (Figure 8c–f) with a lower suppression field; therefore, it can be easily identified as the PH phason. The lower-frequency process in the SmC A * phase of 4FF behaves like AFM1 (hereditary Goldstone mode) in the vicinity of the SmC * SmC A * transition (Figure 7c,d); however, its behaviour in the bias field is similar to AFM2 (PL phason). The overall results imply that the low-frequency process is actually two overlapped processes AFM1 and AFM2. The frequencies of the Goldstone mode and PH phason are lower for 4FF than for 4HH. For PL phason the frequency is higher for 4FF, although such results are probably caused by superposition with the hereditary Goldstone mode.
By merging the results of electro-optic measurements ( Θ and P s values) and dielectric spectroscopy (dielectric increment Δ ε G and frequency f G of the Goldstone mode), the rotational viscosity γ φ in the SmC * phase can be calculated [43]:
γ φ = P s 2 4 π ε 0 Θ 2 Δ ε G f G ,
The Arrhenius plot of γ φ is presented in the inset in Figure 6d. The activation energy for the switching of molecules obtained from the Arrhenius formula is E φ = 37.1(1.1) kJ/mol for 4HH, lower than E φ = 53.0(2.4) kJ/mol for 4FF and determined previously for even (m = 2, 4, 6) mHF compounds, where E φ = 40–50 kJ/mol [15]. The increase in the energy barrier for compounds fluorosubstituted in the molecular core can be explained by the larger width of molecules and temperature range of the SmC * phase shifted towards lower temperatures, where the intermolecular distances are slightly smaller. Additionally, taking into account the energy barrier E φ and the correlation length ξ of 4HF (4.3–4.8 Å) [15], 4HH and 4FF, one can observe that the larger values of ξ correspond to the smaller value of E φ .

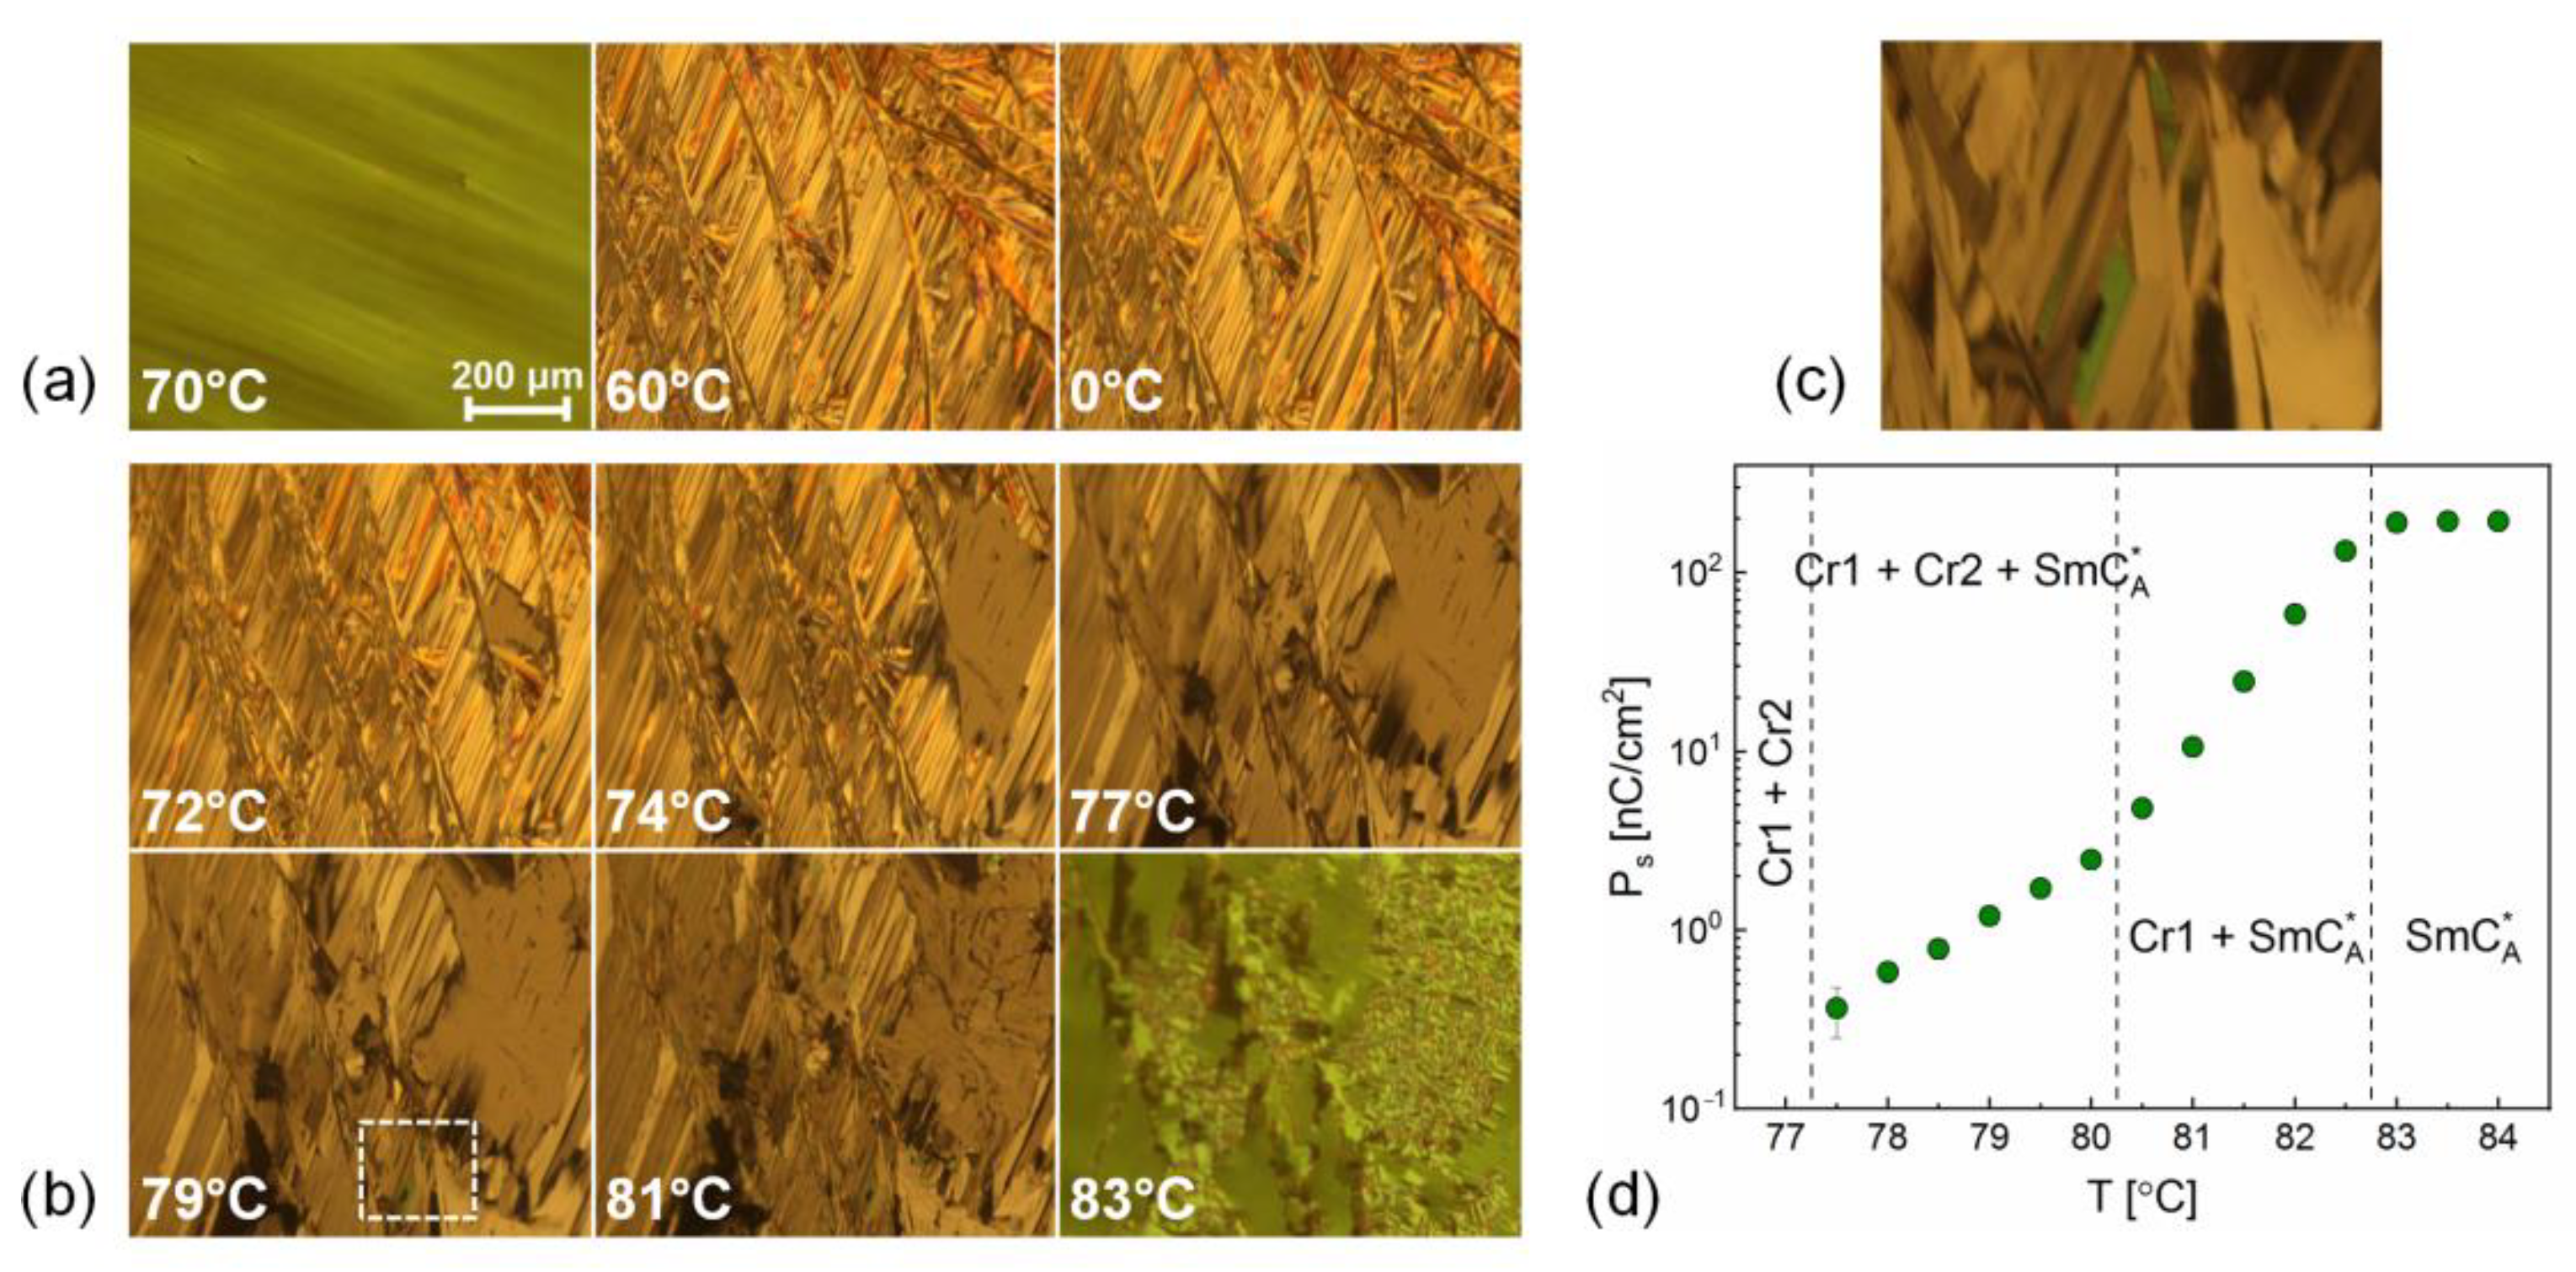
3.2. Crystal Phases of 4HH and 4FF

3.2.1. Characterization of the Crystal Phases of 4HH

  • Sequence of the Crystal Phases
In the solid state, two endothermic anomalies are visible in the DSC curves of 4HH during heating between 50 °C and 80 °C, with onset temperatures of 56.3 °C and 73.4 °C (Figure 3c). For the lowest 3 °C/min rate, the enthalpy changes corresponding to the first and second anomaly are 11.7 kJ/mol and 17.1 kJ/mol, respectively, implying that both anomalies originate from the melting of a crystal. As the heating rate increases, the area ratio of the second and first anomaly decreases. Additionally, a wide exothermic anomaly can be noticed between two endothermic peaks (inset (3) in Figure 3c). Due to its width and apparent overlapping with two endothermic anomalies, it was not possible to determine the corresponding enthalpy change; nonetheless, the shifting of the exothermic anomaly towards higher temperatures with increasing heating rate is noticeable. These results resemble the double or triple melting anomalies observed for polymers [44,45,46,47,48,49], which is usually explained by two crystal phases, the primary one developed on cooling and the secondary one developed on heating. Such situation was also reported for another liquid crystalline compound, with a similar molecular core (based on the biphenyl ring connected with the benzene ring via the -COO- group), where the metastable hexatic SmI A * phase was observed between two crystal phases during heating [50]. Similar explanation can also be applied here, especially after comparison with the POM textures (Figure 2c).
During heating, the texture of the low-temperature Cr2 phase is observed up to 56 °C. The texture registered at 58 °C is identical with the texture of the SmC A * phase obtained on cooling (compare with Figure 2a, 40 °C). However, at further heating, the development of another phase is evident. The shape of the growing domains of the new phase, indicated by arrows in Figure 2c for textures registered at 64 °C and 70 °C, implies the cold crystallization of 4HH to another, high-temperature crystal phase Cr1. At the melting temperature of Cr1, cold crystallization is incomplete, and most of the sample is still in the SmC A * phase, which becomes stable above this temperature. Coming back to the DSC curves, the anomalies during heating between 50 °C and 80 °C can be interpreted as follows: the first endothermic peak at 56.3 °C corresponds to the Cr2 → metastable SmC A * transition. The subsequent wide exothermic anomaly is connected with cold crystallization from the SmC A * to Cr1 phase, and the second endothermic peak at 73.4 °C corresponds to melting of Cr1. For 3–20 °C/min rates, the sample does not transform to the Cr1 phase in the whole volume before it is heated up to the melting temperature of Cr1. The crystallization degree (percentage of a crystal phase in a sample) reached at this temperature decreases with the increasing heating rate, and the amount of the sample which is still in the SmC A * phase does not undergo the phase transition at 73.4 °C and therefore does not contribute to the second endothermic peak. This is why the area of the second endothermic peak decreases in respect to the area of the first endothermic one with the increasing heating rate.
In the XRD pattern of the crystal phase developed on slow cooling (Figure 4a, 0 °C), two low-angle peaks are present, at 2θ = 2.5° and 2.8°. The transition in the solid state of 4HH is visible on heating as the disappearance of the diffraction peak at 2θ = 2.8° between 40 °C and 60 °C (Figure 4c). The patterns registered at 60 °C and 70 °C belong in the single Cr1 phase, as they can be all indexed in a monoclinic crystal system (Table 2). One unit cell contains eight 4HH molecules. The interpretation of the patterns between 0 °C and 40 °C is more complicated. Based on the DSC and POM results, they may belong to Cr2. On the other hand, they contain the peak at 2θ = 2.5°, characteristic for Cr1, which implies the coexistence of two crystal phases. The metastable SmC A * phase, whose presence is suspected on heating between 56 °C and 73 °C, is not observed by XRD supposedly because of the short time of the SmC A * → Cr1 transition. The diffraction pattern typical for the smectic phase is observed on heating at 80 °C (bottom pattern in Figure 5c), which is above the melting temperature of Cr1. In order to prove the presence of the metastable SmC A * phase on heating and to understand better the polymorphism of 4HH in the solid state, the cold crystallization process was investigated.
b.
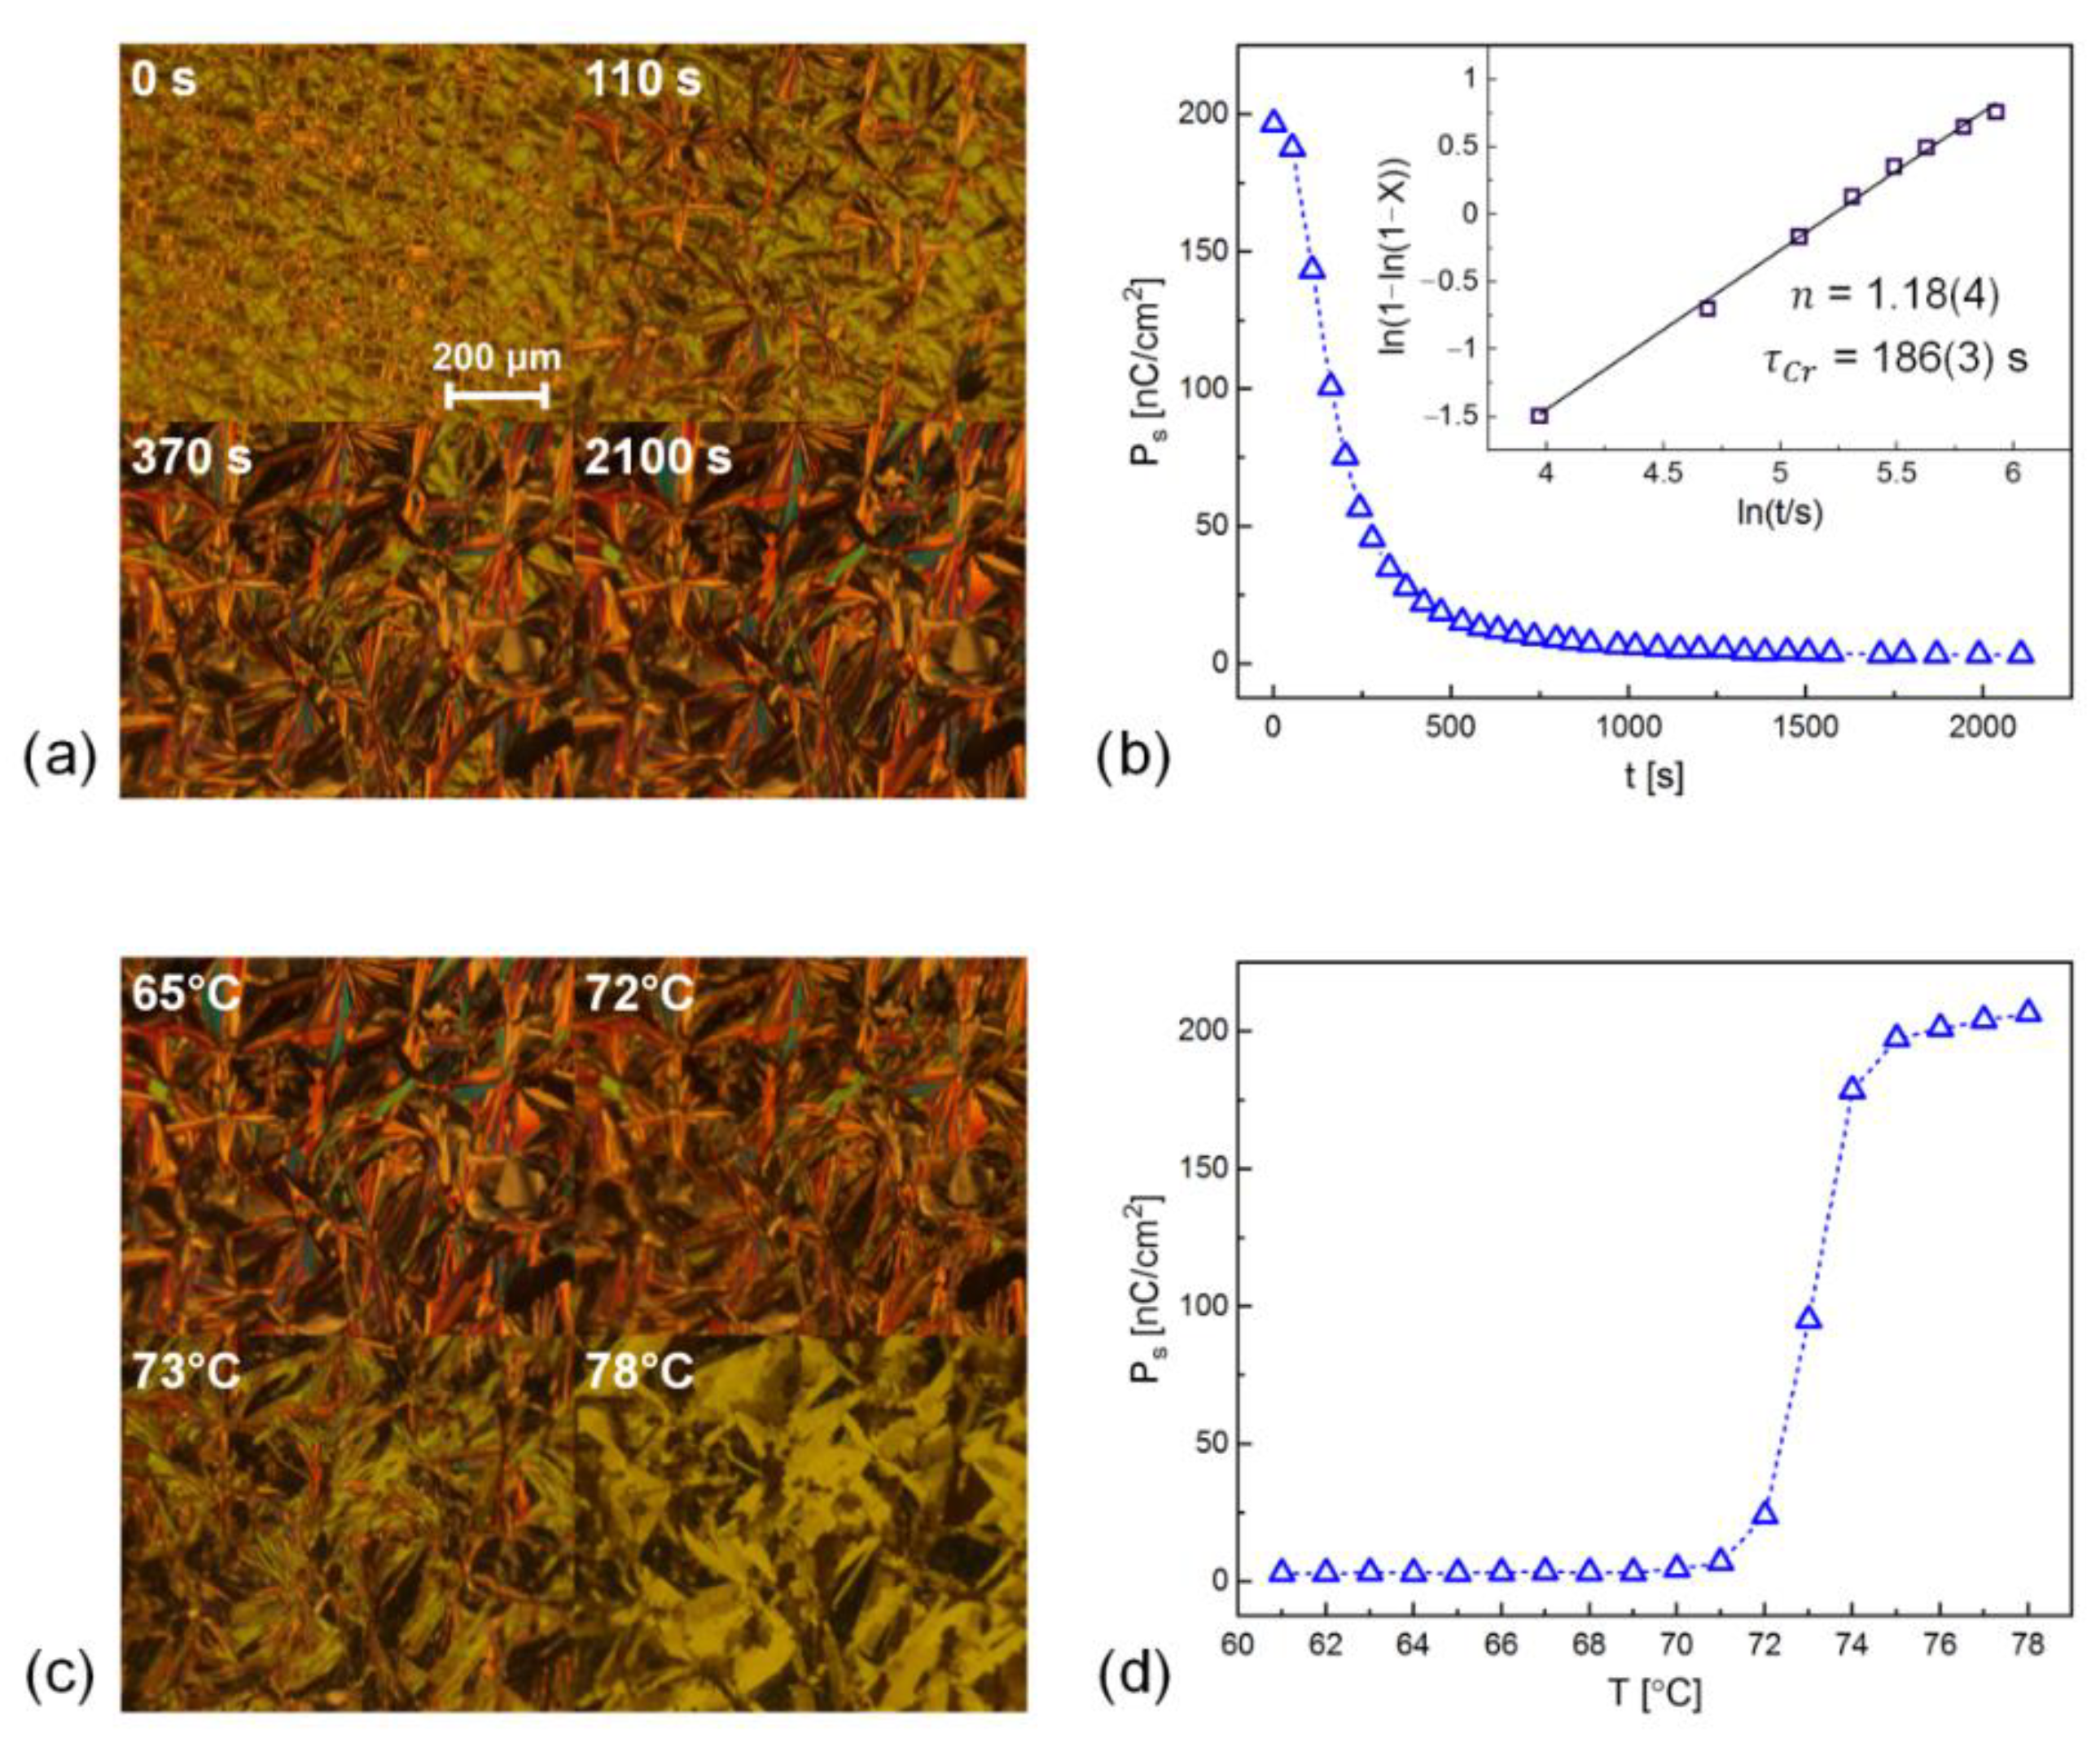
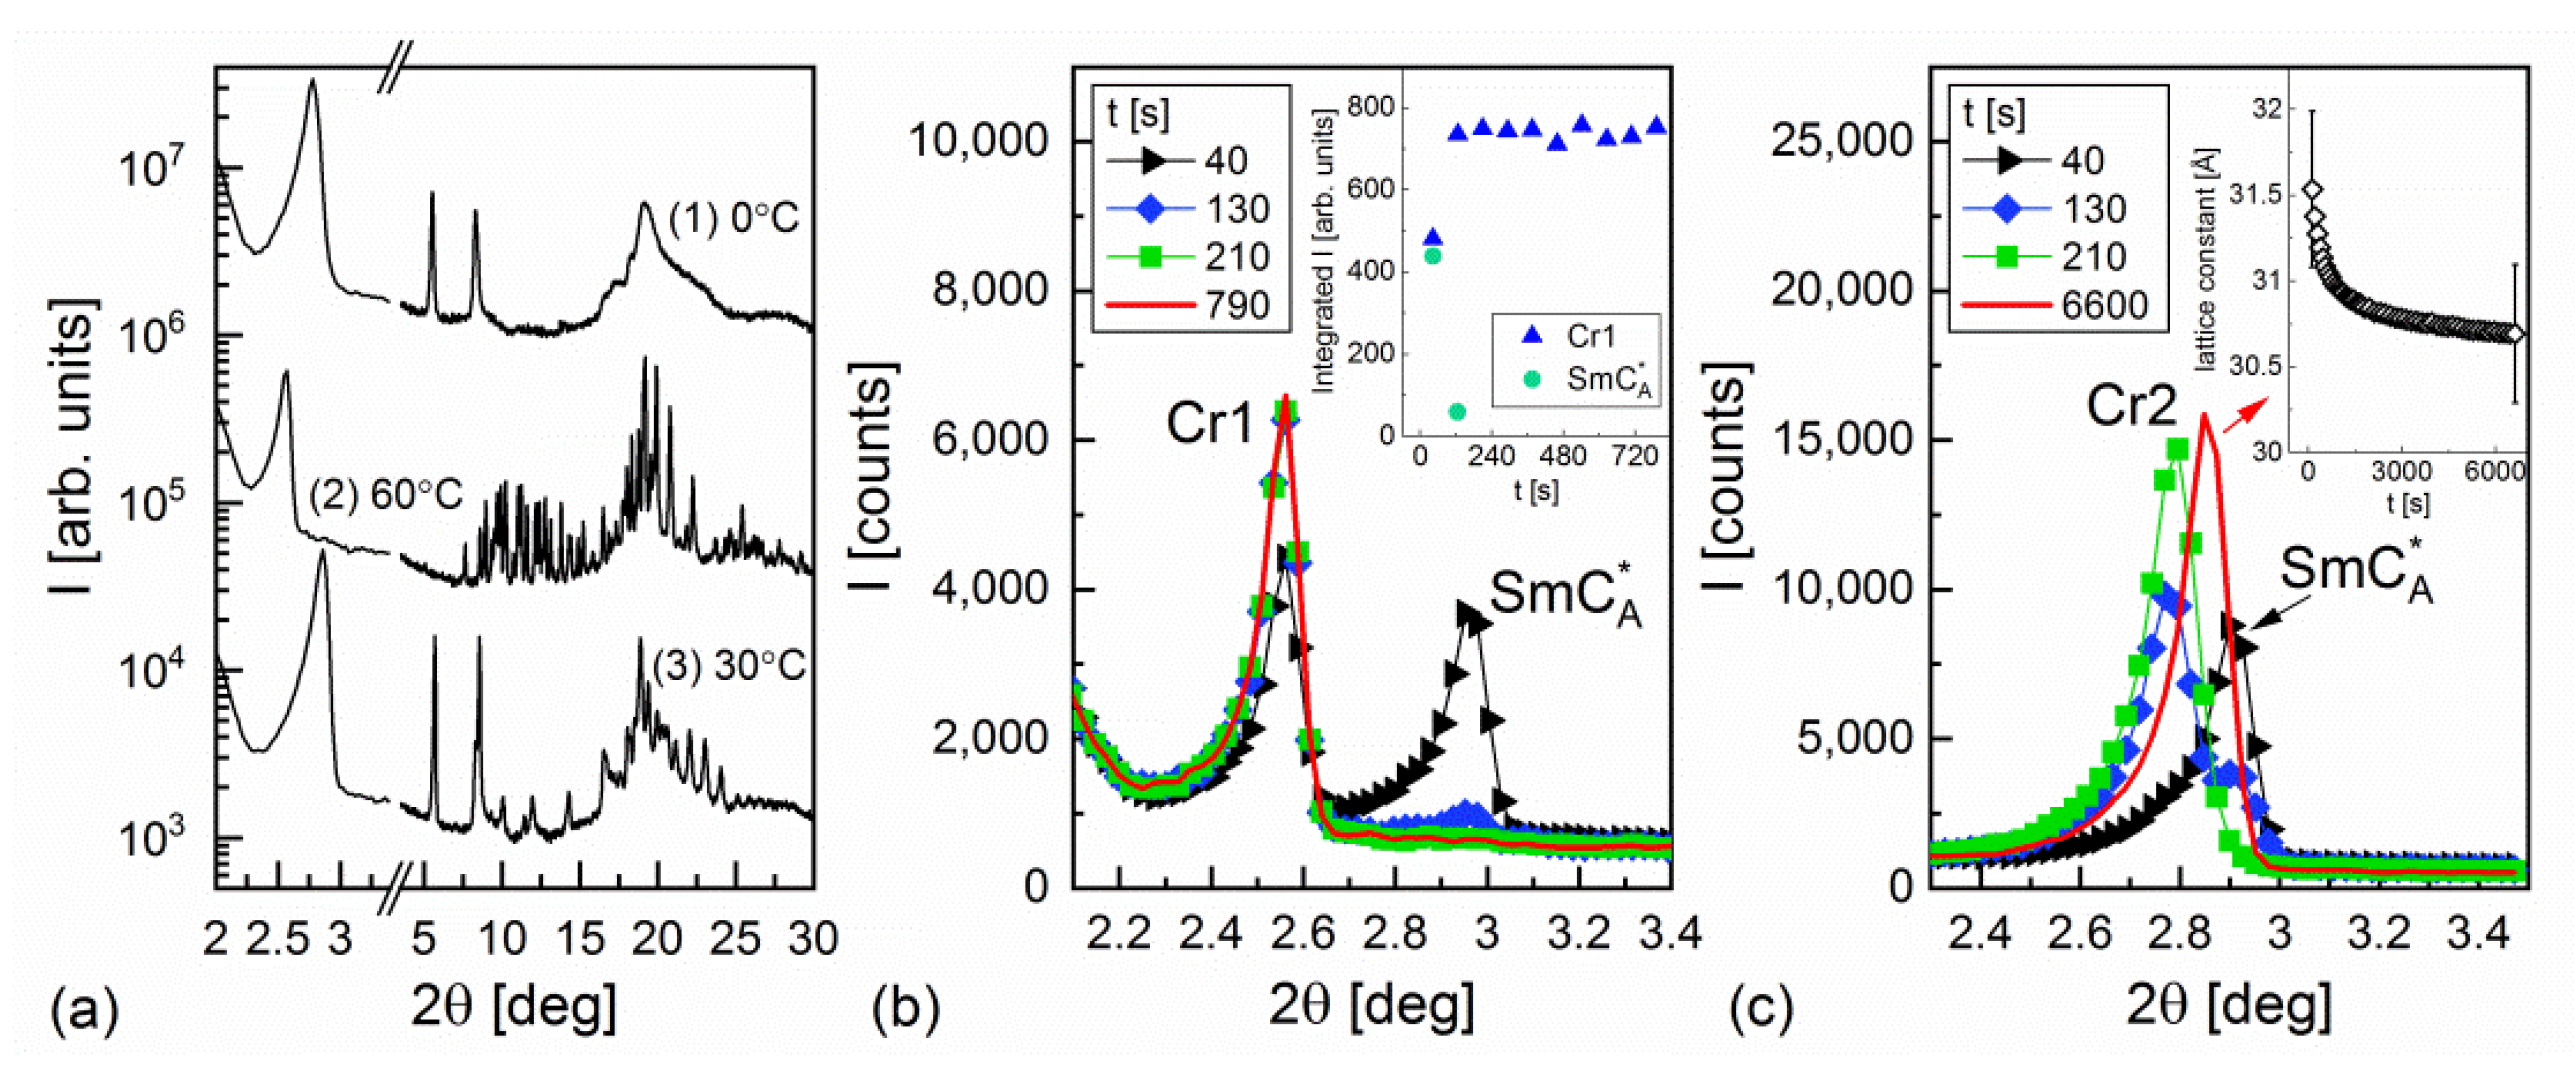
Cold Crystallization of 4HH in 60 °C
The sample was initially heated to isotropic liquid, then cooled to 0 °C with 6 °C/min rate and finally heated to 60 °C with the same rate. After reaching 60 °C, the texture observations and measurement of the spontaneous polarization P s were started (Figure 9a,b). In the texture registered immediately after heating to 60 °C, there is a change of birefringence compared to textures obtained on heating without external field (Figure 2c, 58 °C and 64 °C). The corresponding spontaneous polarization of almost 200 nC/cm2 is close to the P s value obtained in this temperature on cooling, which confirms that the phase observed for 4HH just after heating to 60 °C is SmC A * . The transition to another phase starts shortly after reaching 60 °C. The star-like shape of growing domains is the same as one of those appearing in the textures observed without an electric field (Figure 2c, 70 °C). The development of a new phase leads to decrease in P s with time, which implies that it is a crystal phase. P s decreases eventually to 3 nC/cm2, which arises from the remaining small domains of the SmC A * phase. The sample was kept at 60 °C for 35 min, and subsequently, it was gradually heated to 78 °C (Figure 9c,d). Up to 70 °C, P s fluctuates around 3 nC/cm2. Between 70 °C and 75 °C, a fast increase of P s with increasing temperature is observed, and above 75 °C, it is approximately 200 nC/cm2, as it was previously in the very beginning of cold crystallization at 60 °C. The increase of P s agrees with the melting temperature of Cr1 (73 °C) known from the POM and DSC results. The electro-optic measurements in 60 °C therefore confirm the proposed phase sequence of 4HH on heating: Cr2 → metastable SmC A * → Cr1 → stable SmC A * phase.
The P s ( t ) values obtained in 60 °C vs. time allow us to study the kinetics of the isothermal cold crystallization of 4HH according to the Avrami model [51,52,53], where the crystallization degree X changes with time according to this formula:
X ( t ) = 1 exp ( ( t t 0 τ c r ) n ) ,
where t 0 is the initialization time (in our case t 0 = 0, as crystallization starts almost immediately after heating to 60 °C), τ c r is the characteristic time of crystallization, and n is the Avrami exponent. The parameters of the Avrami model can be obtained by a linear fit to a plot of ln ( 1 ln ( 1 X ) ) vs. ln ( t t 0 ) . The intercept and slope of the fitted line are then equal to n l n τ C r and n , respectively.
The degree of the cold crystallization of 4HH was calculated as
X ( t ) = 1 P s ( t ) P n o r m ,
where P n o r m is the normalization constant. The choice of P n o r m required some consideration. The value of P s immediately after heating to 60 °C, 197 nC/cm2, should be the first choice; however, the corresponding texture (Figure 9a, 0 s) shows that after melting of Cr2, there was not enough time to cause the helix unwinding in the whole sample (areas of the sample when the helix is unwound are seen as thin stripes). Because of that, the spontaneous polarization of 197 nC/cm2 can be underestimated. The P s value at 78 °C, after complete melting of Cr1, is 206 nC/cm2, and the texture in Figure 9c shows that the switching of molecules occurs in the whole observed area. The temperature dependence of P s of 4HH determined on cooling and discussed in the Section 3.1.3 shows that below 100 °C, this parameter increases almost linearly with decreasing temperature. P s obtained on cooling in 78 °C and 60 °C is 258 nC/cm2 and 293 nC/cm2, respectively. The difference between values obtained on heating and cooling arises from the fact that in the former, the planar alignment of the sample is partly disturbed by the preceding crystal phase. Nevertheless, the linear dependence of P s on temperature allows us to estimate from proportion the expected spontaneous polarization in 60 °C on heating as 235 nC/cm2. This value was further used as P n o r m in Equation (4).
The Avrami plot for cold crystallization in 60 °C is presented in the inset in Figure 9b. The linear fit was performed only for the crystallization degree between 0.1 and 0.9, excluding the initial and end stages of crystallization [53,54]. The values of parameters of Equation (3) are τ C r = 186(3) s and n = 1.18(4). The Avrami exponent close to 1 means a low-dimensional growth [53], which corresponds to the crystallites in the form of concentrically arranged needles observed by POM.
Cold crystallization of 4HH was studied also by XRD. The sample was heated to isotropic liquid and cooled down to 0 °C with 6 °C/min rate. After cooling to 0 °C, the XRD pattern was measured without further temperature stabilization. The obtained pattern (Figure 10(a1)) belongs to the weakly crystallized sample. The position of the low-angle peak is 2θ = 2.8°, close to the position of the low-angle peak observed below 40 °C (Figure 4). After 25 min in 0 °C, which was the time necessary for the XRD measurement, the sample was heated with 6 °C/min rate to 60 °C and immediately after that, the repeated collection of patterns in the 2θ = 2–3.5° range was started (Figure 10b). In the first pattern, the diffraction peaks originating both from the SmC A * phase (2θ ≈ 3°) and crystal phase (2θ ≈ 2.6°) are present, and in the second pattern, the former peak disappears almost completely. In subsequent patterns, only the peak at 2θ ≈ 3° is visible, and its intensity does not change with time (inset in Figure 10b). Contrary to the sample in the electro-optic cell, for the sample in a capillary, there is a complete crystallization since the intensity of the peak characteristic for the SmC A * phase decreases to zero. It can be associated with different dimensions of the electrooptic cell with 5 μm thickness and capillary with 0.3 mm (300 μm) diameter, the much larger dimension of the latter probably enables easier crystal growth. After the completion of cold crystallization in 60 °C, the XRD measurement in the wider 2θ range was performed in the same temperature. The obtained pattern (Figure 10(a2)) is identical to the pattern of Cr1 (Figure 4c).
c.
Crystallization of 4HH in 30 °C
Diffraction patterns registered in 30 °C after cooling the sample from isotropic liquid with 6 °C/min rate are presented in Figure 10b. In the first pattern, one peak at 2θ = 2.9° is visible. The distance corresponding with the peak’s position is 30.2(4) Å, which agrees with the smectic layer spacing. In the next pattern, the peak at 2θ = 2.8° from the crystal phase has already larger intensity than the one from the smectic phase, and in the third pattern the crystallization is completed as the peak at 2θ = 2.9° is absent. The time of crystallization after cooling to 30 °C is of the same order as of cold crystallization in 60 °C. Although crystallization lasts only several minutes, the crystal phase evolves slowly with time, which is visible as the continuous shift of the peak at 2θ ≈ 2.8° towards higher angles. The observed evolution of interplanar spacing (inset in Figure 10b) originates likely from the initial strain of the crystal lattice, caused by the co-existence with the smectic phase, which viscosity at 30 °C may be high enough to unable the crystal phase to develop with its equilibrium cell parameters. The phase that develops at 30 °C is not Cr1, whose characteristic peak is located at 2θ = 2.6°; therefore, it is rather the pure Cr2 phase. The diffraction pattern of Cr2 registered in a wider 2θ range after holding the sample for 110 min in 30 °C (Figure 10a) can be indexed in the monoclinic crystal system (Table 2). The unit cell found is large and contains 16 molecules of 4HH. By comparison of XRD patterns in Figure 10(a1,a3), it can be concluded that the latter also belongs to the Cr2 phase, although with much lower crystallinity index.

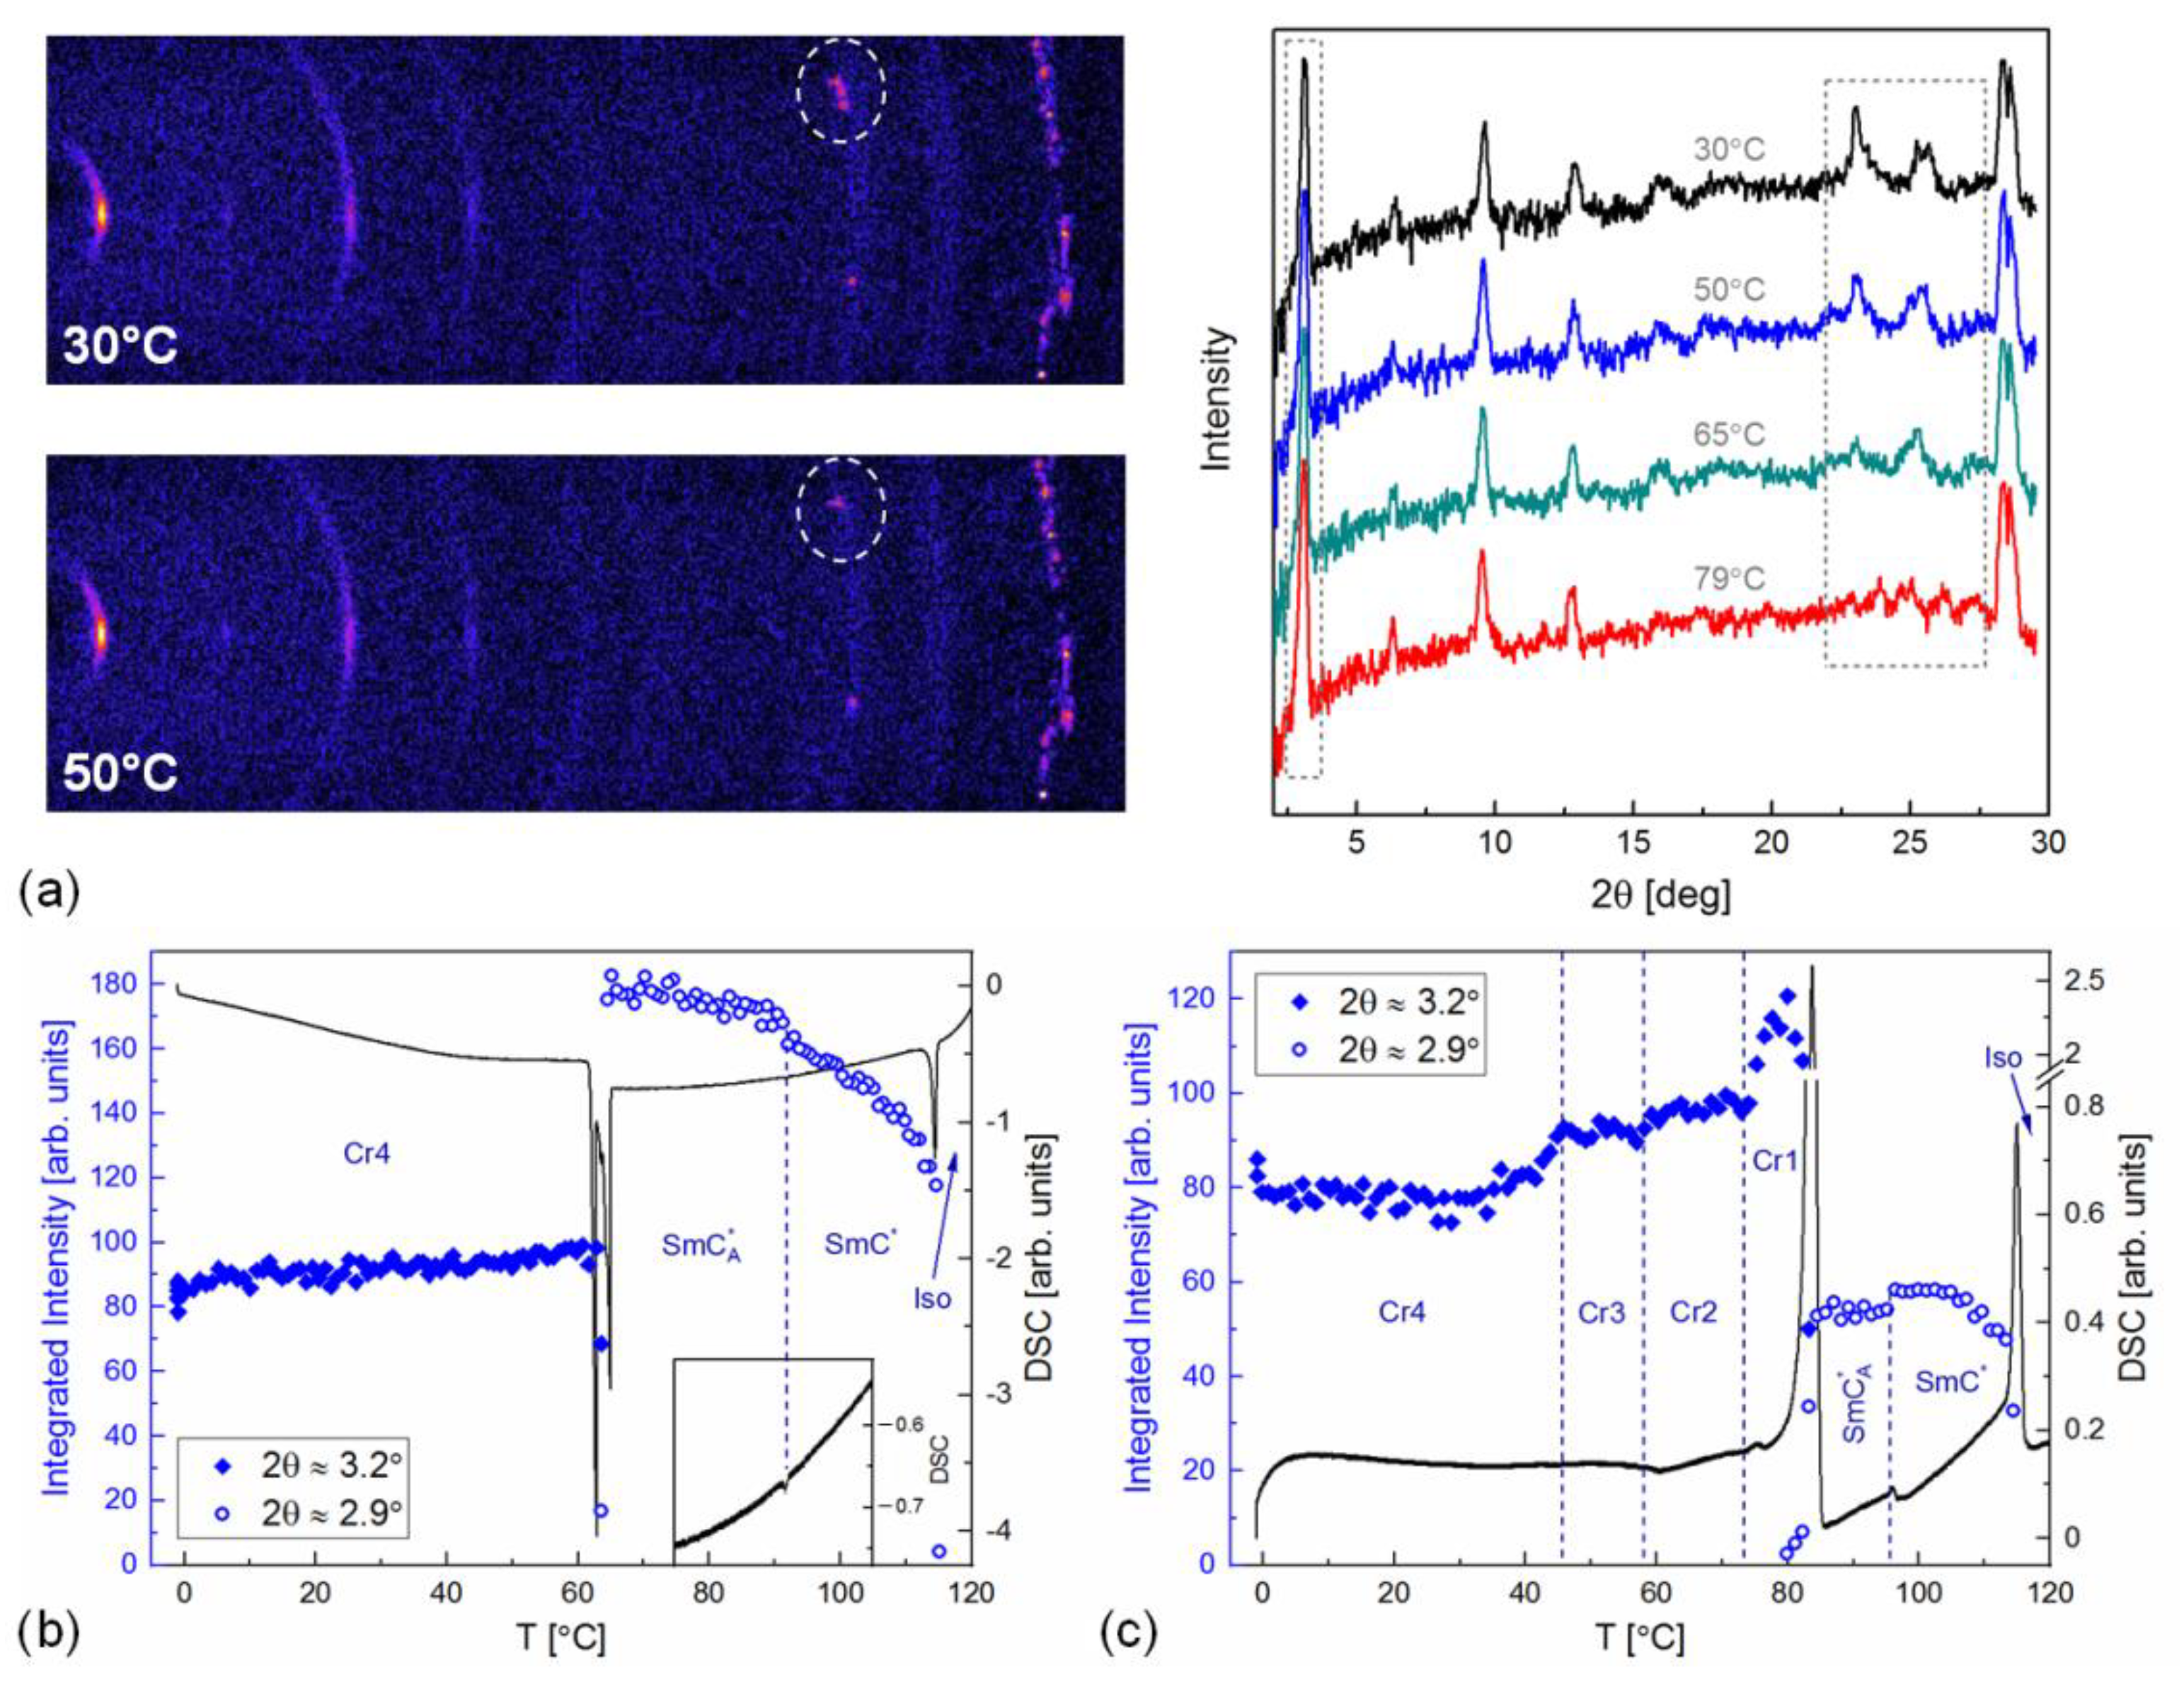
3.2.2. Characterization of the Crystal Phases of 4FF

In the POM textures, no transitions are observed on cooling below the crystallisation temperature (Figure 2b). The first changes in the crystal’s texture are observed during heating, above ca. 57 °C, and they occur gradually over a wide temperature region (Figure 2d). The next, more abrupt change starts at ca. 75 °C, leading to the appearance of an unusual dark texture, shown for 76 °C and 81 °C. In the DSC curves, the transitions within solid state on heating show as small anomalies close to the melting temperature (inset in Figure 3d). Basing on the POM and DSC results, three crystal phases can be distinguished; however, the Cr3 → Cr2 transition temperature obtained by POM is much lower than obtained by DSC. In the XRD patterns of 4FF, the first signs of crystallisation are observed at 80 °C (Figure 4b), where several sharp peaks characteristic for a crystal phase arise. The low-angle peaks characteristic of this crystal phase, denoted as Cr2, are located at 2θ = 2.8° and 2θ = 3.2°. The pattern was indexed in the orthorhombic system (Table 2) and the unit cell contains twenty 4FF molecules. The patterns registered on further cooling to 0 °C and subsequent heating to 40 °C belong also to Cr2. Eventually in 80 °C (Figure 4d), the peak at 2θ = 2.7° is absent, which implies the transition to another crystal phase, named Cr1. At the same time, a peak at 2θ = 2.9° appears. It has the same position as the peak from the lamellar order in smectic phase, which implies that Cr1 and SmC A * coexist in this temperature. Under the assumption that the peak at 2θ = 2.9° belongs to the SmC A * phase, the remaining peaks can be indexed in the orthorhombic crystal system. The unit cell of Cr1 has a much smaller lattice constant a than Cr2 (Table 2) and contains four 4FF molecules. The patterns of Cr2 and Cr1 differ only by the presence of the peak at 2θ = 2.7° in the former and two of lattice constants of these phases, b and c , are almost unchanged at the Cr2 → Cr1 transition. It means that in Cr2 and Cr1, the arrangement of molecules is similar. The overall results imply that polymorphism in the solid state of 4FF depends strongly on experimental conditions. This is why the simultaneous XRD-DSC measurements [26,27] were performed (Figure 11), complemented by the electro-optic measurements during heating for a thin (5 μm thickness) and planarly aligned sample (Figure 12) and dielectric spectroscopy measurements for the thick (80 μm) unaligned sample (Figure 13). In the XRD-DSC method, the sample is in conditions of a constant temperature change (2 °C/min), which facilitates observation of metastable phases. In electro-optic and dielectric measurements, the sample is not constantly cooled or heated; however, the data collection is much faster than in the conventional XRD measurement.
In the XRD-DSC measurement, the Iso → SmC * transition is observed upon cooling at 114 °C as an exothermic anomaly in the DSC curve and appearance of the peak at 2θ = 2.9° (Figure 11b). At the transition to the SmC A * phase at 92 °C, the next small exothermic anomaly in the DSC curve is observed, which is accompanied by a very small step in the temperature dependence of the integrated intensity of the peak at 2θ = 2.9°. Crystallization starts at 65 °C, accompanied by the appearance of the peak at 2θ = 3.2° from a crystal phase and decrease in intensity of the peak at 2θ = 2.9°. The crystallization is a two-step process; in the DSC curves, a double exothermic anomaly is observed, with the onset temperatures at 65 °C and 63 °C. The crystal phase that develops in the XRD-DSC measurement is denoted as Cr4. After further cooling to 0 °C, the sample is still in the Cr4 phase.
Transitions between the crystal phases during heating are visible as small anomalies in the DSC curve as well as in the temperature behaviour of the peak at 2θ = 3.2° and peaks in the 2θ = 25–26° range. The first, Cr4 → Cr3 transition begins at 46 °C, where one of the peaks in the 2θ = 25–26° range decreases in intensity (compare 2D patterns in Figure 11a). At the same time, the intensity of the peak at 2θ = 3.2° increases (Figure 11c). The next, Cr3 → Cr2 transition occurs at 57 °C, where the remaining peaks in the 2θ = 25–26° range also decrease in intensity. Additionally, the Cr4 → Cr3 and Cr3 → Cr2 transitions show in the DSC curves as a wide endothermic and exothermic anomaly, respectively (Figure 11c). The final transition between the crystal phases at 75 °C is marked by a rapid increase in intensity of the peak at 2θ = 3.2° and a sharp endothermic anomaly in the DSC curve. The large endothermic anomaly with the onset at 83 °C is interpreted as the melting to the SmC A * phase. The coexistence of the Cr1 and SmC A * phases is observed between 81 and 83 °C. The phase sequence above the melting temperature is SmC A * (96 °C) SmC * (114 °C) Iso.
The Cr1 and Cr2 phases observed by XRD-DSC are likely the same orthorhombic Cr1 and Cr2 phases observed by conventional XRD, although the strong preferred orientation effect in a flat sample does not allow us to prove it unambiguously. The presence of the third crystal phase was proved by DSC and POM, while the fourth crystal phase could be detected only thanks to fast collection of the XRD patterns in the XRD-DSC measurement. Both Cr3 and Cr4 phases are metastable, as they are detected only during the fast temperature change.
The co-existence of the crystal and SmC A * phase is confirmed by the POM observations in an electric field and P s measurements. The textures of the crystal phase registered in an electric field on cooling down to 0°C (Figure 12a) and heating back to ca. 70 °C (Figure 12b) do not indicate any phase transition in the solid state. The first changes in the texture during heating are observed at 72 °C and interpreted as the Cr2 → Cr1 transition, but at this temperature, P s is still zero. The polarisation peak appears at 77.5 °C, which corresponds to the small domains of the SmC A * phase visible in the texture registered at 79 °C (enlarged part of texture shown in Figure 12c) and still not present at 77 °C. P s increases rapidly from 0.4 nC/cm2 at 77.5 °C to 190 nC/cm2 at 83 °C (Figure 12d). Above 80 °C there is a faster increase of P s   than between 77.5 °C and 80 °C. The texture also changes at ca. 80 °C (compare right sides of textures from 79 °C and 81 °C). These results can be interpreted as the two-step melting. Between 72 °C and 77.5 °C, the sample likely consists of two crystal phases. Cr2 melts at 77.5 °C, leading to the presence of a small amount of the SmC A * phase in the sample and increase of polarization, while Cr1 melts above 80 °C, which leads to further increase in P s   . It confirms that nonzero P s   observed previously on cooling (Figure 6c) is caused by incomplete crystallization, with the domains of the SmC A * phase too small to be noticeable in textures.
Eventually, dielectric spectra for the 80 μm sample were used to study the overall phase sequence of 4FF between 120 °C and 0 °C. Figure 13 shows the temperature dependence of the dielectric absorption at 2.3 kHz and 356 kHz in zero bias field on cooling and subsequent heating. The Iso → SmC * SmC A * → crystal transitions are visible as rapid changes in the absorption at both frequencies. After crystallization, the temperature dependence of ε down to 0 °C is smooth, without any indication of transitions between crystal phases. The ε values in the solid state are the same on cooling and heating up to 62 °C. At further heating, the dielectric absorption of the crystal phase increases monotonically until 73 °C, where a local maximum is observed for 2.3 kHz. In the corresponding spectra (inset in Figure 13b) no processes are explicitly visible at this temperature, therefore the change in the temperature dependence of ε can be attributed to the Cr2 → Cr1 transition. Next, the decrease of ε at 2.3 kHz is visible with the minimum at 77 °C, followed by the rapid increase of absorption, connected with gradual melting to the SmC A * phase. The temperature dependence of ε at 356 kHz is qualitatively similar, although the maximum and minimum of ε are observed at 71 °C and 73 °C, respectively, and they are much less pronounced. The results presented in this section show that differences in the crystal structures of Cr4, Cr3 and Cr2 are very subtle. Only the Cr2 → Cr1 transition is detectable by all presented methods and also by conventional XRD, which means that the structural changes are more significant in this case. However, small corresponding anomalies in the DSC curve imply that the molecular arrangement remains probably similar in all crystal phases and that transitions in the solid state are based mostly on conformational changes.

4. Summary and Conclusions

The properties of two chiral liquid crystalline 4HH and 4FF compounds were compared based on the results of numerous experimental methods. Two F substituents in the molecular core of 4FF were proved to change the phase transition temperatures and some of physical properties in respect to non-fluorosubstituted 4HH:
  • The Iso → SmC * and SmC * SmC A * transition temperatures of 4FF are lower than in 4HH. On the contrary, the fluorosubstitution in the molecular core increases the crystallization and melting temperatures. In 4HH, where the crystallization temperature is decreased compared to 4FF, additional, monotropic SmX A * phase is observed during fast cooling and interpreted as the hexatic SmF A * or SmI A * phase.
  • The double fluorosubstitution leads to lower tilt angle values (43.5° for 4HH and 41° for 4FF), lower spontaneous polarization and higher energy barrier for rotation around the tilt cone, while it has a negligible influence on the switching time. The Goldstone mode in the SmC * phase and the anti-phase PH-phason in the SmC A * phase is slowed down in 4FF compared to 4HH, while for the in-phase PL-phason in the SmC A * phase, the comparison is not unambiguous due to overlapping with the hereditary Goldstone mode.
  • For 4HH, two monoclinic crystal phases are detected, with transition occurring on heating via cold crystallization in the sequence Cr2 → metastable SmC A * → Cr1 → SmC A * . For 4FF, four crystal phases with presumably similar structures are observed: metastable Cr4 and Cr3, detected only for fast cooling and heating of the sample, and stable, orthorhombic Cr2 and Cr1. The transitions between crystal phases of 4FF are also observed only on heating.
We hypothesise that the faster crystallization in 4FF correlates with the lower frequency of the PH process than in 4HH, as such relationship was observed also for other similar compounds [55,56]. Another contribution to crystallization kinetics may be related to the intra-molecular vibrations; therefore, in the next part of this study we plan to analyse the properties of three compounds—4HH and 4FF and mono-fluorosubstituted 4HF with the lowest crystallization and melting point [15] based on the FT-IR spectroscopy.

Supplementary Materials

The following are available online at: https://www.mdpi.com/article/10.3390/cryst12081028/s1. Figures S1–S4: Representative Le Bail fitting results for the crystal phases of 4HH and 4FF.

Author Contributions

Conceptualization: A.D. Investigation: A.D., M.P., M.J.-D., J.K., M.S., T.J.-G. and M.M. Resources: M.U. Writing—original draft preparation: A.D. Writing—review and editing: all authors. Supervision: T.J.-G. and M.M. All authors have read and agreed to the published version of the manuscript.

Funding

Diffractometer Empyrean 2 with the Cryostream 700 Plus was purchased thanks to the financial support of the European Regional Development Fund Operational Program Infrastructure and Environment contract no. POIS 13.01.00-00-062/08. DSC 8000 calorimeter was purchased thanks to the European Regional Development Fund in the framework of the Polish Innovation Economy Operational Program contract no. POIG.02.01.00-12-023/08.

Institutional Review Board Statement

Not applicable.

Informed Consent Statement

Not applicable.

Data Availability Statement

Data available from the authors on request.

Acknowledgments

The authors are indebted to Damian Pociecha (Faculty of Chemistry of the University of Warsaw, Poland) for the XRD measurements on flat samples. We would like to thank Marzena Tykarska (Institute of Chemistry, Military University of Technology, Warsaw, Poland) for discussion regarding the manuscript.

Conflicts of Interest

The authors declare no conflict of interest.

References

  1. Żurowska, M.; Dąbrowski, R.; Dziaduszek, J.; Czupryński, K.; Skrzypek, K.; Filipowicz, M. Synthesis and Mesomorphic Properties of Chiral Esters Comprising Partially Fluorinated Alkoxyalkoxy Terminal Chains and a 1-methylheptyl Chiral Moiety. Mol. Cryst. Liq. Cryst. 2008, 495, 145[497]–157[509]. [Google Scholar] [CrossRef]
  2. Żurowska, M.; Dąbrowski, R.; Dzieduszek, J.; Czupryński, K.; Skrzypek, K.; Filipowicz, M.; Bennis, N.; Otón, J.M. Synthesis and properties of high tilted antiferroelectric esters with partially fluorinated alkoxyalkoxy terminal chains. Opto-Electron. Rev. 2008, 16, 251–256. [Google Scholar] [CrossRef]
  3. Żurowska, M.; Dąbrowski, R.; Dziaduszek, K.; Garbat, K.; Filipowicz, M.; Tykarska, M.; Rejmer, W.; Czupryński, K.; Spadło, A.; Bennis, N.; et al. Influence of alkoxy chain length and fluorosubstitution on mesogenic and spectral properties of high tilted antiferroelectric esters. J. Mater. Chem. 2011, 21, 2144–2153. [Google Scholar] [CrossRef]
  4. Perkowski, P.; Piecek, W.; Raszewski, Z.; Ogrodnik, K.; Rutkowska, J.; Żurowska, M.; Dąbrowski, R.; Kędzierski, J.; Sun, X. New High Frequency Dielectric Mode in Fluorinated Antiferroelecteric Liquid Crystals. Ferroelectrics 2008, 365, 88–94. [Google Scholar] [CrossRef]
  5. Piecek, W.; Perkowski, P.; Raszewski, Z.; Morawiak, P.; Żurowska, M.; Dąbrowski, R.; Czupryński, K. Long Pitch Orthoconic Antiferroelectric Binary Mixture for Display Applications. Mol. Cryst. Liq. Cryst. 2010, 525, 140–152. [Google Scholar] [CrossRef]
  6. D’havé, K.; Rudquist, P.; Lagerwall, S.T.; Pauwels, H.; Drzewiński, W.; Dąbrowski, R. Solution of the dark state problem in antiferroelectric liquid crystal displays. Appl. Phys. Lett. 2000, 76, 3528–3530. [Google Scholar] [CrossRef]
  7. Lagerwall, S.T.; Dahlgren, A.; Jägemalm, P.; Rudquist, P.; D’havé, K.; Pauwels, H.; Dąbrowski, R.; Drzewiński, W. Unique Electro-Optical Properties of Liquid Crystals Designed for Molecular Optics. Adv. Funct. Matter. 2001, 11, 87–94. [Google Scholar] [CrossRef]
  8. Rudquist, P. Smectic LCD modes. In Handbook of Visual Display Technology; Chen, J., Cranton, W., Fihn, M., Eds.; Springer: Berlin/Heidelberg, Germany, 2012. [Google Scholar] [CrossRef]
  9. Chandani, A.D.L.; Ouchi, Y.; Takezoe, H.; Fukuda, A.; Terashima, K.; Furukawa, K.; Kishi, A. Novel Phases Exhibiting Tristable Switching. Jpn. J. Appl. Phys. 1989, 28, L1261–L1264. [Google Scholar] [CrossRef]
  10. Fukuda, A.; Takanishi, Y.; Isozaki, T.; Ishikawa, K.; Takezoe, H. Antiferroelectric chiral smectic liquid crystals. J. Mater. Chem. 1994, 4, 997–1016. [Google Scholar] [CrossRef]
  11. Sokół, E.; Drzewiński, W.; Dziaduszek, J.; Dąbrowski, R.; Bennis, N.; Otón, J. The Synthesis and Properties of Novel Partially Fluorinated Ethers with High Tilted Anticlinic Phase. Ferroelectrics 2006, 343, 41–48. [Google Scholar] [CrossRef]
  12. Stipetic, A.I.; Goodby, J.W.; Hird, M.; Roul, Y.M.; Gleeson, H. High tilt antiferroelectric esters bearing a perfluorobutanoyloxy terminal chain: The influence of lateral fluoro substituents on mesomorphic behaviour, tilt angle, and spontaneous polarization. Liq. Cryst. 2006, 33, 819–828. [Google Scholar] [CrossRef]
  13. Lalik, S.; Deptuch, A.; Fryń, P.; Jaworska-Gołąb, T.; Dardas, D.; Pociecha, D.; Urbańska, M.; Tykarska, M.; Marzec, M. Systematic study of the chiral smectic phases of a fluorinated compound. Liq. Cryst. 2019, 46, 2256–2268. [Google Scholar] [CrossRef]
  14. Deptuch, A.; Jaworska-Gołąb, T.; Marzec, M.; Pociecha, D.; Fitas, J.; Żurowska, M.; Tykarska, M.; Hooper, J. Mesomorphic phase transitions of 3F7HPhF studied by complementary methods. Phase. Trans. 2018, 91, 186–198. [Google Scholar] [CrossRef]
  15. Deptuch, A.; Marzec, M.; Jaworska-Gołąb, T.; Dziurka, M.; Hooper, J.; Srebro-Hooper, M.; Fryń, P.; Fitas, J.; Urbańska, M.; Tykarska, M. Influence of carbon chain length on physical properties of 3FmHPhF homologues. Liq. Cryst. 2019, 46, 2201–2212. [Google Scholar] [CrossRef]
  16. Deptuch, A.; Jasiurkowska-Delaporte, M.; Zając, W.; Juszyńska-Gałązka, E.; Drzewicz, A.; Urbańska, M. Investigation of crystallization kinetics and its relationship with molecular dynamics for chiral fluorinated glassforming smectogen 3F5HPhH6. Phys. Chem. Chem. Phys. 2021, 23, 19795–19810. [Google Scholar] [CrossRef]
  17. Clark, N.A.; Lagerwall, S.T. Submicrosecond bistable electro-optic switching in liquid crystals. Appl. Phys. Lett. 1980, 36, 899–901. [Google Scholar] [CrossRef]
  18. Miyasato, K.; Abe, S.; Takezoe, H.; Fukuda, A.; Kuze, E. Direct Method with Triangular Waves for Measuring Spontaneous Polarization in Ferroelectric Liquid Crystals. Jpn. J. Appl. Phys. 1983, 22, L661–L663. [Google Scholar] [CrossRef]
  19. Raina, K.K.; Ahuja, J.K. Helix Dynamics and Electro-Optic Switching in Ferroelectric Smectic C Liquid Crystals. Mol. Crys. Liq. Crys. 2000, 338, 125–140. [Google Scholar] [CrossRef]
  20. Khosla, S.; Raina, K.K. Switching responses of ferroelectric liquid crystals. Indian J. Pure Appl. Phys. 2004, 42, 49–55. [Google Scholar]
  21. Osiecka, N.; Galewski, Z.; Massalska-Arodź, M. TOApy program for the thermooptical analysis of phase transitions. Thermochim. Acta 2017, 655, 106–111. [Google Scholar] [CrossRef]
  22. Roisnel, T.; Rodriguez-Carvajal, J. WinPLOTR: A Windows Tool for Powder Diffraction Pattern Analysis. Mater. Sci. Forum 2001, 378–381, 118–123. [Google Scholar] [CrossRef] [Green Version]
  23. Rodríguez-Carvajal, J. Recent advances in magnetic structure determination by neutron powder diffraction. Physica B 1993, 192, 55–69. [Google Scholar] [CrossRef]
  24. Altomare, A.; Cuocci, C.; Giacovazzo, C.; Moliterni, A.; Rizzi, R.; Corriero, N.; Falcicchio, A. EXPO2013: A kit of tools for phasing crystal structures from powder data. J. Appl. Cryst. 2013, 46, 1231–1235. [Google Scholar] [CrossRef]
  25. Werner, P.-E.; Erikkson, L.; Westdahl, M. TREOR, a semi-exhaustive trial-and-error powder indexing program for all symmetries. J. Appl. Cryst. 1985, 18, 367–370. [Google Scholar] [CrossRef]
  26. Deptuch, A.; Jaworska-Gołąb, T.; Marzec, M.; Fitas, J.; Nagao, K.; Chruściel, J.; OssowskaChruściel, M.D. Physical properties of 8OS5 thioester studied by complementary methods. Phase Trans. 2017, 90, 765–772. [Google Scholar] [CrossRef]
  27. Arii, T.; Kishi, A.; Kobajashi, Y. A new simultaneous apparatus for X-ray diffractometry and differential scanning calorimetry (XRD-DSC). Thermochim. Acta 1999, 325, 151–156. [Google Scholar] [CrossRef]
  28. Vertogen, G.; de Jeu, W.H. Thermotropic Liquid Crystals: Fundamentals; Springer: Berling/Heidelberg, Germany, 1988. [Google Scholar] [CrossRef]
  29. Mach, P.; Pindak, R.; Levelut, A.-M.; Barois, P.; Nguyen, H.T.; Huang, C.C.; Furenlid, L. Structural Characterization of Various Chiral Smectic-C Phases by Resonant X-ray Scattering. Phys. Rev. Lett. 1998, 81, 1015–1018. [Google Scholar] [CrossRef]
  30. Morawiak, P.; Piecek, W.; Żurowska, M.; Perkowski, P.; Raszewski, Z.; Dąbrowski, R.; Czupryński, K.; Sun, X.W. Effect of fluorination of molecular rigid core in liquid crystal biphenyl benzoate based homologous series. Opto-Electron. Rev. 2009, 17, 40–44. [Google Scholar] [CrossRef]
  31. Morawiak, P.; Żurowska, M.; Piecek, W. A long-pitch orthoconic antiferroelectric mixture modified by isomeric and racemic homostructural dopants. Liq. Cryst. 2018, 45, 1451–1459. [Google Scholar] [CrossRef]
  32. Lalik, S.; Deptuch, A.; Fryń, P.; Jaworska-Gołąb, T.; Węgłowska, D.; Marzec, M. Physical properties of new binary ferroelectric mixture. J. Mol. Liq. 2019, 274, 540–549. [Google Scholar] [CrossRef]
  33. Różycka, A.; Deptuch, A.; Jaworska-Gołąb, T.; Węgłowska, D.; Marzec, M. Evidence of monotropic hexatic tilted smectic phase in the phase sequence of ferroelectric liquid crystal. Phase Trans. 2018, 91, 159–169. [Google Scholar] [CrossRef]
  34. Cole, K.S.; Cole, R.H. Dispersion and Absorption in Dielectrics I. Alternating Current Characteristics. J. Chem. Phys. 1941, 9, 341–351. [Google Scholar] [CrossRef] [Green Version]
  35. Mishra, A.; Dąbrowski, R.; Dhar, R. Dielectric characteristics of highly ionic antiferroelectric liquid crystalline material. J. Mol. Liq. 2018, 249, 106–109. [Google Scholar] [CrossRef]
  36. Strivastava, S.L.; Dhar, R. Characteristic time of ionic conductance and electrode polarization capacitance in some organic liquids by low frequency dielectric spectroscopy. Indian J. Pure Appl. Phys. 1991, 29, 745–751. [Google Scholar]
  37. Haase, W.; Wróbel, S. (Eds.) Relaxation Phenomena: Liquid Crystals, Magnetic Systems, Polymers, High-Tc Superconductors, Metallic Glasses; Springer: Berlin/Heidelberg, Germany, 2003. [Google Scholar] [CrossRef]
  38. Filipič, C.; Carlsson, T.; Levstik, A.; Žekš, B.; Blinc, R. Dielectric properties near the smectic-C*–smectic-A phase transition of some ferroelectric liquid-crystalline systems with a very large spontaneous polarization. Phys. Rev. A 1988, 38, 5833–5839. [Google Scholar] [CrossRef]
  39. Buivydas, M.; Gouda, F.; Andersson, G.; Lagerwall, S.T.; Stebler, B.; Bomelburg, J.; Heppke, G.; Gestblom, B. Collective and non-collective excitations in antiferroelectric and ferrielectric liquid crystals studied by dielectric relaxation spectroscopy and electro-optic measurements. Liq. Cryst. 1997, 23, 723–739. [Google Scholar] [CrossRef]
  40. Panarin, Y.P.; Kalinovskaya, O.; Vij, J.K. The investigation of the relaxation processes in antiferroelectric liquid crystals by broad band dielectric and electro-optic spectroscopy. Liq. Cryst. 1998, 25, 241–252. [Google Scholar] [CrossRef]
  41. Perkowski, P.; Ogrodnik, K.; Żurowska, M.; Piecek, W.; Dąbrowski, R.; Raszewski, Z.; Jaroszewicz, L. Antiferroelectric and ferroelectric SmC* phases in racemic mixture. Phase Trans. 2013, 86, 138–146. [Google Scholar] [CrossRef]
  42. Perkowski, P.; Ogrodnik, K.; Piecek, W.; Żurowska, M.; Raszewski, Z.; Dąbrowski, R.; Jaroszewicz, L. Influence of the bias field on dielectric properties of the SmCA* in the vicinity of the SmC*-SmCA* phase transition. Liq. Cryst. 2011, 38, 1159–1167. [Google Scholar] [CrossRef]
  43. Levstik, A.; Kutnjak, Z.; Filipič, C.; Levstik, I.; Bregar, Z.; Žekš, B.; Carlsson, T. Dielectric method for determining the rotational viscosity in thick samples of ferroelectric chiral smectic-C* liquid crystals. Phys. Rev. A 1990, 42, 2204–2210. [Google Scholar] [CrossRef]
  44. Katerska, B.; Exner, G.; Perez, E.; Krasteva, M.N. Cooling rate effect on the phase transitions in a polymer liquid crystal: DSC and real-time MAXS and WAXD experiments. Eur. Polym. J. 2010, 46, 1623–1632. [Google Scholar] [CrossRef]
  45. Avila-Orta, C.A.; Medellín-Rodríguez, F.J.; Wang, Z.-G.; Navarro-Rodríguez, D.; Hsiao, B.S.; Yeh, F. On the nature of multiple melting in poly(ethylene terephthalate) (PET) and its copolymers with cyclohexylene dimethylene terephthalate (PET/CT). Polymer 2003, 44, 1527–1535. [Google Scholar] [CrossRef]
  46. Medellín-Rodríguez, F.J.; Phillips, P.J.; Lin, J.S.; Avila-Orta, A.C. Triple Melting Behavior of Poly(ethylene terephthalate co-1,4-cyclohexylene dimethylene terephthalate) Random Copolyesters. J. Polym. Sci. B Polym. Phys. 1998, 36, 763–781. [Google Scholar] [CrossRef]
  47. Medellín-Rodríguez, F.J.; Phillips, P.J.; Lin, J.S.; Campos, R. The Triple Melting Behavior of Poly(ethylene terephthalate): Molecular Weight Effects. J. Polym. Sci. B Polym. Phys. 1997, 35, 1757–1774. [Google Scholar] [CrossRef]
  48. Bassett, D.C.; Olley, R.H.; Al Raheil, I.A.M. On crystallization phenomena in PEEK. Polymer 1988, 29, 1745–1754. [Google Scholar] [CrossRef]
  49. Yu, T.; Bu, H.; Hu, J.; Zhang, W.; Gu, Q. The double melting peaks of poly(ethylene terephthalate). Chin. J. Polym. Sci. 1983, 1, 83–91. [Google Scholar]
  50. Kolek, Ł.; Massalska-Arodź, M.; Adrjanowicz, K.; Rozwadowski, T.; Dychtoń, K.; Drajewicz, M.; Kula, P. Molecular dynamics and cold crystallization process in a liquid-crystalline substance with para-, ferro- and antiferro-electric phases as studied by dielectric spectroscopy and scanning calorimetry. J. Mol. Liq. 2020, 297, 111913. [Google Scholar] [CrossRef]
  51. Avrami, M. Kinetics of Phase Change. I General Theory. J. Chem. Phys. 1939, 7, 1103–1112. [Google Scholar] [CrossRef]
  52. Avrami, M. Kinetics of Phase Change. II Transformation-Time Relations for Random Distribution of Nuclei. J. Chem. Phys. 1940, 8, 212–224. [Google Scholar] [CrossRef]
  53. Avramov, I.; Avramova, K.; Rüssel, C. New method to analyze data on overall crystallization kinetics. J. Cryst. Growth. 2005, 285, 394–399. [Google Scholar] [CrossRef]
  54. Cheng, K.; Wan, J.; Liang, K. Differential Thermal Analysis on the Crystallization Kinetics of K2O-B2O3-MgO- Al2O3-SiO2-TiO2-F Glass. J. Am. Ceram. Soc. 1999, 82, 1212–1216. [Google Scholar] [CrossRef]
  55. Deptuch, A.; Drzewicz, A.; Dziurka, M.; Górska, N.; Hooper, J.; Jaworska-Gołąb, T.; Juszyńska-Gałązka, E.; Marzec, M.; Piwowarczyk, M.; Srebro-Hooper, M.; et al. Influence of fluorosubstitution on physical properties of the smectogenic chiral ester. Mater. Res. Bull. 2022, 150, 111756. [Google Scholar] [CrossRef]
  56. Deptuch, A.; Juszyńska-Gałązka, E.; Drzewicz, A.; Urbańska, M. Comparative study of crystallization of two fluorinated chiral liquid crystalline compounds differing by fluorosubstitution of the molecular core. J. Cryst. Growth. 2022, 593, 126771. [Google Scholar] [CrossRef]
Figure 1. Molecular formula of 4HH (X1, X2 = H, H) and 4FF (X1, X2 = F, F) compounds.
Crystals 12 01028 g001
Figure 2. POM textures registered during cooling (a,b) and heating (c,d) at 6 °C/min rate for 4HH (a,c) and 4FF (b,d).
Crystals 12 01028 g002
Figure 3. DSC curves registered during cooling (a,b) and heating (c,d) with 3–20 °C/min rates for 4HH (a,c) and 4FF (b,d). The legends in (a,b) apply also to panels (c,d).
Crystals 12 01028 g003
Figure 4. XRD patterns collected on cooling (a,b) and heating (c,d) for 4HH (a,c) and 4FF (b,d).
Crystals 12 01028 g004
Figure 5. Analysis in TOApy [21] using ‘rgb’ algorithm of POM results for 4HH (cooling, 6 °C/min). Representative textures are shown as well.
Crystals 12 01028 g005
Figure 6. Physical properties of the smectic phases of 4HH (circles) and 4FF (triangles): temperature dependence of the smectic layer spacing D and integrated intensity of the low-angle diffraction peak at 2θ ≈ 3.0° (a), correlation length ξ within the smectic layers (b), tilt angle Θ of molecules and spontaneous polarization P s (c) as well as switching time τ s w (d) and rotational viscosity γ φ (inset in (d)). All results were obtained on cooling. Left and right vertical axes in (a,c) apply to the data denoted with open and solid symbols, respectively.
Crystals 12 01028 g006
Figure 7. Dielectric absorption in the SmC * (a,b) and SmC A * (c,d) phases of 4HH (a,c) and 4FF (b,d) without and with the external bias field applied.
Crystals 12 01028 g007
Figure 8. Relaxation processes of 4HH and 4FF observed in the SmC * and SmC A * phases: Cole–Cole plots of FM (a) and AFM1, AFM2, AFM3 processes (b) with fitting results of Equation (1), dielectric increment (c) and relaxation time (d) of these processes vs. temperature, and dielectric increment (e) and relaxation time (f) of relaxation processes vs. bias field, for temperatures presented in Figure 7. The legend in (e) applies to panels (cf).
Crystals 12 01028 g008
Figure 9. Textures (a,c) and spontaneous polarization (b,d) of 4HH registered during cold crystallization in 60 °C vs. time (a,b) and on subsequent heating to 78 °C (c,d). The dashed lines are a guide to eye. Inset in (b) is the Avrami plot of crystallization degree X ( t ) calculated according to Equation (4) with a linear fit and obtained n and τ C r values.
Crystals 12 01028 g009
Figure 10. XRD patterns of 4HH registered (a) after cooling from the isotropic liquid down to 0 °C at the rate of 6°C/min (1), after completing isothermal cold crystallization at 60 °C (2) and after isothermal crystallization at 30 °C (3), (b) during cold crystallization at 60 °C (integrated intensities vs. time of diffraction peaks originating from the Cr1 and SmC A * phases shown in the inset), (c) during isothermal crystallization at 30 °C (the time evolution of the interplanar spacing in Cr2 obtained from the position of the peak at 2θ ≈ 2.8° is shown in the inset).
Crystals 12 01028 g010
Figure 11. Results of the simultaneous XRD-DSC measurement for 4FF: representative XRD patterns obtained during heating (a) and the integrated intensity of the peaks at 2θ ≈ 3.2° and 2θ ≈ 2.9° compared with the DSC curve on cooling (b) and heating (c). The double peak at 2θ ≈ 28° originates from the aluminium crucible.
Crystals 12 01028 g011
Figure 12. Textures of 4FF in an external electric field registered on cooling (a) and heating (b), enlarged part of the texture registered at 79 °C on heating showing the small domains of the SmC A * phase (c) and spontaneous polarization vs. temperature on heating in the vicinity of the melting of a crystal phase (d).
Crystals 12 01028 g012
Figure 13. Imaginary part of the dielectric permittivity at chosen frequencies vs. temperature on cooling (a) and heating (b) for the thick (80 μm) sample of 4FF. The inset in (b) shows the absorption part close to the melting temperature and vertical lines denote frequencies chosen in the main panels.
Crystals 12 01028 g013
Table 1. Phase transition temperatures (obtained from the linear extrapolation of the onset temperatures to 0 °C/min rate) and the corresponding energy effects for 4HH and 4FF.
Transition T D S C   [ K ] Δ H   [ kJ / mol ] Δ S   [ J / ( mol · K ) ]
4HH Iso     SmC * 130.4−6.14−15.3
cooling SmC *     SmC A * 104.8−0.04−0.09
SmC A *     SmX A * 28.3−1.46−4.86
SmX A * → Cr226.0−11.1−37.2
4HH Cr 2     SmC A * 56.311.7 b35.5
heating Cr 1     SmC A *   a73.417.1 b49.3
SmC A *     SmC * 108.30.050.12
SmC * → Iso129.66.3315.7
4FF Iso     SmC * 115.7−5.41−13.9
cooling SmC *     SmC A * 92.8−0.04−0.10
SmC A * → Cr359.6−27.0−83.2
4FFCr3 → Cr273
heatingCr2 → Cr175
Cr 1     SmC A * 82.525.972.3
SmC A *     SmC * 94.80.040.10
SmC * → Iso114.65.6114.4
a Cr2 → Cr1 transition occurs via melting of Cr2 to the metastable SmC A * phase and cold crystallization to Cr1; crystallization starts shortly after melting of Cr2; b values for 3 °C/min rate.
Table 2. Unit cell parameters of the crystal phases of 4HH and 4FF ( α = γ = 90°). The representative Le Bail fitting results are presented in the Supplementary Materials.
PhaseT [°C] a [Å] b [Å] c [Å] β [deg] Z
4HH
cooling
Cr23031.29(2)22.86(2)21.63(2)98.49(2)16
4HHCr16035.274(8)10.767(2)20.020(3)99.96(2)8
heating 7035.213(9)10.807(2)20.052(3)100.29(2)
4FFCr26031.68(2)54.62(2)10.112(3)9020
cooling 4031.747(5)54.54(2)10.064(2)
2031.737(5)54.44(2)10.007(2)
032.016(6)54.36(2)9.936(2)
4FFCr22031.741(5)54.47(2)10.012(2)9020
heating 4031.745(5)54.54(2)10.061(2)
6031.69(2)54.61(2)10.112(3)
Cr1806.820(9)54.94(2)10.161(3)904
Publisher’s Note: MDPI stays neutral with regard to jurisdictional claims in published maps and institutional affiliations.

