1. Introduction
Recent advances in the internet of things (IoT) have stimulated the quick development of self-powered sensor nodes with characteristics of low power consumption [
1,
2]. Due to their disadvantages, such as limited lifespan, complicated maintenance, and environmental unfriendliness of battery materials, the conventional power supply technologies based on electrochemical batteries will not be promising way to sustainable development. This is why more and more research is focusing on energy harvesting systems as self-sustained power sources, by harvesting and transforming ambient energy into electricity, in order to realize the self-autonomous sensors [
3,
4].
The surrounding energy can be funded in different forms: in mechanical, thermal, and electromagnetic forms. Even though electromagnetic energy, especially solar radiation, represents a vast energy reservoir, mechanical energy sources are also largely presented in our daily life (such as vibrations, shocks, flows, etc.) and electromechanical conversion presents a definite advantage in dark or inaccessible environments, such as in some aeronautical, automotive, and underground applications. Extracting part of this energy from the ambient environment is particularly interesting at small-scales, because the system of reduced energy recovery could be directly integrated into the microsystem devices to make them semi-autonomous or autonomous. However, this energy must have two distinguishing features: (1) the abundance of its sources; (2) an environmentally friendly nature, meaning no nuisance or greenhouse gases will be generated during electricity production. In addition, the mechanical energy has a highly appreciable asset: it can be produced at the place of consumption, so there is no remote energy transfer, or loss due to the transfer. The conversion of mechanical energy into electrical energy can be realized via the piezoelectric properties of some materials, i.e., their ability to generate electricity when mechanical stress is applied to them.
Nowadays, the study and application of piezoelectric nanowires (NWs) attracts a lot of attention because of their interesting properties due to their small size. The advantage of using NWs for energy harvesting is not only related to their small size, which allows the reduction in the device size, but also to their sensitivity to the least mechanical stimulations.
In 2006, Z.L. Wang’s research group at Georgia Tech (USA) demonstrated, for the first time, a piezoelectric nanogenerator based on ZnO NWs by recovering the mechanical energy to electricity [
5]. The obtained results were very encouraging and created a desire, in researchers and specialists worldwide to develop this field for more than a decade. As a result, ZnO NWs have become one of the most popular materials for designing various NGs, due to their piezoelectric characteristics and biocompatibility, as well as their low-cost synthesis processes, with easy morphology control [
6,
7,
8,
9].
NGs based on piezoelectric NWs can be classified into two broad categories: NGs based on vertically oriented NWs (VINGs) [
4,
10], and NGs based on lateral NWs (LINGs) [
4,
11,
12]. In general, in the case of the VINGs, the piezoelectric nanowires are intentionally synthesized vertically, on a conductive substrate, and the device is completed by an upper electrode. In the case of the LINGs, piezoelectric NWs are first transferred from growth substrates to a receiver substrate, and then fabrication of metallic contacts is undertaken, to ensure that the piezo potential can be coupled to an external load, when actuated by a bending moment [
13]. Owing to the relative ease of fabrication and apparent effectiveness, vertically integrated nanogenerators (VINGs) are among the most extensively exploited structures in this field.
In this work, we demonstrated the characteristics of a VING: the NG was based on the vertical ZnO nanowire arrays grown on gold-coated silicon substrate. The energy harvesting tests were carried out both in compression mode at low frequency, and in vibrational mode, at a frequency range from 50 Hz to 3 kHz; the choice of frequency range was based on the aeronautic applications, by considering the different airplane vibrations.
2. Materials and Methods
2.1. ZnO Nanowire Synthesis
As part of this work, we used the hydrothermal method for the synthesis of ZnO nanowires. This is a low-cost, low-temperature method, consisting of two main phases. The first phase was the nucleation phase, which can be described in several steps:
Firstly, a metallized silicon substrate (Si/Pt or Si/Au) having a size of 1 cm × 1 cm was placed in an ultrasonic bath, containing a surfactant solution, for 10 min. Then, it was rinsed with distilled (DI) water (milli-Q quality, R > 18 MΩ), followed by drying with a hot air flow, followed by an annealing in the oven at 200 °C for 10 min, in order to remove any solvent residues from the substrate. Finally, the substrate was put in a plasma cleaner for 10 min, for a perfectly-cleaned surface.
Then, the buffer layer was prepared with dehydrated zinc acetate (ZnAc
2·2H
2O, VWR Norma Pur Analytical Reagent 99%) in solution, in absolute ethanol (EtOH
abs, VWR AnalaR Norma Pur 99.9%) at 0.01 M. The buffer layer deposition was carried out with the dip-coating method. To do this, we immersed the substrate vertically in a bath containing the buffer layer solution, and then removed it at a controlled rate. Finally, the substrate covered with the buffer layer was placed in an oven at 350 °C for 20 min. under ambient atmosphere. The ethanol evaporated and the zinc acetate decomposed, to create the ZnO-nanocrystallitesto form the nucleation sites. The equation below explains the decomposition process of zinc acetate, to form ZnO seeds, according to the reaction shown in Equation (1).
For a hydrothermal growth process, zinc nitrate (Zn(NO3)2, Sigma-Aldrich ACS Reagent 98%) and hexamethylenetetramine (HMTA) (C6H12N4, Sigma-Aldrich ACS Reagent 99%) were used for ZnO nanowires growth. The growth solution was prepared from two separate solutions: one of 50 mM Zn(NO3)2, and another of 25 mM HMTA. Then both solutions, in equal volumes, were mixed at room temperature, to obtain the growth solution, with concentrations of 25 mM for Zn(NO3)2 and 12.5 mM for HMTA.
The substrate with the buffer layer was then immersed face down, in a Teflon bottle containing the growth solution, which had been preheated to 90 °C in a conventional oven. The different chemical reactions that take place during the process of ZnO nanowire growth can be described by the following equations [
9,
14]:
Although the exact function of HMTA during the growth of ZnO nanowires is not yet fully understood, it is generally considered a weak base, which will be slowly hydrolyzed in water, to progressively produce
. This step is important in the synthesis process of ZnO nanowires, because if the HMTA hydrolyzes too rapidly and produces too much
in a short time, the Zn
2+ ions in the solution will precipitate too quickly, by forming Zn(OH)
2. This precipitation will lead to quick consumption of the Zn
2+ ions, which will reduce the nanowire growth kinetic. That is why we chose the 2:1 ratio between zinc nitrate and HMTA, instead of equimolar, which can often be seen in the literature [
15,
16].
After the growth of the ZnO nanowires, the substrate was rinsed by DI water, to remove the possible residues from the intermediate reactions, and was then dried in an oven at 80 °C for 15 min. The morphology of ZnO NWs was characterized using a scanning electron microscope (FEG–SEM, NEON 40 ZEISS, Oberkochen, Germany), operating at 10 kV accelerating voltage.
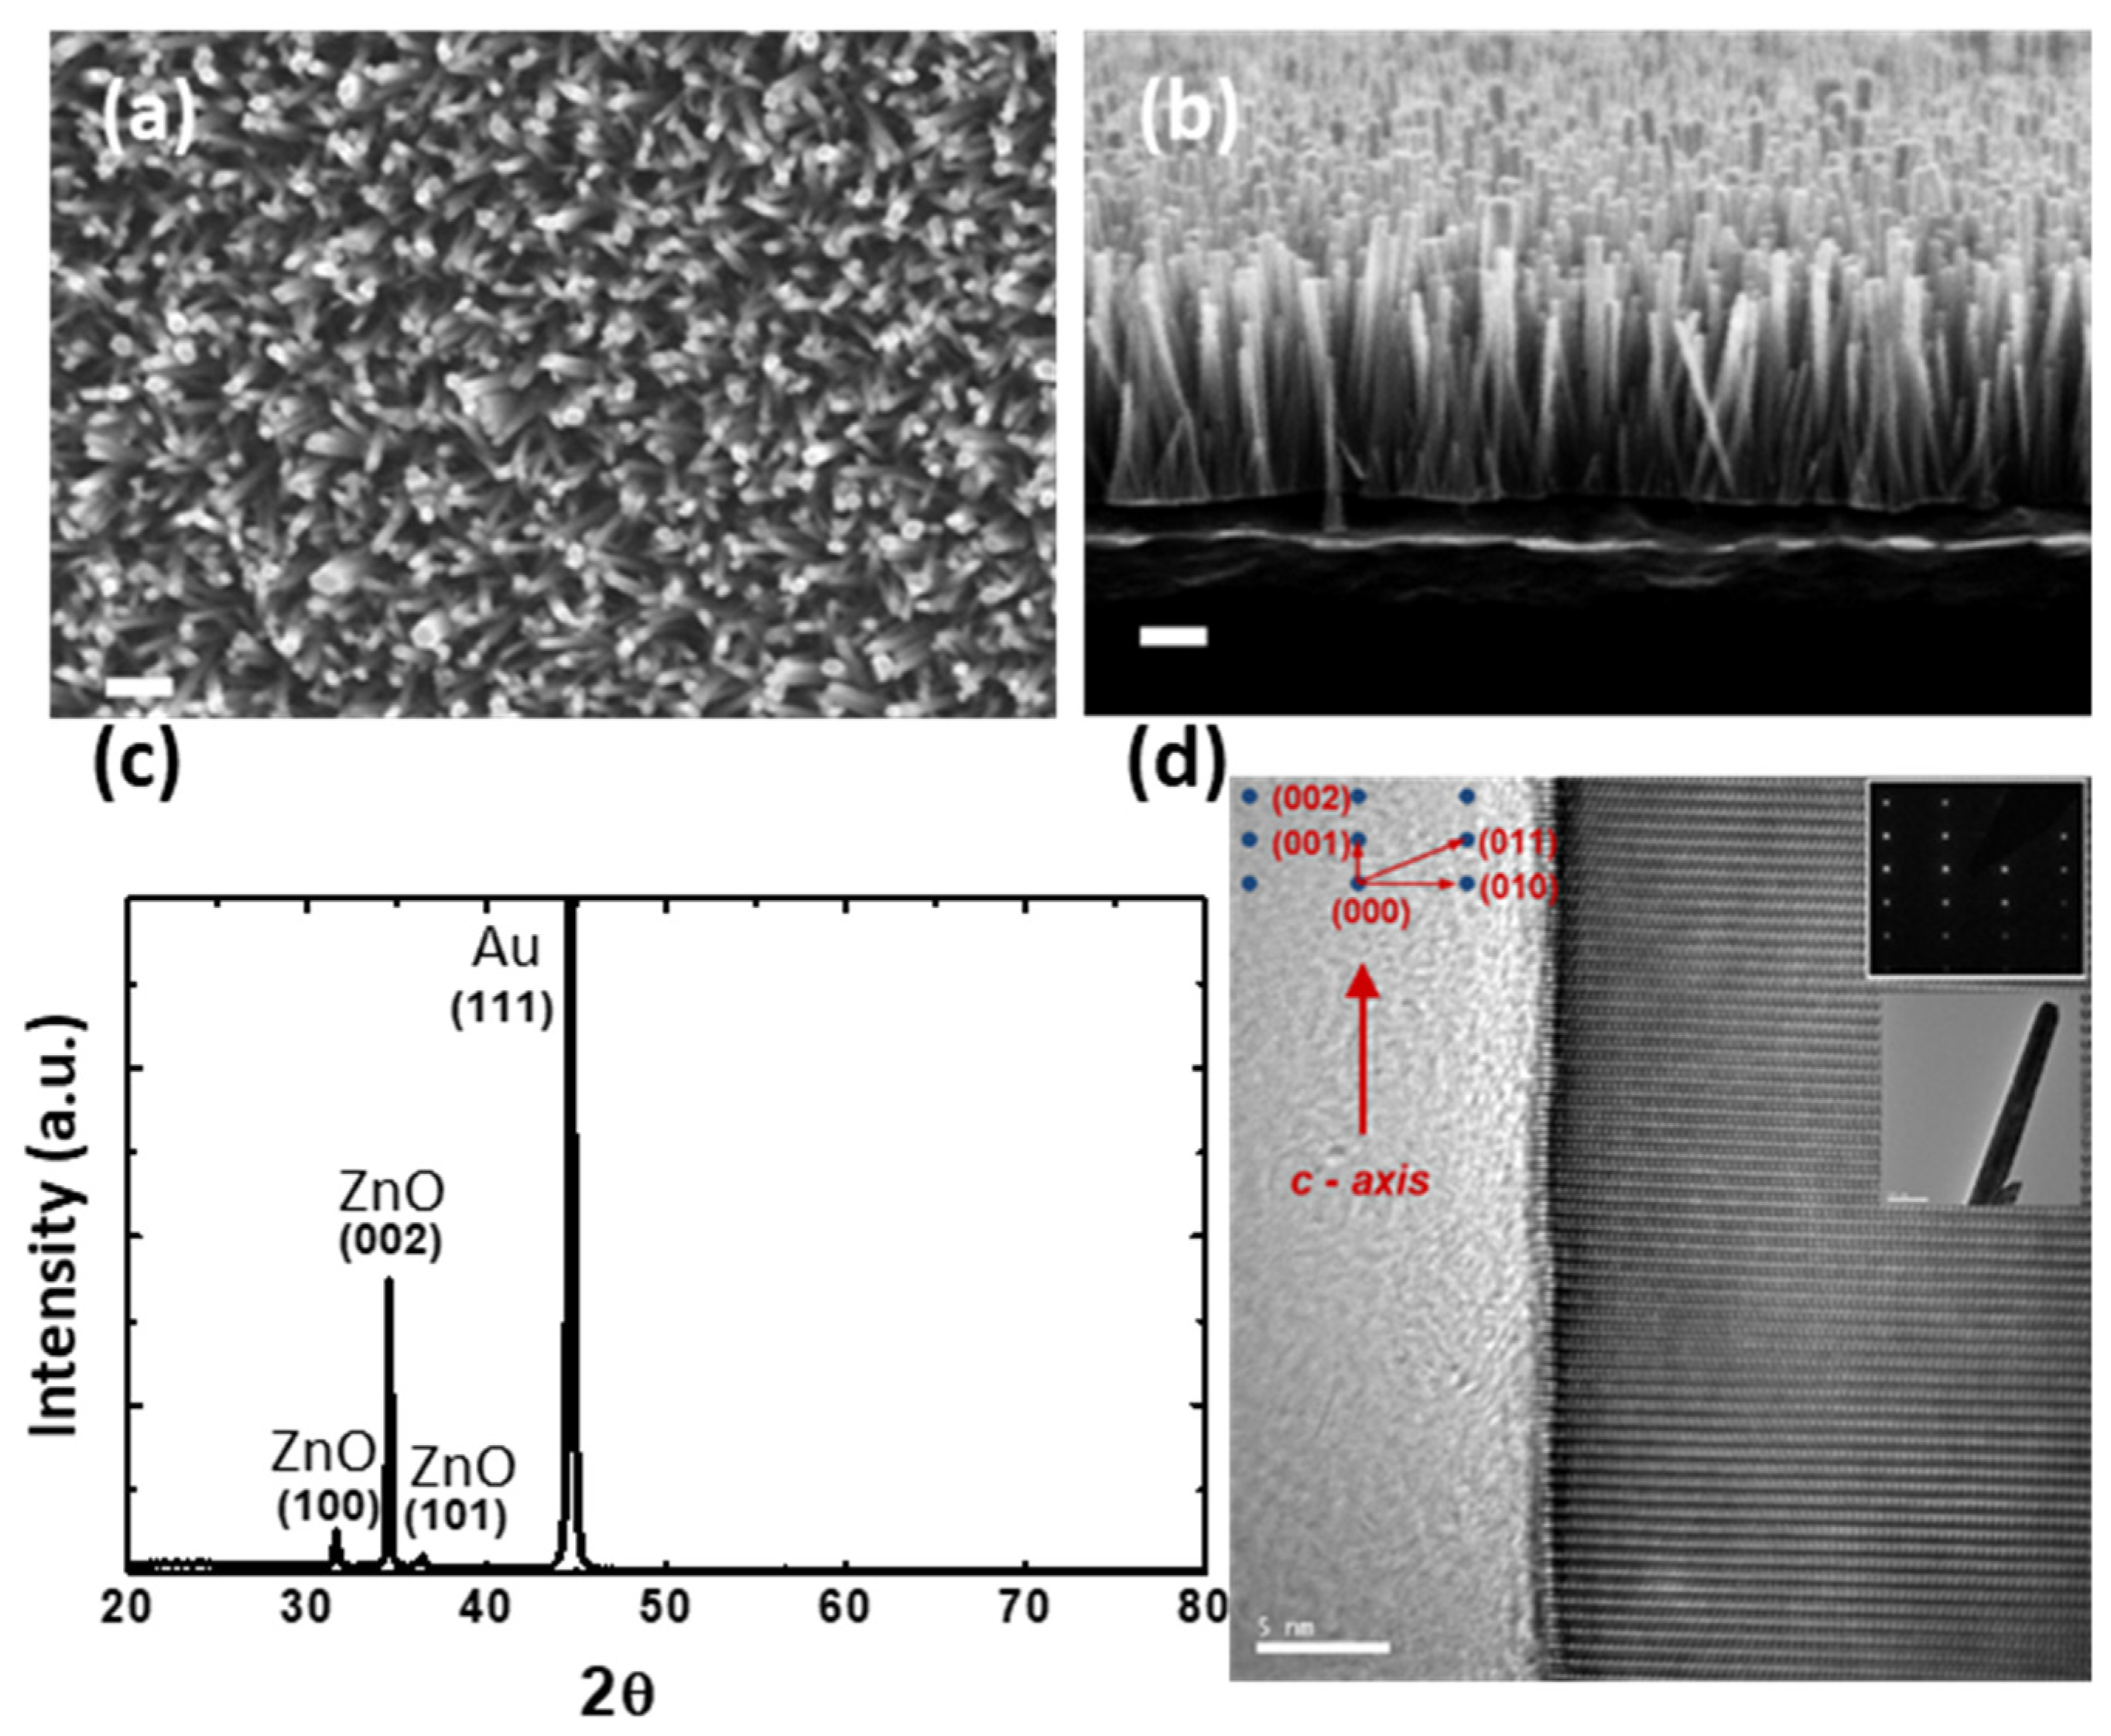
Figure 1a,b shows both planar- and cross-section-view SEM images, from one of our samples exhibiting a typical morphology of our samples: a homogeneous ZnO nanowire array, in which the diameter varies between 35 and 40 nm and the length of the nanowires is approximately 0.9 μm (for 2-h growth time).
The X-ray diffraction (XRD) analysis was performed on a PANalytical X’Pert PRO MPD diffractometer (Almelo, The Netherlands) using Co Kα radiation (λ = 0.17890 nm) in θ-2θ configuration, equipped with a diffracted beam monochromator.
Figure 1c shows a typical XRD pattern of a sample of ZnO nanowires on a gilded silicon substrate. We can clearly identify that the synthesized nanowires crystallized according to the compact hexagonal phase B4 (Würtzite type), with a preferential growth towards the
c-axis. The high-resolution transmission electron microscopy (HRTEM) observation, performed on a FEI TECNAI G
2 F20 operating at 200 kV (Hillsboro, OR, USA), confirms this preferential directional growth and shows excellent monocrystallinity of our nanowires, obtained from an easy, and low-cost, hydrothermal method (
Figure 1d).
2.2. ZnO-Nanowire-Based Nanogenerator Device Fabrication
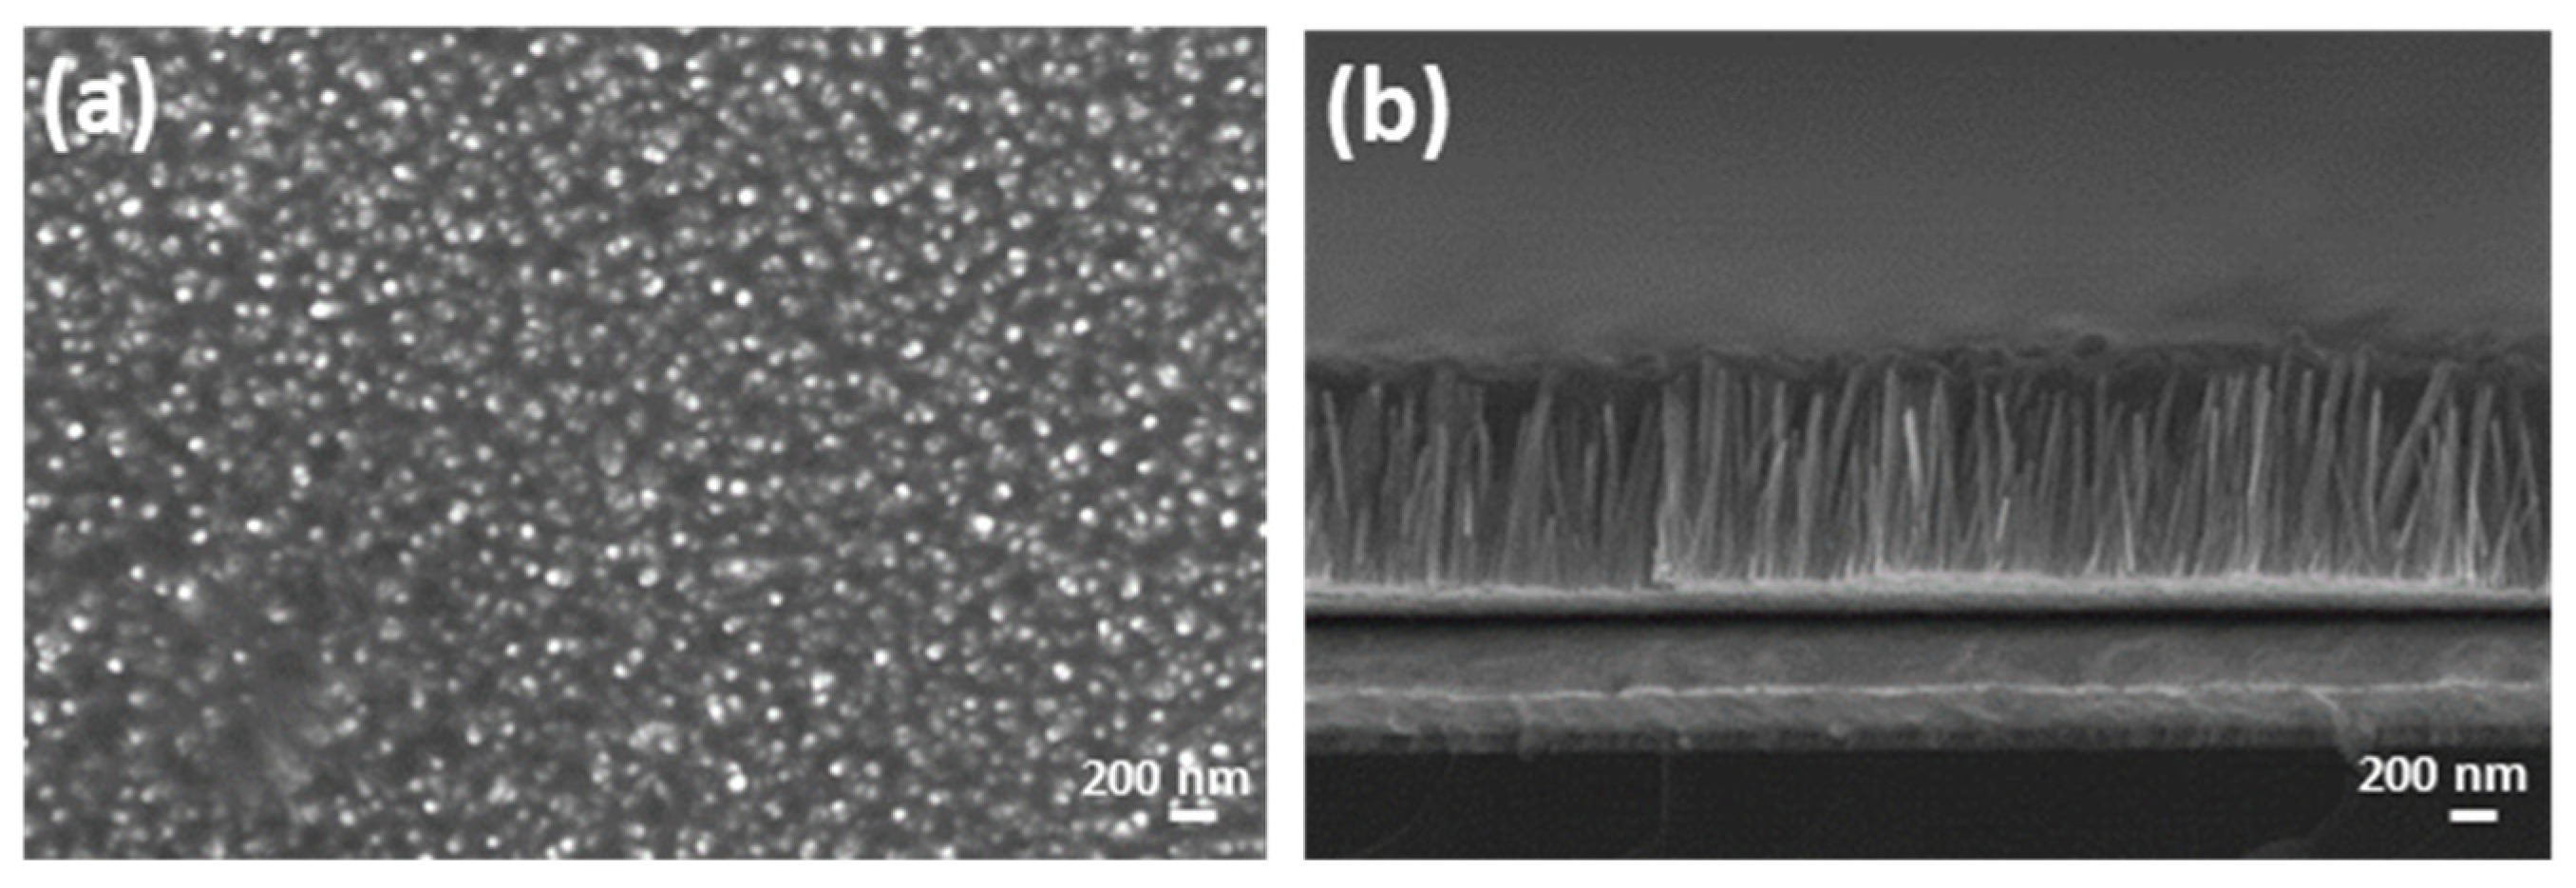
For ZnO NW-based nanogenerator fabrication, we used the ZnO NW sample with 4 h growth time, in order to obtain suitable nanowires for the NG devices: L ~ 1.1 μm, D ~ 45 nm with aspect ratio α ~ 25. Then, to protect the ZnO NWs during the experimental test phase, and to electrically isolate between the top metallic electrode and the Au layer of substrate (the bottom electrode), the substrate, covered with a vertical network of ZnO NWs, was encapsulated in a matrix of PMMA (poly-methyl methacrylate, Acros Organics, Illkirch, France), thus forming a ZnO/PMMA composite layer. To do this, the PMMA 495 A4 solution (MMA 495K MW in 4% Anisol) was spin-coated on the surface of the nanowires, leading to a penetration of PMMA into the volume of nanowires, as shown in
Figure 2. It is worth mentioning that this process is quite difficult to perform, we had to carry out multiple encapsulations to successfully develop an optimized process. In fact, there are no standard spin-coating parameters to apply, because it depends on the ZnO NW’s density, even with a fixed PMMA solution viscosity.
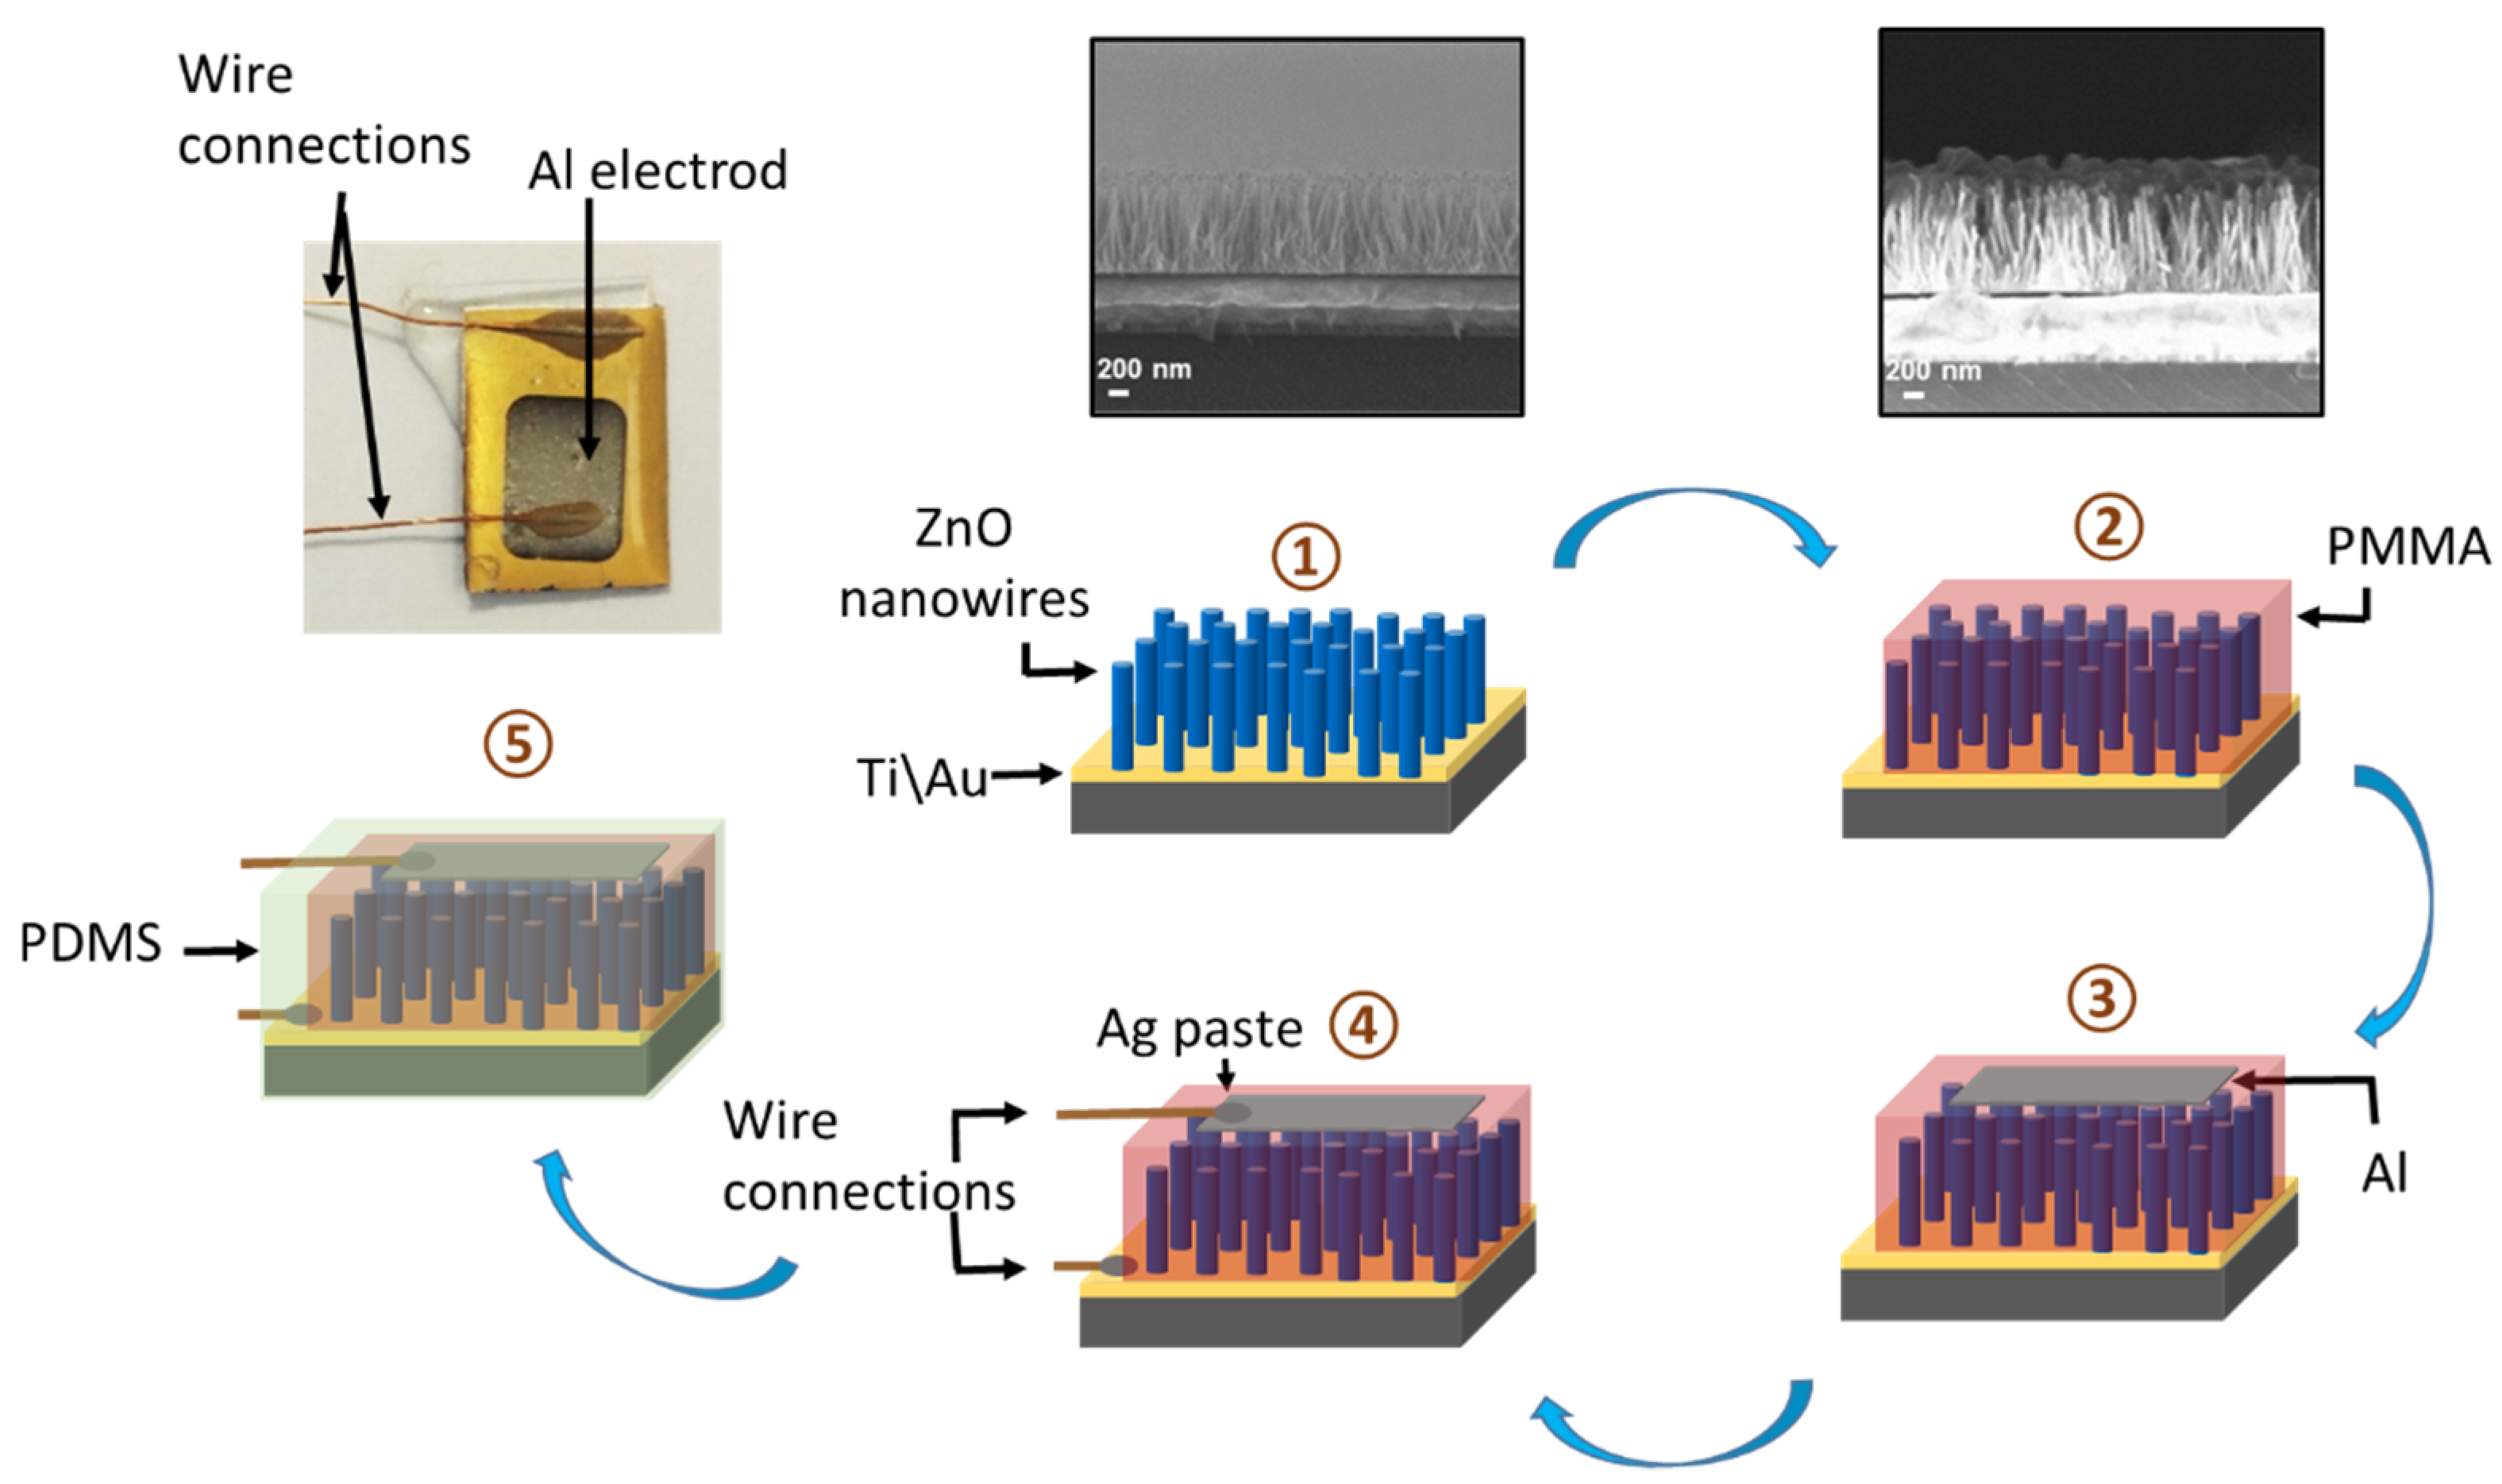
Figure 3 illustrates the ZnO NWs-based NG device-fabrication method. After PMMA spin-coating (step 2), an aluminum (Al) layer of 700 nm thickness, as the top contact electrode, was evaporated on the upper sample surface using a stainless-steel shadow mask (step 3). After inserting connecting wires (step 4), the NG was encapsulated with a PDMS layer, for protection and robustness during the different tests (step 5). A photograph of the final device has been also presented in
Figure 3. It should be emphasized that the obtained device Al/ZnO/Au forms a Schottky contact, as studied both in our previous work [
17] and in literature [
18,
19].
3. Results and Discussions
The measurement apparatus was based on a custom-built test bench, carefully designed to minimize anomalous signals that can occur due to effects other than that of the piezoelectric effect. In the first case, the NG was tested under vibration mode, so to perform this, the NG was placed on a shaker, which acted as an actuator and transmitted the vibrations to the NG, with controlled frequencies and accelerations, through a vibration controller. During the measurement, we used a voltage-follower amplifier, which is characterized by a very large input impedance and a low output impedance, in order to have maximum voltage transmitted and recovered. The test bench was connected to a data acquisition system, to view and record the data.
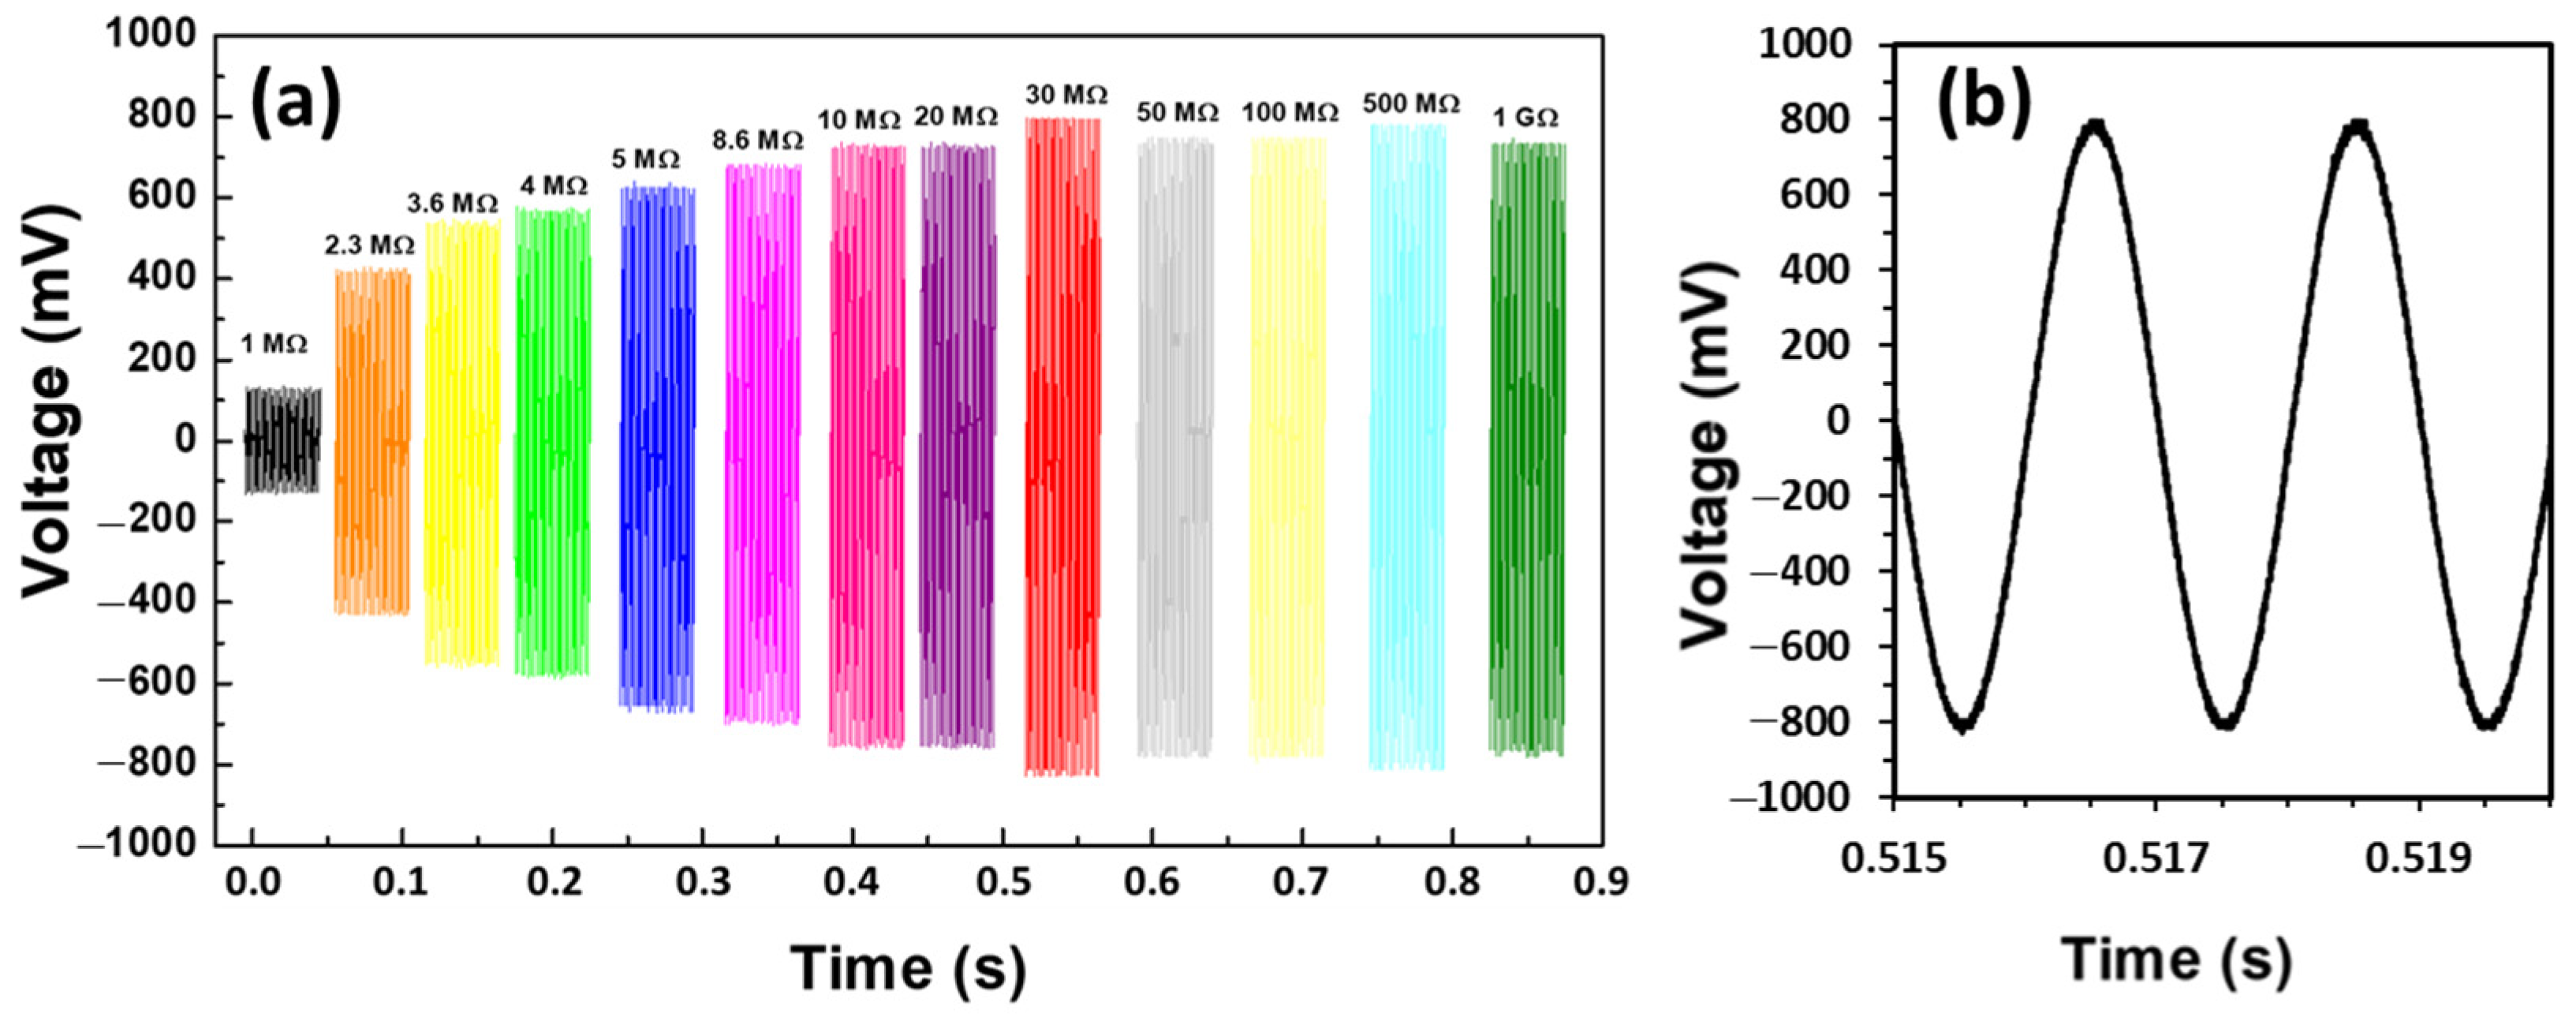
To assess the impact of resistive loading on the measured NG output characteristics, we carried out a series of experiments, by varying the load resistors (R
L) between 1 MΩ and 1 GΩ, and by applying a fixed vibrational frequency of 500 Hz to the NG.
Figure 4a presents the experimental data resulting from the various R
L, in which it can be clearly observed that the output voltages for the understudied device increase with increasing R
L value and saturate at a maximal value of about 720 mV for R
L = 30 MΩ. The generated signal has a peak-to-peak value of about 1.4 V, as shown in
Figure 4b. Therefore, we can conclude that 30 MΩ represents the optimal value of the load resistance for our NG.
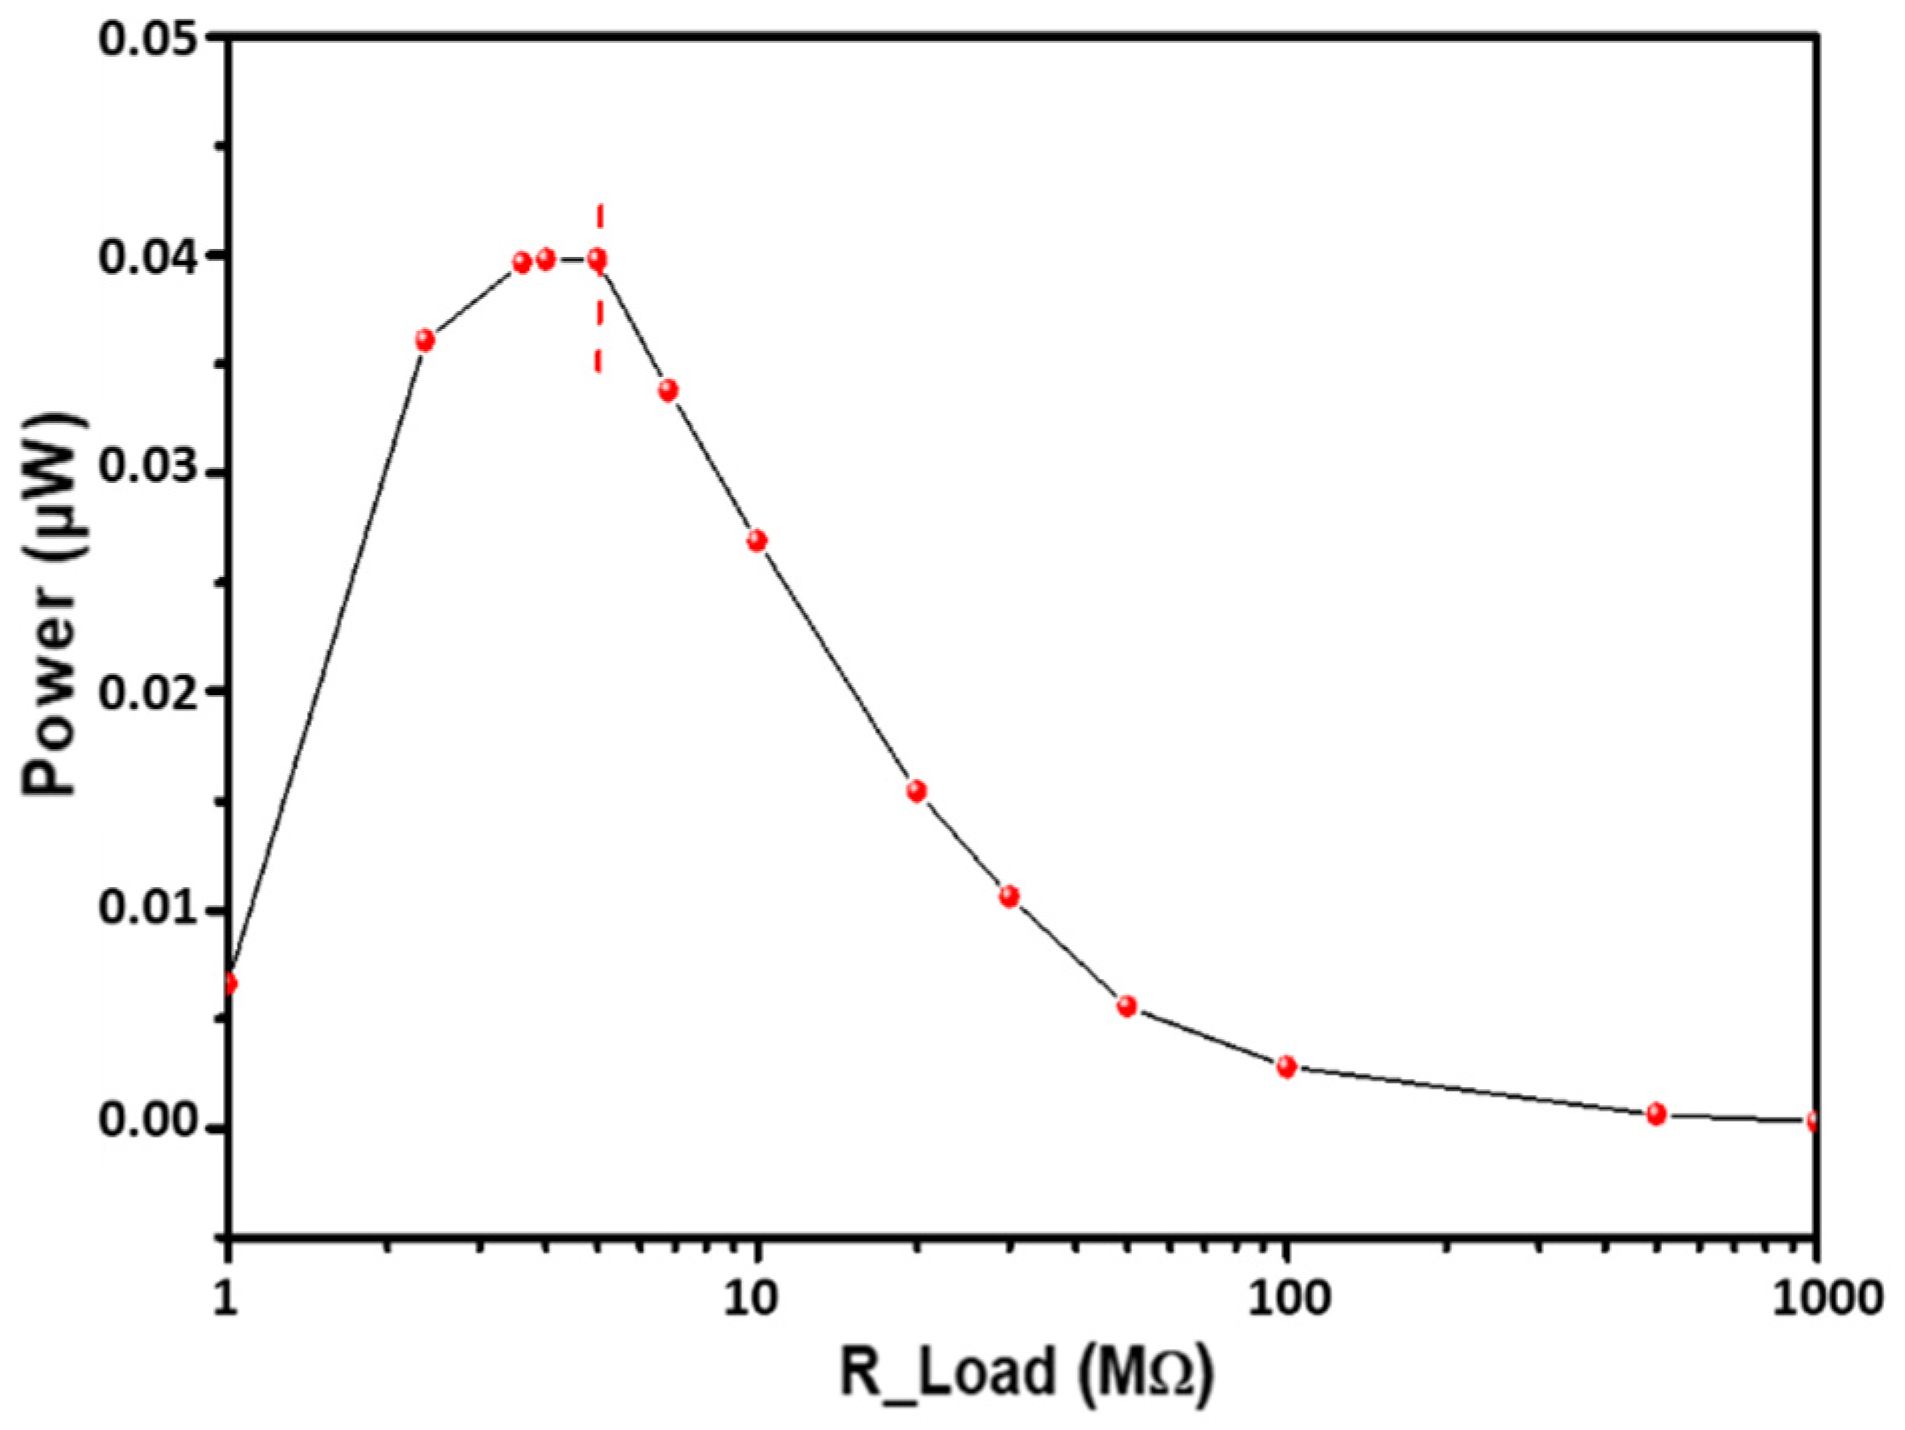
With these considerations, we can determine the instantaneous power generated by our device, using the following relationships:
From the measured values of maximal voltage “V
max” as a function of load resistance R
L, we can plot the variation of the instantaneous power (P
i) as a function of the R
L (
Figure 5). We found that the NG delivered a maximal instantaneous output power of 0.04 µW, corresponding to an R
L value of about 4 MΩ; the corresponding power density value was about 0.9 mW/cm
3. To give a comparison, a similar work on ZnO NWs-based NG, from Dahiya et al. [
20], generated an output power density of ~16 µW/cm
3, with a potential peak-to-peak value of 2 V.
Next, we studied the performance of our NG in the frequency range corresponding to aircraft vibration, in order to be coherent with future potential applications of NG as an energy source for self-powered sensors.
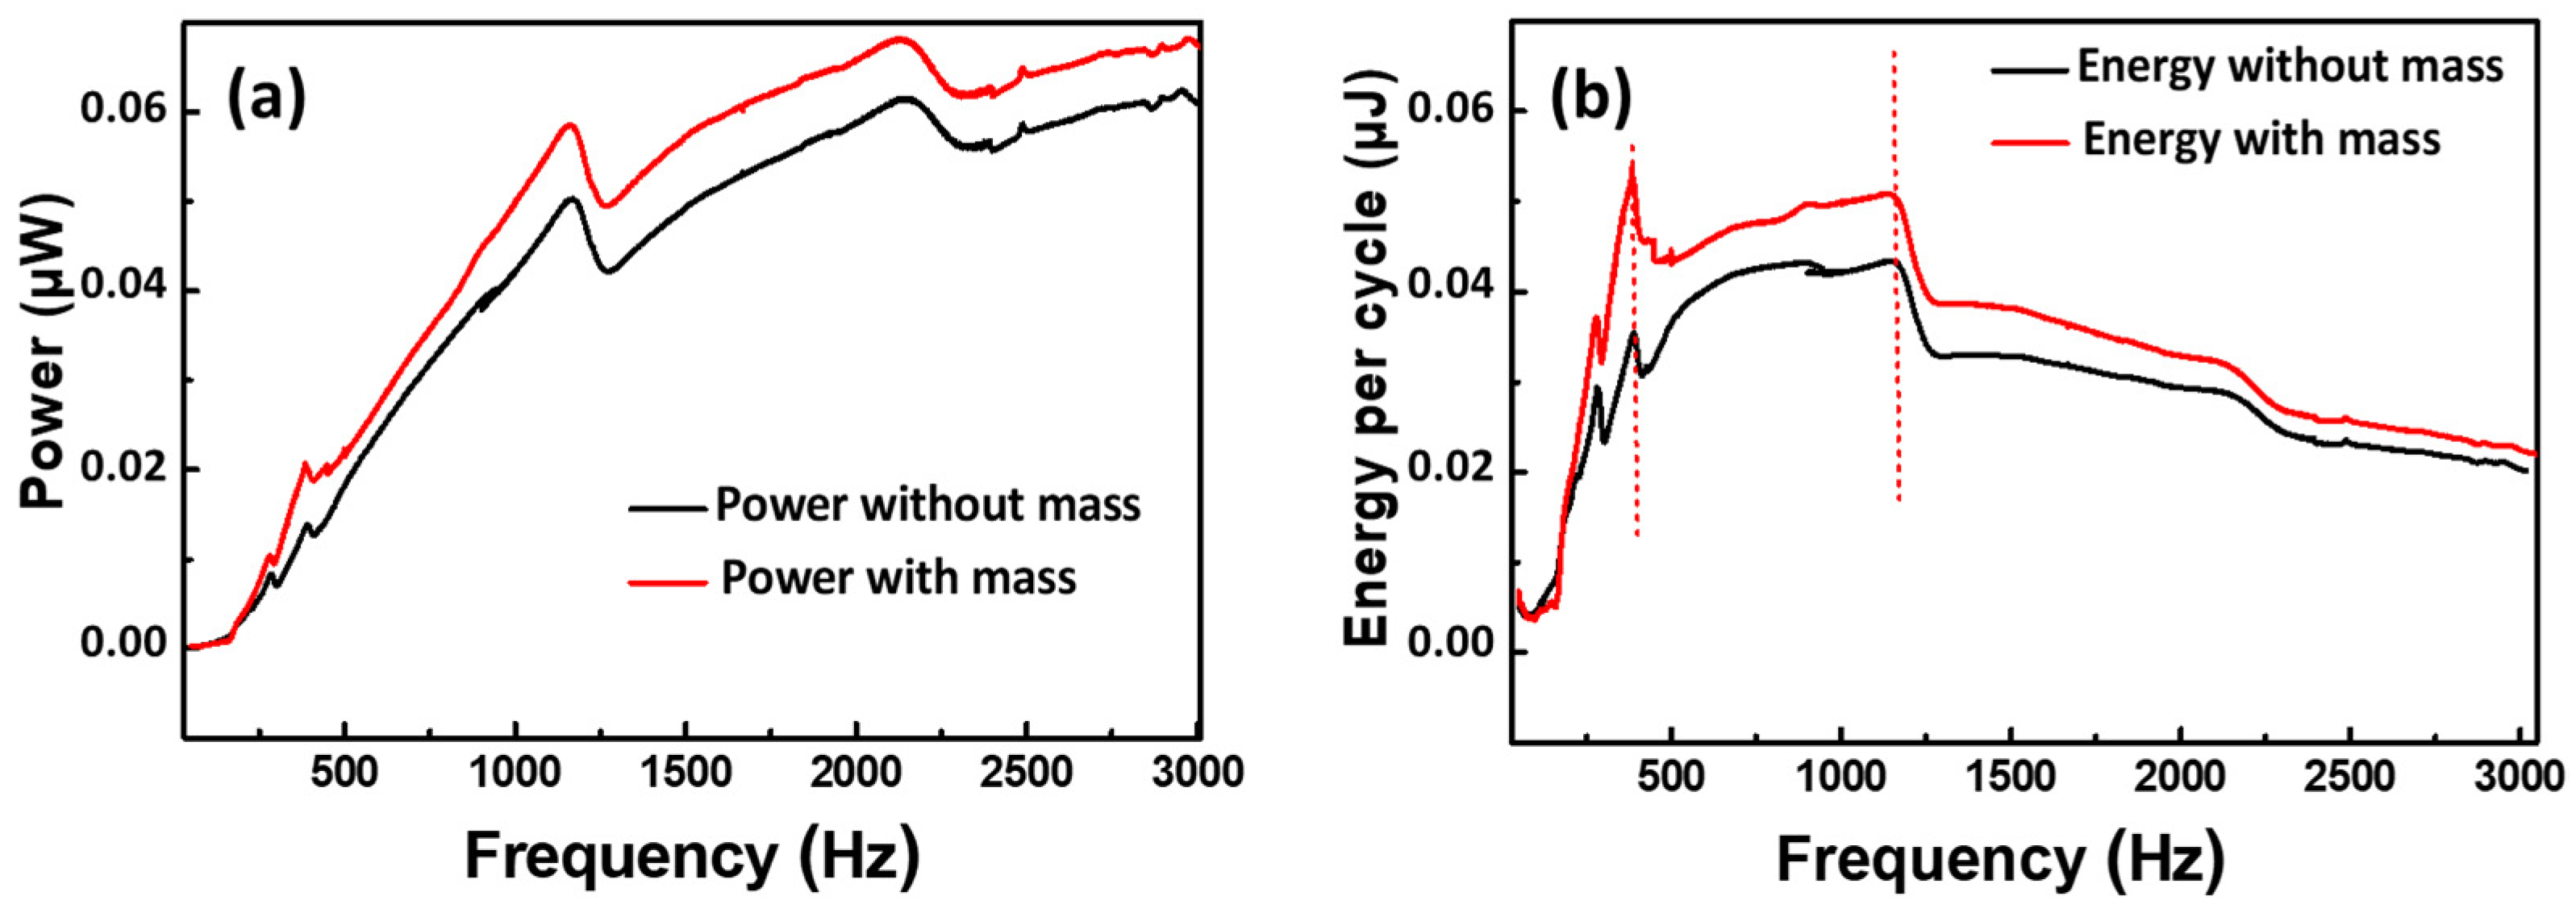
Figure 6a (black curve) shows the variation of the instantaneous power of the NG as a function of the frequency from 50 Hz to 3 KHz, for a load resistor of 4 MΩ (optimized value). We noticed that the instantaneous power increased exponentially with the vibrational frequency. However, the energy per cycle had a different behavior, as shown in
Figure 6b (black curve). In fact, its value increased very quickly with the frequency before 300 Hz and reached the maximum energy between 300 and 1200 Hz, and then it decreased for the frequency above 1200 Hz. From this observation, we can deduce that the optimal range of vibrational frequency for our NG is between 300 and 1200 Hz. It is worth highlighting that the maximal aircraft vibration energy is approximatively located between 500 Hz and 1000 Hz. Thus, our NG response is quite coherent with this application.
After defining the optimal load resistor and vibrational frequency for the optimal working conditions of our ZnO nanowire-based NG, we were interested in improving its performance, by adding a mass of 2 g on the top of the NG. This mass could increase the compressive constraint on the ZnO NWs and decrease the value of the resonance frequency of the device. We knew that we did not want to go beyond 2 g, to avoid making the device cumbersome for later applications, while maintaining the same range of excitation frequency from 50 Hz to 3 KHz.
Figure 6a (red curve) illustrates the variation of the instantaneous power as a function of the vibrational frequency. By comparing the power curves before and after the mass addition, we can see that a small improvement has been obtained for the NG output power, but not in a significant way (15%). Similar behavior was also observed in energy per cycle (see
Figure 6b) (red curve).
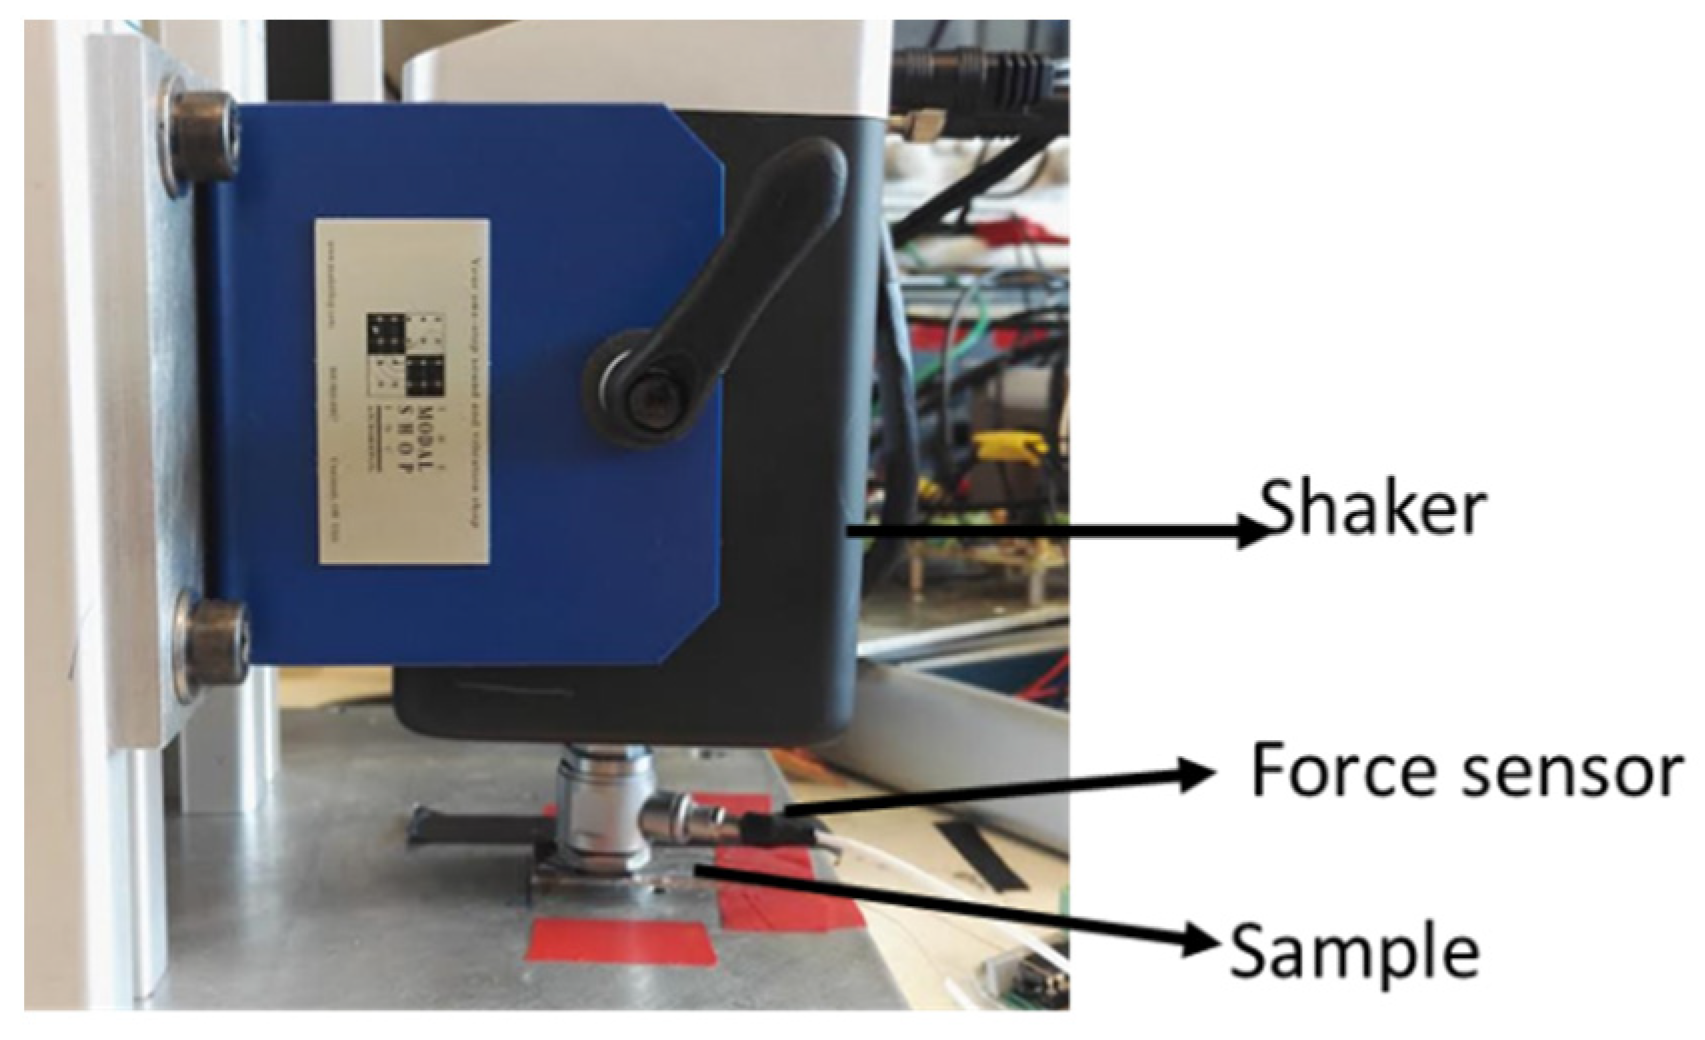
In the second case, the NG was tested under compression mode. The NG was placed in front of a shaker which acted as an actuator (by applying a compression force on the NG), with a fixed low frequency, for potential applications under low frequency motion, such as body movement. The applied force was measured by a force sensor, linked on the shaker, as shown in
Figure 7.
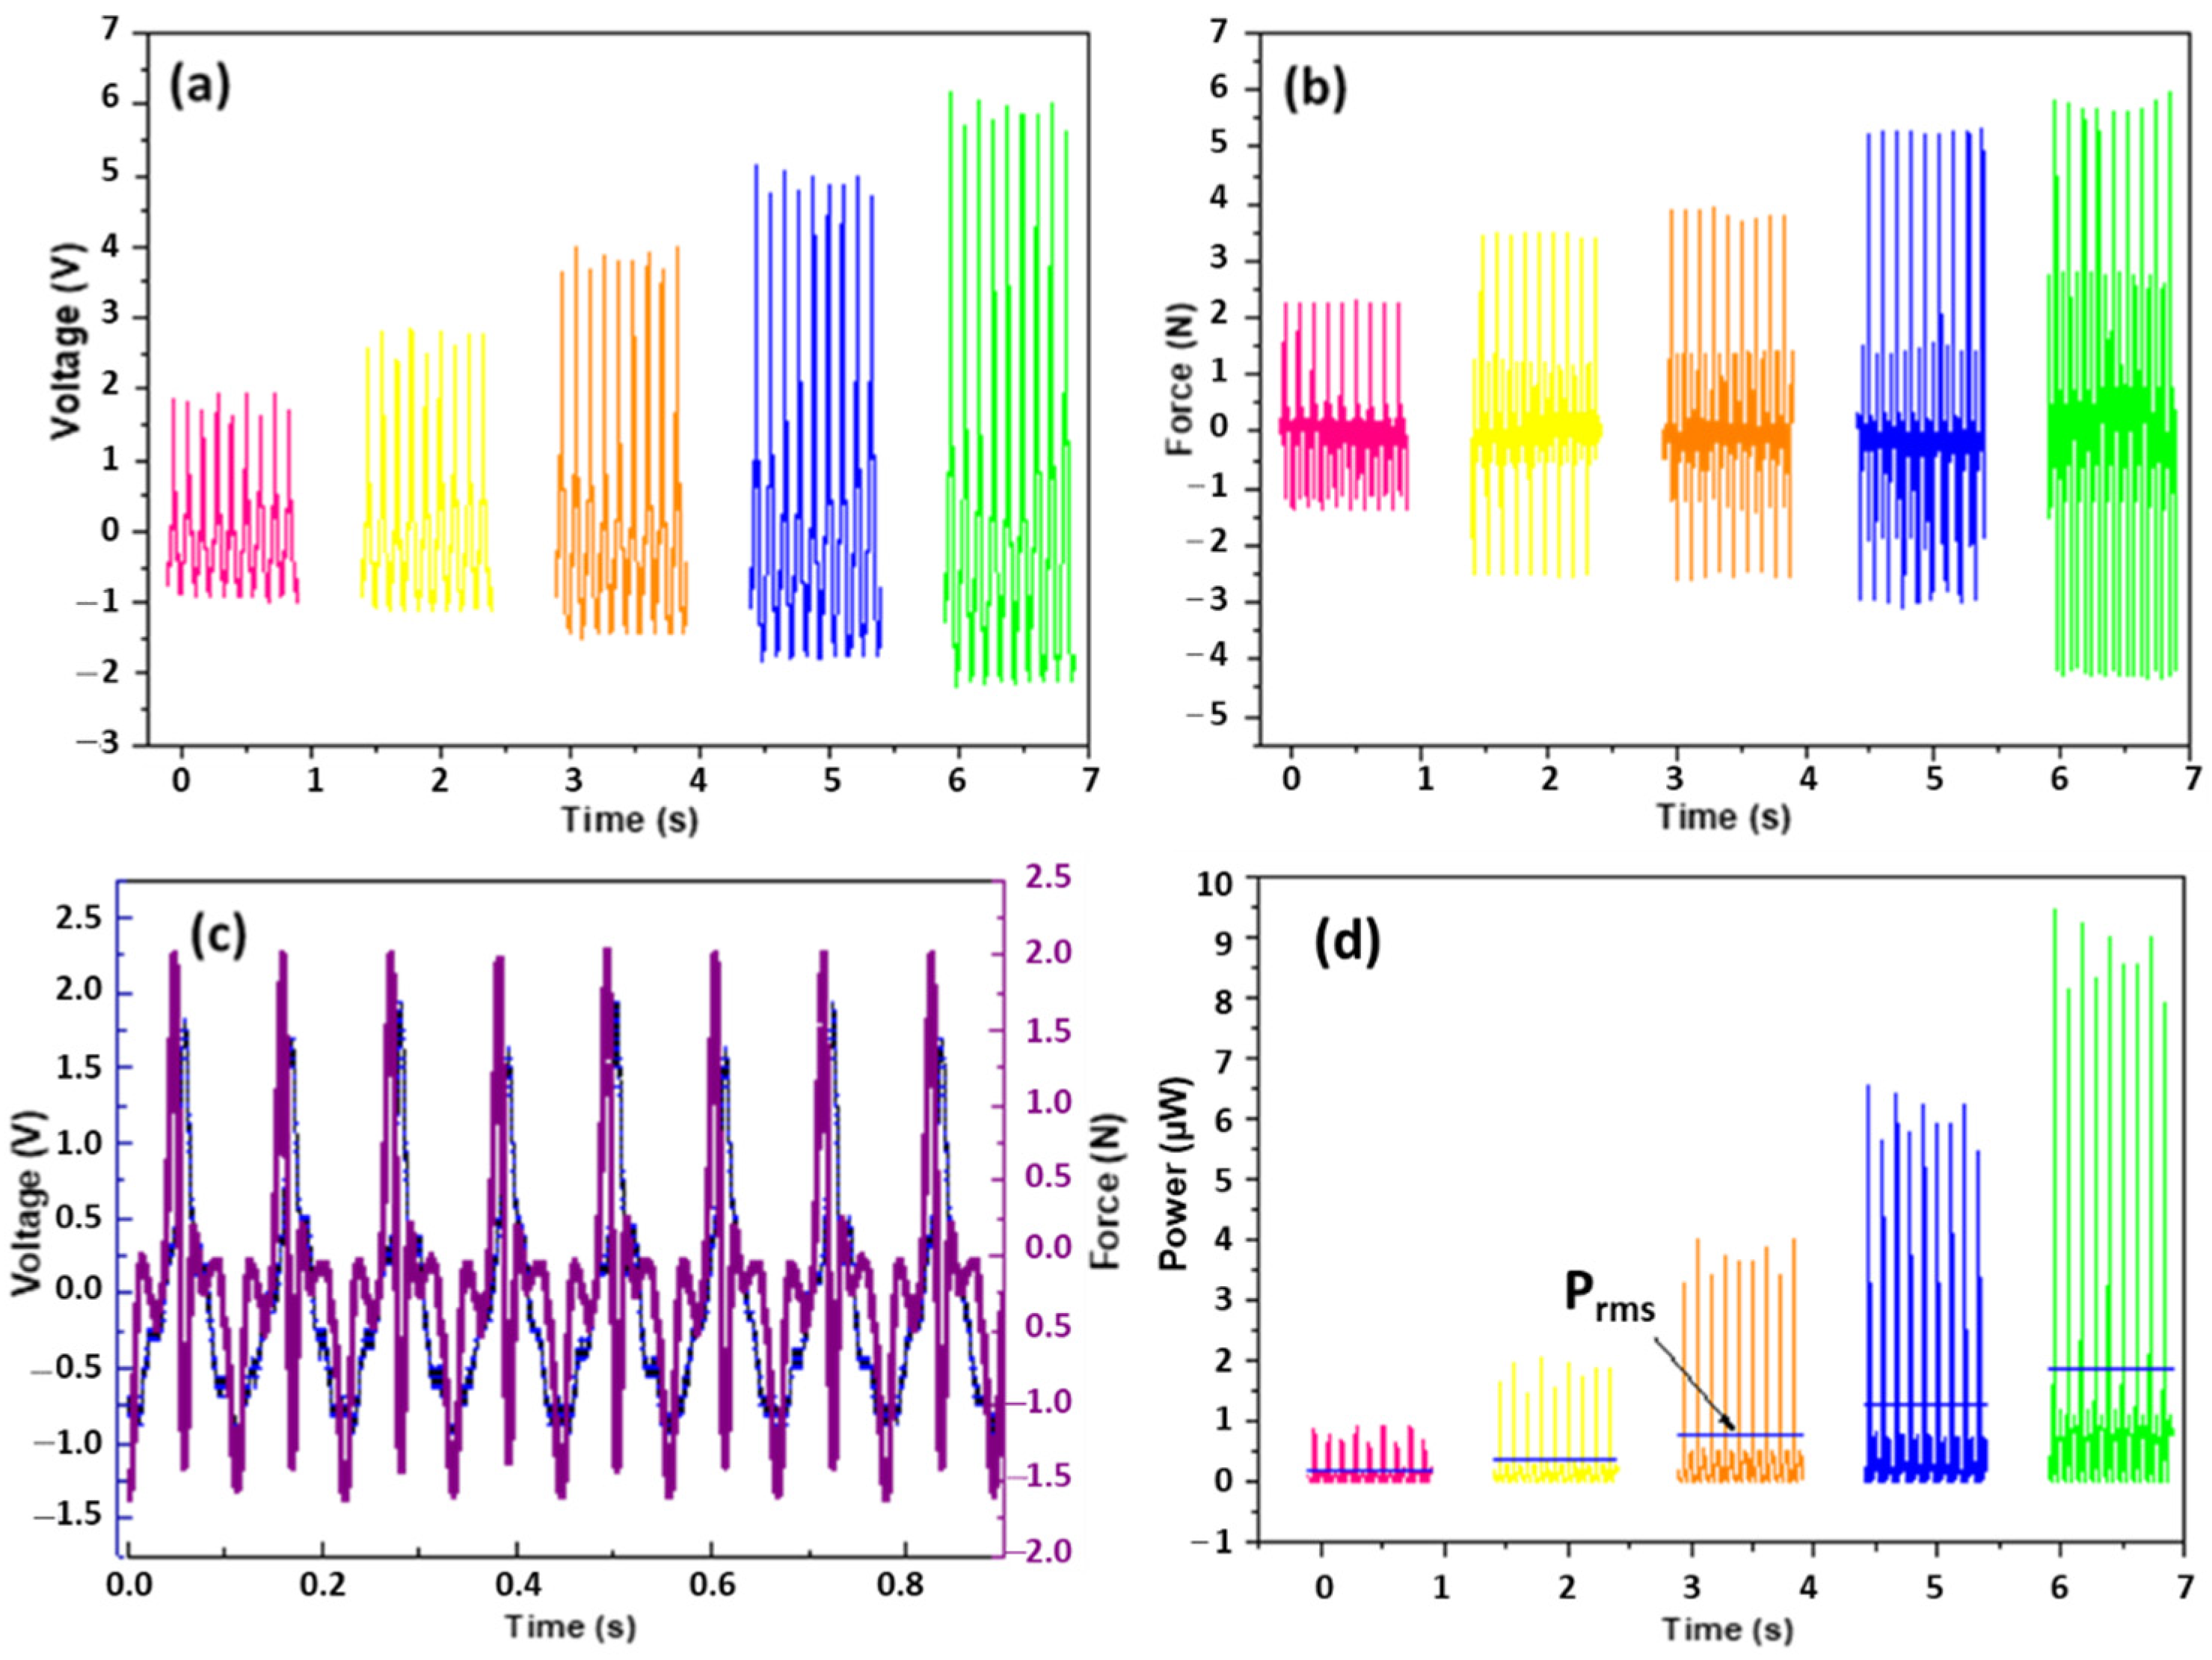
Figure 8a shows the voltage generated by the NG, based on the ZnO nanowire array, synchronized with the force applied by the actuator (
Figure 8b) (calculated from the force sensor). The device withstood a large number of cycles, with a frequency of 9 Hz and a maximum force of about 6 N. It is important to note here that these forces, applied by the actuator to deform the NG device, did not induce significant damage to the polymer matrix, the electrical contacts, or the silicon substrate. No cracking or degradation was observed by optical microscopy after numerous cycle tests.
Note that, under these biased conditions, the nanowires were compressed. Nanowires generate a negative signal when the NG is compressed and a reverse signal when released. The profile of the generated signal perfectly followed the profile of the applied force (
Figure 8c). The piezo-nanogenerator delivered an alternating voltage, both during compression of the device and during its relaxation. This behavior is in concordance with the piezo-nanogenerators found in the literature [
21,
22,
23,
24].
Figure 8d presents the powers generated under different excitation forces. In this case, the NG generated a mean power higher than in the previous case (in vibration mode), with an effective power of 1.71 μW for a compression force of 6 N. This is due to a more important stress having been applied towards the c-axis of the nanowires in the compression–excitation mode.
4. Conclusions
In this work, we have studied the electrical signal produced by a piezoelectric nanogenerator, incorporating vertically-aligned piezoelectric ZnO NWs encapsulated in a polymer matrix. ZnO NWs were hydrothermally synthesized, showing high crystalline quality and homogeneous morphology. PMMA was used as a matrix material, to physically support the ZnO NWs, and as a dielectric layer on top of the NWs. The theory proposed to describe the ZnO NWs-based nano-generator operation is that the dielectric material acts as an effective barrier layer for induced charges in metal electrodes, while providing electrical isolation between adjacent NWs. The devices assembled here employed a ~1.2 µm thick PMMA layer over the top of the NWs, which offered effective electrical isolation for the top electrode. Thinner layers proved challenging when trying to electrically isolate the two conductive layers.
This work was devoted to the design and study of the performance of an NG based on ZnO nanowire arrays (NWs: ~1.1 µm length and ~45 nm diameter). The device was tested in two different modes: firstly, in vibration mode, then in compression mode. In the vibration mode, the experimental tests demonstrated the best working conditions for our NG, including the load resistance RL at 4 MΩ and the range of vibrational frequency between 300 and 1200 Hz. Our ZnO NWs-based NG produced a potential of 1.4 V peak-to-peak value, and an instantaneous power of 0.04 μW (output power density ~0.9 mW/cm3). In the compression mode, with the same RL value, a larger effective power of 1.71 µW (output power density ~38.47 mW/cm3) was obtained at a low frequency of 9 Hz, with an applied force of 6 N. From these results, it can be concluded that the VINGs are more sensitive to the compression mode than the vibration mode.


