
Investigation of Impact Resistance of High-Performance Polypropylene Fiber-Reinforced Recycled Aggregate Concrete


Abstract
:1. Introduction
2. Experimental Procedure
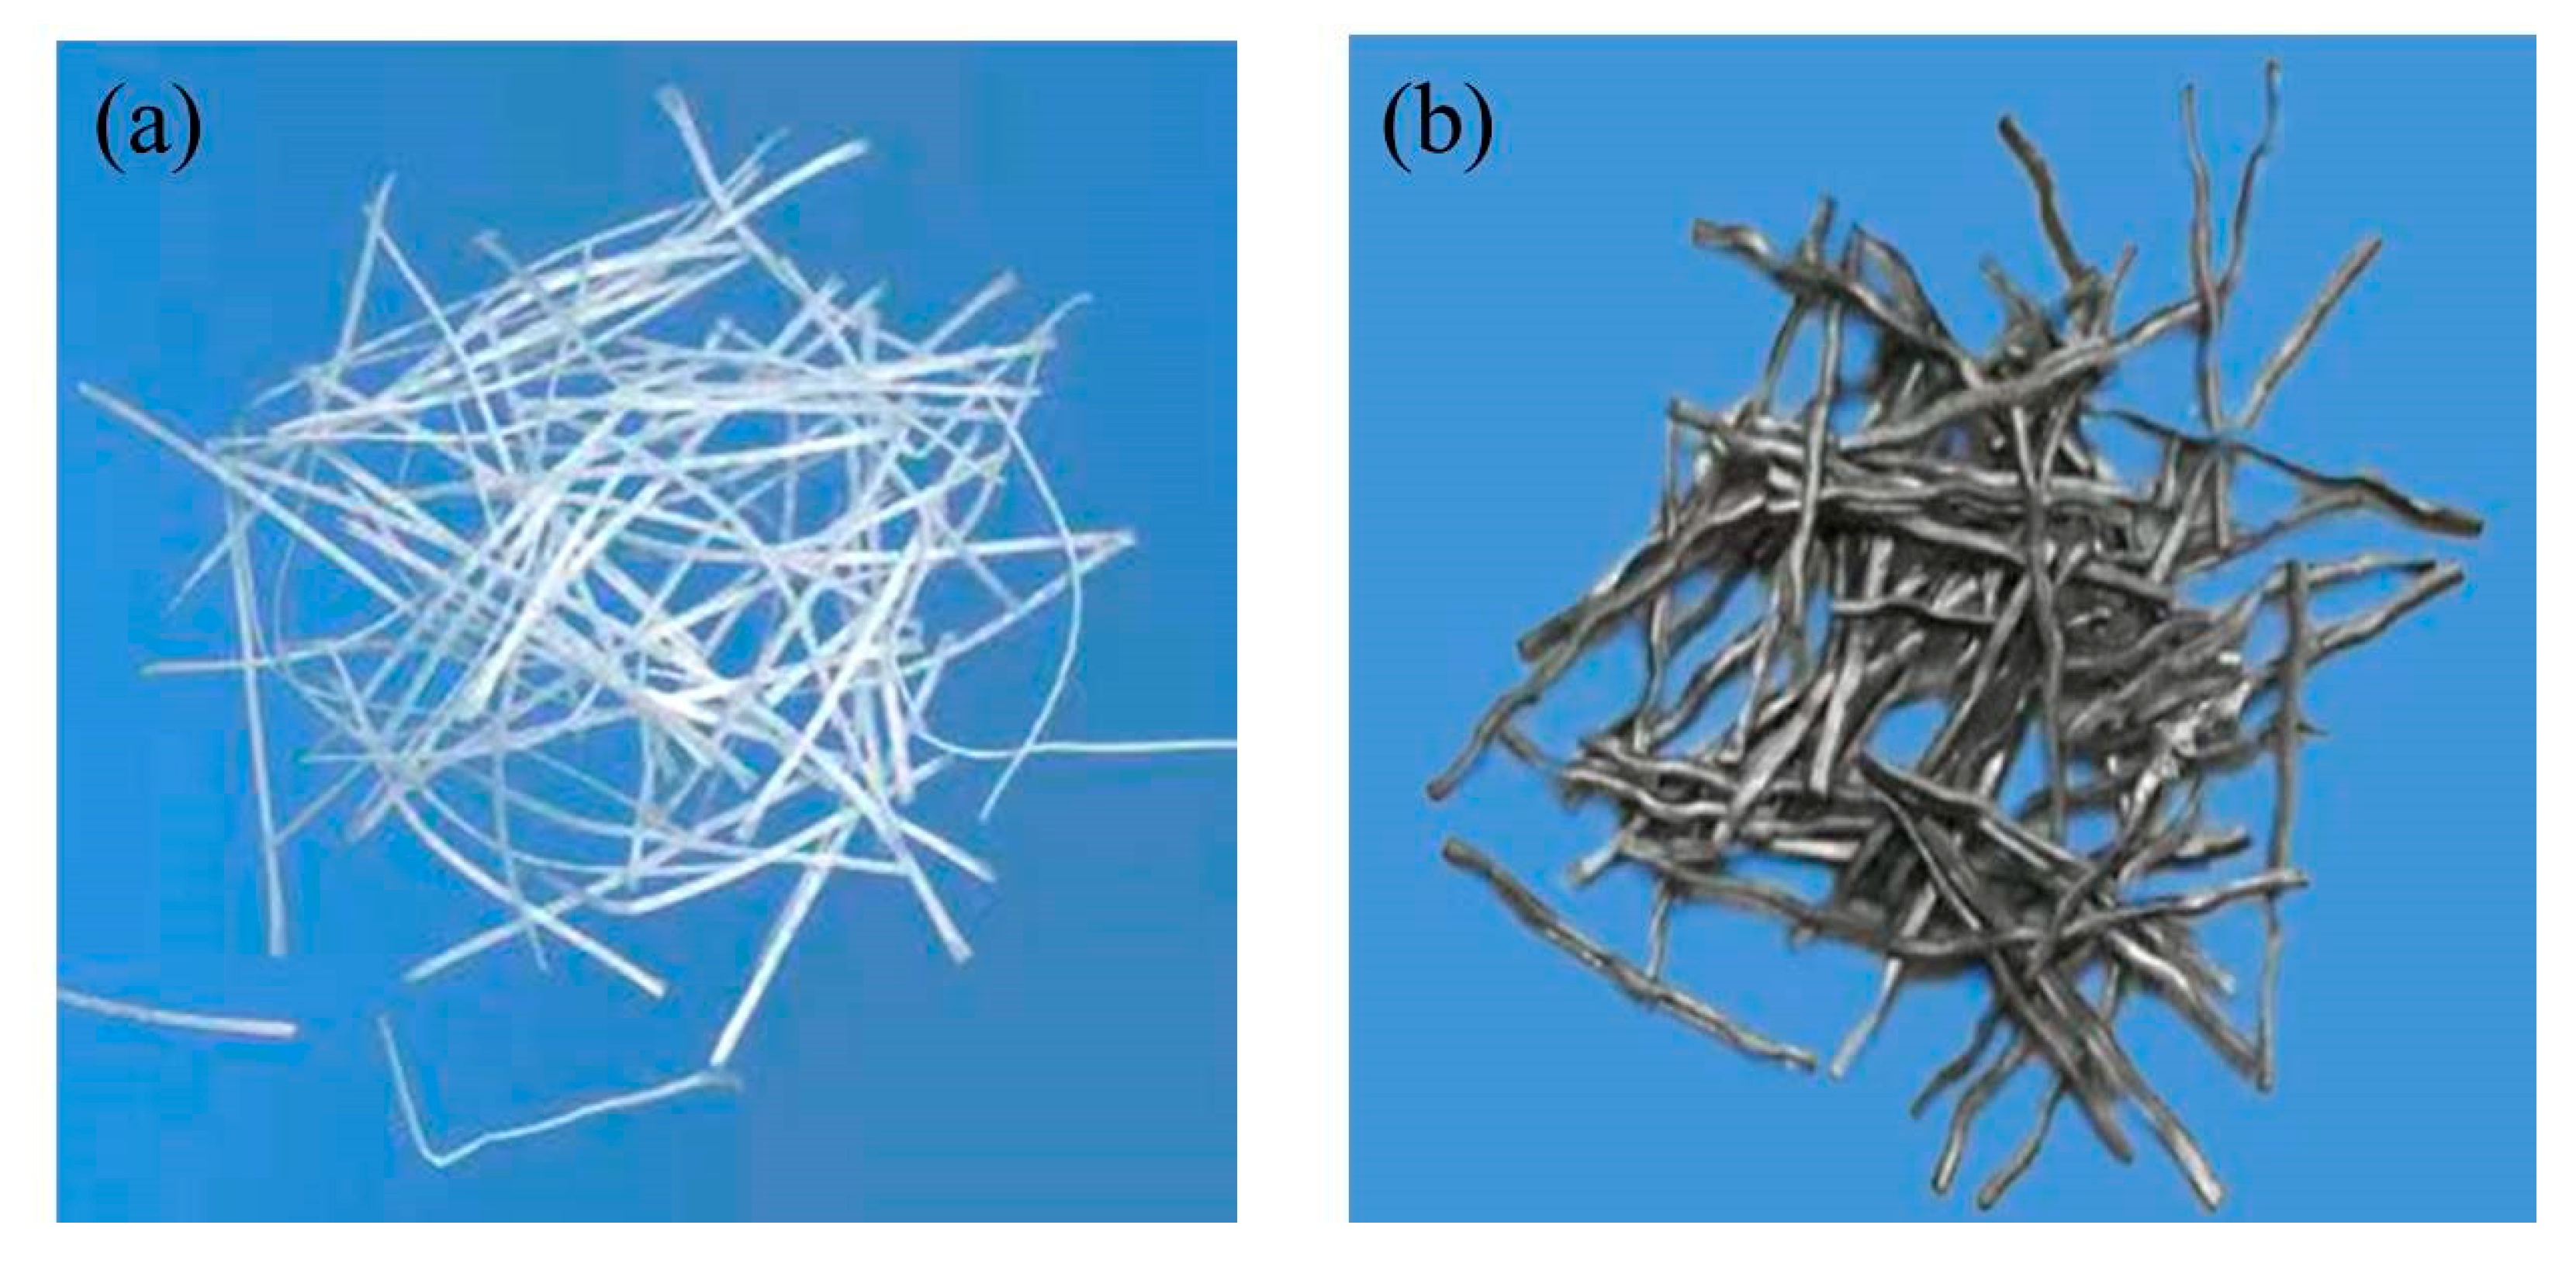
2.1. Materials and Mixture Ratio of Concrete
2.2. Sample Preparation and Maintenance
2.3. Experimental Methods
2.3.1. Compressive Strength Test
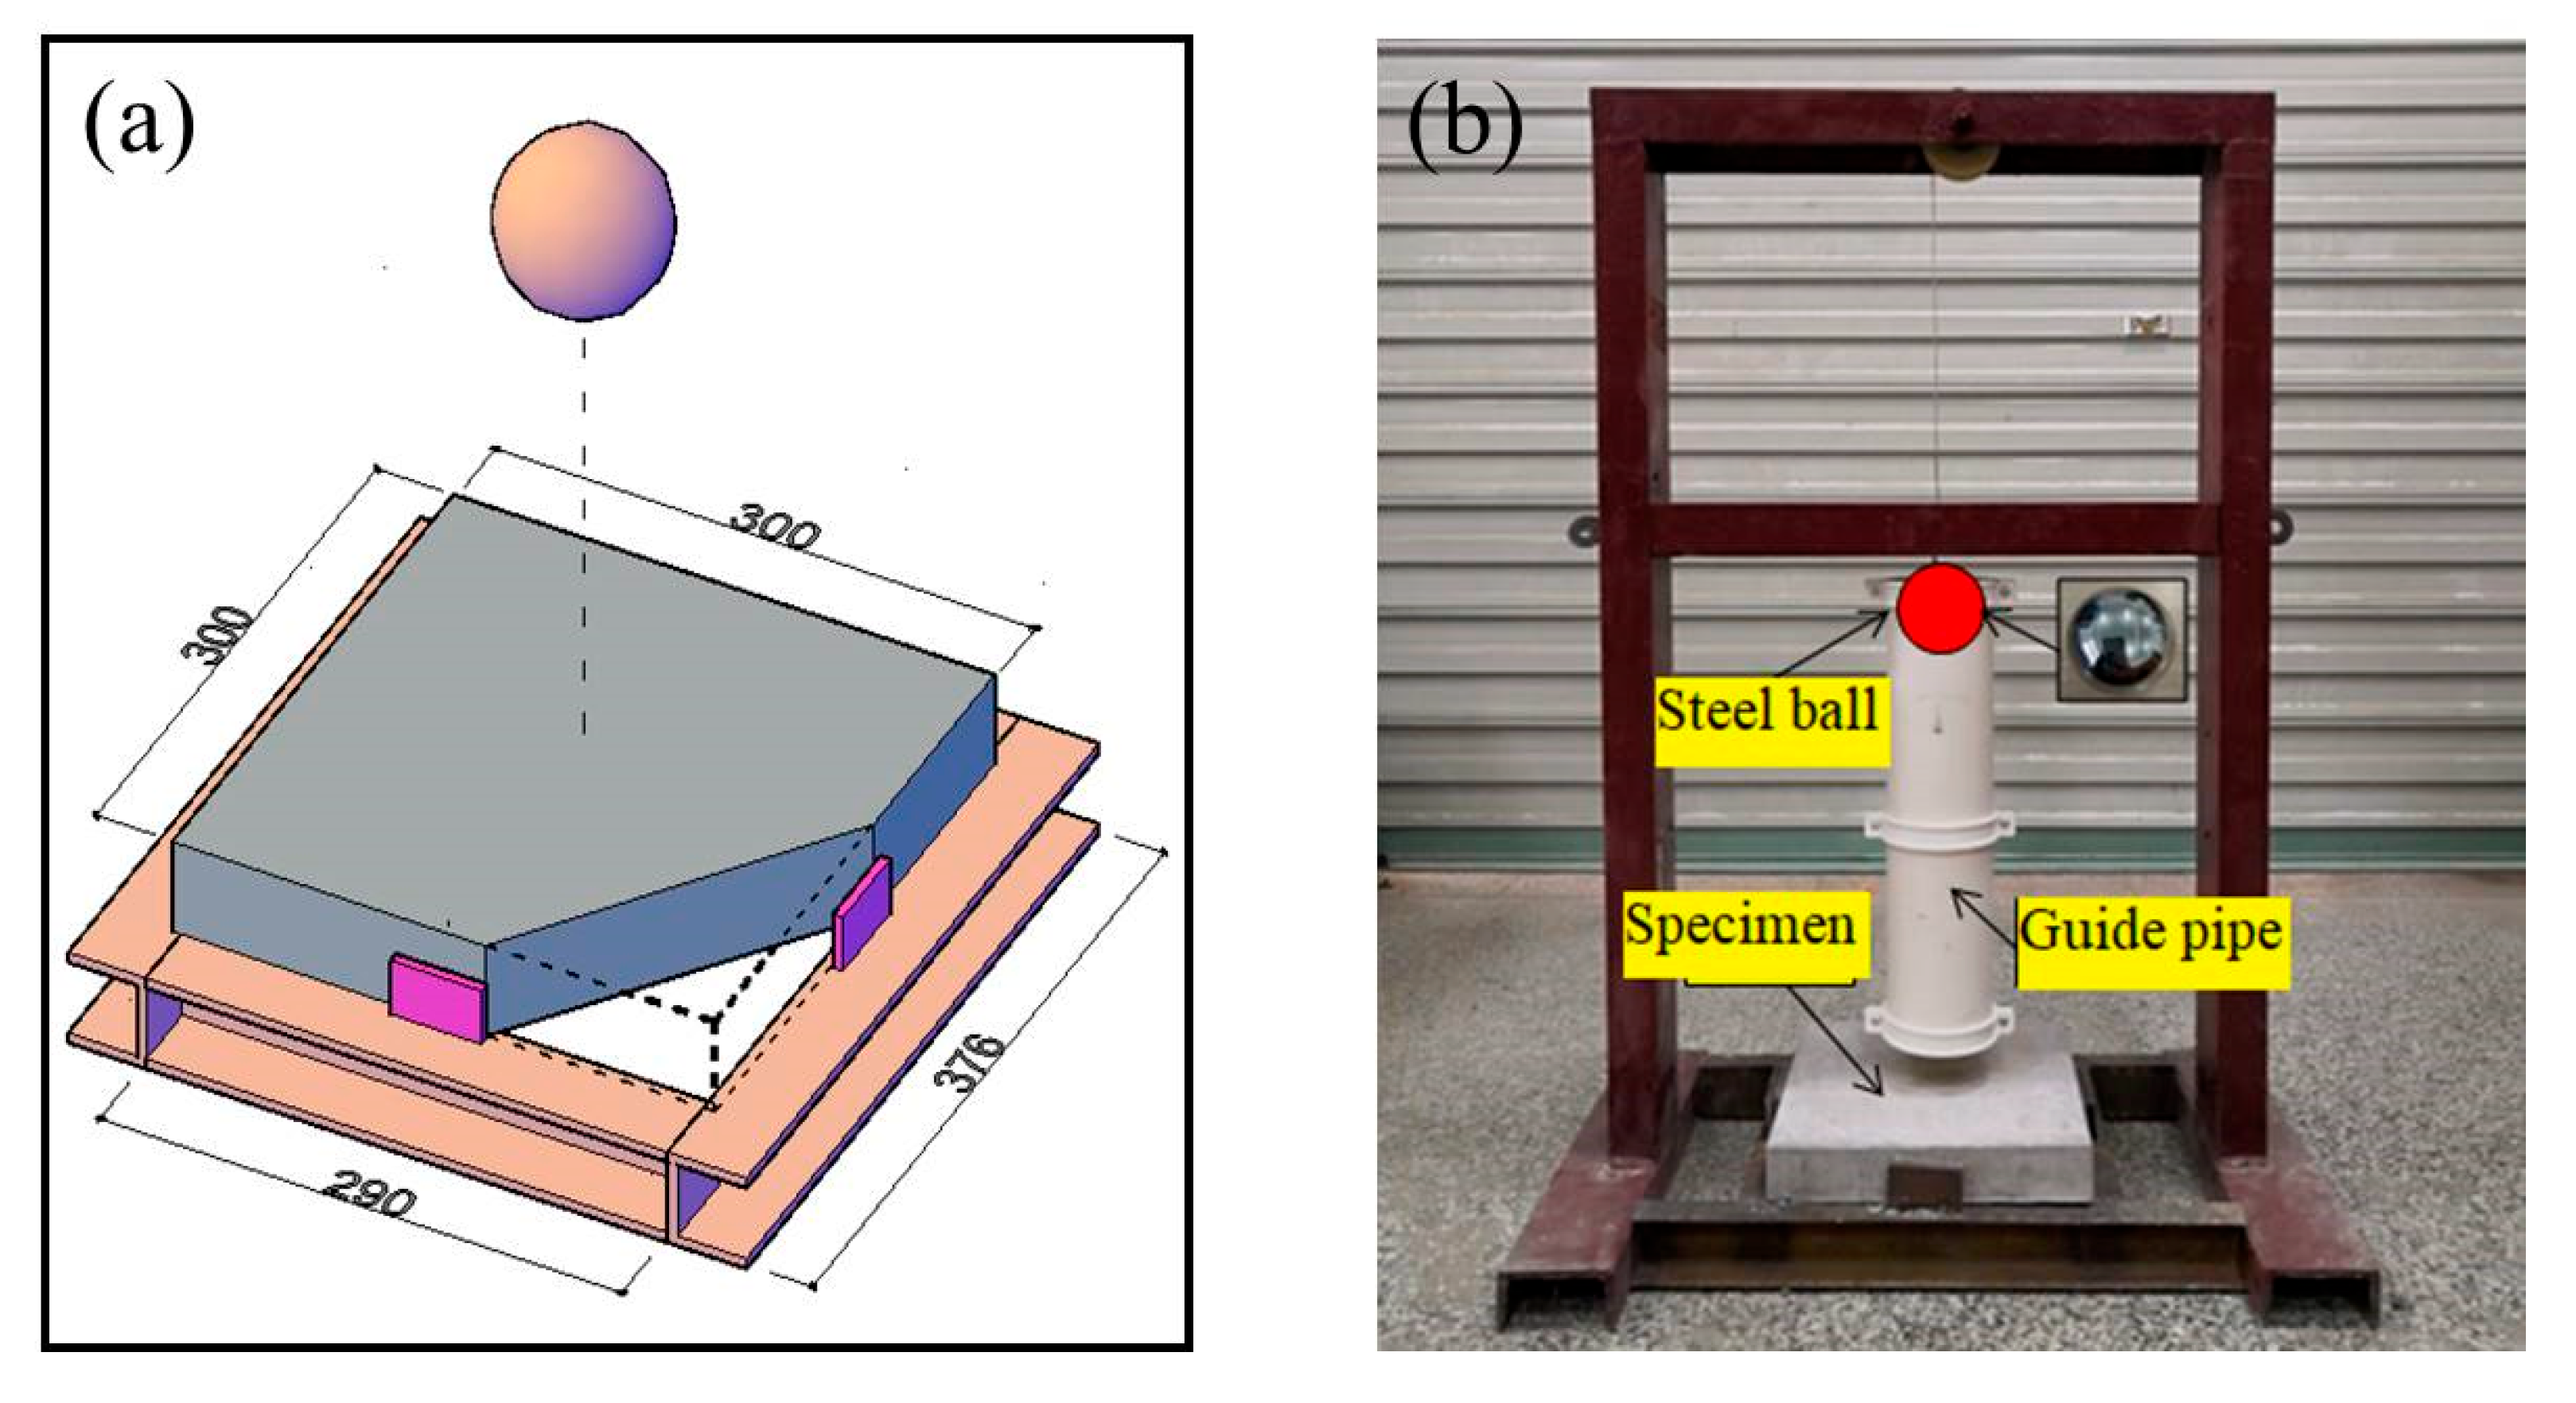
2.3.2. Impact Resistance Test
3. Results and Discussion
3.1. Compressive Strength
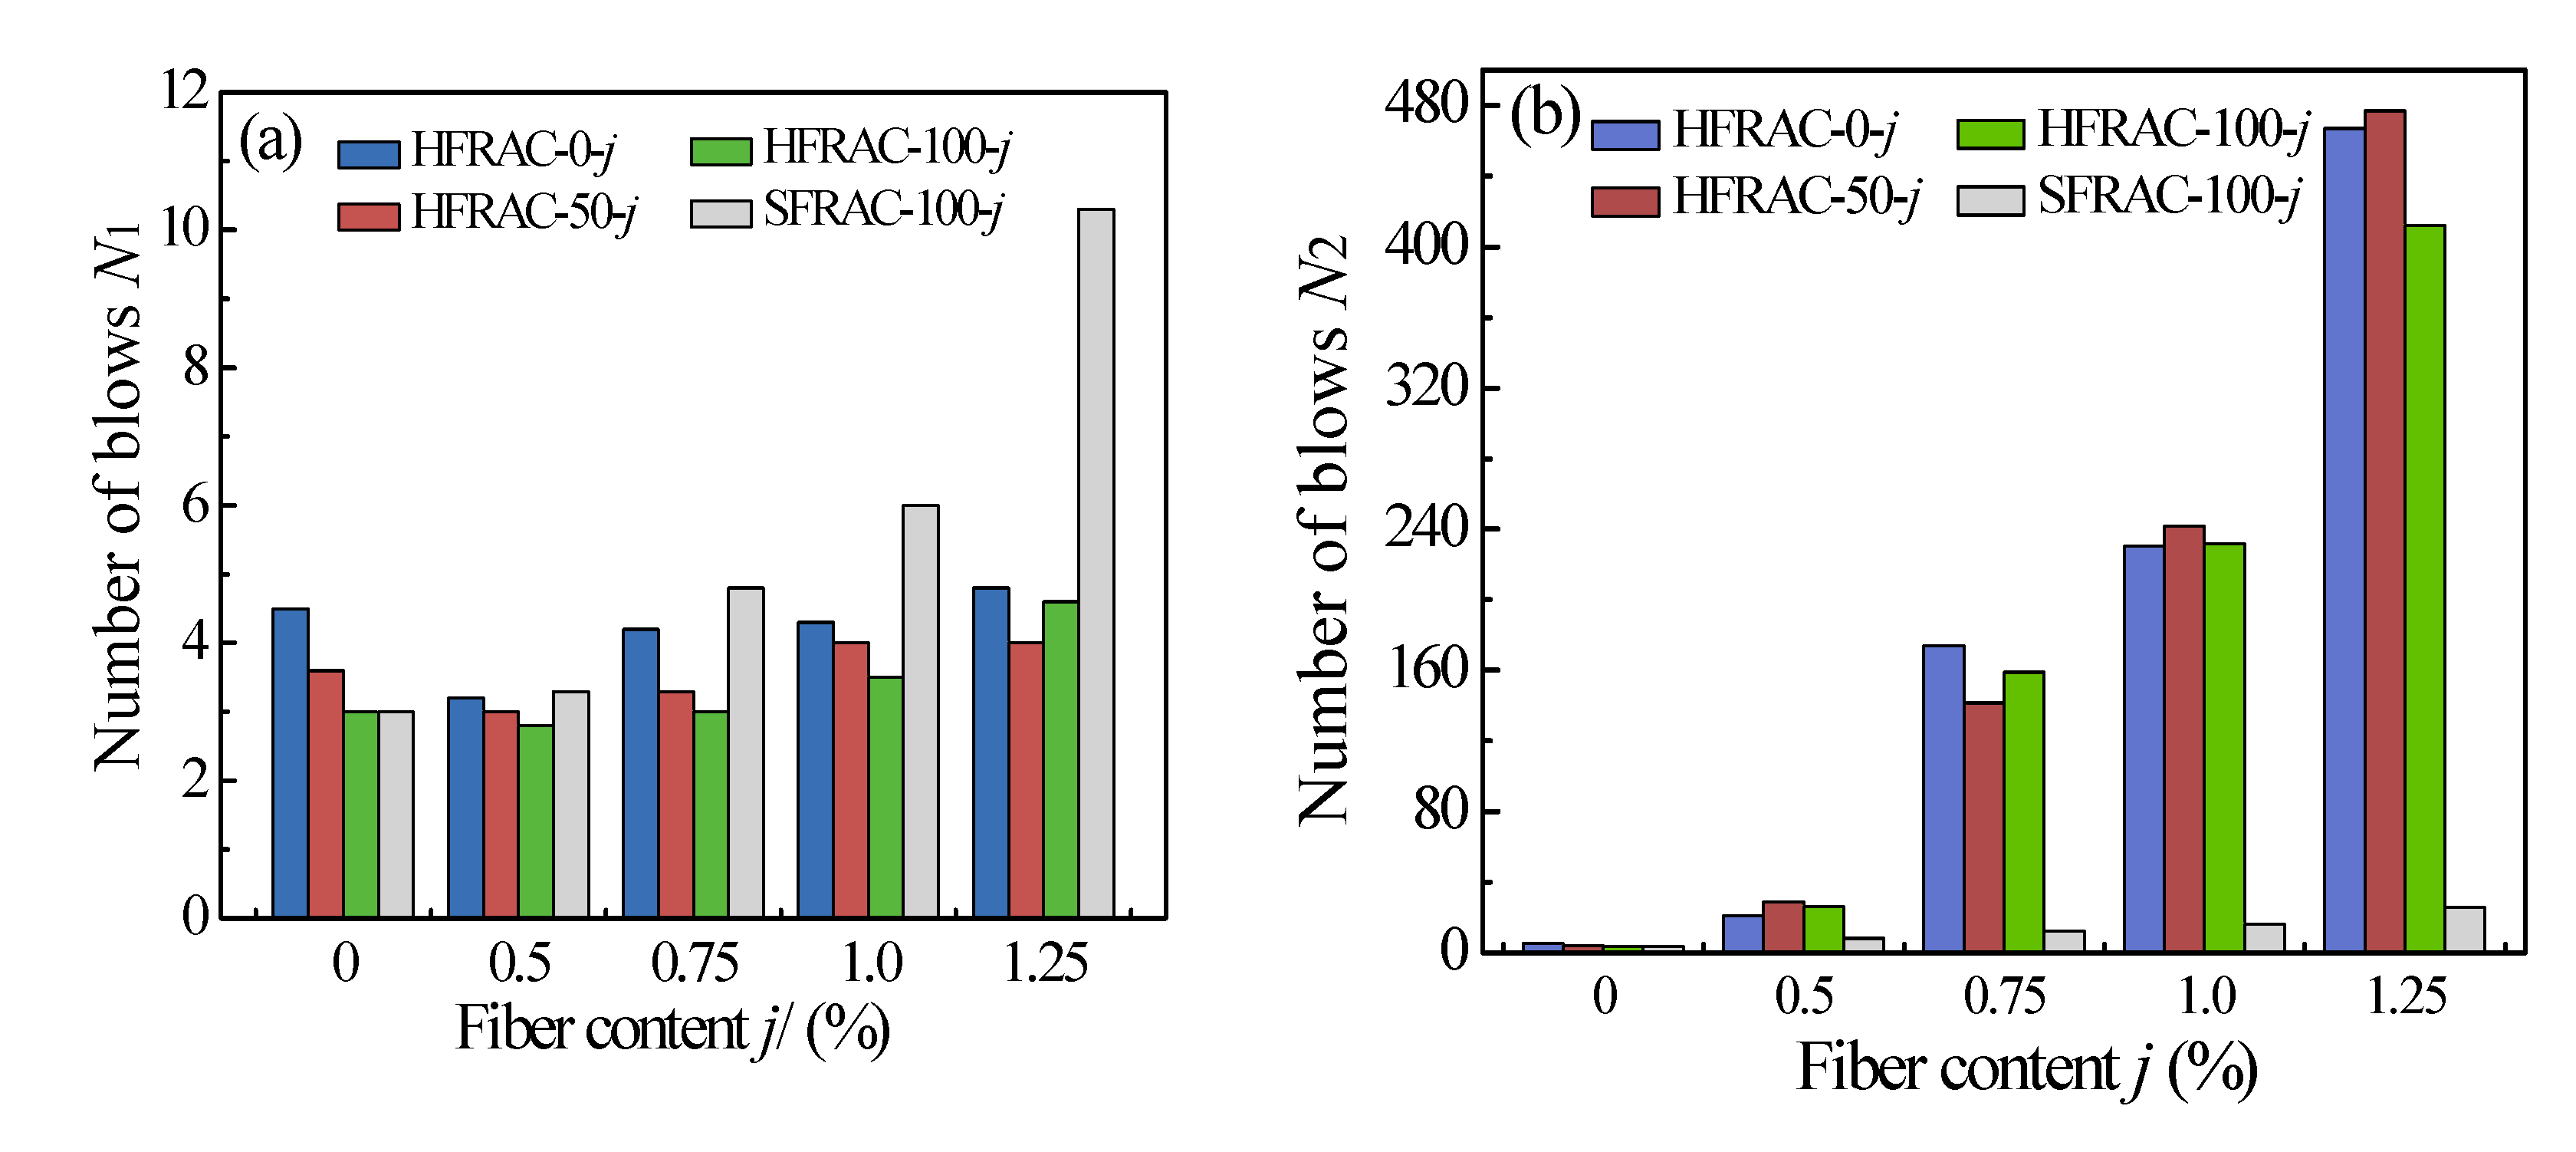
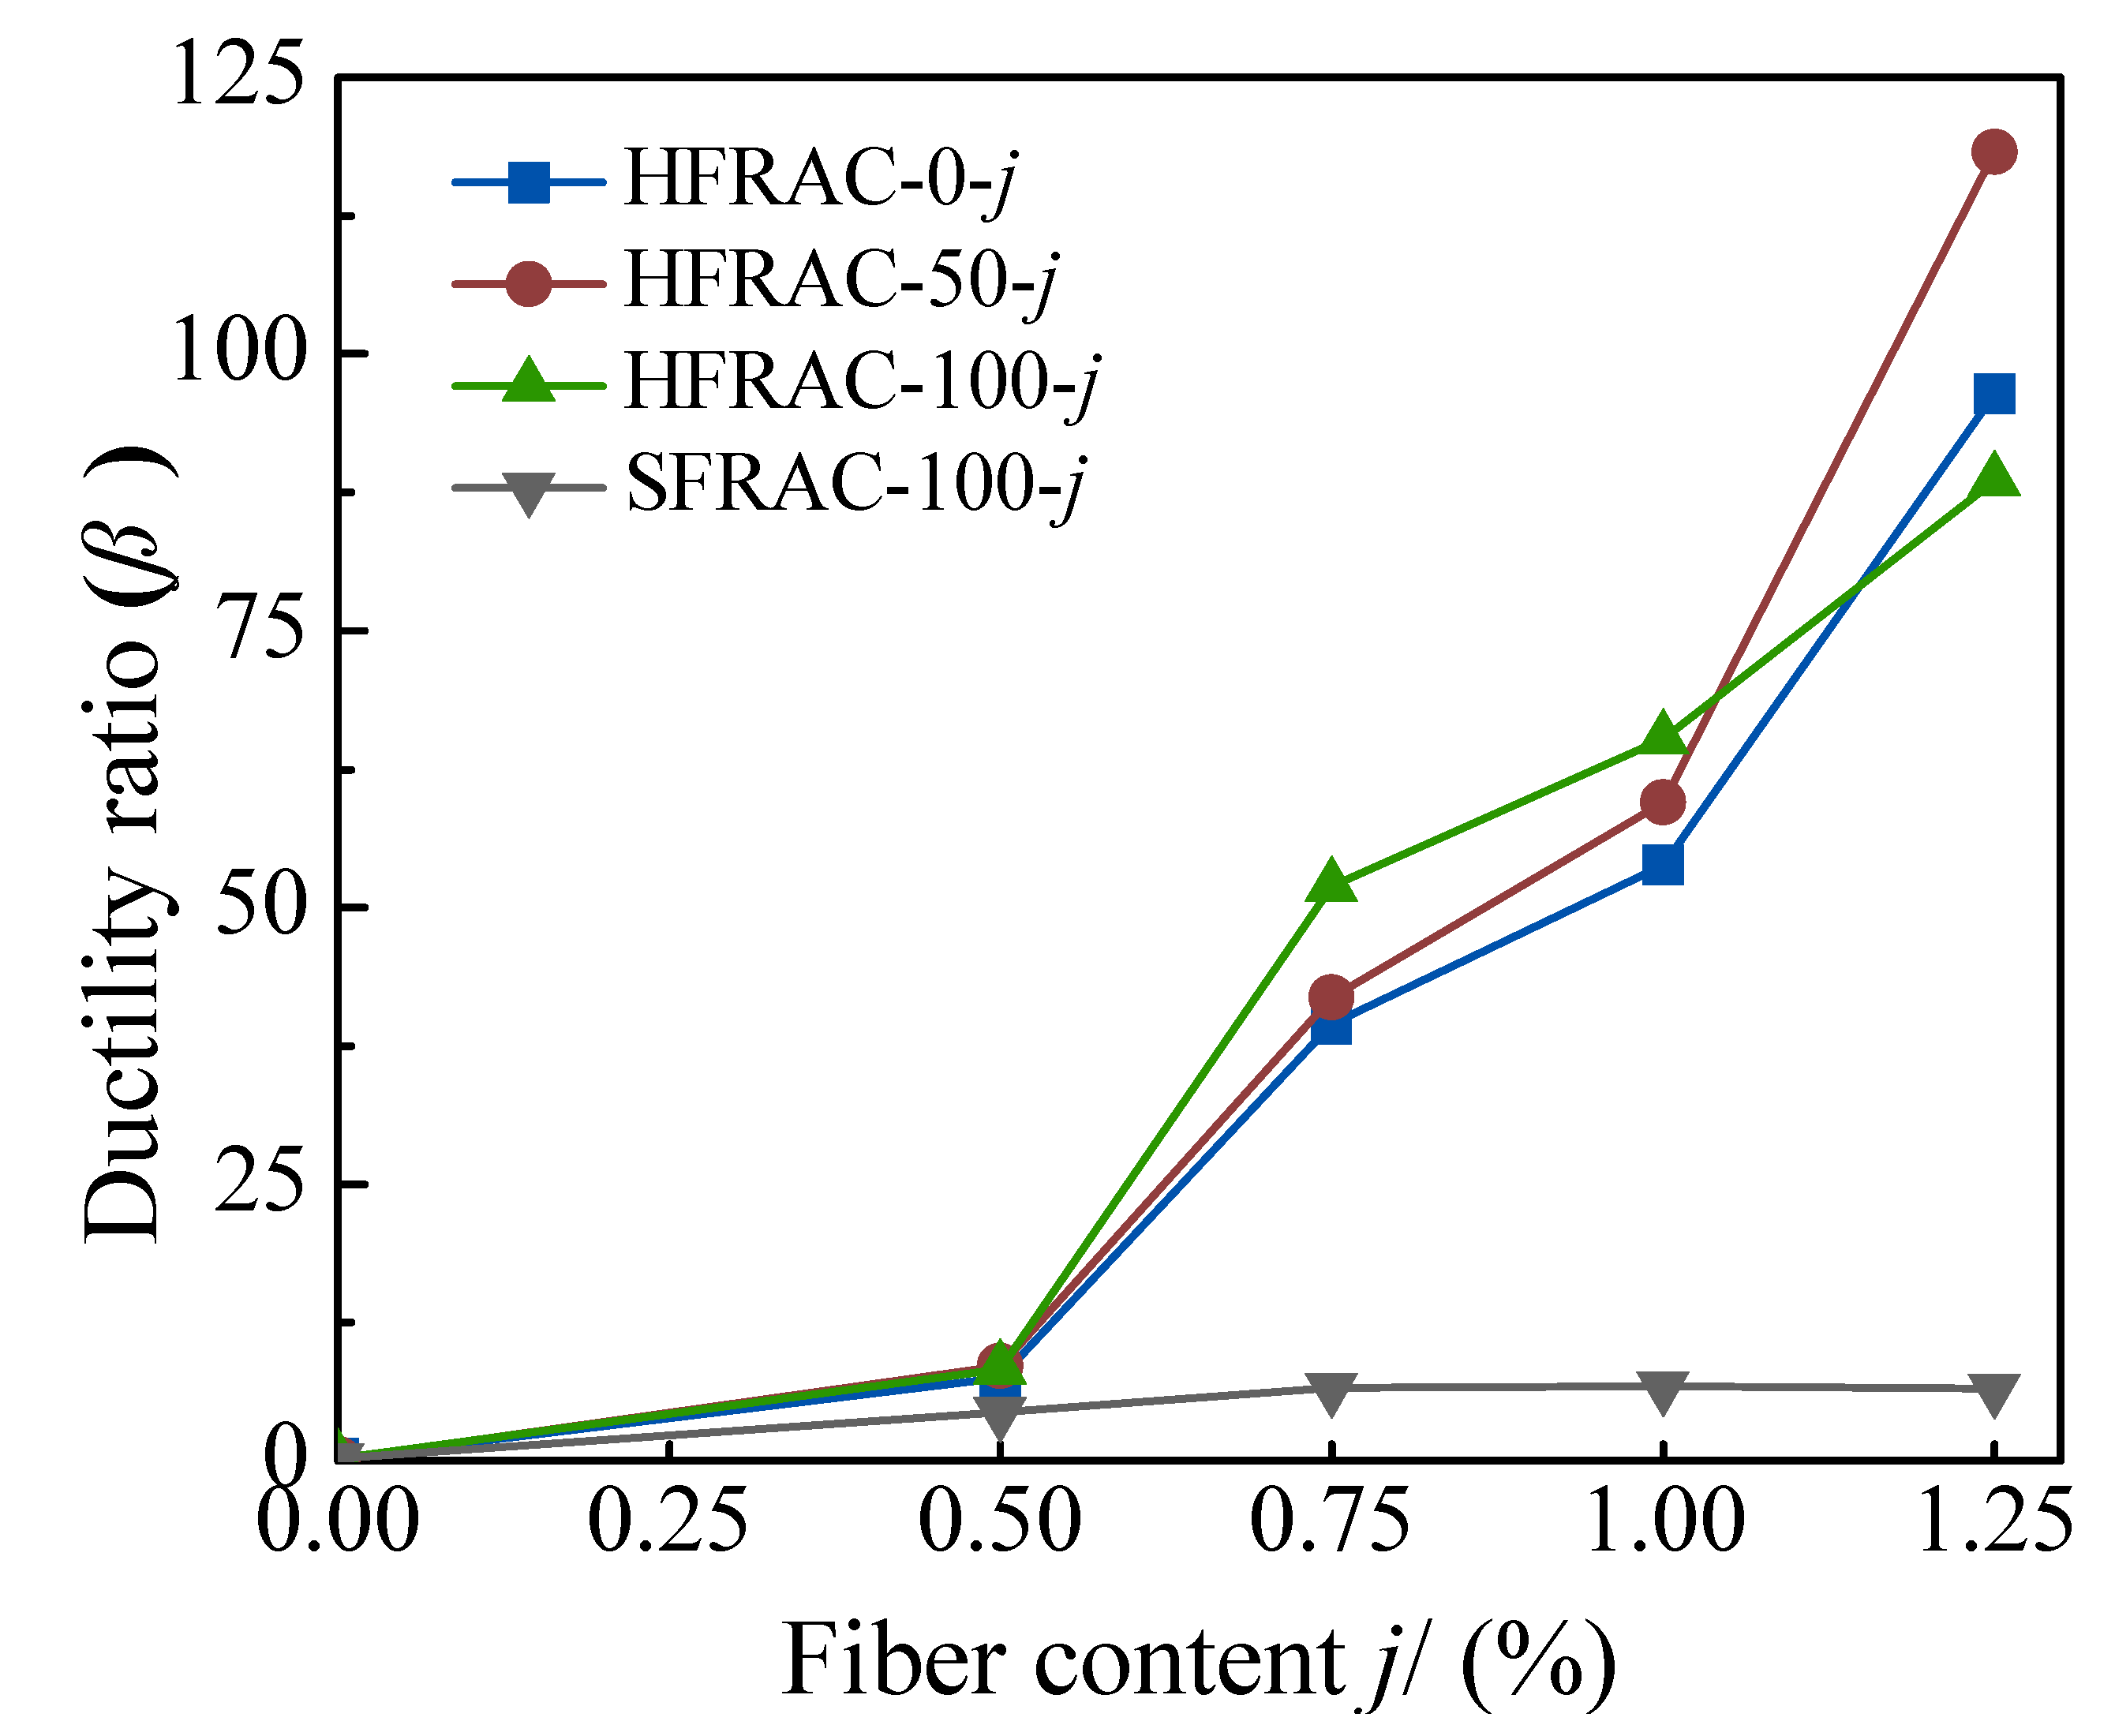
3.2. Impact Resistance
4. Probability Distribution Fitting Test
4.1. Log-Normal Distribution
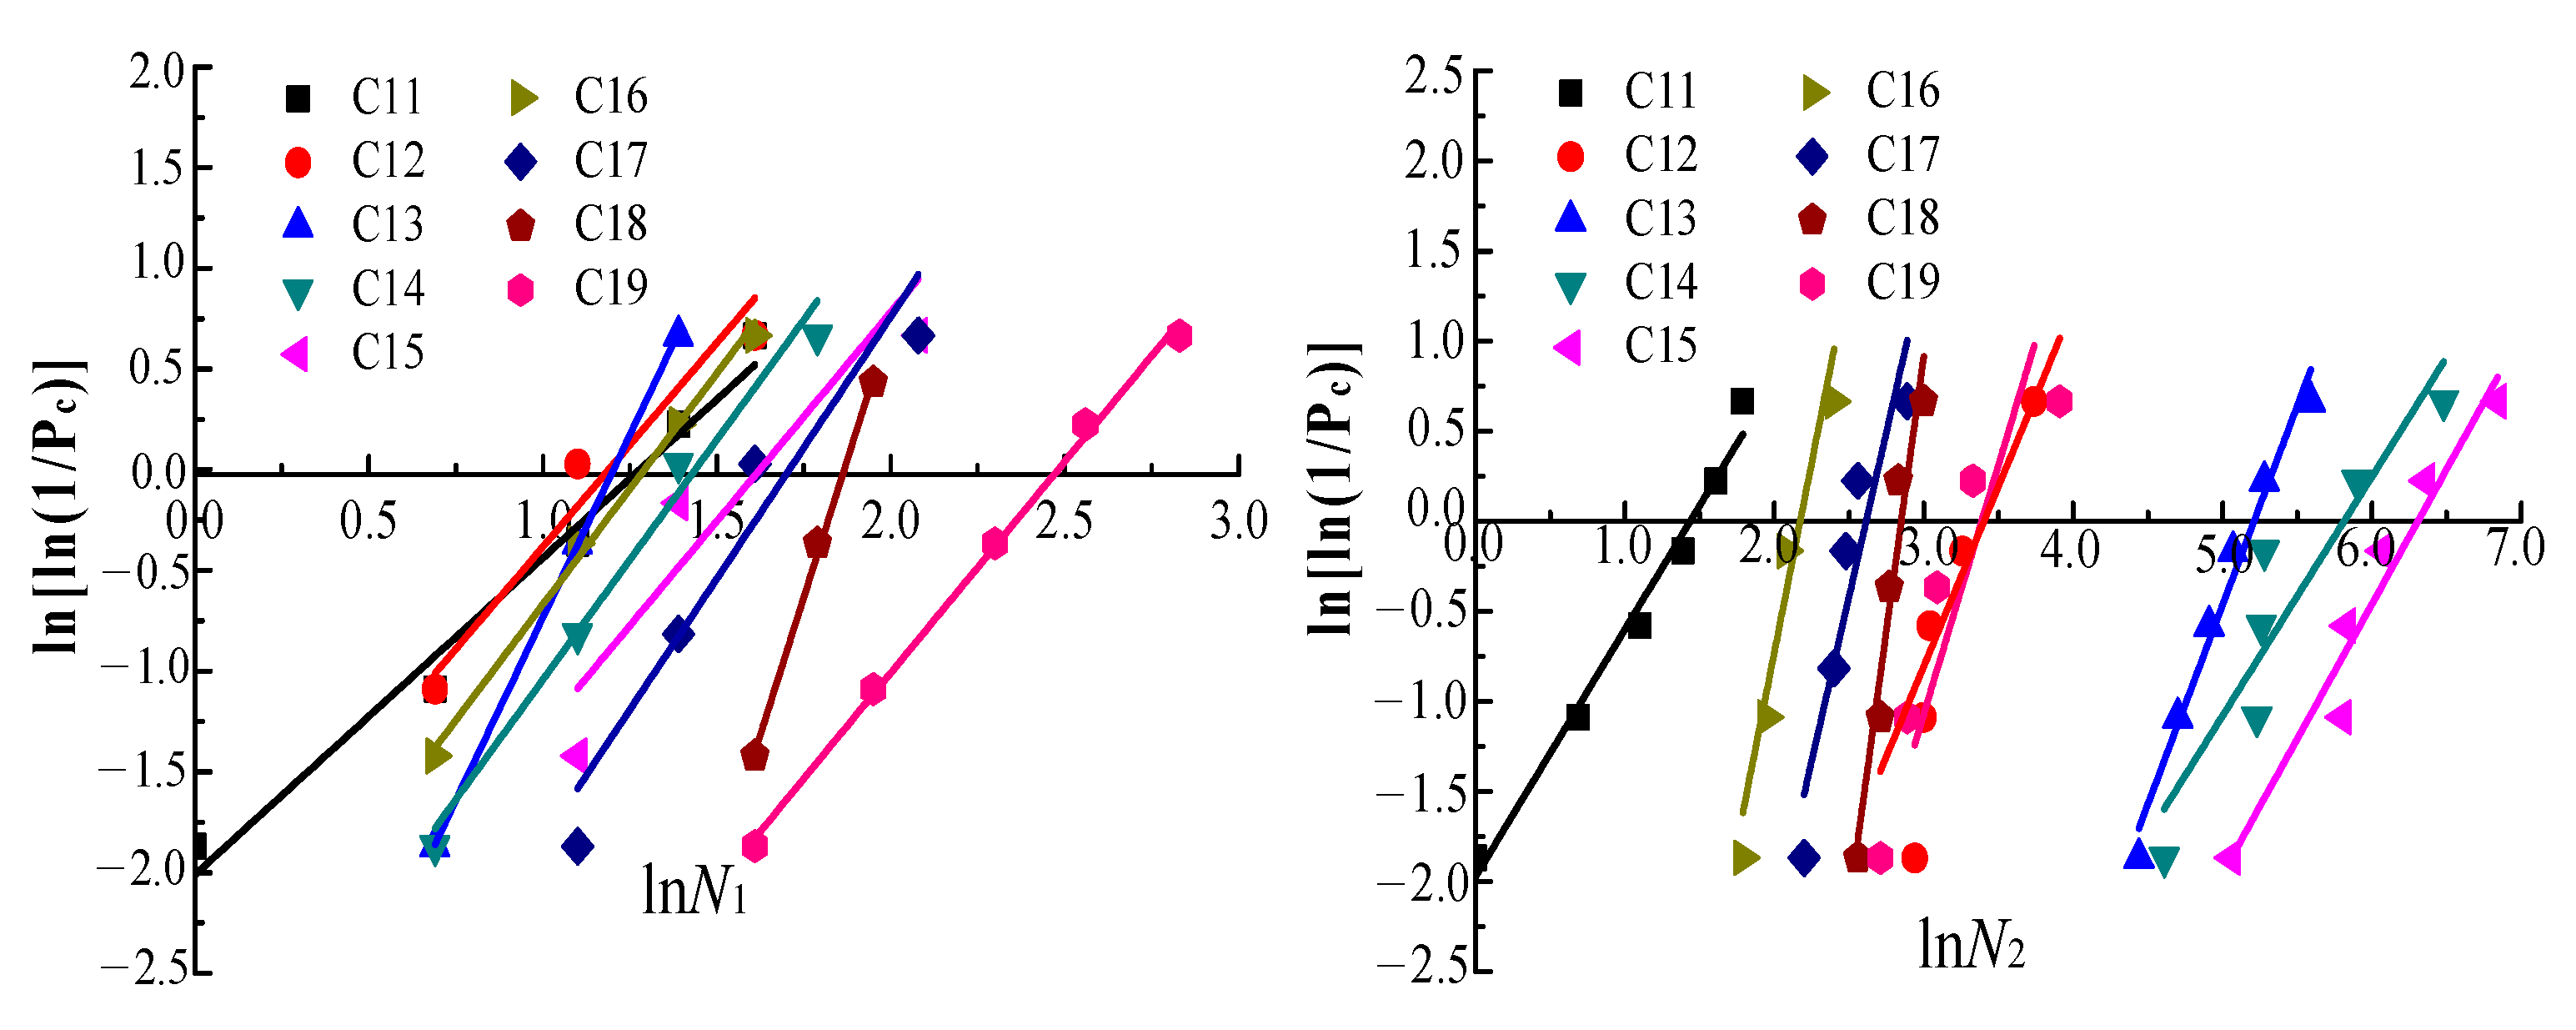
4.2. Two-Parameter Weibull Distribution
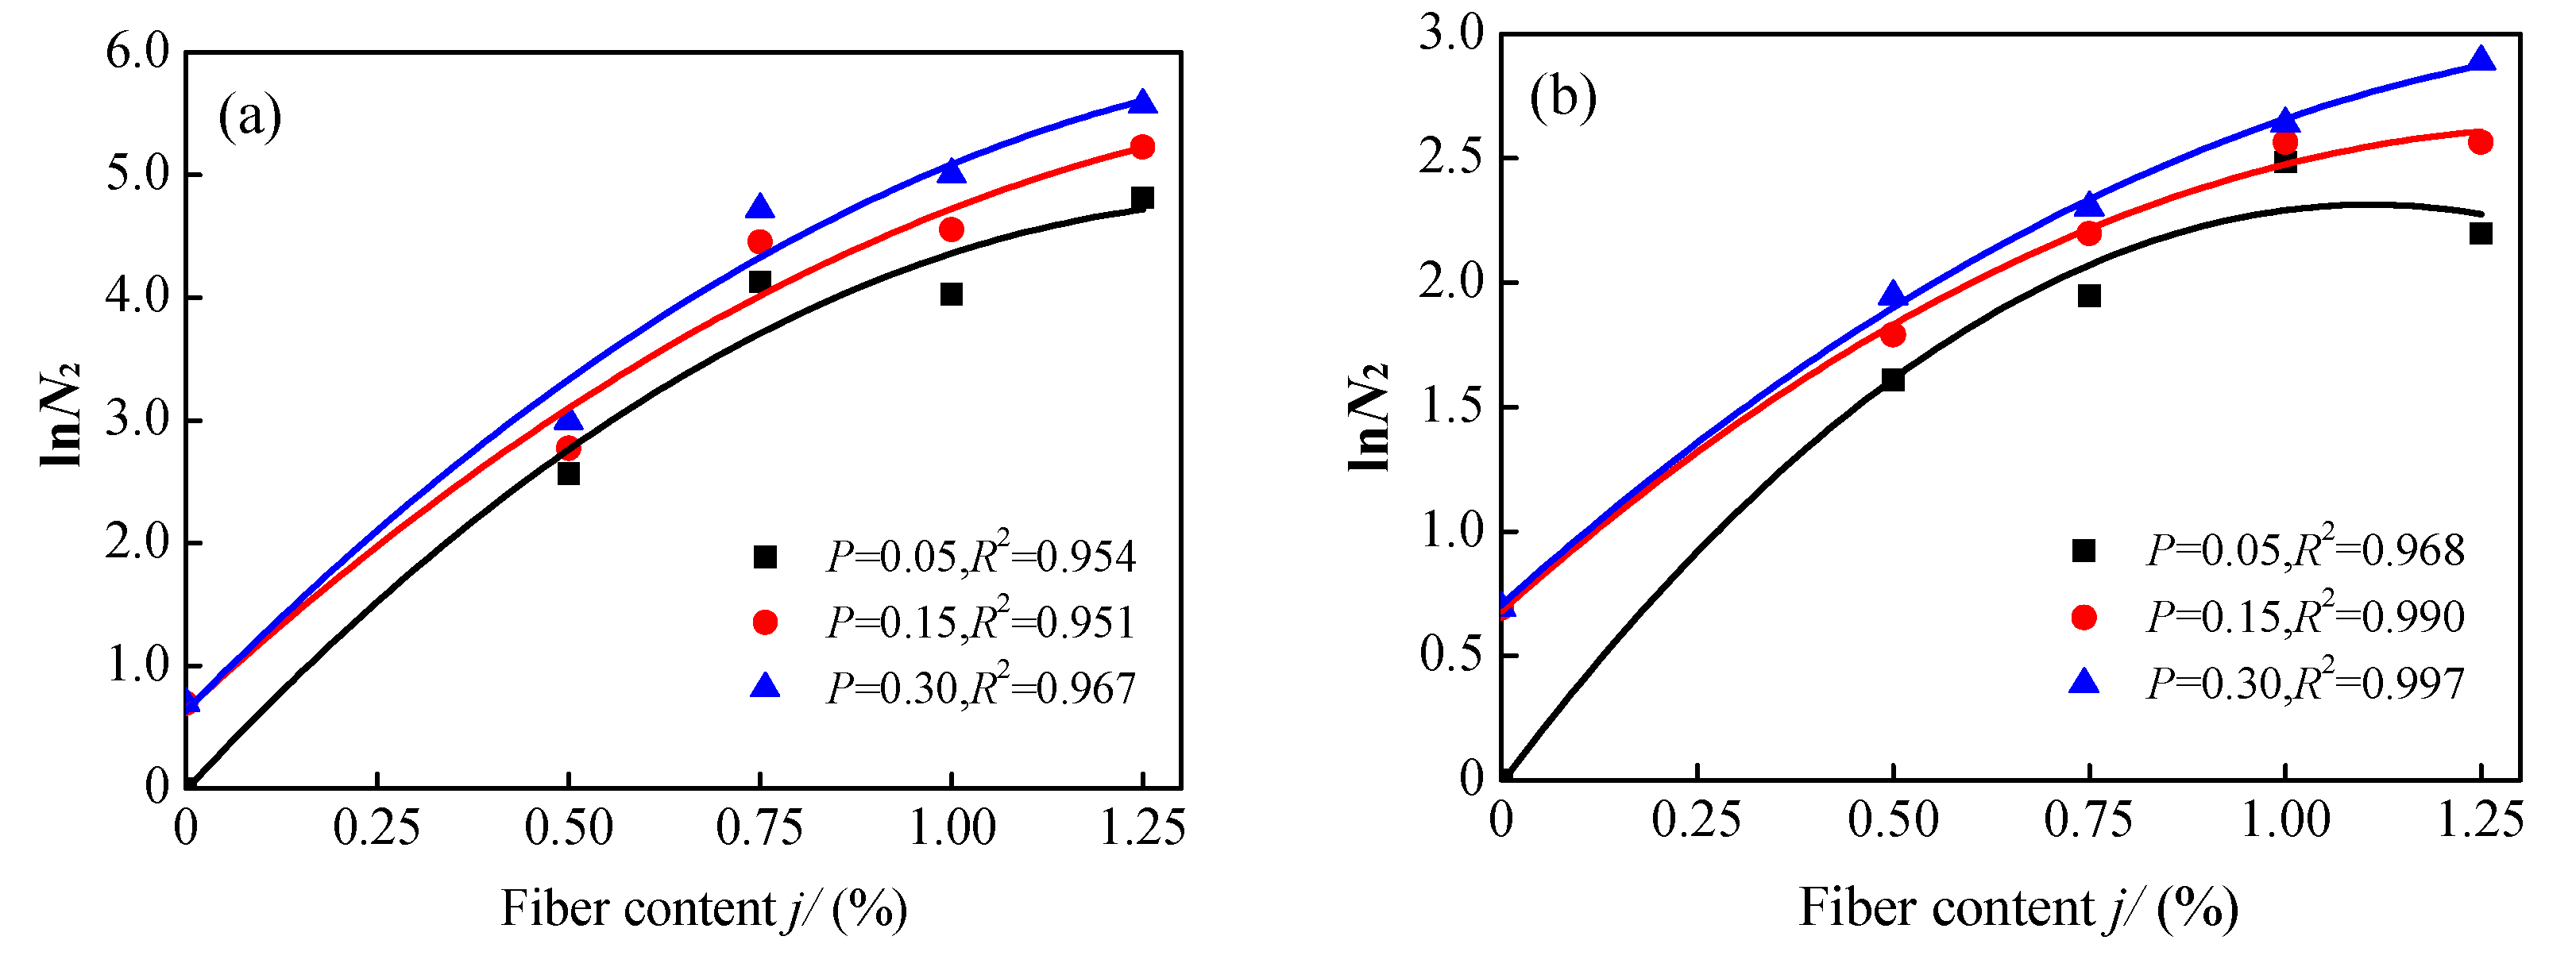
4.3. P–lnNi–Vf Curve of Impact Resistance
5. Conclusions
- (1)
- The compressive strength of RAC decreased with the increase in replacement rate of recycled aggregate. The compressive strength of RAC increased with the increase in steel fiber content. The compressive strength of RAC was not significantly affected by HPP fiber content. When the steel fiber content was 1.25%, the compressive strength of SFRAC-100-1.25 was increased by 19.6% and 13.2% compared with RAC-100 and HFRAC-100-1.25, respectively.
- (2)
- The impact resistance of RAC decreased with the increase in the replacement rate of recycled aggregate. The initial crack anti-impact energy consumption of RAC was significantly improved by adding steel fiber. The final crack anti-impact energy consumption of RAC was not significantly affected by steel fibers. The exact opposite result was obtained upon adding HPP fiber, whereby the final crack anti-impact energy consumption of RAC was significantly improved. When the HPP fiber content and the replacement rate of recycled aggregate were 1.25% and 50%, respectively, the maximum impact energy consumption of RAC was 114.5 times that of the plain RAC concrete specimen, and the maximum ductility ratio of the RAC matrix was 118.3.
- (3)
- The log-normal distribution and two-parameter Weibull distribution function were used to fit the impact test results of HFRAC and SFRAC. The test results were in good compliance with the log-normal distribution and two-parameter Weibull distribution. The log-normal distribution function was more suitable for fitting the shock resistance times of HFRAC and SFRAC distribution characteristics. Under different failure probabilities, the final crack resistance times of HFRAC and SFRAC specimens exhibited a quadratic linear relationship to their fiber volume content.
Author Contributions
Funding
Institutional Review Board Statement
Informed Consent Statement
Data Availability Statement
Conflicts of Interest
References
- Xu, G.; Shen, W.; Zhang, B.; Li, Y.; Ji, X.; Ye, Y. Properties of recycled aggregate concrete prepared with scattering-filling coarse aggregate process. Cem. Concr. Compos. 2018, 93, 19–29. [Google Scholar] [CrossRef]
- Luo, S.R.; Zheng, X.; Huang, H.S. Experimental study on pretreatment of creep behavior of recycled coarse aggregate and creep behavior of recycled aggregate concrete. J. Build. Mater. 2016, 19, 242–247. [Google Scholar]
- Wang, Y.; Hughes, P.; Niu, H.; Fan, Y. A new method to improve the properties of recycled aggregate concrete: Composite addition of basalt fiber and nano-silica. J. Clean. Prod. 2019, 236, 117602. [Google Scholar] [CrossRef]
- Zou, C.H.; Chen, Z.P. Mechanical properties of recycled concrete made with different types of coarse aggregate. Constr. Build. Mater. 2017, 134, 497–506. [Google Scholar] [CrossRef]
- Mohammed, S.I.; Najim, K.B. Mechanical strength, flexural behavior and fracture energy of Recycled Concrete Aggregate self-compacting concrete. Structures 2019, 23, 34–43. [Google Scholar] [CrossRef]
- Debieb, F.; Courard, L.; Kenai, S.; Degeimbre, R. Mechanical and durability properties of concrete using contaminated recycled aggregates. Cem. Concr. Compos. 2010, 32, 421–426. [Google Scholar] [CrossRef]
- Mudadu, A.; Tiberti, G.; Germano, F.; Plizzari, G.A.; Morbi, A. The effect of fiber orientation on the post-cracking behavior of steel fiber reinforced concrete under bending and uniaxial tensile tests. Cem. Concr. Compos. 2018, 93, 274–288. [Google Scholar] [CrossRef]
- Teng, S.; Afroughsabet, V.; Ostertag, C.P. Flexural behavior and durability properties of high performance hybrid-fiber-reinforced concrete. Constr. Build. Mater. 2018, 182, 504–515. [Google Scholar] [CrossRef]
- Yu, J.C.; Zhao, Q.X. Effect of steel fiber on creep behavior of concrete. J. Chin. Ceram. Soc. 2013, 41, 1087–1093. [Google Scholar]
- Das, C.S.; Dey, T.; Dandapat, R.; Mukharjee, B.B.; Kumar, J. Performance evaluation of polypropylene fibre reinforced recycled aggregate concrete. Constr. Build. Mater. 2018, 189, 649–659. [Google Scholar] [CrossRef]
- Yin, S.; Chen, F.B.; Min, R.; Dandapat, R. High strength macro synthetic fibre concrete international projects project cases. China Concr. Cem. Prod. 2018, 6, 51–55. [Google Scholar]
- Li, D.; Liu, S. Macro polypropylene fiber influences on crack geometry and water permeability of concrete. Constr. Build. Mater. 2020, 231, 117128. [Google Scholar] [CrossRef]
- Ding, Y.N.; Cao, J.F. Experiment study of behaviour of modified macro-polypropylene fiber reinforced high performance concrete. J. Dalian Univ. Technol. 2007, 47, 707–711. [Google Scholar]
- Kazmi, S.M.S.; Munir, M.J.; Wu, Y.-F.; Patnaikuni, I. Effect of macro-synthetic fibers on the fracture energy and mechanical behavior of recycled aggregate concrete. Constr. Build. Mater. 2018, 189, 857–868. [Google Scholar] [CrossRef]
- Deng, Z.; Li, J. Mechanical behaviors of concrete combined with steel and synthetic macro-fibers. Int. J. Phys. Sci. 2006, 1, 57–66. [Google Scholar] [CrossRef]
- Behfarnia, K.; Behravan, A. Application of high performance polypropylene fibers in concrete lining of water tunnels. Mater. Des. 2014, 55, 274–279. [Google Scholar] [CrossRef]
- Zhu, H.B.; Wu, K.F.; Li, J.S.; Roesler, J.R. Effect of synthetic fibers on mechanical proportion of fiber reinforced concrete. J. Tongji Univ. Nat. Sci. Ed. 2016, 44, 1894–1901. [Google Scholar]
- AI Rikabi, F.T.; Sargand, S.M.; Khoury, I.; Roesler, J.R. Material properties of synthetic fiber-reinforced concrete under freeze-thaw conditions. J. Mater. Civ. Eng. 2018, 30, 04018090. [Google Scholar] [CrossRef]
- Kazmi, S.M.S.; Munir, M.J.; Wu, Y.-F.; Patnaikuni, I.; Zhou, Y.; Xing, F. Axial stress-strain behavior of macro-synthetic fiber reinforced recycled aggregate concrete. Cem. Concr. Compos. 2019, 97, 341–356. [Google Scholar] [CrossRef]
- GB/T50081–2002; Standard for Mechanical Properties Test of Ordinary Concrete. National Standard of the People’s Republic of China. Architectural Industry Press: Beijing, China, 2003.
- ACI544.2R-89; Measurement of Properties of Fiber Reinforced Concrete. American Concrete Institute: Detroit, MI, USA, 1999; pp. 6–7.
- CECS13-2009; Standard Test Methods for Fiber Reinforced Concrete. China Association for Engineering Construction Standardization. China Plans Publishing House: Beijing, China, 2010; p. 114.
- Hasan, M.J.; Afroz, M.; Mahmud, H.M.I. An experimental investigation on mechanical behavior of macro synthetic fiber reinforced concrete. Int. J. Civ. Environ. Eng. 2013, 11, 18–23. [Google Scholar]
- Yao, W.; Ma, Y.P.; Tan, M.H. Effects of polypropylene fibers on the physical and mechanical properties of cement based composites(II)-mechanical properties. Constr. Build. Mater. 2000, 3, 235–239. [Google Scholar]
- Kong, X.Q.; He, W.C.; Xing, L.L.; Patnaikuni, I. Effect of steel fiber-polypropylene fiber hybrid additon on impact resistance of recycled aggregate concrete. Acta Mater. Compos. Sin. 2020, 37, 1763–1773. [Google Scholar]
- Li, J.J.; Niu, J.G.; Wan, C.J.; Jin, B.; Yin, Y.L. Investigation on mechanical properties and microstructure of high performance polypropylene fiber reinforced lightweight aggregate concrete. Constr. Build. Mater. 2016, 118, 27–35. [Google Scholar] [CrossRef]
- Pan, H.M.; Ma, Y.C. Impact resistance of steel fiber reinforced concrete and its mechanism crack resistance and toughening. J. Build. Mater. 2017, 20, 956–961. [Google Scholar]
- Zhu, X.C. Study on the Test Method for Impact Resistance of Cement Concrete; Tianjin University: Tianjin, China, 2016. [Google Scholar]
- Wang, L.C.; Wang, H.T.; Liu, H.Y. Experimental study and statistical evaluation for impact resistance of steel fiber reinforced lightweight aggregate concrete. J. Dalian Univ. Technol. 2010, 50, 557–563. [Google Scholar]
- Rahmani, T.; Kiani, B.; Shekarchizadeh, M.; Safari, A. Statistical and experimental analysis on the behavior of fiber reinforced concretes subjected to drop weight test. Constr. Build. Mater. 2012, 37, 360–369. [Google Scholar] [CrossRef]
- Weibull, W. A Statistical Distribution Function of Wide Applicability. J. Appl. Mech. 1951, 18, 293–297. [Google Scholar] [CrossRef]
- Chen, X.Y. Experimental Research on Impact Resistance of Fiber Reinforced Concrete; Dalian University of Technology: Dalian, China, 2010. [Google Scholar]


| Fiber Type | Length (mm) | Diameter (mm) | Aspect Ratio | Density (kg·m−3) | Tensile Strength (MPa) | Elastic Modulus (GPa) | Shape |
|---|---|---|---|---|---|---|---|
| HPP fiber | 48 | 0.62 | 77.42 | 960 | 600 | 7–10 | Indentation |
| Steel fiber | 30 | 1.29 | 23.26 | 7800 | 590 | 201 | Corrugated |
| Number | Notation | Cement (kg·m−3) | Sand (kg·m−3) | Water (kg·m−3) | Coarse Aggregates (kg·m−3) | Water Reducer (kg·m−3) | Fiber Content (%) | ||
|---|---|---|---|---|---|---|---|---|---|
| Nature | Recycled | HPP | SF | ||||||
| C1 | RAC-0-0 | 410 | 719 | 166 | 1072 | \ | 2.1 | 0 | \ |
| C2 | HFRAC-0-0.5 | 410 | 719 | 166 | 1072 | \ | 2.1 | 0.5% | \ |
| C3 | HFRAC-0-0.75 | 410 | 719 | 166 | 1072 | \ | 2.1 | 0.75% | \ |
| C4 | HFRAC-0-1.0 | 410 | 719 | 166 | 1072 | \ | 2.1 | 1.0% | \ |
| C5 | HFRAC-0-1.25 | 410 | 719 | 166 | 1072 | \ | 2.1 | 1.25% | \ |
| C6 | RAC-50-0 | 410 | 719 | 166 | 536 | 536 | 2.1 | 0 | \ |
| C7 | HFRAC-50-0.5 | 410 | 719 | 166 | 536 | 536 | 2.1 | 0.5% | \ |
| C8 | HFRAC-50-0.75 | 410 | 719 | 166 | 536 | 536 | 2.1 | 0.75% | \ |
| C9 | HFRAC-50-1.0 | 410 | 719 | 166 | 536 | 536 | 2.1 | 1.0% | \ |
| C10 | HFRAC-50-1.25 | 410 | 719 | 166 | 536 | 536 | 2.1 | 1.25% | \ |
| C11 | RAC-100-0 | 410 | 719 | 166 | \ | 1072 | 2.1 | 0 | \ |
| C12 | HFRAC-100-0.5 | 410 | 719 | 166 | \ | 1072 | 2.1 | 0.5% | \ |
| C13 | HFRAC-100-0.75 | 410 | 719 | 166 | \ | 1072 | 2.1 | 0.75% | \ |
| C14 | HFRAC-100-1.0 | 410 | 719 | 166 | \ | 1072 | 2.1 | 1.0% | \ |
| C15 | HFRAC-100-1.25 | 410 | 719 | 166 | \ | 1072 | 2.1 | 1.25% | \ |
| C16 | SFRAC-100-0.5 | 410 | 719 | 166 | \ | 1072 | 2.1 | \ | 0.5% |
| C17 | SFRAC-100-0.75 | 410 | 719 | 166 | \ | 1072 | 2.1 | \ | 0.75% |
| C18 | SFRAC-100-1.0 | 410 | 719 | 166 | \ | 1072 | 2.1 | \ | 1.0% |
| C19 | SFRAC-100-1.25 | 410 | 719 | 166 | \ | 1072 | 2.1 | \ | 1.25% |
| Number | Notation | fcu (MPa) | Specimen Number | Average Value N1/N2 | Wi/J W1/W2 | β | |||||
|---|---|---|---|---|---|---|---|---|---|---|---|
| 1 | 2 | 3 | 4 | 5 | 6 | ||||||
| N1/N2 | N1/N2 | N1/N2 | N1/N2 | N1/N2 | N1/N2 | ||||||
| C1 | RAC-0-0 | 50.1 | 5/6 | 5/5 | 4/6 | 5/7 | 5/5 | 3/3 | 4.5/5.3 | 60.5/71.7 | 0.18 |
| C2 | HFRAC-0-0.5 | 49.3 | 4/33 | 3/26 | 3/18 | 3/16 | 3/11 | \ | 3.2/20.8 | 43.0/279.5 | 5.50 |
| C3 | HFRAC-0-0.75 | 48.5 | 3/51 | 3/142 | 7/220 | 5/256 | 6/243 | 2/132 | 4.3/174.0 | 58.2/2337.8 | 39.47 |
| C4 | HFRAC-0-1.0 | 52.1 | 5/178 | 5/380 | 3/73 | 3/390 | 5/130 | \ | 4.2/230.2 | 56.4/3092.9 | 53.81 |
| C5 | HFRAC-0-1.25 | 50.0 | 4/368 | 5/652 | 7/616 | 4/397 | 4/361 | 5/412 | 4.8/467.7 | 64.5/6274.5 | 96.44 |
| C6 | RAC-50-0 | 47.9 | 4/5 | 3/3 | 5/5 | 2/2 | 4/4 | 4/6 | 3.6/4.1 | 49.3/56.0 | 0.14 |
| C7 | HFRAC-50-0.5 | 48.3 | 3/60 | 3/18 | 3/14 | 3/30 | 3/18 | 3/32 | 3.0/28.6 | 40.3/384.3 | 8.53 |
| C8 | HFRAC-50-0.75 | 46.4 | 5/174 | 3/105 | 3/103 | 3/285 | 3/48 | 3/135 | 3.3/141.6 | 44.8/1903.4 | 41.91 |
| C9 | HFRAC-50-1.0 | 47.8 | 5/332 | 3/153 | 3/140 | 3/385 | 6/200 | 4/154 | 4.0/242.0 | 53.7/3251.5 | 59.50 |
| C10 | HFRAC-50-1.25 | 49.0 | 3/352 | 8/601 | 3/235 | 3/650 | 3/475 | 3/551 | 4.0/477.3 | 53.7/6412.9 | 118.3 |
| C11 | RAC-100-0 | 44.5 | 1/2 | 4/5 | 3/4 | 2/2 | 3/3 | 5/6 | 3.0/3.7 | 40.3/49.7 | 0.23 |
| C12 | HFRAC-100-0.5 | 45.8 | 3/42 | 2/19 | 2/26 | 5/20 | 3/28 | 2/21 | 2.8 /26.0 | 38.1/349.3 | 8.29 |
| C13 | HFRAC-100-0.75 | 46.0 | 3/135 | 2/85 | 3/196 | 3/268 | 3/110 | 4/159 | 3.0/158.8 | 40.3/2134.1 | 51.94 |
| C14 | HFRAC-100-1.0 | 46.7 | 2/196 | 3/100 | 6/192 | 3/187 | 4/365 | 3/351 | 3.5/231.8 | 47.0/3114.4 | 65.23 |
| C15 | HFRAC-100-1.25 | 46.2 | 3/634 | 8/342 | 4/329 | 4/431 | 4/579 | 3/157 | 4.6/412.0 | 61.8/5535.5 | 88.57 |
| C16 | SFRAC-100-0.5 | 48.2 | 2/7 | 4/8 | 3/8 | 3/6 | 3/8 | 5/11 | 3.3/8.0 | 44.8/107.5 | 1.40 |
| C17 | SFRAC-100-0.75 | 49.5 | 8/18 | 3/13 | 4/11 | 5/11 | 5/9 | 4/12 | 4.8/12.3 | 64.9/165.7 | 1.55 |
| C18 | SFRAC-100-1.0 | 52.3 | 7/17 | 6/15 | 5/16 | 6/16 | 7/20 | 5/13 | 6.0/16.2 | 80.6/217.2 | 1.69 |
| C19 | SFRAC-100-1.25 | 53.2 | 5/15 | 17/26 | 10/22 | 7/20 | 13/22 | 10/50 | 10.3/25.8 | 138.8/347.1 | 1.50 |
| Number | Notation | N1 | N2 | ||||
|---|---|---|---|---|---|---|---|
| α1 | β1 | R2 | α1 | β1 | R2 | ||
| C11 | RAC-100-0 | 1.295 | 1.271 | 0.918 | 1.590 | 1.910 | 0.982 |
| C12 | HFRAC-100-0.5 | 1.857 | 1.803 | 0.972 | 2.445 | 7.868 | 0.853 |
| C13 | HFRAC-100-0.75 | 2.998 | 3.238 | 0.976 | 1.886 | 9.426 | 0.997 |
| C14 | HFRAC-100-1.0 | 2.019 | 2.511 | 0.988 | 1.146 | 6.259 | 0.888 |
| C15 | HFRAC-100-1.25 | 1.862 | 2.617 | 0.868 | 1.470 | 8.712 | 0.881 |
| C16 | SFRAC-100-0.5 | 1.998 | 2.181 | 0.998 | 3.600 | 7.434 | 0.955 |
| C17 | SFRAC-100-0.75 | 2.246 | 3.436 | 0.949 | 3.178 | 7.906 | 0.897 |
| C18 | SFRAC-100-1.0 | 4.642 | 8.278 | 0.996 | 5.178 | 14.360 | 0.937 |
| C19 | SFRAC-100-1.25 | 1.765 | 3.986 | 0.991 | 1.752 | 5.554 | 0.894 |
| Number | Notation | N1 | N2 | ||||
|---|---|---|---|---|---|---|---|
| α2 | β2 | R2 | α2 | β2 | R2 | ||
| C11 | RAC-100-0 | 1.573 | 2.011 | 0.974 | 1.843 | 2.680 | 0.995 |
| C12 | HFRAC-100-0.5 | 2.027 | 2.410 | 0.940 | 2.769 | 9.380 | 0.757 |
| C13 | HFRAC-100-0.75 | 3.628 | 4.363 | 0.998 | 2.213 | 11.530 | 0.973 |
| C14 | HFRAC-100-1.0 | 2.382 | 3.424 | 0.975 | 1.328 | 7.718 | 0.837 |
| C15 | HFRAC-100-1.25 | 2.076 | 3.370 | 0.774 | 1.781 | 11.027 | 0.932 |
| C16 | SFRAC-100-0.5 | 2.296 | 2.966 | 0.994 | 4.215 | 9.163 | 0.896 |
| C17 | SFRAC-100-0.75 | 2.602 | 4.444 | 0.895 | 3.650 | 9.546 | 0.837 |
| C18 | SFRAC-100-1.0 | 5.463 | 10.194 | 0.997 | 6.088 | 17.352 | 0.916 |
| C19 | SFRAC-100-1.25 | 2.099 | 5.207 | 0.996 | 2.001 | 6.808 | 0.809 |
| Number | Notation | Failure Probability P | |||||
|---|---|---|---|---|---|---|---|
| 5% | 15% | 30% | |||||
| N1 | N2 | N1 | N2 | N1 | N2 | ||
| C11 | RAC-100-0 | 1 | 1 | 1 | 2 | 2 | 2 |
| C12 | HFRAC-100-0.5 | 1 | 13 | 2 | 16 | 2 | 20 |
| C13 | HFRAC-100-0.75 | 2 | 62 | 2 | 86 | 2 | 112 |
| C14 | HFRAC-100-1.0 | 2 | 56 | 2 | 95 | 3 | 149 |
| C15 | HFRAC-100-1.25 | 2 | 123 | 2 | 186 | 3 | 263 |
| C16 | SFRAC-100-0.5 | 1 | 5 | 2 | 6 | 2 | 7 |
| C17 | SFRAC-100-0.75 | 2 | 7 | 3 | 9 | 4 | 10 |
| C18 | SFRAC-100-1.0 | 4 | 12 | 5 | 13 | 5 | 14 |
| C19 | SFRAC-100-1.25 | 4 | 9 | 5 | 13 | 7 | 18 |
Publisher’s Note: MDPI stays neutral with regard to jurisdictional claims in published maps and institutional affiliations. |
© 2022 by the authors. Licensee MDPI, Basel, Switzerland. This article is an open access article distributed under the terms and conditions of the Creative Commons Attribution (CC BY) license (https://creativecommons.org/licenses/by/4.0/).
Share and Cite
Zhang, T.; Wu, B.; Kong, X.; Fu, Y. Investigation of Impact Resistance of High-Performance Polypropylene Fiber-Reinforced Recycled Aggregate Concrete. Crystals 2022, 12, 669. https://doi.org/10.3390/cryst12050669
Zhang T, Wu B, Kong X, Fu Y. Investigation of Impact Resistance of High-Performance Polypropylene Fiber-Reinforced Recycled Aggregate Concrete. Crystals. 2022; 12(5):669. https://doi.org/10.3390/cryst12050669
Chicago/Turabian StyleZhang, Tingting, Bojian Wu, Xiangqing Kong, and Ying Fu. 2022. "Investigation of Impact Resistance of High-Performance Polypropylene Fiber-Reinforced Recycled Aggregate Concrete" Crystals 12, no. 5: 669. https://doi.org/10.3390/cryst12050669
APA StyleZhang, T., Wu, B., Kong, X., & Fu, Y. (2022). Investigation of Impact Resistance of High-Performance Polypropylene Fiber-Reinforced Recycled Aggregate Concrete. Crystals, 12(5), 669. https://doi.org/10.3390/cryst12050669