Article

An Investigation of the Pressure-Induced Structural Phase Transition of Nanocrystalline α-CuMoO4

1
Department of Physics, Royal College, Mumbai 401107, India
2
CELLS-ALBA Synchrotron Light Facility, 08290 Barcelona, Spain
3
Departamento de Física Aplicada, Instituto de Ciencias de Materiales, Universidad de Valencia, 46100 Valencia, Spain
*
Author to whom correspondence should be addressed.
Crystals 2022, 12(3), 365; https://doi.org/10.3390/cryst12030365
Submission received: 1 March 2022 / Revised: 6 March 2022 / Accepted: 8 March 2022 / Published: 9 March 2022
(This article belongs to the Special Issue Pressure-Induced Phase Transformations (Volume II))

Abstract

:
The structural behavior of nanocrystalline α-CuMoO4 was studied at ambient temperature up to 2 GPa using in situ synchrotron X-ray powder diffraction. We found that nanocrystalline α-CuMoO4 undergoes a structural phase transition into γ-CuMoO4 at 0.5 GPa. The structural sequence is analogous to the behavior of its bulk counterpart, but the transition pressure is doubled. A coexistence of both phases was observed till 1.2 GPa. The phase transition gives rise to a change in the copper coordination from square-pyramidal to octahedral coordination. The transition involves a volume reduction of 13% indicating a first-order nature of the phase transition. This transformation was observed to be irreversible in nature. The pressure dependence of the unit-cell parameters was obtained and is discussed, and the compressibility analyzed.

1. Introduction

Nanomaterials play an important role in catalysis, optics, electricity, and other research fields due to their exclusive and typical characteristics. In the past decades, compared to bulk materials, their nanocrystalline counterparts have gained massive attention due to their novel properties such as thermal, electronic, and magnetic, owing to their specific shape, size, and surface to volume ratio. In addition to that, nanomaterials also find their application in the fields of biology, medicine, and chemical industry [1,2,3,4]. Metal molybdates (AMO4) are important inorganic materials which have gained enormous scientific importance due to their wide range of applicability, such as industrial catalysts, photoluminescence, microwave applications, optical fibers, humidity sensors, scintillator materials and due to their magnetic and electrochemical properties [5,6,7,8].
Among molybdates, CuMoO4 is the compound with a very complex polymorphism [9,10,11,12]. Till date, six different polymorphs of CuMoO4 have been identified in the literature: namely ambient condition α-CuMoO4 [9], high temperature β-CuMoO4 [10], low temperature γ-CuMoO4 [11], high pressure (HP) CuMoO4-II [12], distorted wolframite CuMoO4-III [13] and monoclinic ε-CuMoO4 [14]. Earlier, single-crystal high-pressure and low-temperature X-ray diffraction studies carried by Wiesmann et al. [15] found that phase α-CuMoO4 undergoes a structural phase transition to γ-CuMoO4. This occurs during cooling at 190 K at ambient pressure as well as under increasing pressure at 0.2 GPa and room temperature. Congruently, high pressure and low temperature optical-absorption measurements carried out by Rodriguez et al. [16] found that α-CuMoO4 undergoes a first-order transition at 0.25 GPa to γ-CuMoO4. They found the same transition by cooling α-CuMoO4 to 200 K at ambient pressure. The α to γ phase transition involves a change of part of the copper coordination polyhedra, from square-pyramidal (C4v) CuO5 in α-CuMoO4 to octahedral elongated (D4h) CuO6 in γ-CuMoO4. The transition also involves a volume drop of 13%.
Many of the applications of CuMoO4 involve its use in the form of nanoparticles [17,18,19]. However, the information available on the structural and mechanical properties of nanocrystalline CuMoO4 is scarce. It is known that the high-pressure (HP) behavior of materials could be different for nanoparticles than for bulk materials [20,21,22,23]. In particular, transition pressures and compressibilities could be affected when the particle size is reduced [20,21,22,23]. To explore the structural and mechanical properties of nanocrystalline CuMoO4 under compression, the performance of an HP X-ray diffraction (XRD) investigation is needed. However, such studies have not been carried out yet in nanocrystalline α-CuMoO4. In the present work we have investigated nanocrystalline α-CuMoO4 by high pressure powder X-ray diffraction up to a pressure of 2 GPa under hydrostatic conditions.

2. Experiment

CuMoO4 nanoparticles were prepared following the method reported by Hassani et al. [20]. The chemical composition of the obtained CuMoO4 nanoparticles was determined by energy-dispersive X-ray spectrometry (EDXS), which was recorded with a JEOL JEM-6700F device. A EDXS spectrum is shown in Figure 1. The analysis showed that the composition of the nanoparticles was 67 (3) atomic % oxygen, 16 (1) atomic % copper, and 17 (1) atomic % molybdenum, which agrees with the stoichiometry of CuMoO4.
Ambient conditions powder XRD (λ = 0.4246 Å) performed in the same set up as high-pressure measurements confirmed that CuMoO4 nanoparticles crystallize in the triclinic α polymorph (space group P 1 ¯ ). The average particle size was estimated from powder XRD using the Scherrer equation [24], to be 43 (7) nm. This value was confirmed using MAUD [25], which gave an average particle size of 40 (9) nm. Angle-dispersive powder HP-XRD measurements were performed at the BL04-MSPD beamline of ALBA synchrotron [26]. An incident monochromatic X-ray beam with a wavelength of 0.4246 Å was focused down to a spot size of 20 μm × 20 μm (FWHM). Two-dimensional (2D) XRD data were recorded using a Rayonix SX165 CCD detector. The 2D images were integrated into one-dimensional intensity versus 2θ patterns using Dioptas [27]. The sample-to-detector distance along with detector parameters were determined using a LaB6 calibrant. A pellet of CuMoO4 nanocrystalline powder was loaded into a Boehler-Almax diamond-anvil cell (DAC) with diamond culets of 500 μm using a T301 stainless-steel gasket, pre-indented to a thickness of 50 μm and with a sample chamber of 200 μm diameter in the center. As pressure-transmitting medium, we used a 4:1 methanol–ethanol to allow a direct comparison with previous HP studies performed in microscopic samples [15]. The pressure medium can be considered nearly hydrostatic within the pressure limit of the experiments [28]. Special attention was paid to occupy only a minor fraction on the pressure chamber with sample to avoid sample bridging between diamonds [29]. The pressure was determined using ruby fluorescence [30]. Small ruby spheres with a grain size of ~1 μm and concentration of 3000 ppm Cr3+ [31] were used for pressure calibration [31] based on the wavelength shift of the R1 fluorescence band of the trivalent Cr3+ [32,33]. The estimated relative error for all measured pressures was better than 1% [34]. The unit-cell parameters were initially determined using the Le Bail analysis incorporated in the GSAS software [35]. Using the same software, Rietveld analysis [36] was also carried out for the initial α-CuMoO4 phase and high pressure γ-CuMoO4 phase.

3. Results and Discussion

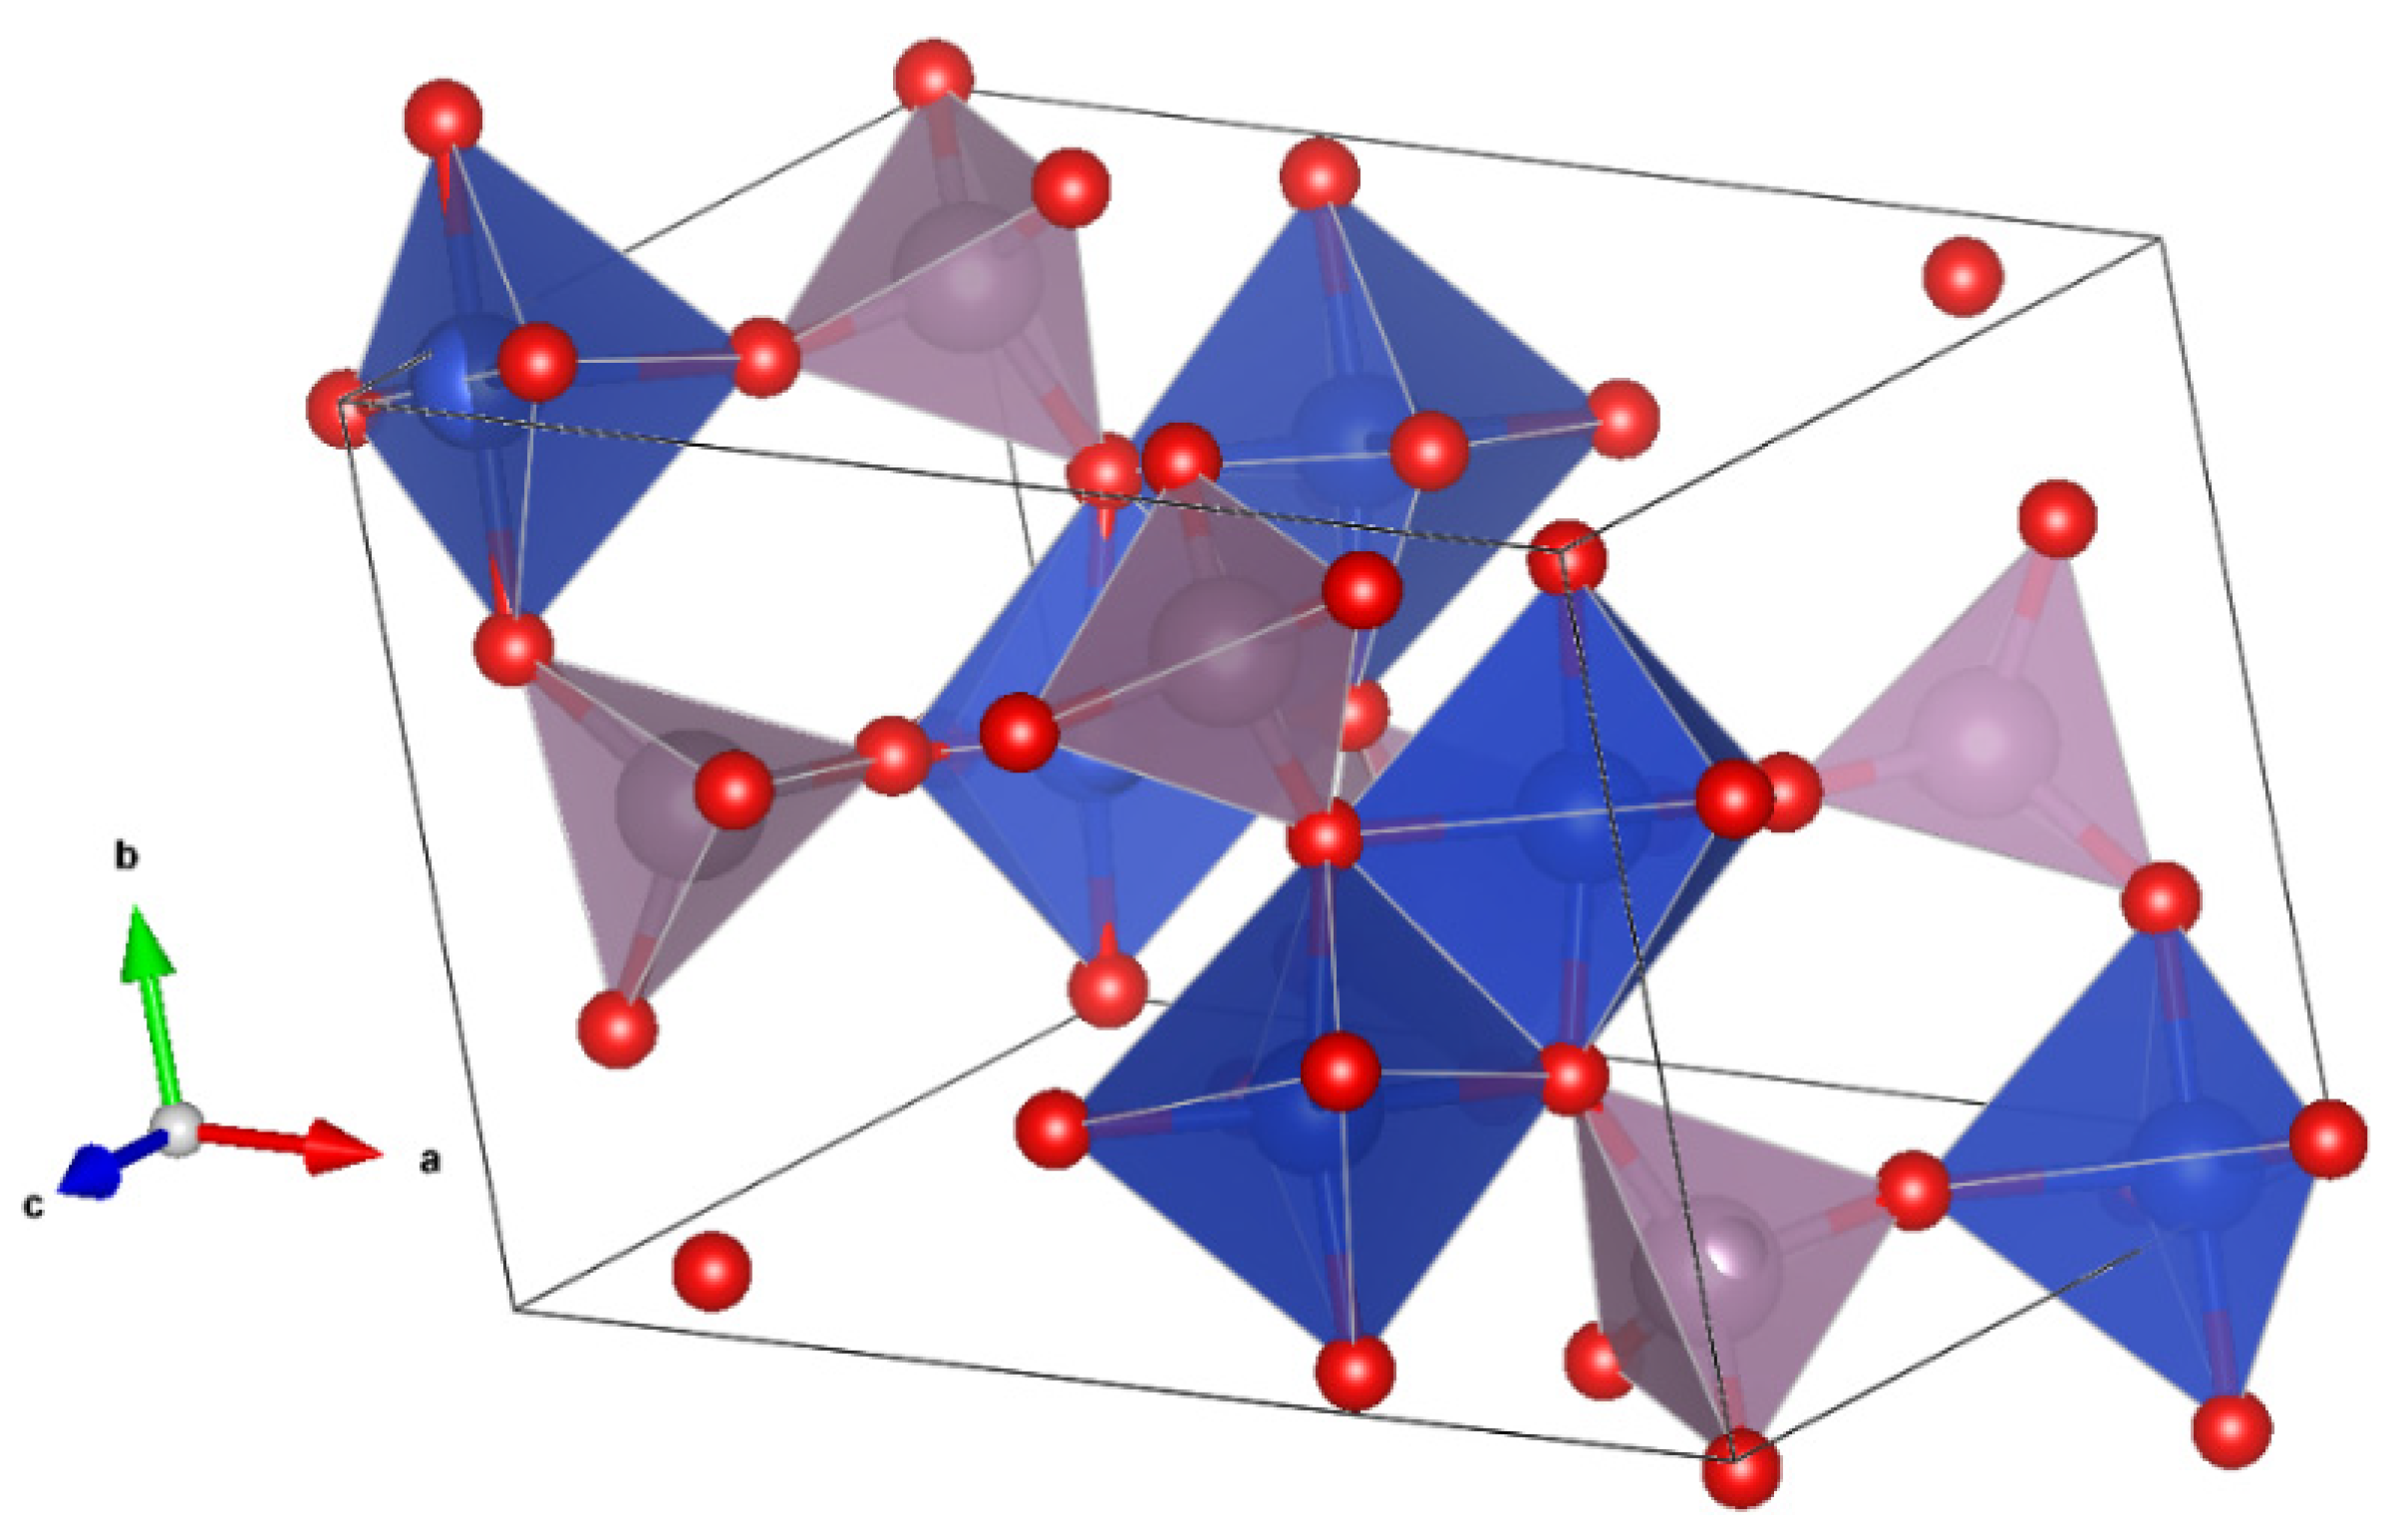
At ambient conditions, CuMoO4 crystallizes in a triclinic α-CuMoO4 structure (space group P 1 ¯ , Z = 6). The α-CuMoO4 structure can be described by MoO4 tetrahedra, CuO5 square pyramidal polyhedra, and CuO6 distorted octahedra, interconnected via common corners and edges forming layers as shown in Figure 2.
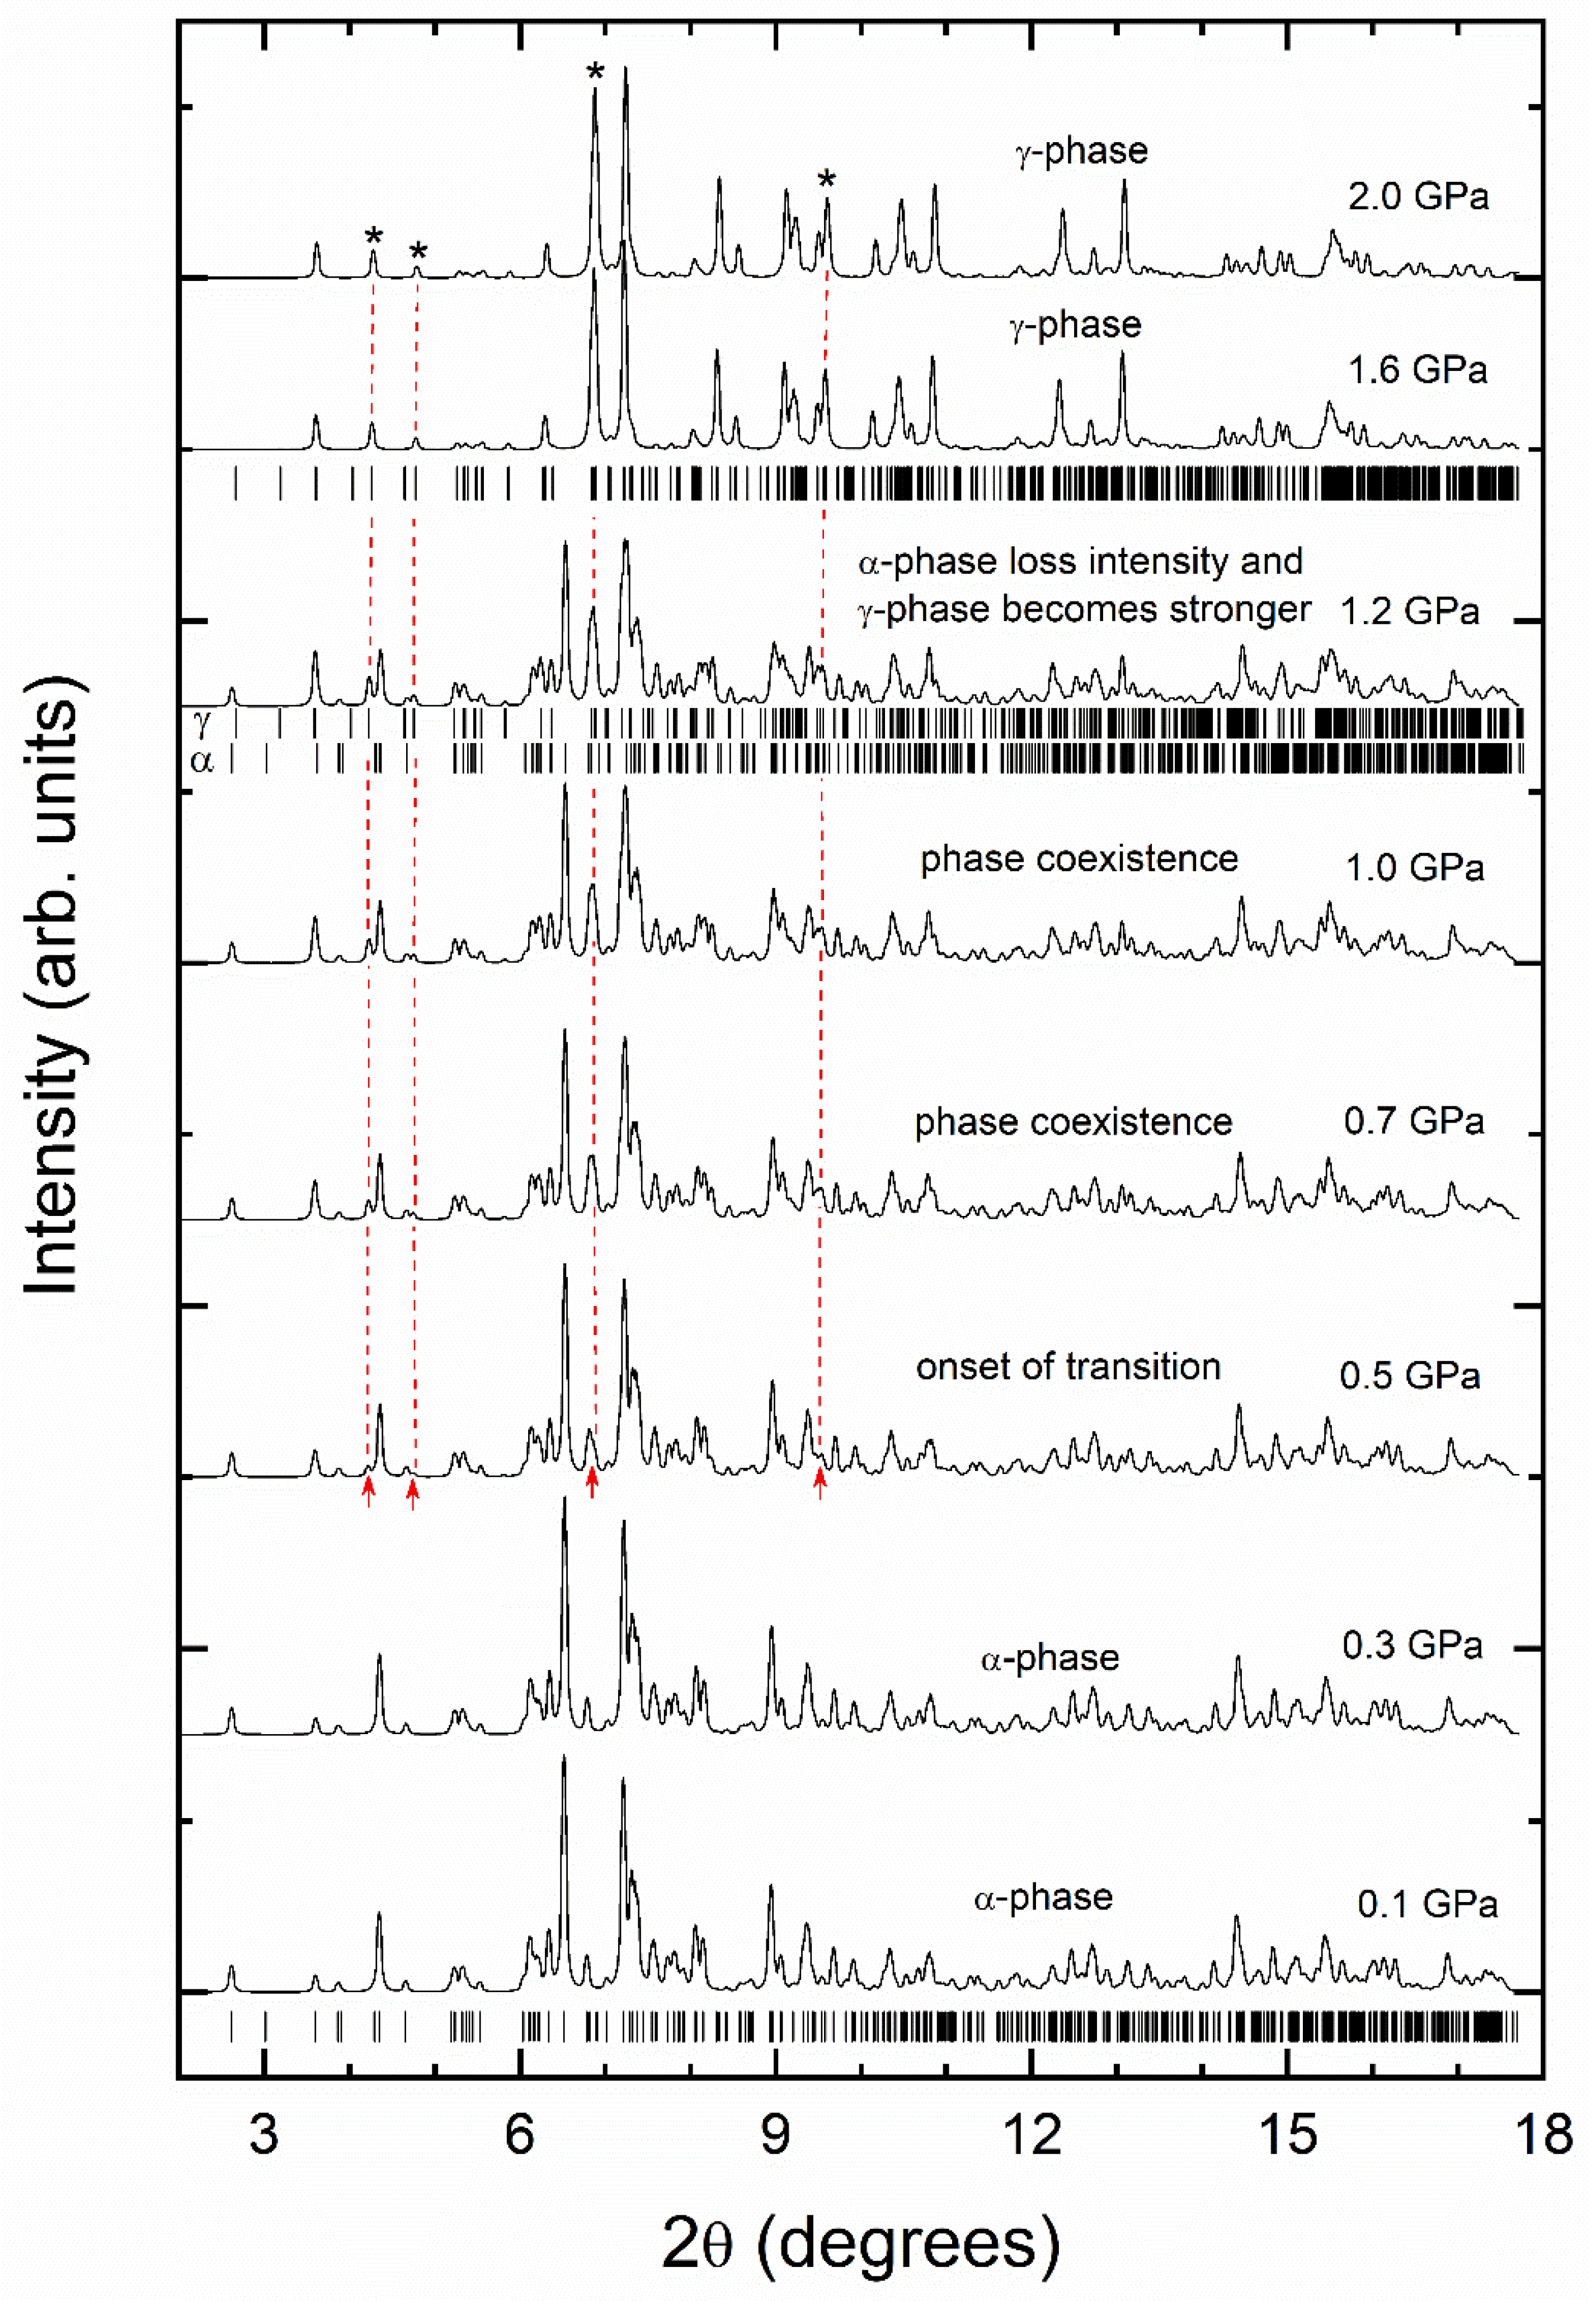
Figure 3 shows a selection of HP powder X-ray diffraction profiles of nanocrystalline α-CuMoO4 at representative pressures. There were no noticeable changes (other than typical peak shifts due to the changes induced by pressure in the unit-cell parameters) in the diffraction patterns up to 0.3 GPa and all the diffraction peaks could be indexed to α-CuMoO4 phase. At 0.5 GPa, the appearance of many weak extra diffraction peaks was observed at 2θ of 4.2, 4.7, 6.8 and 9.5° along with the diffraction peaks of the α-CuMoO4 phase. The red arrows in Figure 3 identify some of the additional peaks observed at 0.5 GPa. The red dashed lines show how these peaks evolve with pressure until the highest pressure corresponding to peaks of the γ-phase. In the pattern at 2.0 GPa (γ-phase) they are identified with asterisks.
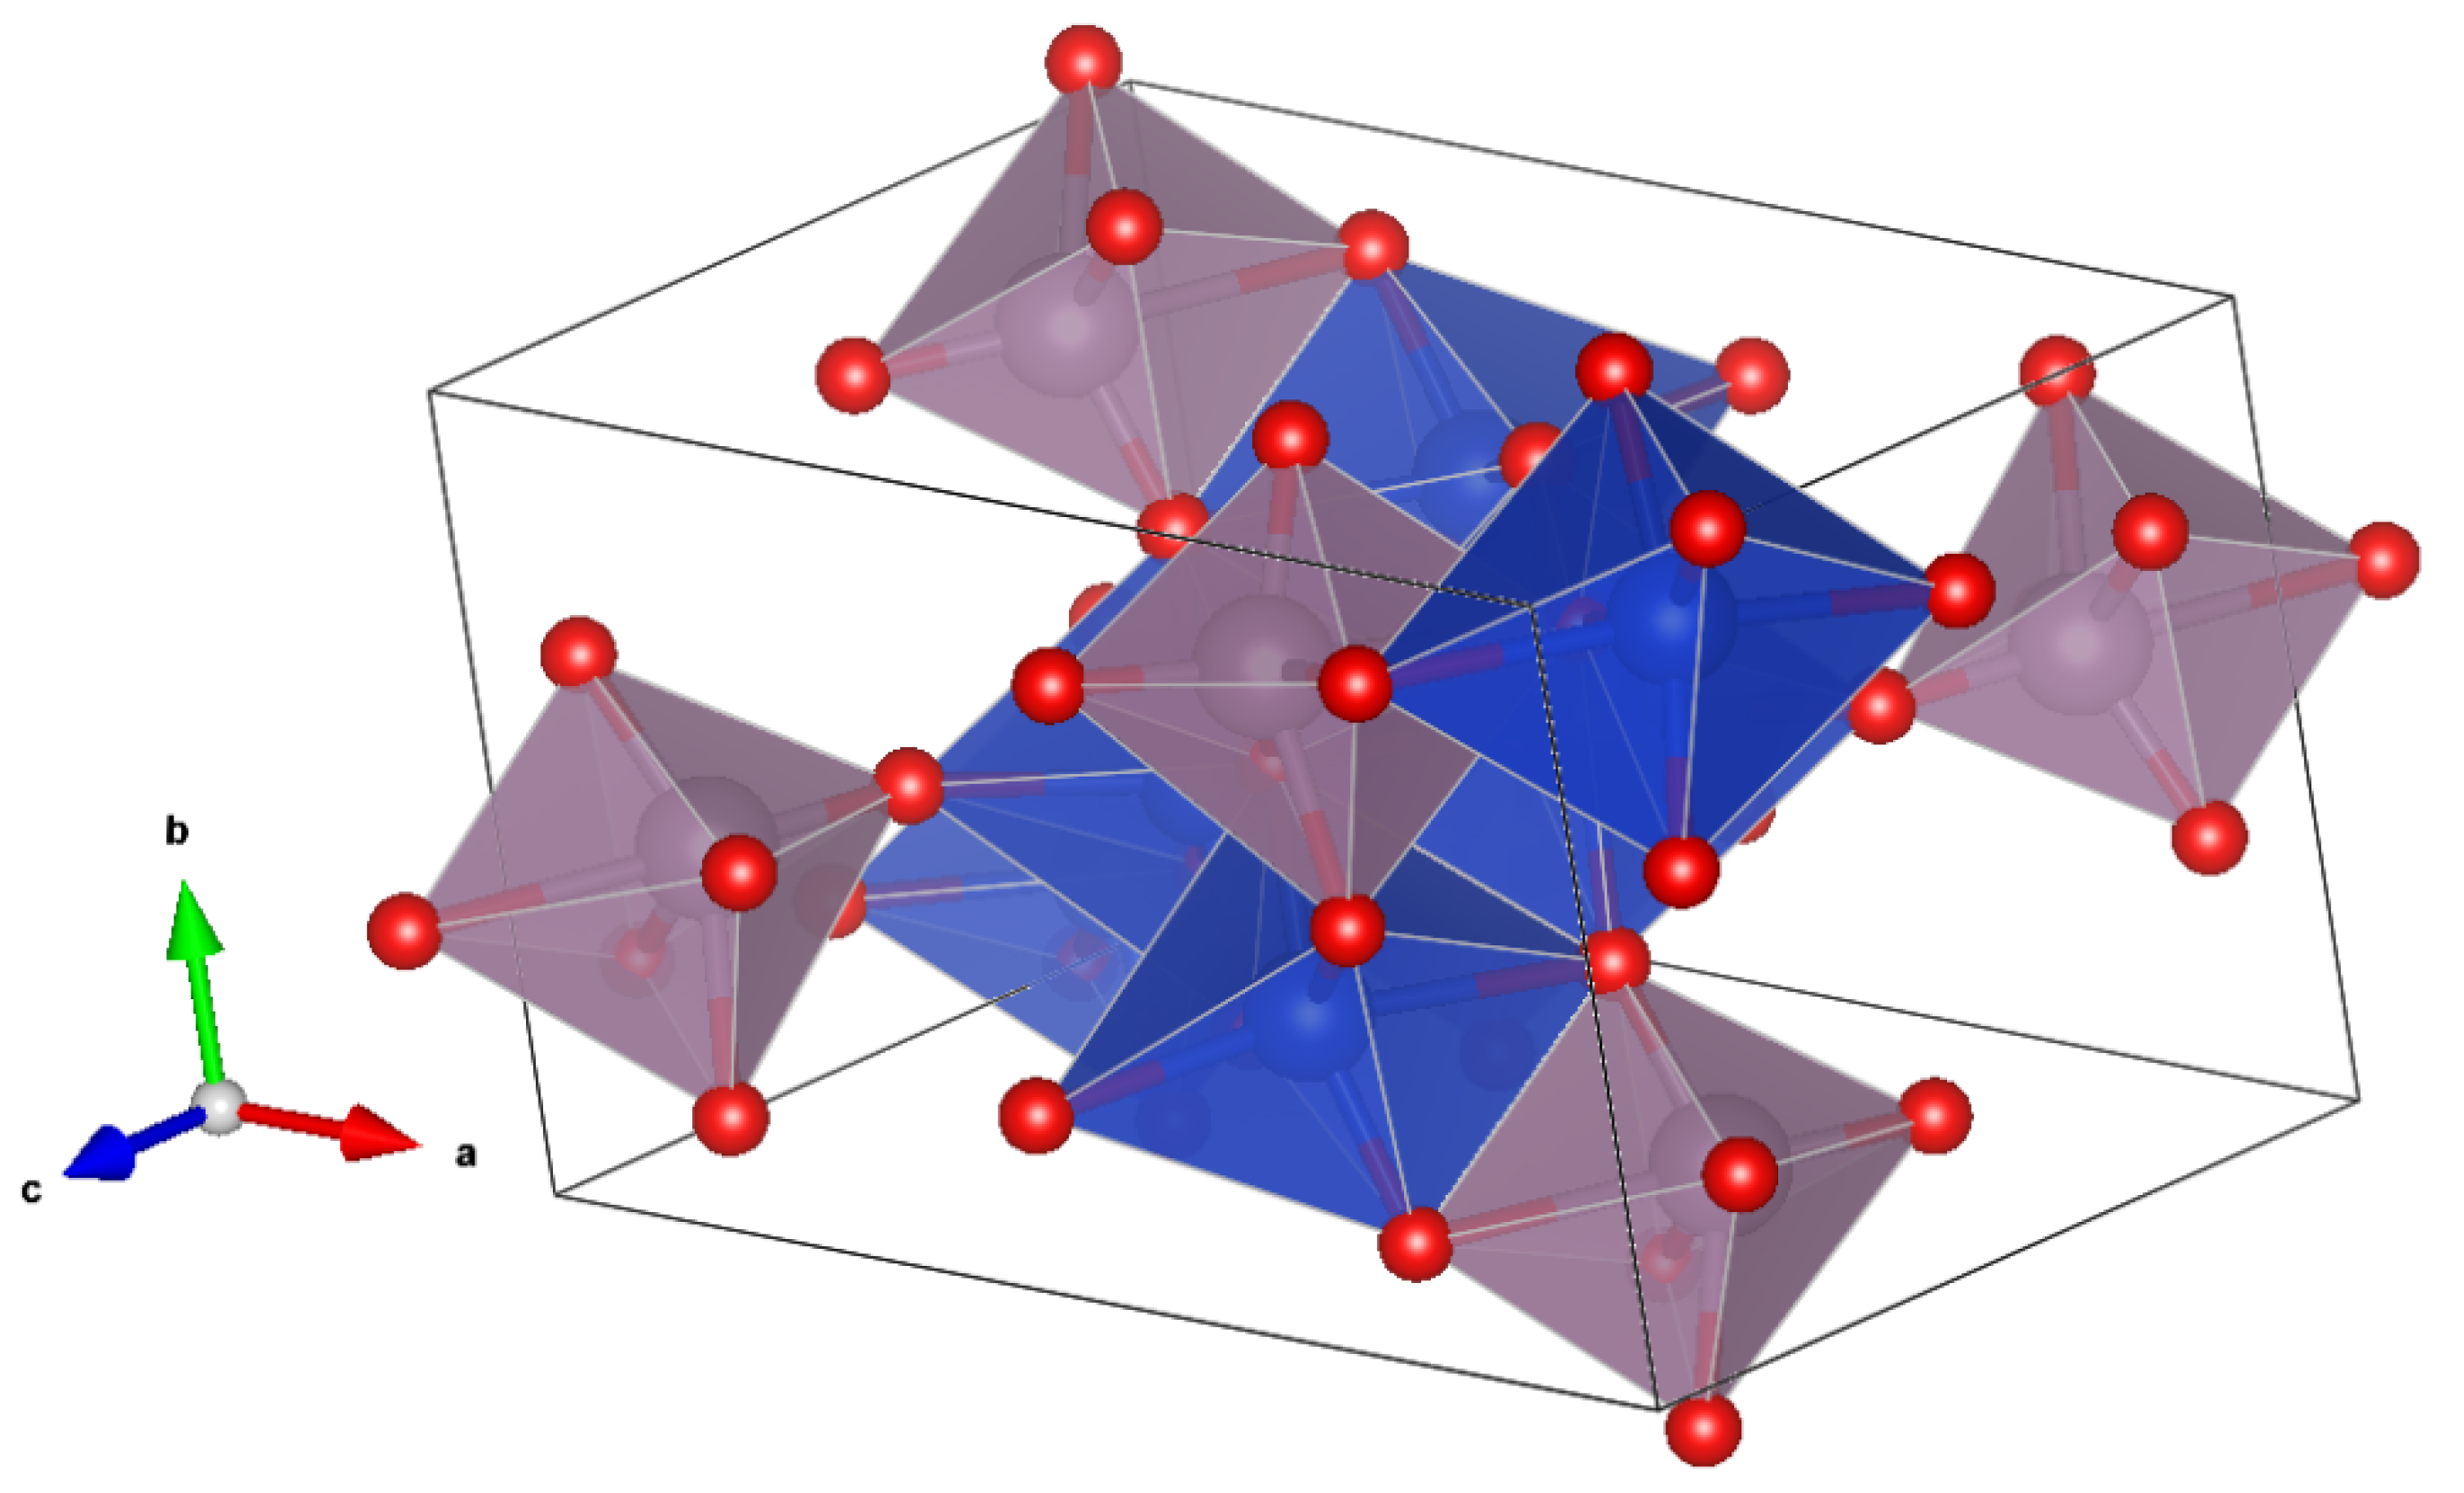
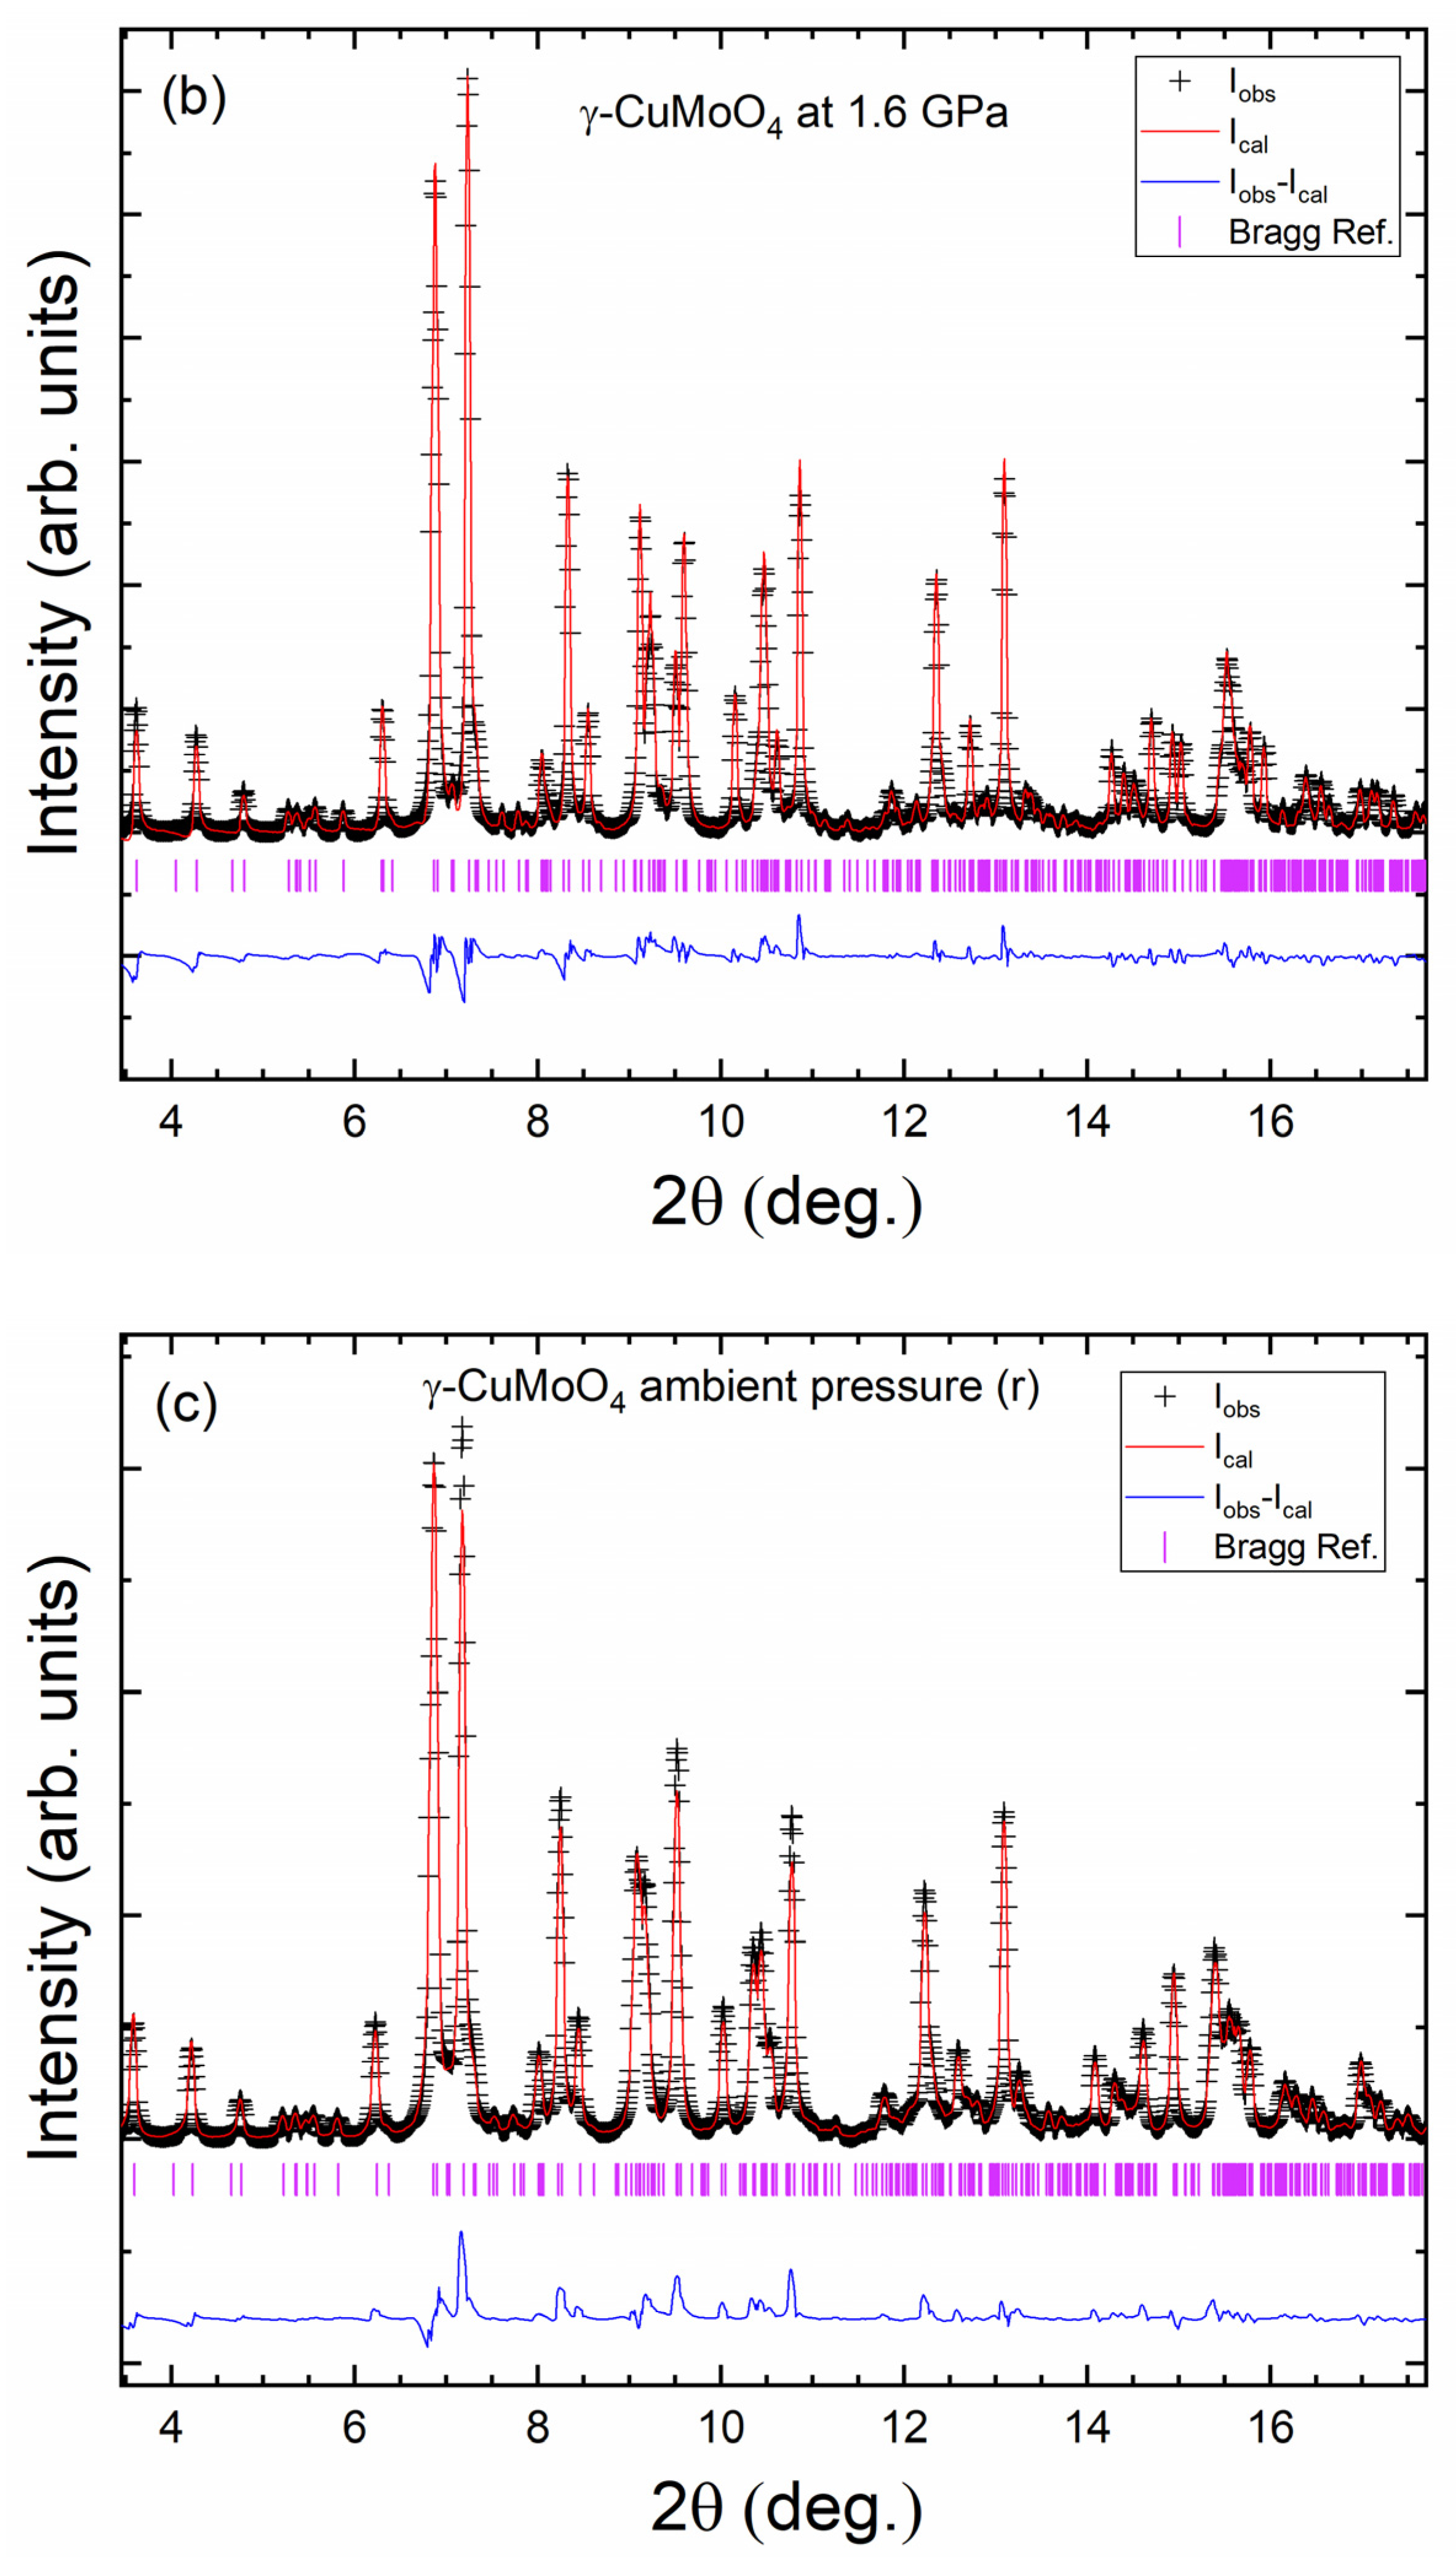
These modifications in the diffraction pattern are indicative of the onset of a structural phase transition in α-CuMoO4 at 0.5 GPa. The transition pressure observed in this study is almost double the transition pressure determined from earlier single-crystal high-pressure XRD measurements and optical studies on bulk samples, which identified the phase transition at 0.2 and 0.25 GPa, respectively [15,16]. The increase of the transition pressure could be explained in terms of an increase in surface energy in the newly formed high-pressure phase crystallites [37]. The coexistence of both the phases has been observed till 1.2 GPa. Beyond this pressure, all the diffraction peaks could be assigned to the triclinic γ-CuMoO4 (space group P 1 ¯ ). On further increase of pressure, the γ-CuMoO4 phase has been found to remain stable up to 2 GPa, which is the highest pressure reached in our XRD measurements. On release of pressure, the γ-CuMoO4 phase has been observed at ambient conditions, thus indicating the irreversible nature of the phase transition. In previous studies [15,16] the reversibility of the HP α-γ transition was not evaluated. However, it was shown that the γ-phase has a smaller band gap and different optical properties than the α-phase [16]. In particular, the band gap of γ-CuMoO4 is close to 2 eV, making it ideal for hydrogen production via photocatalytic water splitting [38]. Given the low-pressure requested to obtain γ-CuMoO4 as an ambient-conditions metastable polymorph, HP could be an efficient way to synthesize γ-CuMoO4 for water splitting applications. The crystal structure of the HP γ-CuMoO4 phase is represented in Figure 4. In this structure, all Cu atoms display an octahedral elongated coordination, and all Mo atoms have a distorted octahedral coordination. Rietveld refinements supporting the structural assignments are provided in Figure 5.
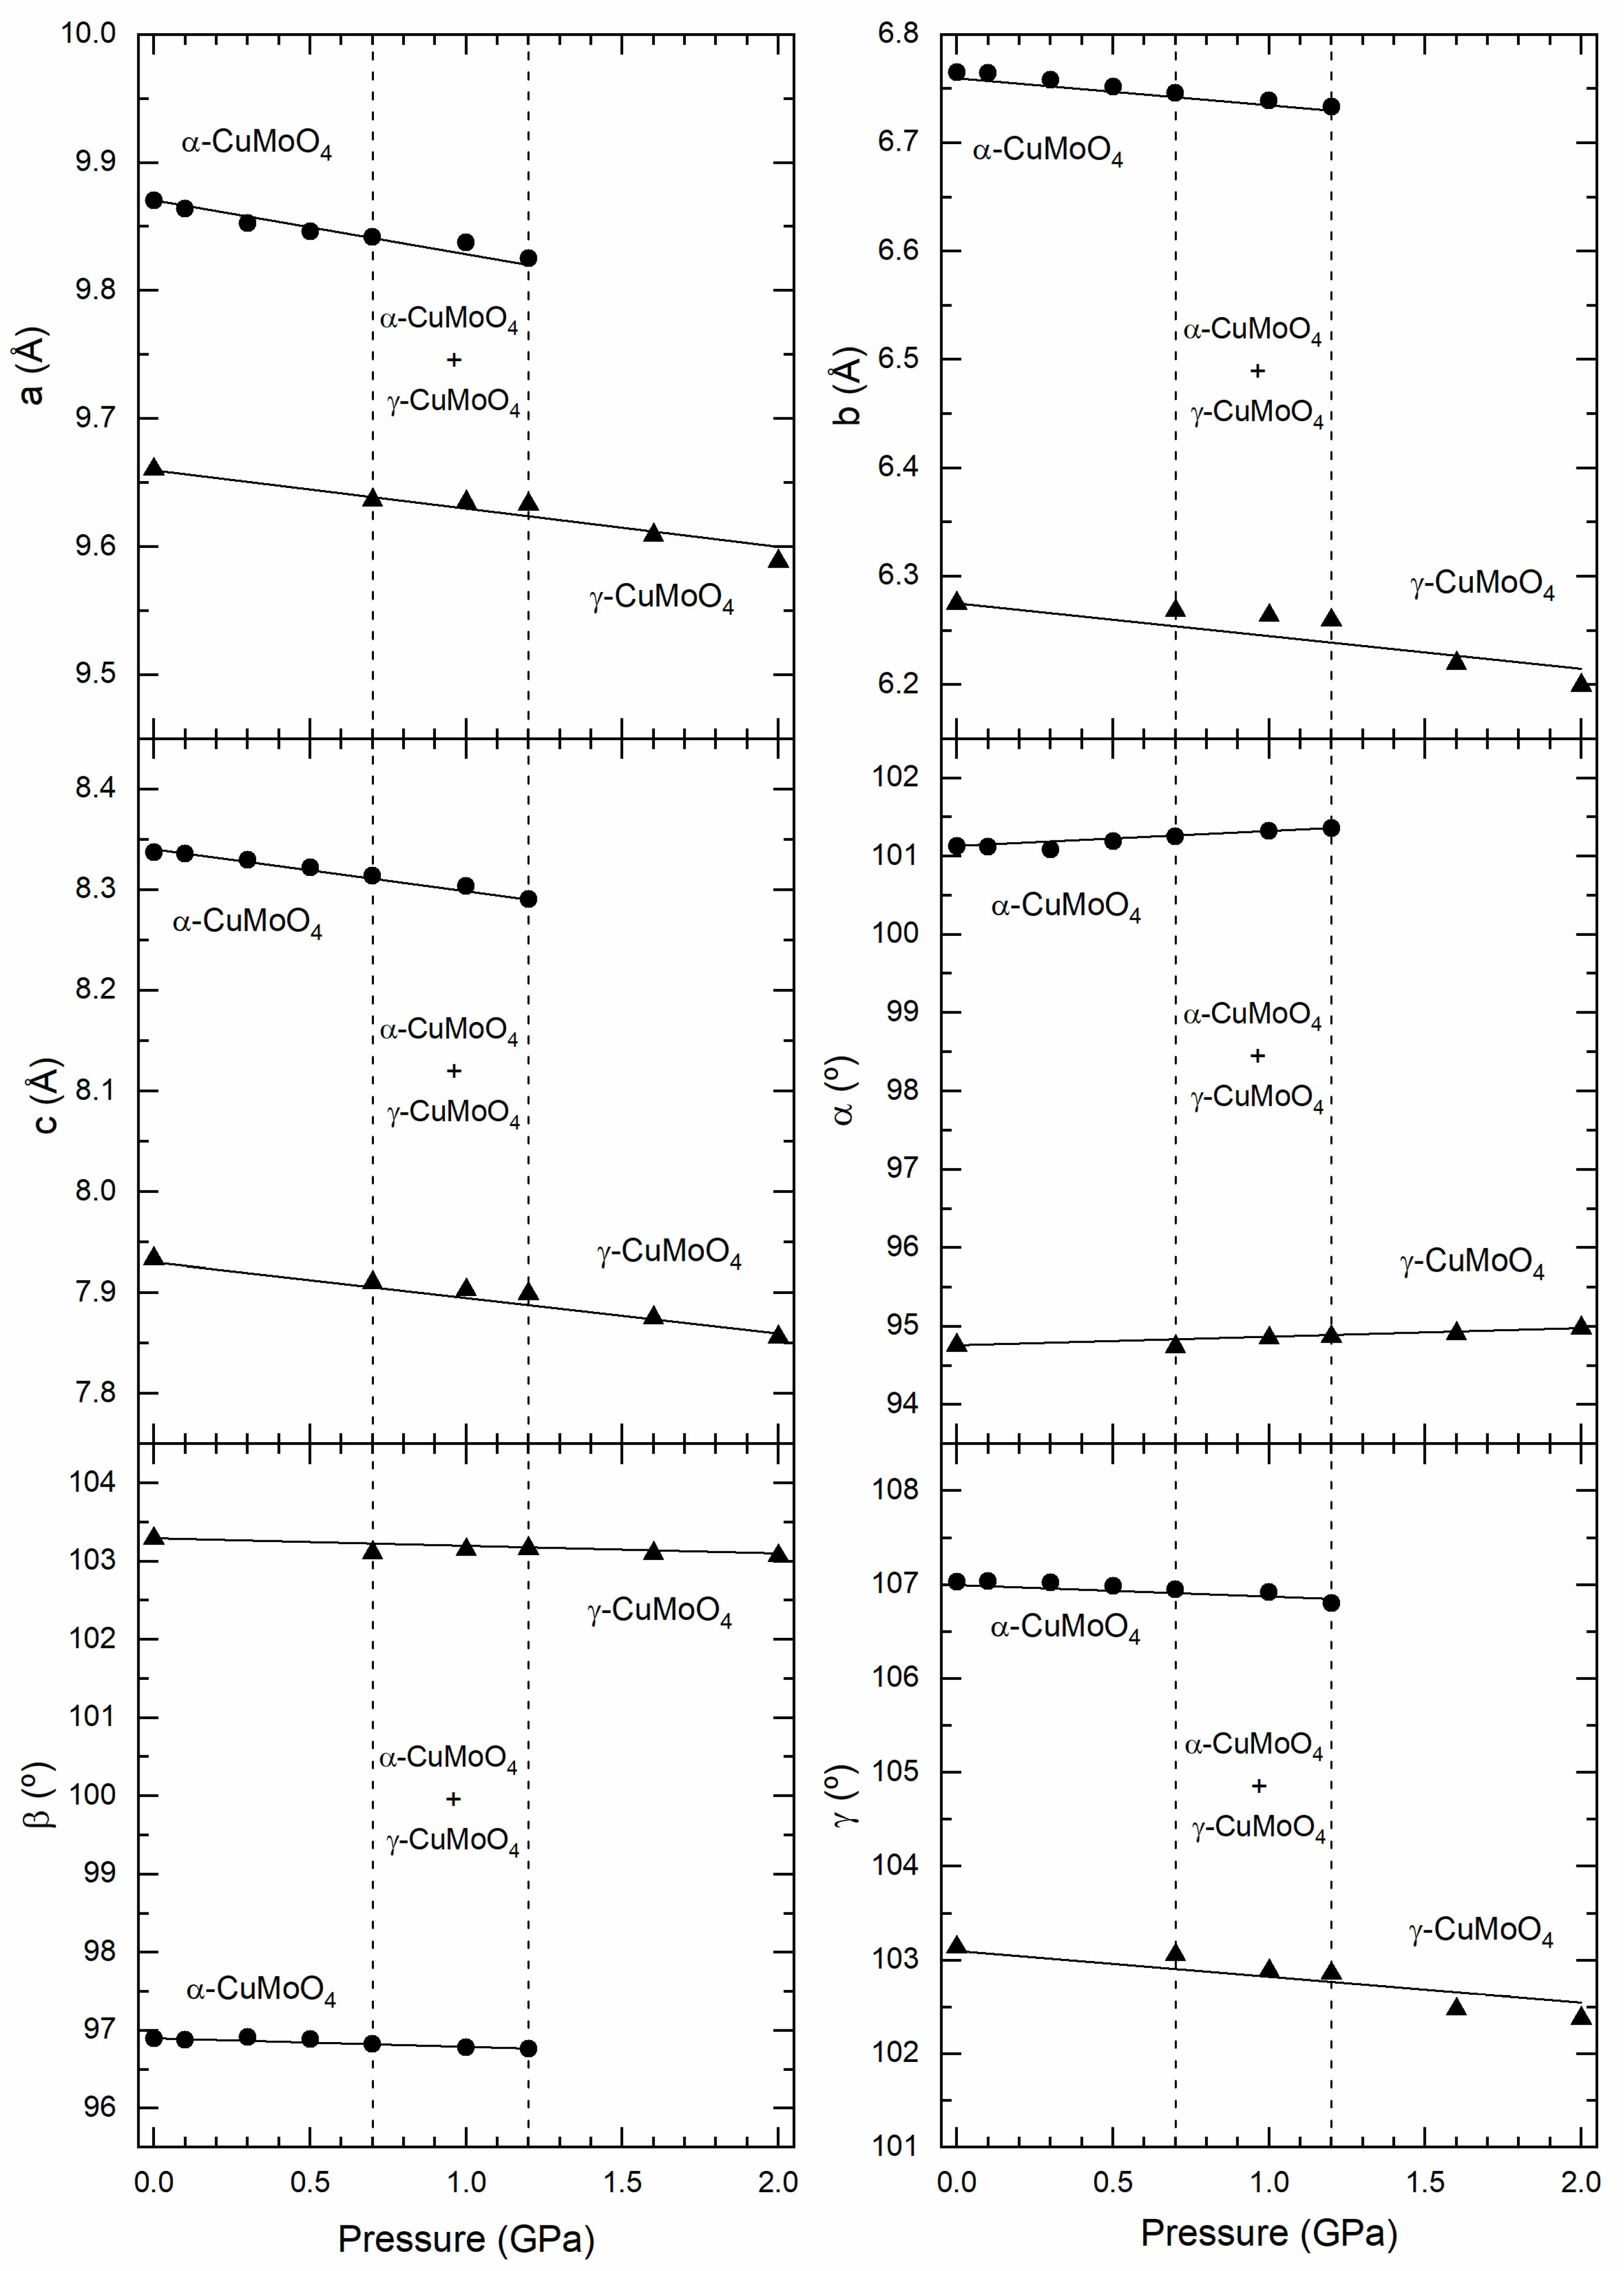
At ambient pressure, the lattice parameters for α-CuMoO4 were refined as a = 9.870 (1) Å, b = 6.764 (1) Å, c = 8.337 (1) Å, α = 101.13(5)°, β = 96.90 (5)°, γ = 107.03 (5)°. The lattice parameters and fractional coordinates of the α-CuMoO4 are given in Table 1. They are in good agreement with those reported in previous single-crystal high-pressure XRD measurements by Wiesmann et al., a = 9.901 (3) Å, b = 6.786 (2) Å, c = 8.369 (3) Å, α = 101.13°, β = 96.88°, γ = 107.01° [15]. On the other hand, the lattice parameters of γ-CuMoO4 phase at 1.6 GPa were found to be a = 9.608 (9)Å, b = 6.219 (7) Å, c = 7.875 (5) Å, α = 94.91 (1)°, β = 103.10 (1)°, γ = 102.48 (9)°. The lattice parameters and fractional coordinates are summarized in Table 2. They are in good agreement with those reported in previous single crystal high-pressure XRD measurements by Wiesmann et al., a = 9.708 (3) Å, b = 6.302 (7) Å, c = 7.977 (2) Å, α = 94.76°, β = 103.35°, γ = 103.26° [15]. After release of pressure, the lattice parameters for γ-CuMoO4 were found to be a = 9.6605 Å, b = 6.2751 Å, c = 7.9334 Å, α = 94.76°, β = 103.29°, γ = 103.14°. The unit-cell volume of the γ-phase was 11.5% smaller than the volume of the α-phase.
From Rietveld refinements, we obtained the pressure evolution of the lattice parameters and equation of state of α-CuMoO4 and γ-CuMoO4. For the HP phase, they were obtained only for 0.7 GPa and higher pressures because at 0.3 and 0.5 GPa the fraction of γ-CuMoO4 was too small to allow an accurate determination of unit-cell parameters (The peaks of γ-CuMoO4 are too weak at these two pressures). For the low-pressure phase they were obtained up to 1.2 GPa. The pressure dependence of the lattice parameters and angles are plotted in Figure 6. From the figure, it can be seen the behavior under compression is anisotropic.
For any triclinic structure, the description of the deformation of the unit cell under compression is provided by the compressibility tensor [39]; in particular, by its eigenvectors (eλi) and eigenvalues (λi). They give the principal axes of the compressibility and the compressibilities along them. We have obtained eλi and λi for α-CuMoO4 using PASCal [40]. The results are given in Table 3.
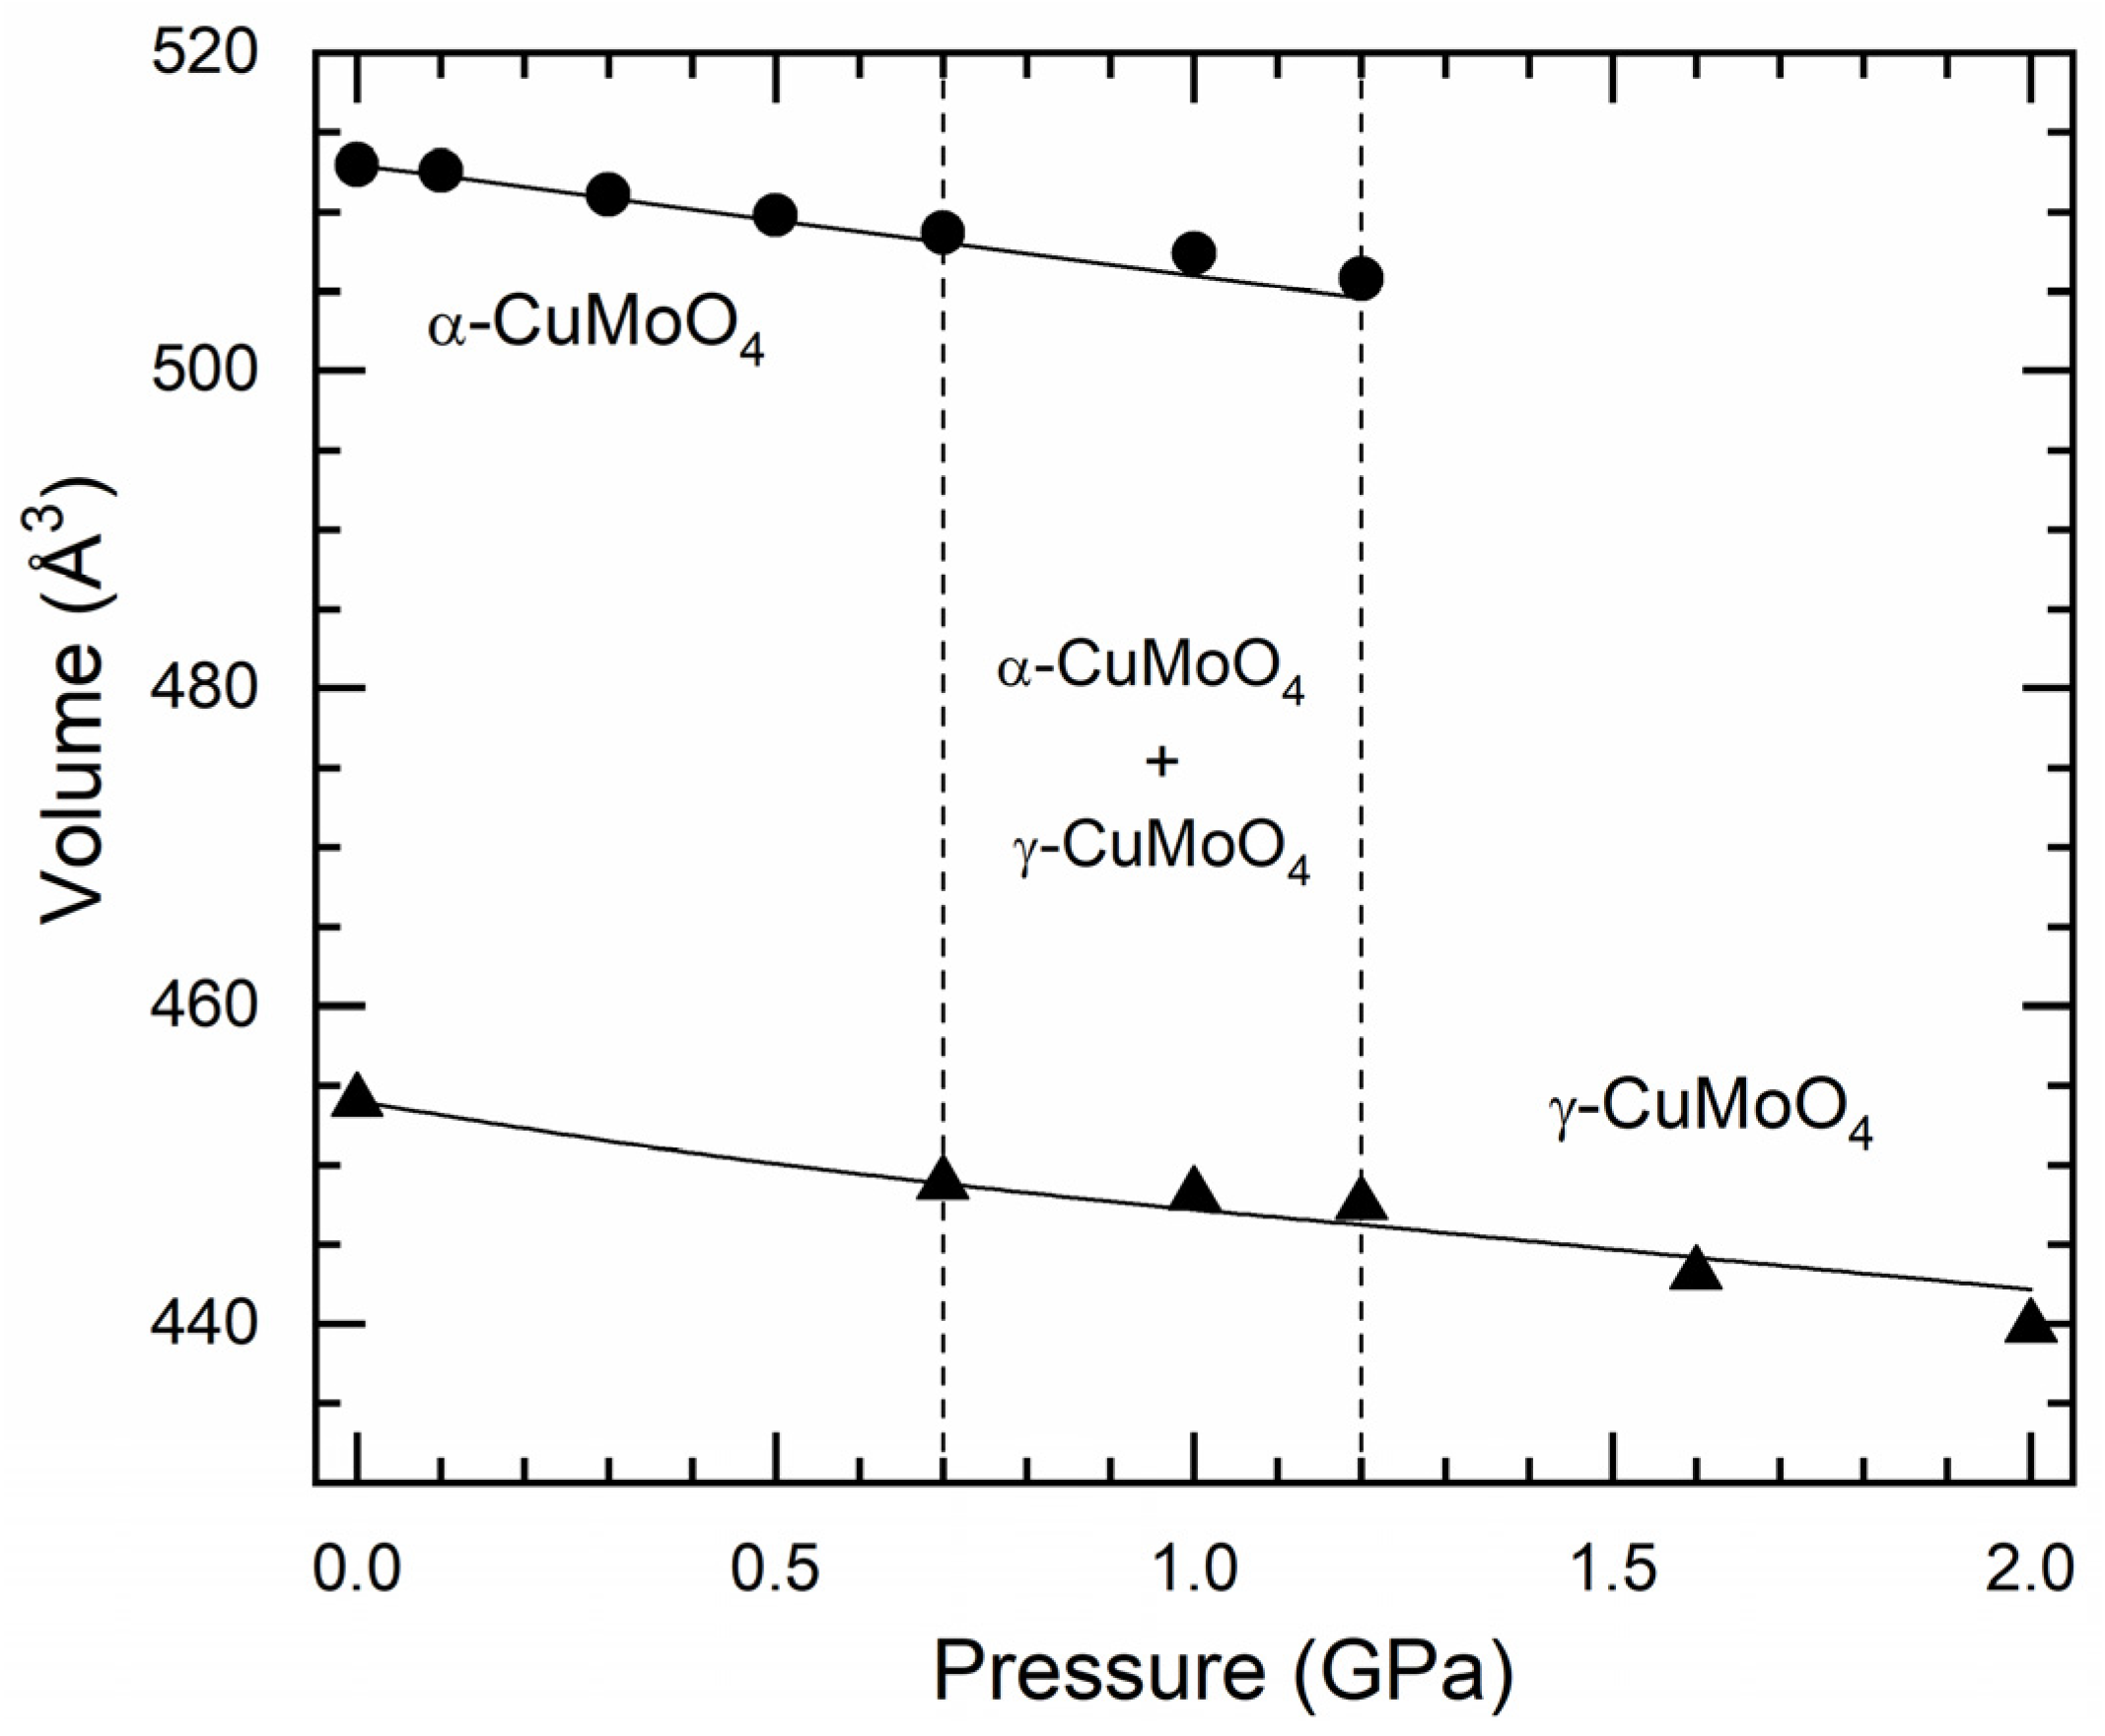
The pressure dependence of volume of both the phases is plotted in Figure 7. From the plot, it can be seen that the phase transition from α-CuMoO4 to γ-CuMoO4 exhibits a volume collapse of ~13% at 0.7 GPa which is also in agreement with earlier XRD measurements [15]. The results of Figure 7 were fitted using second- and third-order Birch–Murnaghan equations of state. The fits were carried out using EOSFIT [41]. A fit of the volume vs. pressure data of the α-CuMoO4 phase to a second-order Birch–Murnaghan equation of state ( B 0 = 4 ) gives a bulk modulus of 67 (2) GPa, if we use third order Birch-Murnaghan equation of state it gives bulk modulus of 62 (4) GPa with B 0 = 5.1   ( 8 ) which is also in agreement with earlier XRD measurements [15]. A fit of the volume vs. pressure data of the γ-CuMoO4 phase to a second-order Birch-Murnaghan equation of state ( B 0 = 4 ) gives bulk modulus of 62 (6) GPa, if we use third-order order Birch-Murnaghan equation of state it gives bulk modulus of 68 (9) GPa with B 0 = 3.1   ( 9 ) . In the previous study, B 0 = 44.0   ( 3.4 ) GPa and B 0 = 15.3   ( 3.0 ) were reported for γ-CuMoO4. Such a large pressure derivative for the bulk modulus is unusual in oxides [42]. On the other hand, it is not reasonable to have a smaller bulk modulus for γ-CuMoO4 than for α-CuMoO4, because the first phase is denser than the second one. The mismatch of B 0 and B 0 in the previous work could be related to the fact that volume at zero pressure (V0) was unknown, being extrapolated from HP results. In our case, V0 has been experimentally determined after decompression. V0, B 0 , and B 0 are correlated parameters [43] and therefore an overestimation of V0 (466 Å3 extrapolated in Ref. [15] and 454 Å3 here measured) could easily lead to inaccurate values of B 0 and B 0 . Interestingly, our results indicate, that despite the volume collapse of the transition, the two phases of CuMoO4 have comparable bulk moduli.
Interestingly, the two phases of CuMoO4 have considerably smaller bulk moduli than CuWO4 (B0 = 139 GPa) [44]. This is related to the fact that CuMoO4 has a much more open structure than CuWO4. This is a direct consequence of the way in which polyhedra are linked in CuMoO4, which gives to the structure of the two polymorphs a pseudo-layered characteristic. This feature makes the reduction of the “empty” space between layers easier and consequently leads to a smaller bulk modulus in CuMoO4. The second fact that facilitates the reduction of volume in CuMoO4 is that it can be achieved by tilting of the polyhedra. It should be noted that with respect to its polyhedral constitution, CuMoO4 is more similar to Cu3V2O8 and Cu2V2O7 [45,46] than to typical orthomolybdates [47,48]. This is consistent in that the two vanadates have bulk moduli of 52 and 64 GPa, respectively; values that are comparable to the bulk modulus of α- and γ-CuMoO4.

4. Conclusions

X-ray diffraction studies on nanocrystalline α-CuMoO4 up to 2 GPa suggest that the low pressure α-phase undergoes an irreversible α–γ phase transition. The onset of phase transition occurs at 0.5 GPa, the coexistence of both phases was observed between 0.5 to 1.2 GPa, and the transition completes at 1.6 GPa, indicating a sluggish nature of the phase transition. The α to γ phase transition involves a change of part of the copper coordination polyhedra, from square-pyramidal (C4v) CuO5 in α-CuMoO4 to octahedral elongated (D4h) CuO6 in γ-CuMoO4 along with a reduction in volume by 13%, indicative of first-order phase transition. The transition pressure observed in this case is almost double compared to its bulk counterpart which can be attributed to an increase in surface energy in the newly formed high-pressure phase. In addition, we found that in nanocrystalline CuMoO4 the high-pressure γ-polymorph can be recovered as a metastable phase upon decompression. Since the γ-phase has a smaller band-gap energy than the α-phase, our findings suggest that high pressure can be used to synthesize a metastable polymorph with a tailored band-gap energy for water splitting applications. Finally, we have also discussed the compressibility of both polymorphs and determined their equations of state.

Author Contributions

D.E. conceived the experiments. D.E. and C.P. conducted the experiments. V.P. analyzed the results. The manuscript was written through contributions of all authors. All authors have read and agreed to the published version of the manuscript.

Funding

This work was supported by the Spanish Research Agency (AEI) and Spanish Ministry of Science and Investigation (MCIN) under project PID2019-106383GB-C41 (DOI:10.13039/501100011033), co-financed by EU funds. The authors also acknowledge financial support from the MALTA Consolider Team network, under project RED2018-102612-T.

Institutional Review Board Statement

Not applicable.

Informed Consent Statement

Not applicable.

Data Availability Statement

All relevant data that support the findings of this study are available from the corresponding authors upon request.

Acknowledgments

The authors acknowledge the ALBA synchrotron facilities for provision of beamtime on the beamline MSPD-BL04 (Proposal 2016081779). They also thanks S. Agouram from Servicio Central de Soporte a la Investigación Experimental (SCSIE) at Universidad de Valencia for technical assistance in EXDS measurements.

Conflicts of Interest

The authors declare no conflict of interest.

References

  1. Kharisov, B.I.; Dias, H.V.R.; Kharissova, O.V.; Jiménez-Pérez, V.M.; Pérez, B.O.; Flores, B.M. Iron-containing nanomaterials: Synthesis, properties, and environmental applications. RSC Adv. 2012, 2, 9325–9358. [Google Scholar] [CrossRef]
  2. Tan, X.; Liu, Y.-G.; Gu, Y.-L.; Xu, Y.; Zeng, G.-M.; Hu, X.-J.; Liu, S.-B.; Wang, X.; Liu, S.-M.; Li, J. Biochar-based nano-composites for the decontamination of wastewater: A review. Bioresour. Technol. 2016, 212, 318–333. [Google Scholar] [CrossRef] [PubMed]
  3. Ullattil, S.G.; Narendranath, S.B.; Pillai, S.C.; Periyat, P. Black TiO2 Nanomaterials: A Review of Recent Advances. Chem. Eng. J. 2018, 343, 708–736. [Google Scholar] [CrossRef]
  4. Pourmortazavi, S.M.; Hajimirsadeghi, S.S.; Rahimi, N.M.; Zahedi, M.M. Facile and Effective Synthesis of Praseodymium Tungstate Nanoparticles through an Optimized Procedure and Investigation of Photocatalytic Activity. Mater. Sci. Semicond. Process. 2013, 16, 131–137. [Google Scholar] [CrossRef]
  5. Sundaram, R.; Nagaraja, K.S. Solid state electrical conductivity and humidity sensing studies on metal molybdate–molybdenum trioxide composites (M = Ni2+, Cu2+ and Pb2+). Sens. Actuators B 2004, 101, 353–360. [Google Scholar] [CrossRef]
  6. Brito, J.L.; Barbosa, A.L.; Albornoz, A.; Severino, F.; Laine, J. Nickel molybdate as precursor of HDS catalysts: Effect of phase composition. Catal. Lett. 1994, 26, 329–337. [Google Scholar] [CrossRef]
  7. Liu, J.P.; Huang, X.T.; Li, Y.Y.; Li, Z.K. A general route to thickness-tunable multilayered sheets of sheelite-type metal molybdate and their self-assembled films. J. Mater. Chem. 2007, 17, 2754–2758. [Google Scholar] [CrossRef]
  8. Naja, M.; Abbasi, A.; Masteri-Farahani, M.; Rodrigues, V.H. Synthesis, characterization and crystal structure of a copper molybdate coordination polymer as an epoxidation catalyst. Inorg. Chim. Acta 2015, 433, 21–25. [Google Scholar]
  9. Abrahams, S.C.; Bernstein, J.L.; Jamieson, P.B.; Crystal Structure of the Transition Metal Molybdates and Tungstates. IV. Paramagnetic CuMoO4. J. Chem. Phys. 1968, 48, 2619–2629. [Google Scholar] [CrossRef]
  10. Kohlmuller, R.; Faurie, J.P. Etude des systemes MoO3–Ag2MoO4 et MoO3–MO (M−Cu, Zn, Cd). Bull. Soc. Chim. Fr. 1968, 11, 4379–4382. [Google Scholar]
  11. Ehrenberg, H.; Weitzel, H.; Paulus, H.; Wiesmann, M.; Wltschek, G.; Geselle, M.; Fuess, H. Crystal structure and magnetic properties of CuMoO4 at low temperature (γ-phase). J. Phys. Chem. Sol. 1997, 58, 153–160. [Google Scholar] [CrossRef]
  12. Sleight, A.W. High Pressure CuMoO4. Mater. Res. Bull. 1973, 8, 863–866. [Google Scholar] [CrossRef]
  13. Tali, R.; Tabachenko, V.V.; Kovba, L.M.; DemÕyanets, L.N. Kristallicheskaya struktura CuMoO4. Zhurnal Neorg. Khimii 1991, 36, 1642–1644. [Google Scholar]
  14. Baek, J.; Sefat, A.S.; Mandrus, D.; Halasyamani, P.S. A New Magnetically Ordered Polymorph of CuMoO4: Synthesis and Characterization of ε-CuMoO4. Chem. Mater. 2008, 20, 3785–3787. [Google Scholar] [CrossRef]
  15. Wiesmann, M.; Ehrenberg, H.; Miehe, G.; Peun, T.; Weitzel, H.; Fuess, H. P-T Phase Diagram of CuMoO4. J. Solid State Chem. 1997, 132, 88–97. [Google Scholar] [CrossRef]
  16. Rodrıguez, F.; Hernandez, D.; Garcia-Jaca, J.; Ehrenberg, H.; Weitzel, H. Optical study of the piezochromic transition in CuMoO4 by pressure spectroscopy. Phys. Rev. B 2000, 61, 16497–16501. [Google Scholar] [CrossRef]
  17. Hassani, H.O.; Akouibaa, M.; Rakass, S.; Abboudi, M.; Bali, B.E.; Lachkar, M.; Wadaani, F. A simple and cost-effective new synthesis method of copper molybdate CuMoO4 nanoparticles and their catalytic performance. J. Sci. Adv. Mater. Dev. 2021, 6, 501–507. [Google Scholar] [CrossRef]
  18. Rahmani, A.; Farsi, H. Nanostructured copper molybdates as promising bifunctional electrocatalysts for overall water splitting and CO2 reduction. RSC Adv. 2020, 10, 39037. [Google Scholar] [CrossRef]
  19. Mohamed, B.; El Ouatib, R.; Guillemet, S.; Er-Rakho, L.; Durand, B. Characterization and photoluminescence properties of ultrafine copper molybdate (α-CuMoO4) powders prepared via a combustion-like process. Int. J. Miner. Metall. Mater. 2016, 23, 1340–1345. [Google Scholar]
  20. Popescu, C.; Sans, J.A.; Errandonea, D.; Segura, A.; Villanueva, R.; Sapiña, F. Compressibility and Structural Stability of Nanocrystalline TiO2 Anatase Synthesized from Freeze-Dried Precursors. Inorg. Chem. 2014, 53, 11598–11603. [Google Scholar] [CrossRef]
  21. Wang, J.; Yang, J.; Hu, T.; Chen, X.; Lang, J.; Wu, X.; Zhang, J.; Zhao, H.; Yang, J.; Cui, Q. Structural Phase Transition and Compressibility of CaF2 Nanocrystals under High Pressure. Crystals 2018, 8, 199. [Google Scholar] [CrossRef] [Green Version]
  22. Srihari, V.; Verma, A.K.; Pandey, K.K.; Vishwanadh, B.; Panchal, V.; Garg, N.; Errandonea, D. Making Yb2Hf2O7 Defect Fluorite Uncompressible by Particle Size Reduction. J. Phys. Chem. C 2021, 125, 27354–27362. [Google Scholar] [CrossRef]
  23. Yuan, H.; Rodriguez-Hernandez, P.; Muñoz, A.; Errandonea, D. Putting the squeeze on lead chromate nanorods. J. Phys. Chem. Lett. 2019, 10, 4744–4751. [Google Scholar] [CrossRef] [PubMed]
  24. Patterson, A.L. The Scherrer Formula for X-Ray Particle Size Determination. Phys. Rev. 1939, 56, 978–982. [Google Scholar] [CrossRef]
  25. Lutterotti, L.; Matthies, S.; Wenk, H.R. MAUD: A friendly Java program for material analysis using diffraction. IUCr Newsl. CPD 1999, 21, 14–15. [Google Scholar]
  26. Fauth, F.; Peral, I.; Popescu, C.; Knapp, M. The new Material Science Powder Diffraction beamline at ALBA Synchrotron. Powder Diffr. 2013, 28, S360–S370. [Google Scholar] [CrossRef]
  27. Prescher, C.; Prakapenka, V.B. DIOPTAS: A program for reduction of two-dimensional X-ray diffraction data and data exploration. High Press. Res. 2015, 35, 223–230. [Google Scholar] [CrossRef]
  28. Klotz, S.; Chervin, J.C.; Munsch, P.; Le Marchand, G. Hydrostatic limits of 11 pressure transmitting media. J. Phys. D Appl. Phys. 2009, 42, 075413. [Google Scholar] [CrossRef]
  29. Errandonea, D. Exploring the properties of MTO4 compounds using high-pressure powder x-ray diffraction. Cryst. Res. Technol. 2015, 50, 729–736. [Google Scholar] [CrossRef]
  30. Mao, H.K.; Xu, J.; Bell, P.M. Calibration of the ruby pressure gauge to 800 kbar under quasi-hydrostatic conditions. J. Geophys. Res. 1986, 91, 4673–4676. [Google Scholar] [CrossRef]
  31. Chervin, J.C.; Canny, B.; Mancinelli, M. Ruby-spheres as pressure gauge for optically transparent high-pressure cells. High Press. Res. 2001, 21, 305–314. [Google Scholar] [CrossRef]
  32. Dai, L.; Liu, K.; Li, H.; Wu, L.; Hu, H.; Zhang, Y.; Yang, L.; Pu, C.; Liu, P. Pressure-induced irreversible metallization with phase transitions of Sb2S3. Phys. Rev. B 2018, 97, 024103. [Google Scholar]
  33. Yang, L.; Jiang, J.; Dai, L.; Hu, H.; Hong, M.; Zhang, X.; Li, H.; Liu, P. High-pressure structural phase transition and metallization in Ga2S3 under non-hydrostatic and hydrostatic conditions up to 36.4 GPa. J. Mater. Chem. C 2021, 9, 2912–2918. [Google Scholar]
  34. Chijioke, A.D.; Nellis, W.J.; Soldatov, A.; Silvera, I.F. The ruby pressure standard to 150 GPa. J. Appl. Phys. 2005, 98, 114905. [Google Scholar] [CrossRef] [Green Version]
  35. Brian, H.T. EXPGUI, a graphical user interface for GSAS. J. Appl. Crystallogr. 2001, 34, 210–213. [Google Scholar]
  36. Rietveld, H.M. A profile refinement method for nuclear and magnetic structures. J. Appl. Crystallogr. 1969, 2, 65–71. [Google Scholar] [CrossRef]
  37. Tolbert, S.H.; Alivisatos, A.P. High-pressure structural transformations in semiconductor nanocrystals. Annu. Rev. Phys. Chem. 1995, 46, 595–625. [Google Scholar] [CrossRef]
  38. Razek, S.A.; Popeil, M.R.; Wangoh, L.; Rana, J.; Suwandaratne, N.; Andrews, J.L.; Watson, D.F.; Banerjee, S.; Piper, L.F.J. Designing catalysts for water splitting based on electronic structure considerations. Electron. Struct. 2020, 2, 023001. [Google Scholar] [CrossRef]
  39. Curetti, N.; Sochalski-Kolbus, L.M.; AngeL, R.J.; Benna, P.; Nestola, F.; Bruno, E. High-pressure structural evolution and equation of state of albite. Am. Mineral. 2011, 96, 383–392. [Google Scholar] [CrossRef]
  40. Cliffe, M.J.; Goodwin, A.L. PASCal: A principal axis strain calculator for thermal expansion and compressibility determination. J. Appl. Crystallogr. 2012, 45, 1321–1329. [Google Scholar] [CrossRef] [Green Version]
  41. Gonzalez-Plattas, J.; Alvaro, M.; Nestola, F.; Angel, R. EosFit7-GUI: A new graphical user interface for equation of state calculations, analyses and teaching. J. Appl. Crystallogr. 2016, 49, 1377–1382. [Google Scholar] [CrossRef]
  42. Errandonea, D.; Manjon, F.J. Pressure effects on the structural and electronic properties of ABX4 scintillating crystals. Prog. Mater. Sci. 2008, 53, 711–773. [Google Scholar] [CrossRef]
  43. Anzellini, S.; Errandonea, D.; MacLeod, S.G.; Botella, P.; Daisenberger, D.; De’Ath, J.M.; Gonzalez-Platas, J.; Ibáñez, J.; McMahon, M.I.; Munro, K.A.; et al. Phase diagram of calcium at high pressure and high temperature. Phys. Rev. Mater. 2018, 2, 083608. [Google Scholar] [CrossRef]
  44. Ruiz-Fuertes, J.; Errandonea, D.; Lacomba-Perales, R.; Segura, A.; González, J.; Rodríguez, F.; Manjón, F.J.; Ray, S.; Rodríguez-Hernández, P.; Muñoz, A.; et al. High-pressure structural phase transitions in CuWO4. Phys. Rev. B 2010, 81, 224115. [Google Scholar] [CrossRef] [Green Version]
  45. Díaz-Anichtchenko, D.; Turnbull, R.; Bandiello, E.; Anzellini, S.; Achary, S.N.; Errandonea, D. Pressure-induced chemical decomposition of copper orthovanadate (α-Cu3V2O8). J. Mater. Chem. C 2021, 9, 13402–13409. [Google Scholar] [CrossRef]
  46. Turnbull, R.; Gonzáles-Platas, J.; Rodríguezc, F.; Liang, A.; Popescu, C.; Santamaría-Pérez, Z.D.; Rodríguez-Hernandez, P.; Muñoz, A.; Errandonea, D. Pressure-induced phase transition and band-gap collapse in semiconducting β-Cu2V2O7. Inorg. Chem. 2022, 61, 3697–3707. [Google Scholar] [CrossRef]
  47. Errandonea, D.; Gracia, L.; Lacomba-Perales, R.; Polian, A.; Chervin, J.C. Compression of scheelite-type SrMoO4 under quasi-hydrostatic conditions: Redefining the high-pressure structural sequence. J. Appl. Phys. 2013, 113, 123510. [Google Scholar] [CrossRef] [Green Version]
  48. Errandonea, D.; Ruiz-Fuertes, J. A Brief Review of the Effects of Pressure on Wolframite-Type Oxides. Crystals 2018, 8, 71. [Google Scholar] [CrossRef] [Green Version]
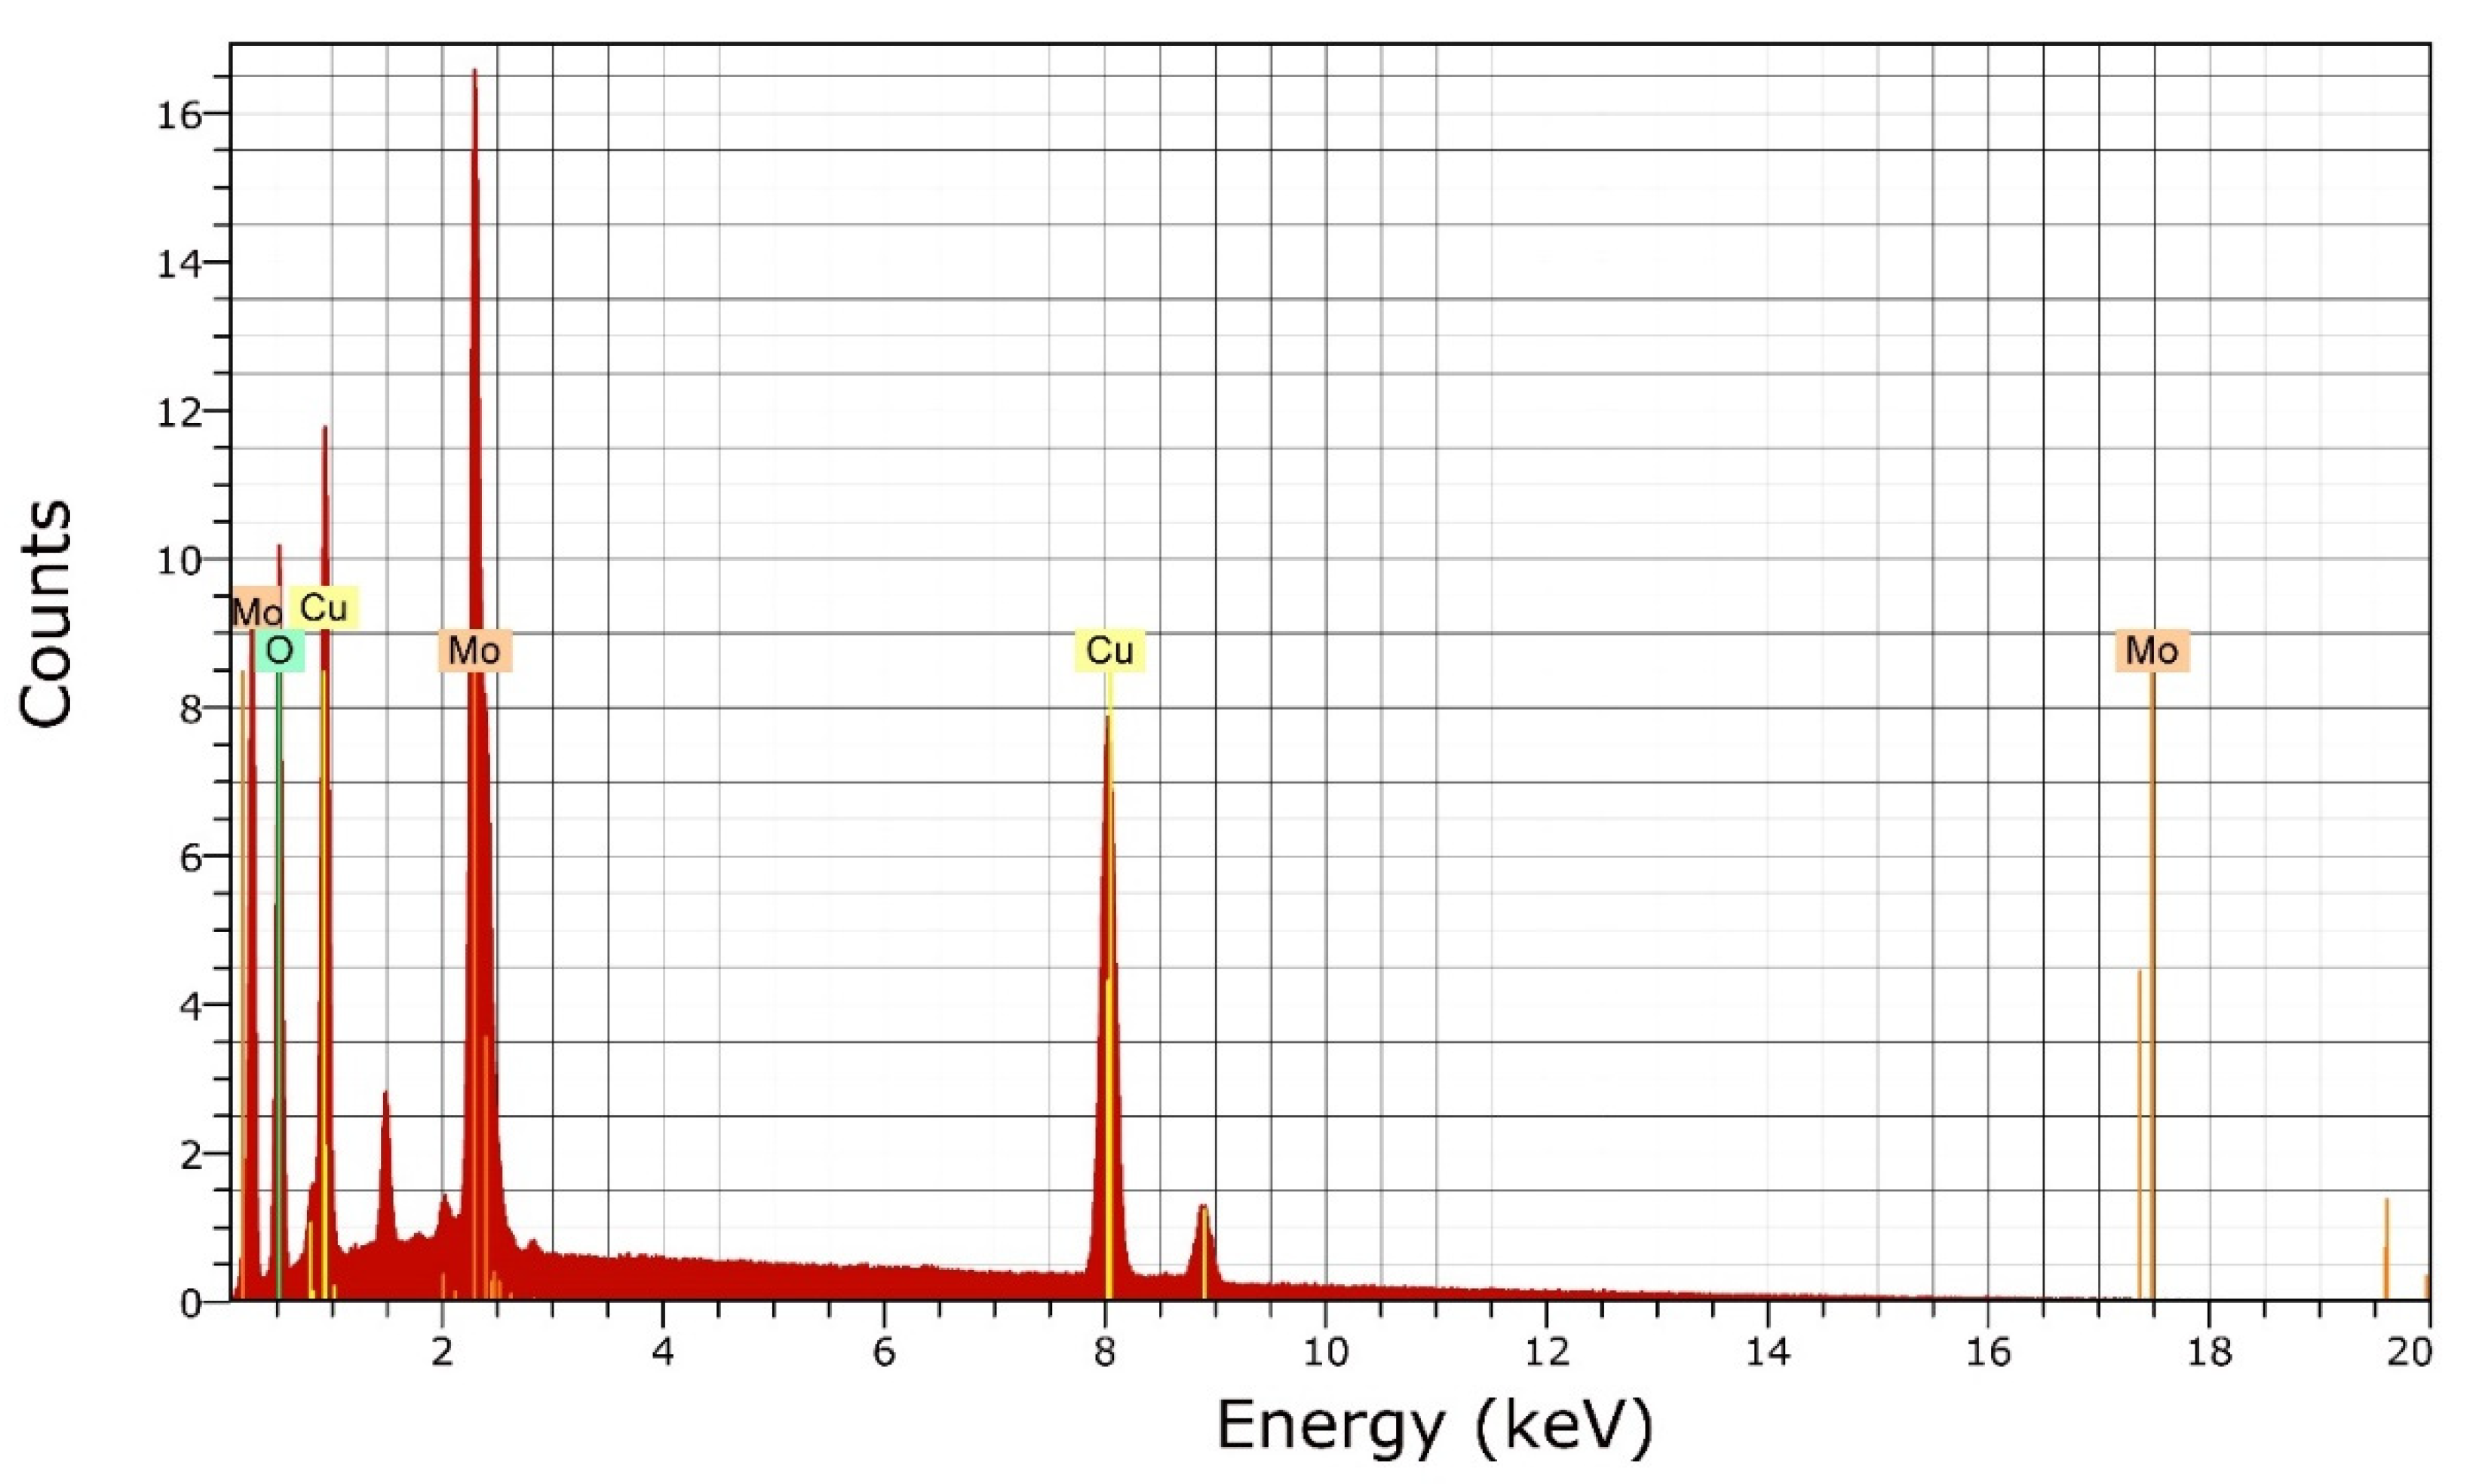
Figure 1. Energy dispersive X-ray analysis (EDXS) spectrum of nanocrystalline CuMoO4.
Crystals 12 00365 g001
Figure 2. Crystal structure of α-CuMoO4. Blue solid spheres correspond to Cu atoms, gray solid spheres correspond to Mo atoms, and red solid spheres correspond to O atoms. The different coordination polyhedra are illustrated in the figure.
Crystals 12 00365 g002
Figure 3. Evolution of the X-ray diffraction patterns of α-CuMoO4 as a function of pressure. Pressures are provided in the figure. Red arrows indicate the appearance of extra diffraction peaks evidencing the onset of the transition to the γ-CuMoO4 phase. Red dashed lines show how these peaks evolve under compression. The asterisks identify the peaks in the γ-phase. Ticks are the position of Bragg peaks for different structures.
Crystals 12 00365 g003
Figure 4. Crystal structure of γ-CuMoO4. Blue solid spheres correspond to Cu atoms, gray solid spheres correspond to Mo atoms, and red solid spheres correspond to O atoms. The different coordination polyhedra are illustrated in the figure.
Crystals 12 00365 g004
Figure 5. (a) XRD pattern and Rietveld refinement of α-CuMoO4 at ambient pressure. (Rwp = 13.4%, Rp = 9.2%). (b) XRD pattern and Rietveld refinement of γ-CuMoO4 at 1.6 GPa (Rwp = 11.4%, Rp = 6.8%). (c) XRD pattern and Rietveld refinement of γ-CuMoO4 at ambient pressure after pressure release (Rwp = 12.4%, Rp = 8.0%), denoted by (r).
Crystals 12 00365 g005aCrystals 12 00365 g005b
Figure 6. Pressure dependence of the lattice parameters and angles. Filled circles correspond to the α-CuMoO4 phase and solid triangles corresponds to γ-CuMoO4. Errors are smaller than symbol’s size. The solid lines in the lattice-parameter plots are linear fits of the data. Vertical dashed lines delimit the region of phase coexistence.
Crystals 12 00365 g006
Figure 7. Pressure dependence of the volume. Filled circles correspond to the α-CuMoO4 phase and solid triangles corresponds to γ-CuMoO4. Errors are smaller than symbol size. The solid lines are linear fits of the data.
Crystals 12 00365 g007
Table 1. Lattice parameters and fractional coordinates of α-CuMoO4 at ambient conditions. Space group P 1 ¯ , Z = 6, a = 9.870 (1) Å, b = 6.764 (1) Å, c = 8.337 (1) Å, α = 101.13 (5)°, β = 96.90 (5)°, γ = 107.03 (5)°.
AtomsSitesxyz
Cu12i0.4054 (3)0.7466 (3)0.1983 (3)
Cu22i0.9922 (3)0.0472 (3)0.2024 (3)
Cu32i0.2365 (3)0.4626 (3)0.3853 (3)
Mo12i0.3450 (2)0.1970 (2)0.0850 (2)
Mo22i0.1064 (2)0.4960 (2)0.7776 (2)
Mo32i0.2500 (2)0.9927 (2)0.4648 (2)
O12i0.1425 (12)0.9355 (12)0.6056 (12)
O22i0.2751 (12)0.7459 (12)0.3590 (12)
O32i0.1839 (12)0.1582 (12)0.3414 (12)
O42i0.1644 (12)0.0642 (12)0.9873 (12)
O52i0.1846 (12)0.5020 (12)0.5974 (12)
O62i0.3669 (12)0.4518 (12)0.2238 (12)
O72i0.2405 (12)0.5940 (12)0.9484 (12)
O82i0.4122 (12)0.1567(12)0.5772 (12)
O92i0.0039 (12)0.2291 (12)0.7692 (12)
O102i0.0107 (12)0.3455 (12)0.2115 (12)
O112i0.4463 (12)0.2493 (12)0.9330 (12)
O122i0.4104 (12)0.0335 (12)0.1952 (12)
Table 2. Lattice parameters and fractional coordinates of γ-CuMoO4 at 1.6 GPa. Space group P 1 ¯ , Z = 6, a = 9.608 (9) Å, b = 6.219 (7) Å, c = 7.875 (5) Å, α = 94.91 (1)°, β = 103.10 (1)°, γ = 102.48 (9)°.
AtomsSitesxyz
Cu12i0.4339 (3)0.7158 (3)0.2360 (3)
Cu22i0.0069 (3)0.0931 (3)0.1939 (3)
Cu32i0.3355 (3)0.4240 (3)0.5260 (3)
Mo12i0.3481 (2)0.2165 (2)0.1269 (2)
Mo22i0.1092 (2)0.4145 (2)0.8800 (2)
Mo32i0.2269 (12)0.9336 (2)0.4583 (2)
O12i0.1193 (12)0.8973 (12)0.6000 (12)
O22i0.2951 (12)0.6970 (12)0.4544 (12)
O32i0.1998 (12)0.2082 (12)0.3424 (12)
O42i0.1546 (12)0.1263 (12)0.9699 (12)
O52i0.1927 (12)0.4514 (12)0.7175 (12)
O62i0.4765 (12)0.4375 (12)0.3011 (12)
O72i0.2720 (12)0.5024 (12)0.0747 (12)
O82i0.3863 (12)0.1490 (12)0.5890 (12)
O92i0.9406 (12)0.1831 (12)0.7561 (12)
O102i0.9744 (12)0.3626 (12)0.1078 (12)
O112i0.4474 (12)0.2102 (12)0.9788 (12)
O122i0.3568 (12)0.9728 (12)0.2219 (12)
Table 3. Eigenvalues, λi, and Eigenvectors, eλi, for the isothermal compressibility tensor of α-CuMoO4.
EigenvaluesEigenvectors
λ 1 = 4.2 ( 8 ) × 10 3   GPa 1 e λ 1 = ( 0.8568 ,   0.0228 , 0.2899 )
λ 2 = 5.8 ( 8 ) × 10 3   GPa 1 e λ 2 = ( 0.2653 , 0.7825 ,   05632 )
λ 3 = 7.1 ( 8 ) × 10 3   GPa 1 e λ 3 = ( 0.1237 ,   0.7819 ,   0.6110 )
Publisher’s Note: MDPI stays neutral with regard to jurisdictional claims in published maps and institutional affiliations.