
Research on EDM Performance of Renewable Dielectrics under Different Electrodes for Machining SKD11


 , ,
, ,
Abstract
:1. Introduction
2. Experimental Equipment and Materials
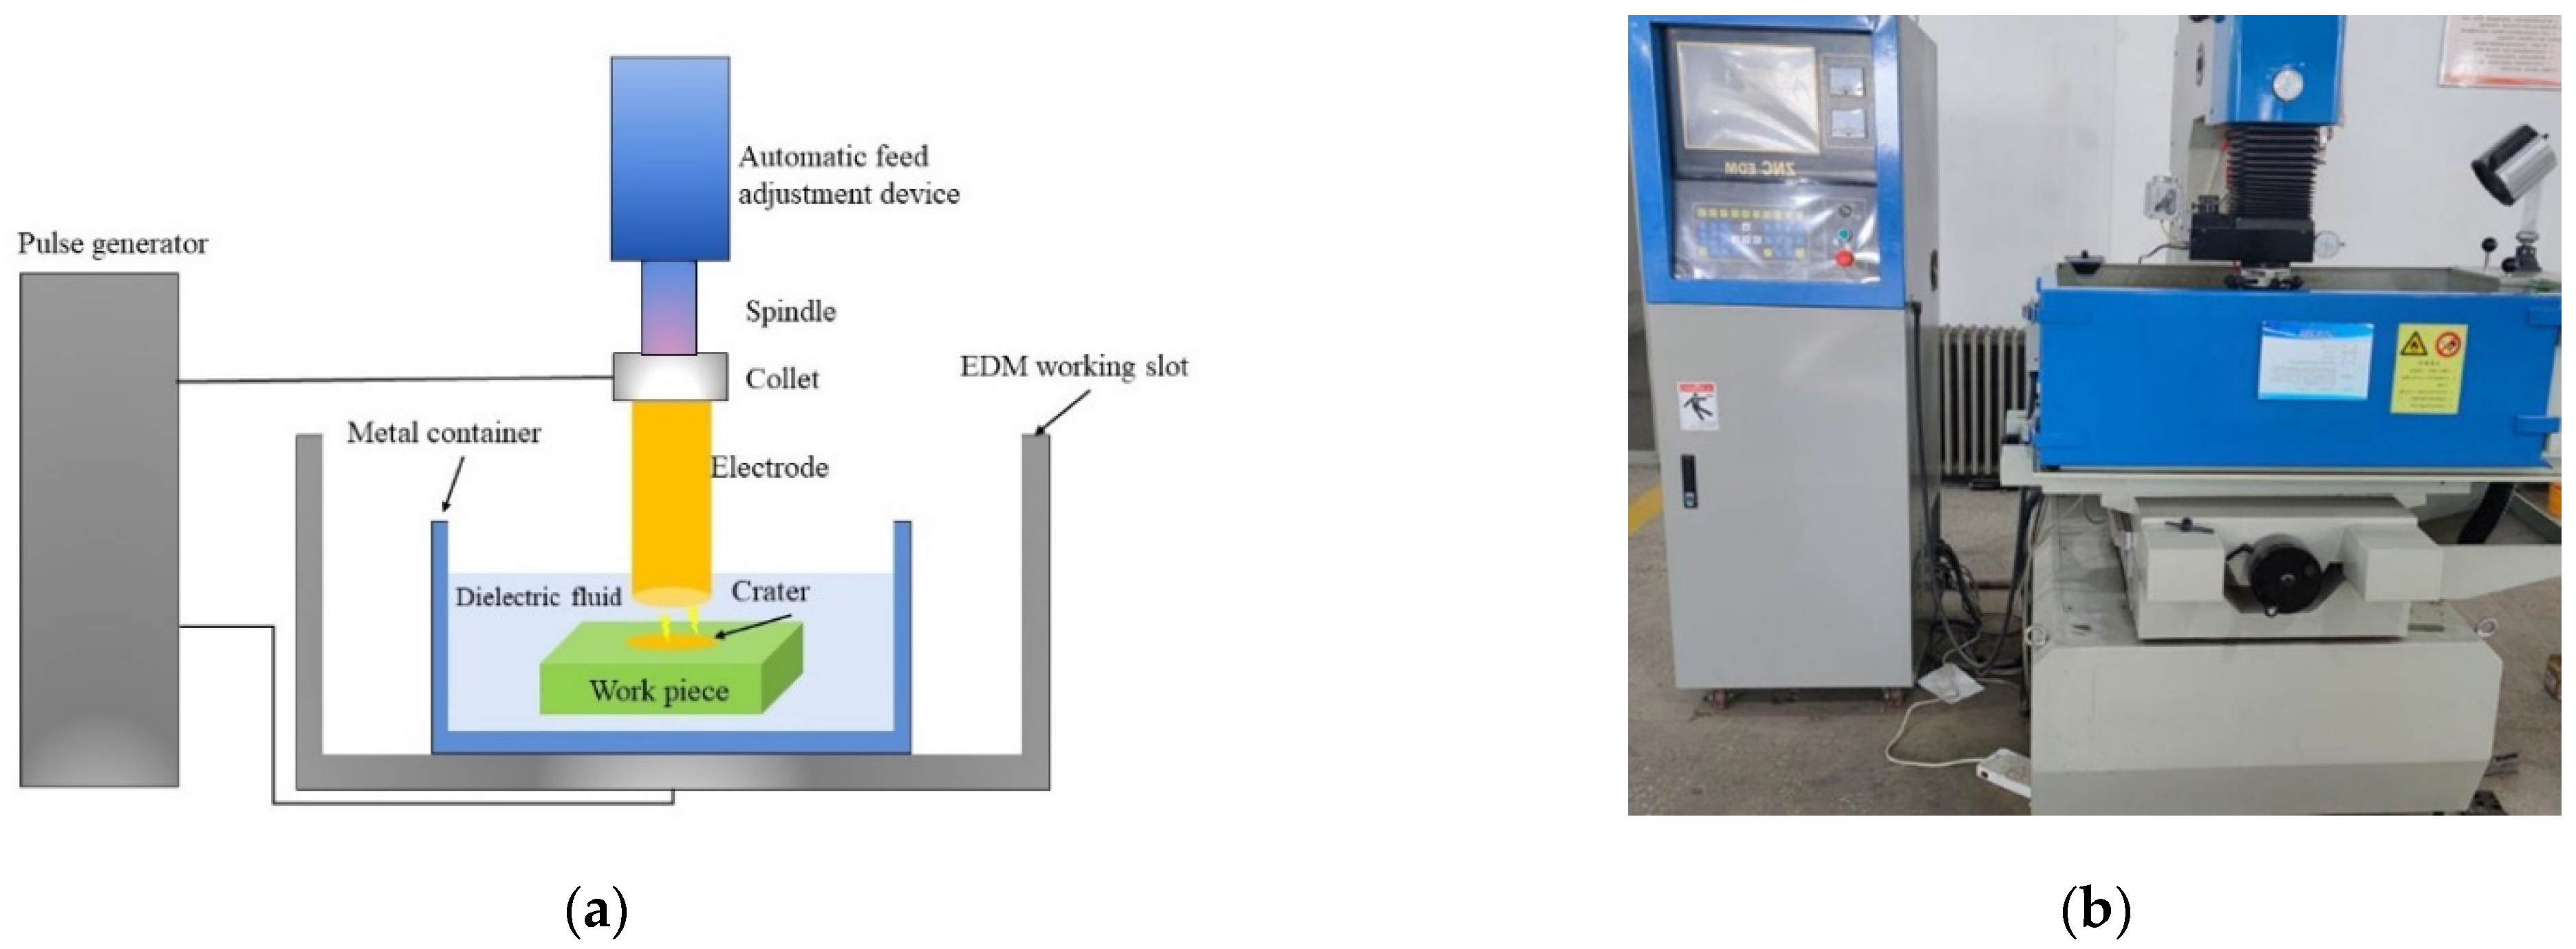
2.1. Experimental Equipment
2.2. Workpiece Material and Tool Electrode
2.3. Dielectric
2.4. Experimental Design
3. Experimental Results and Analysis
3.1. Influence of Processing Parameters on Machining Performance
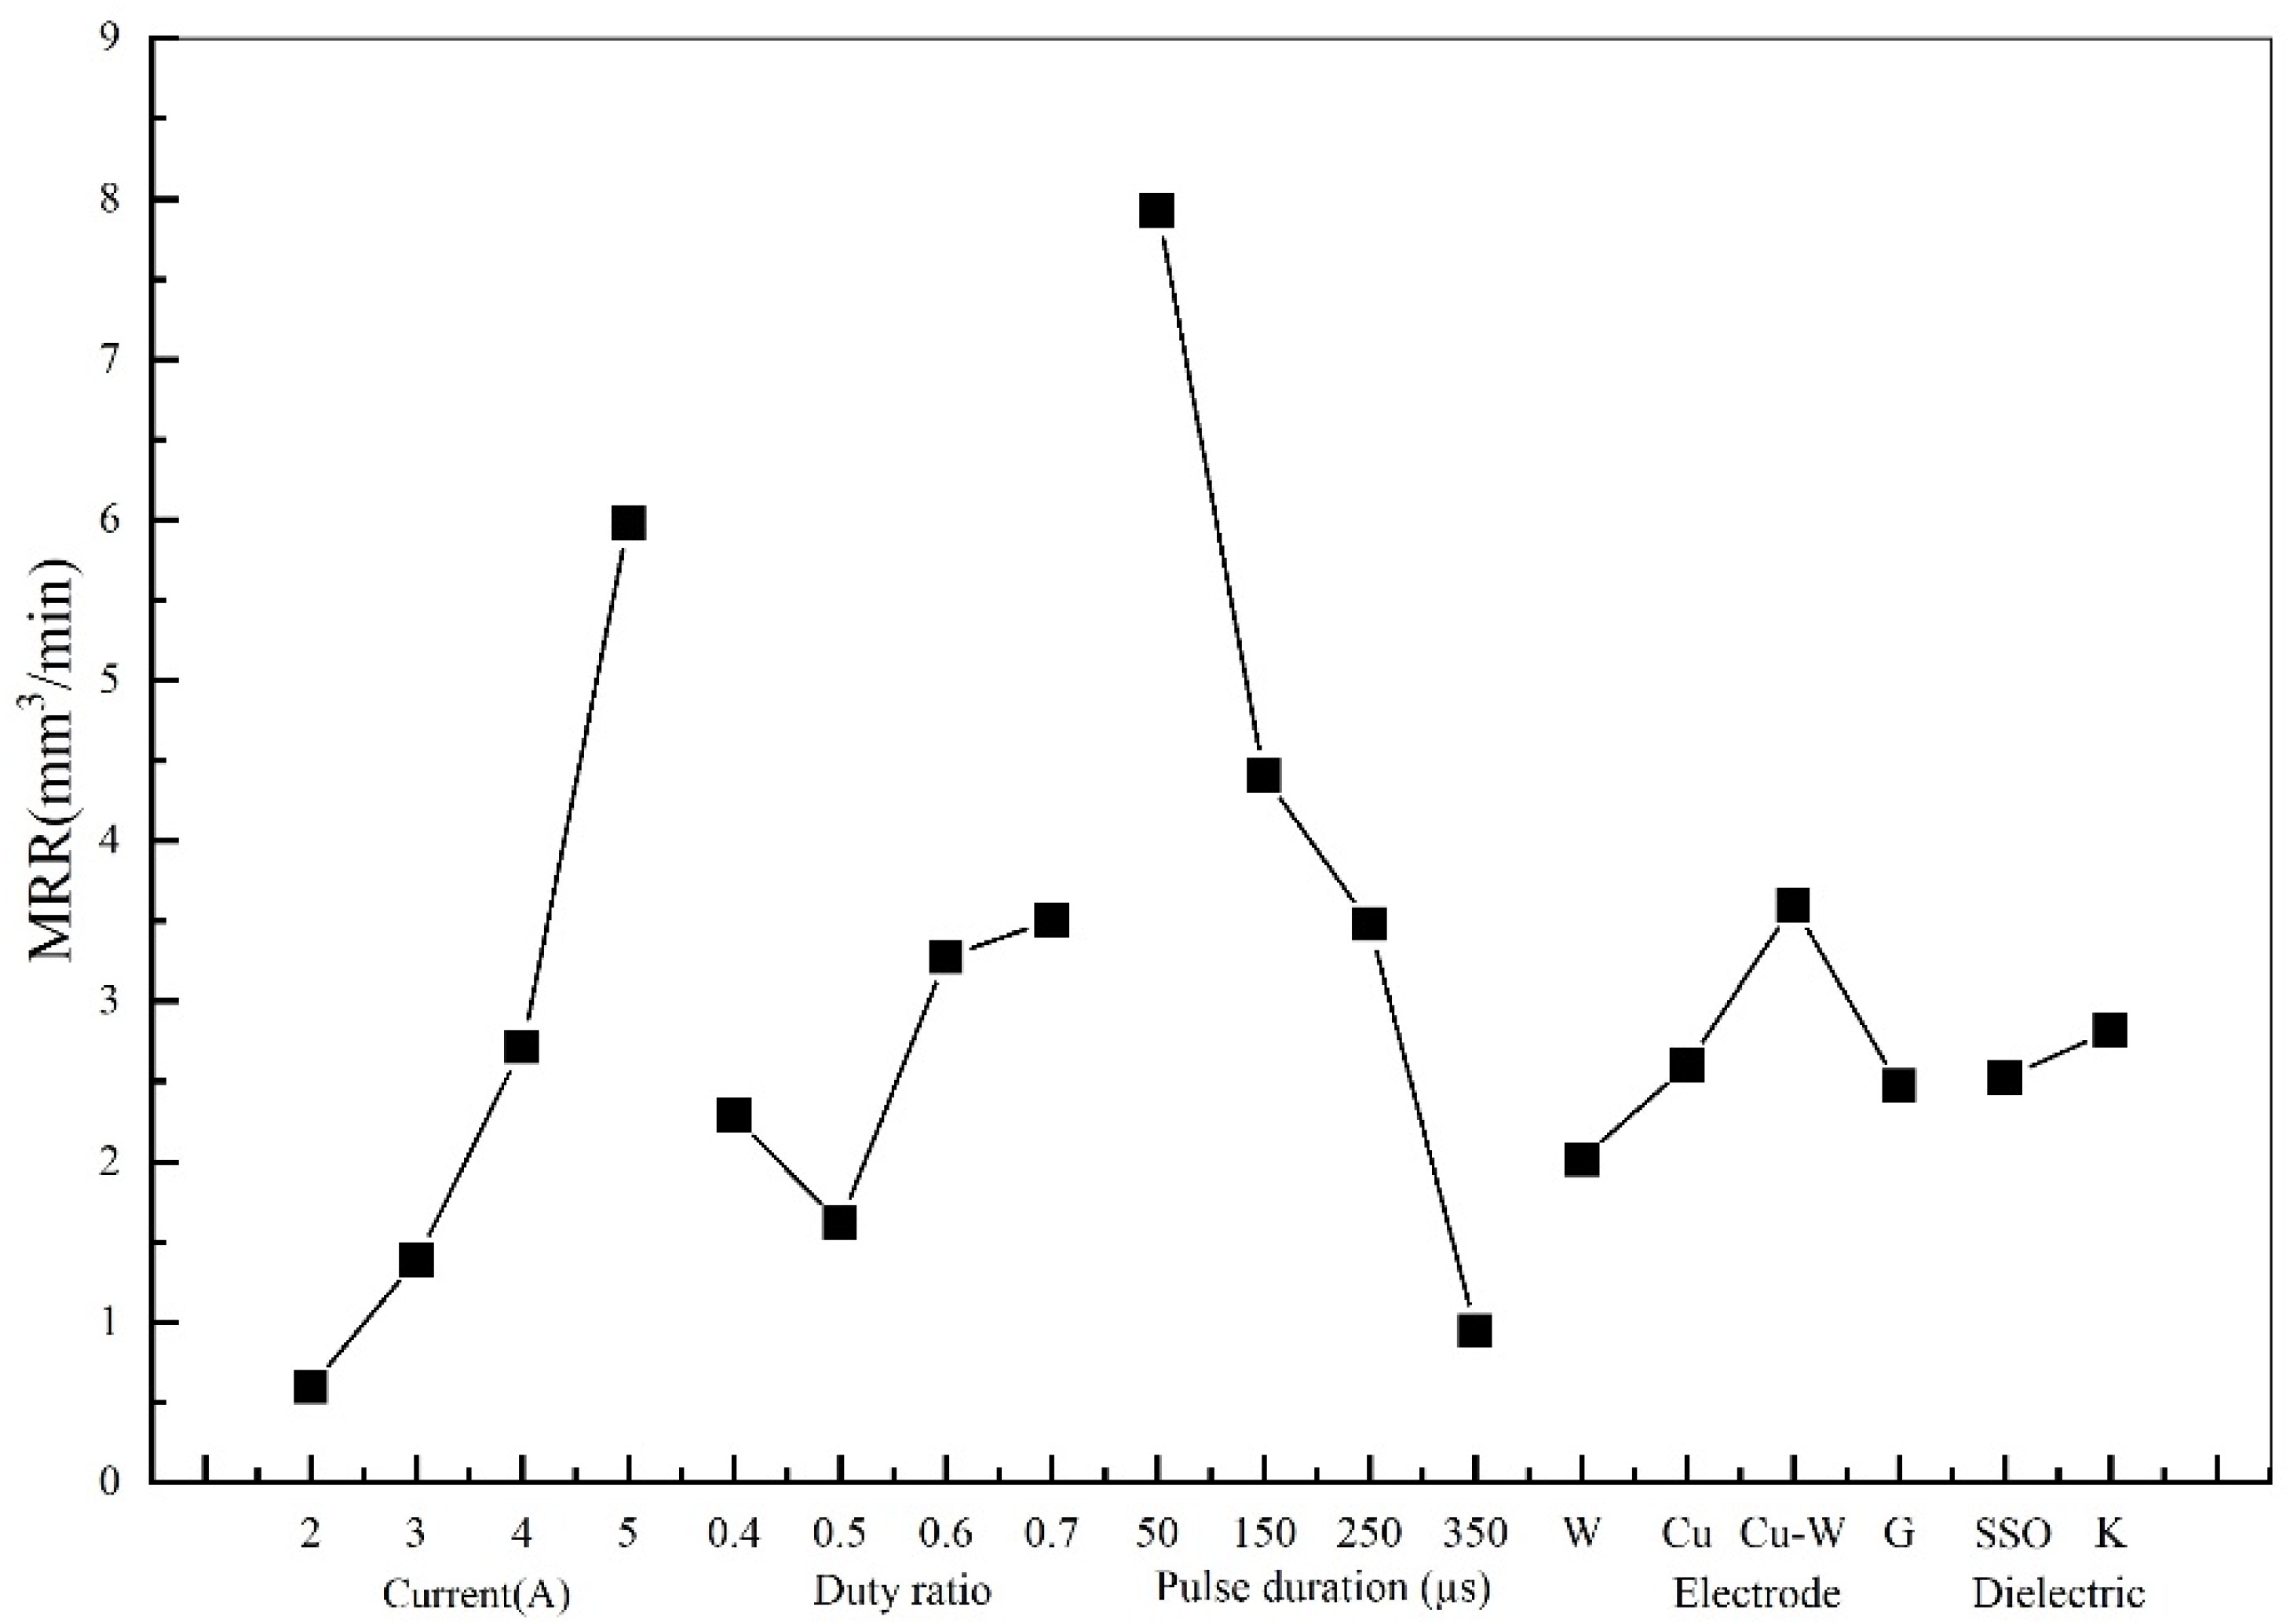
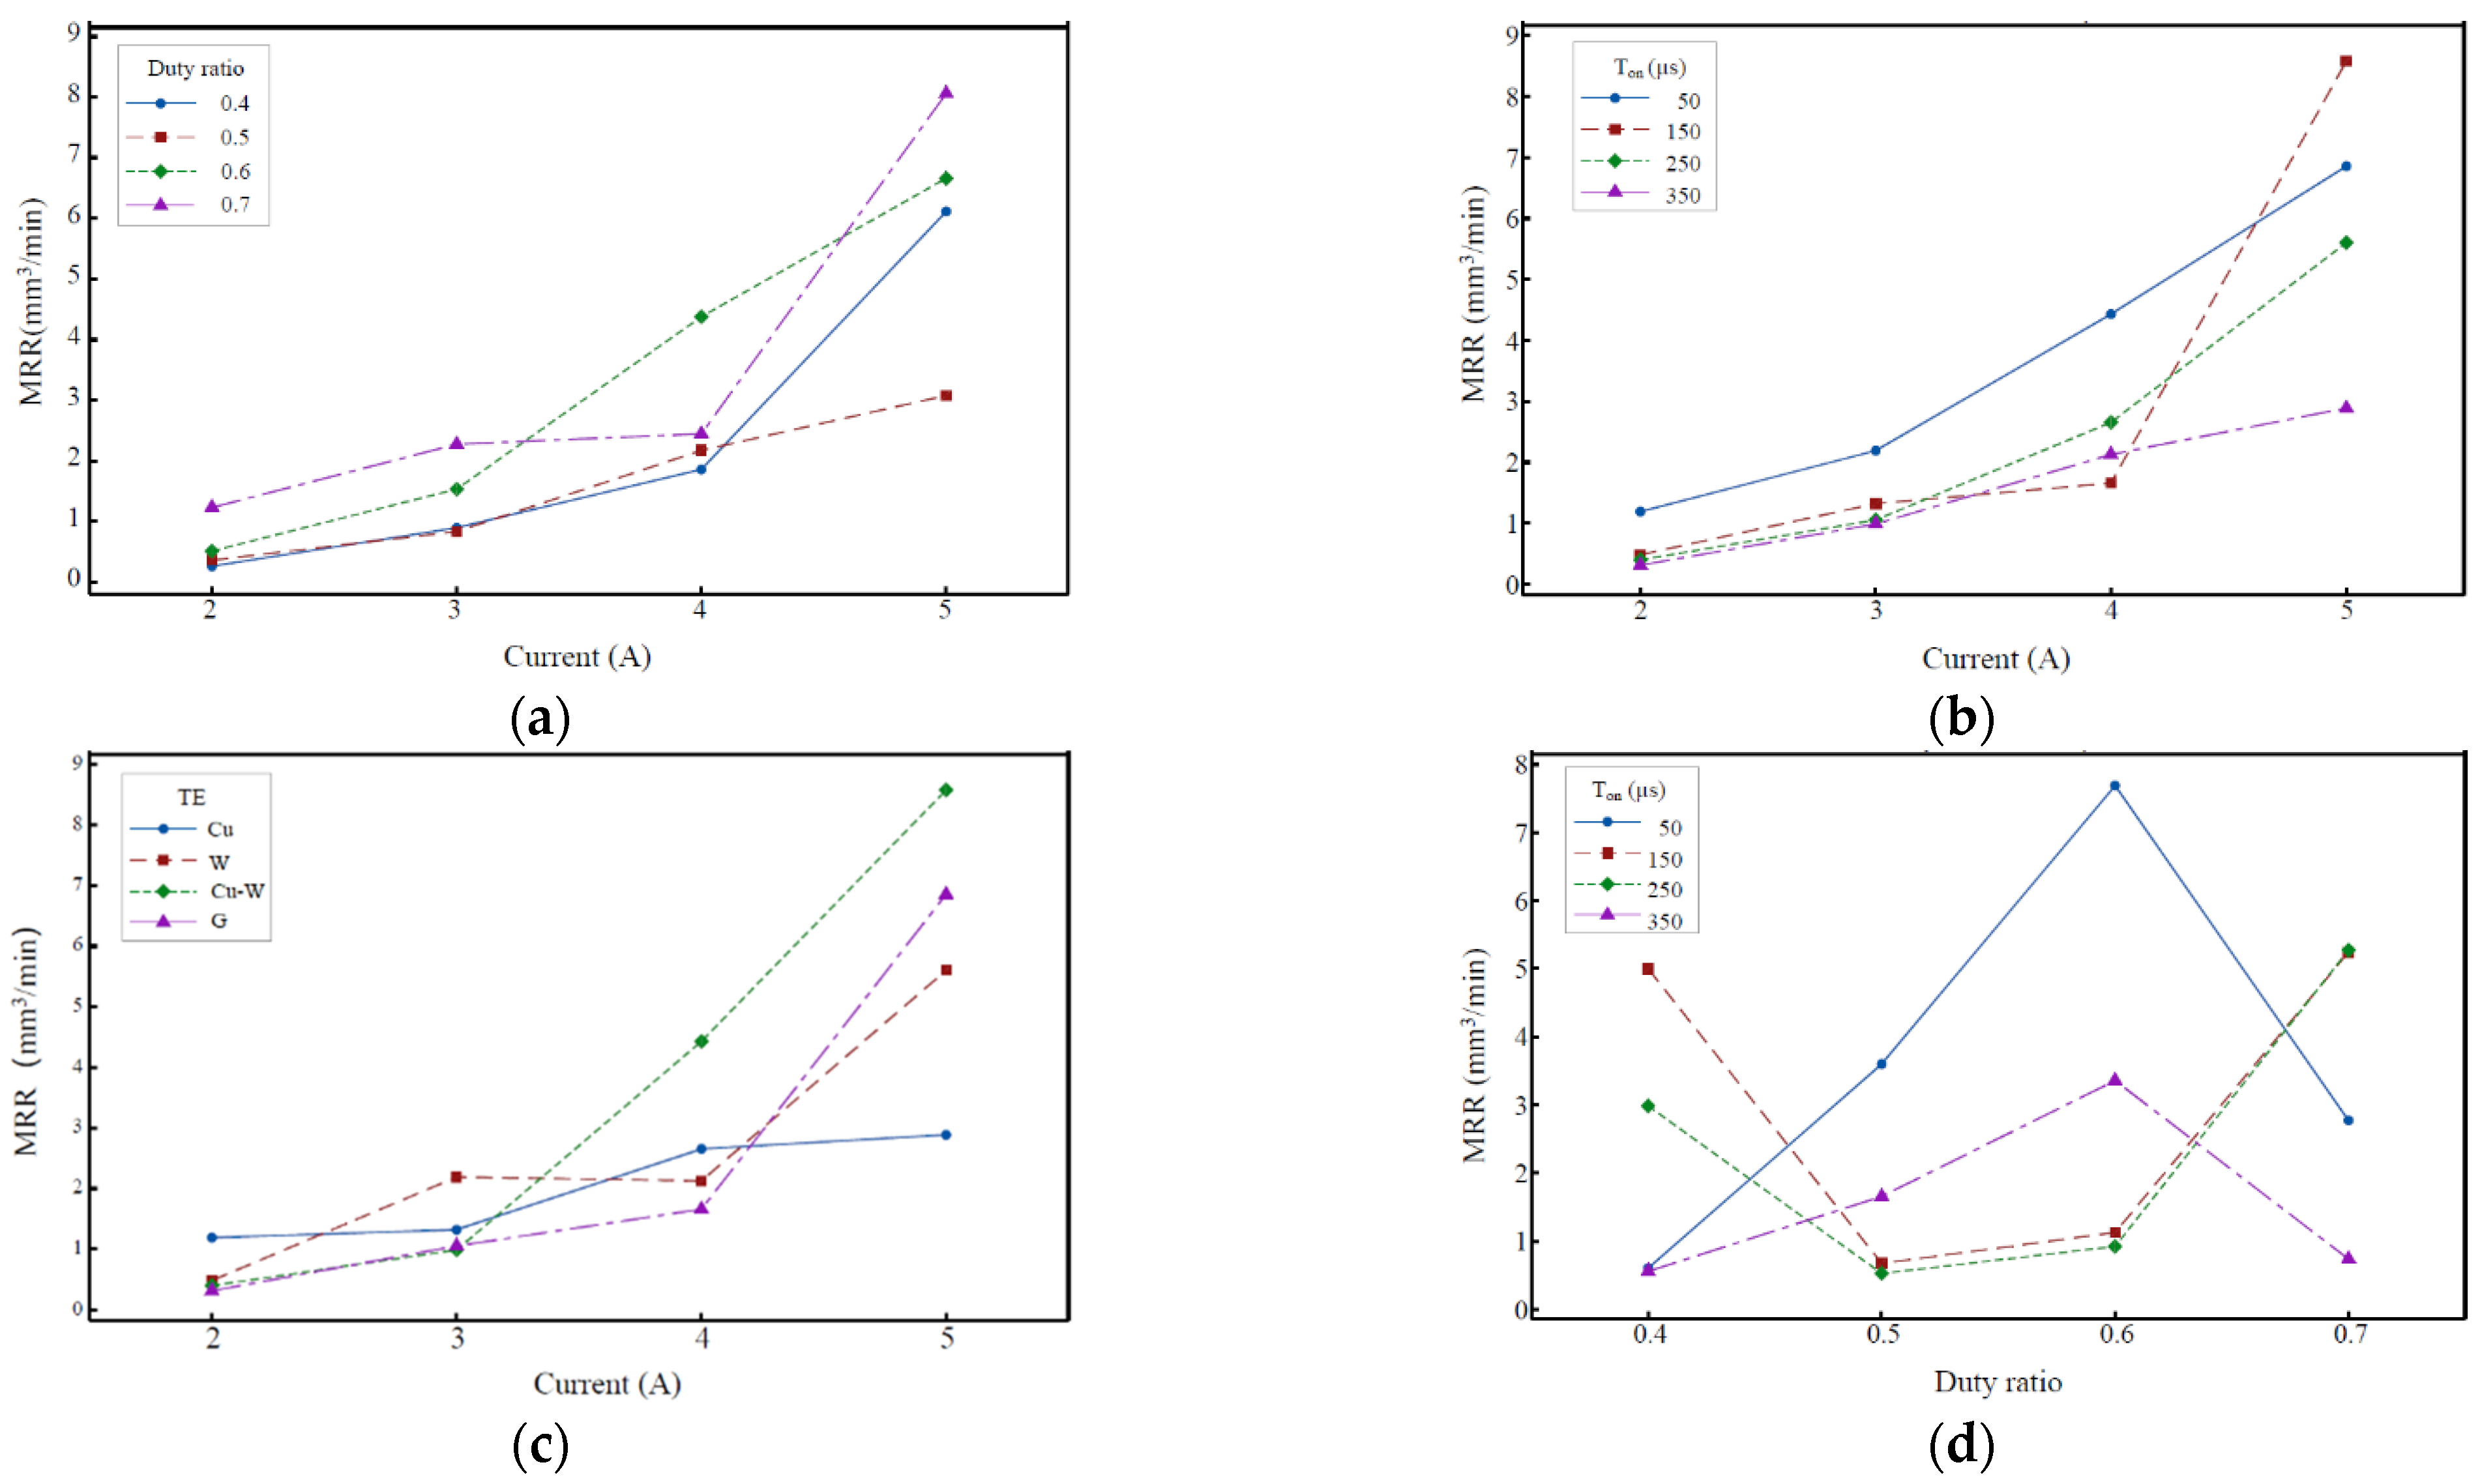
3.1.1. MRR
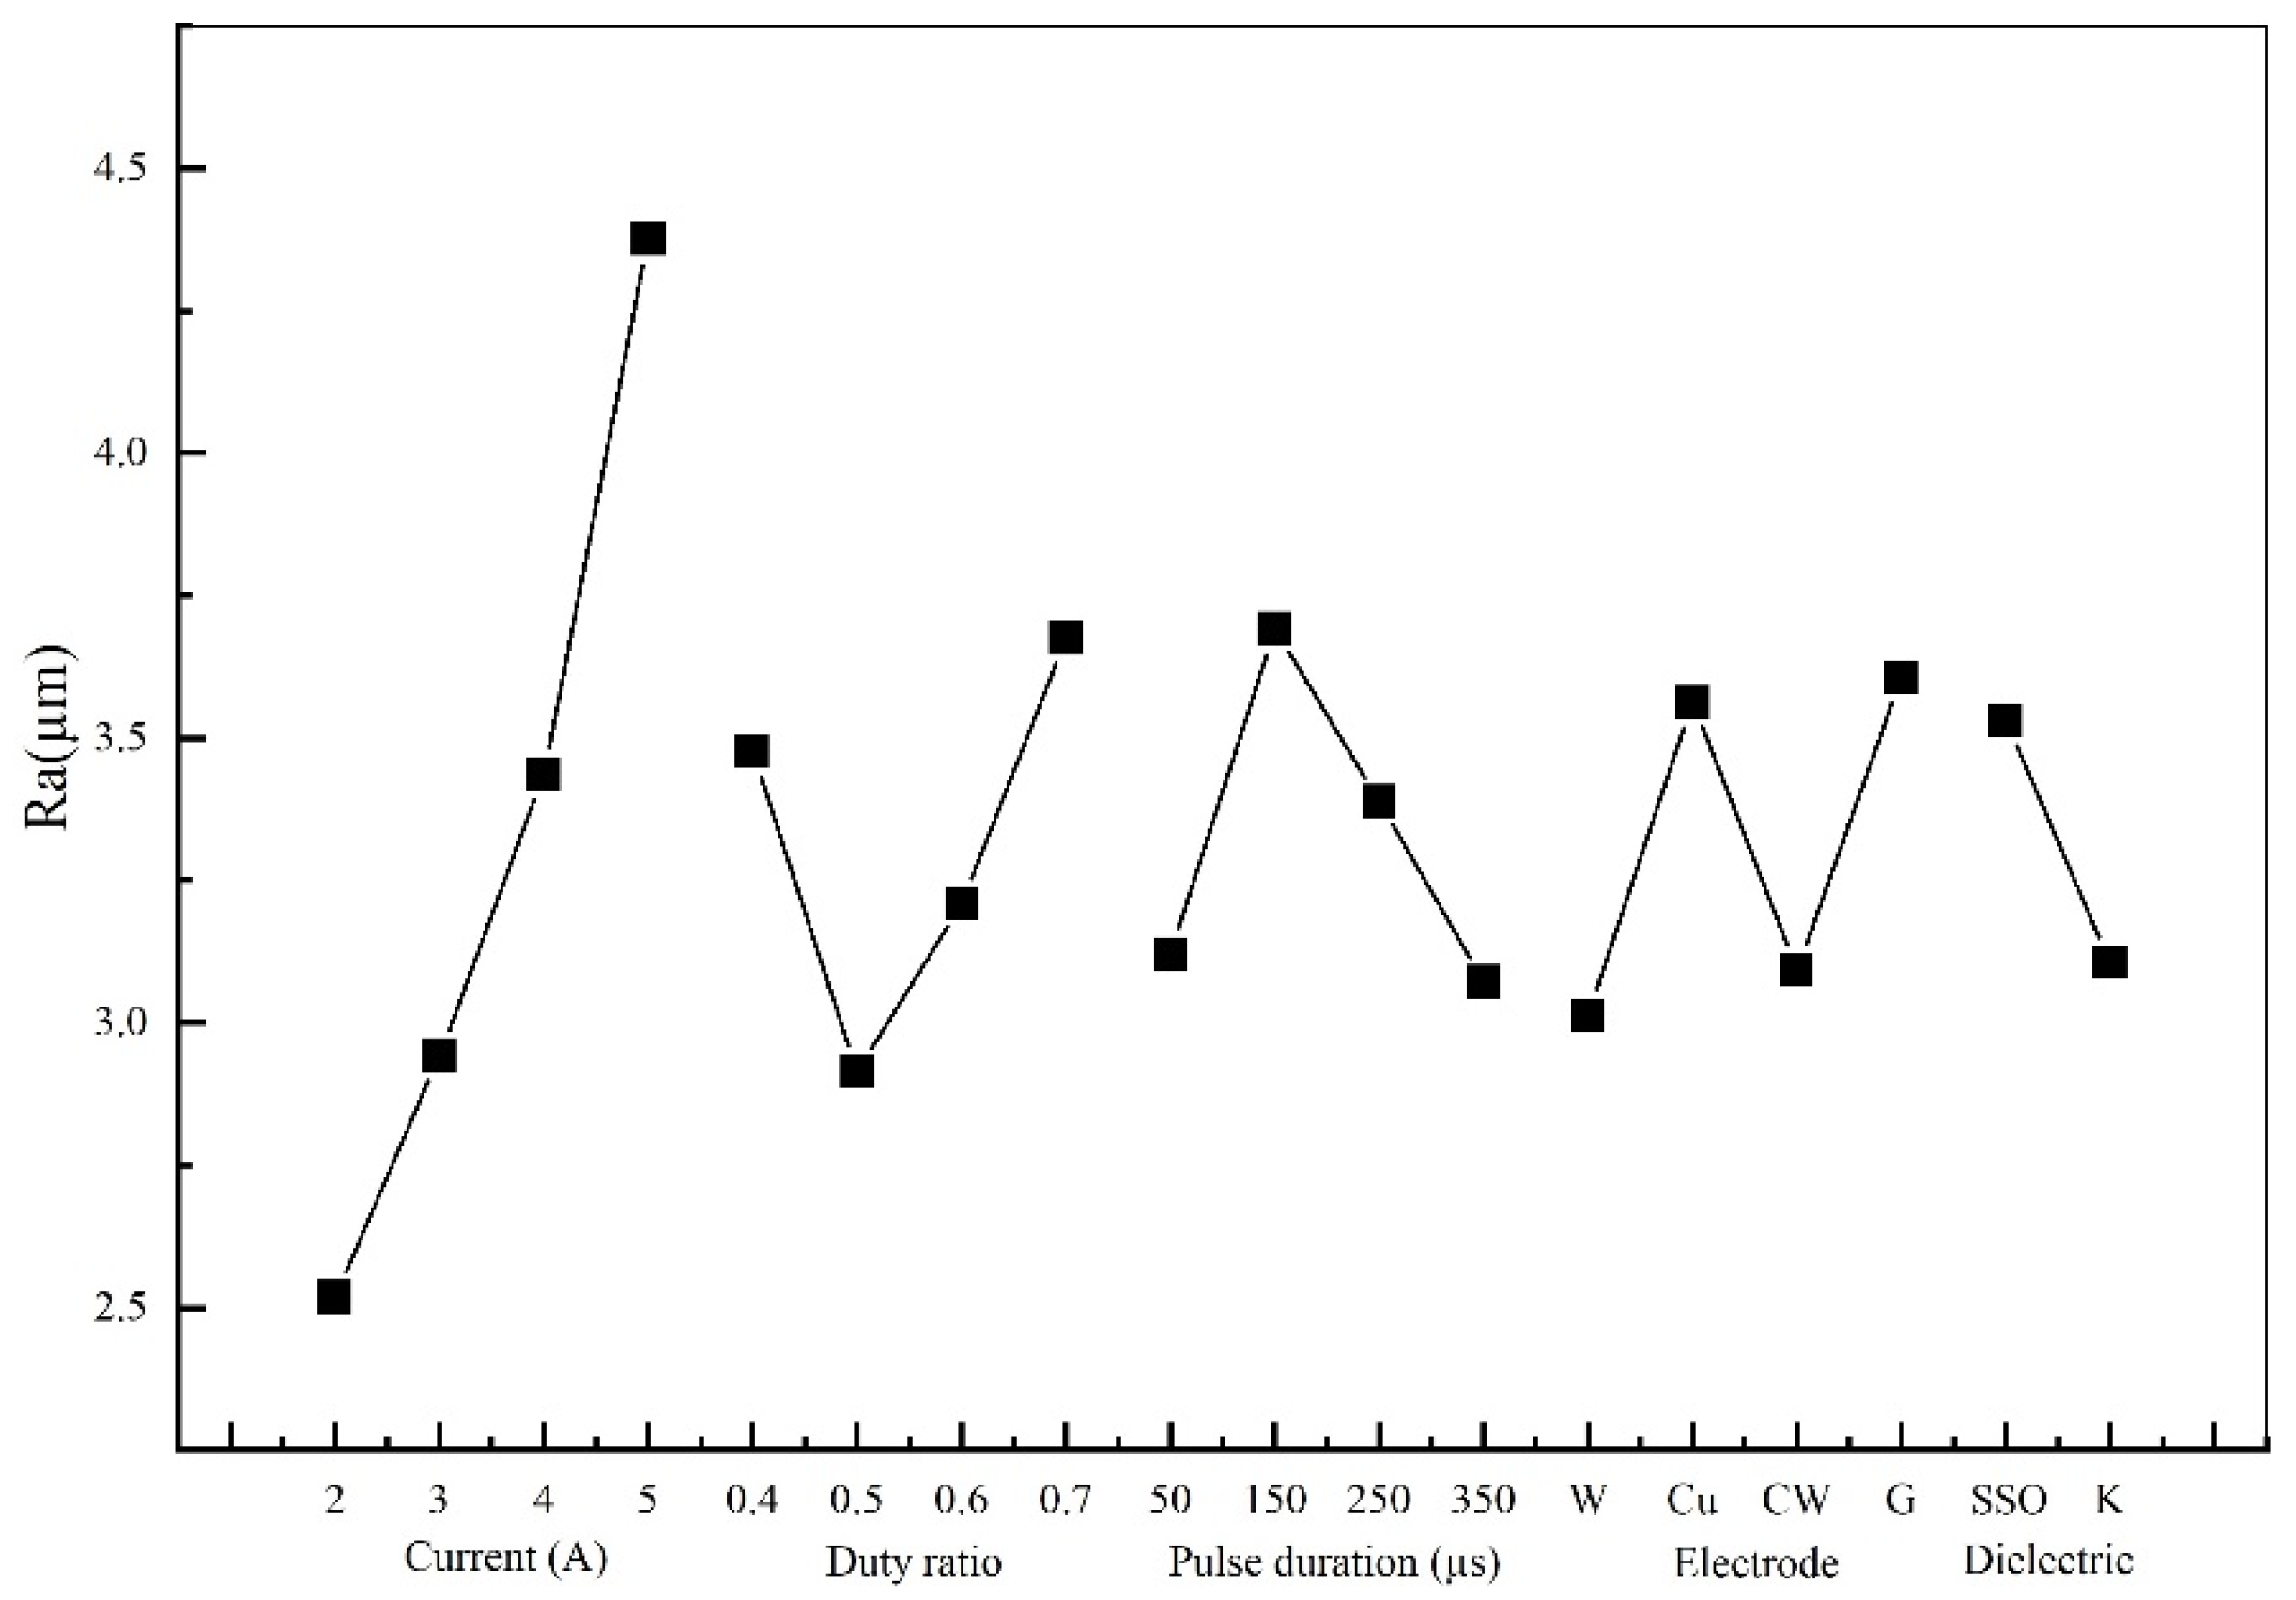
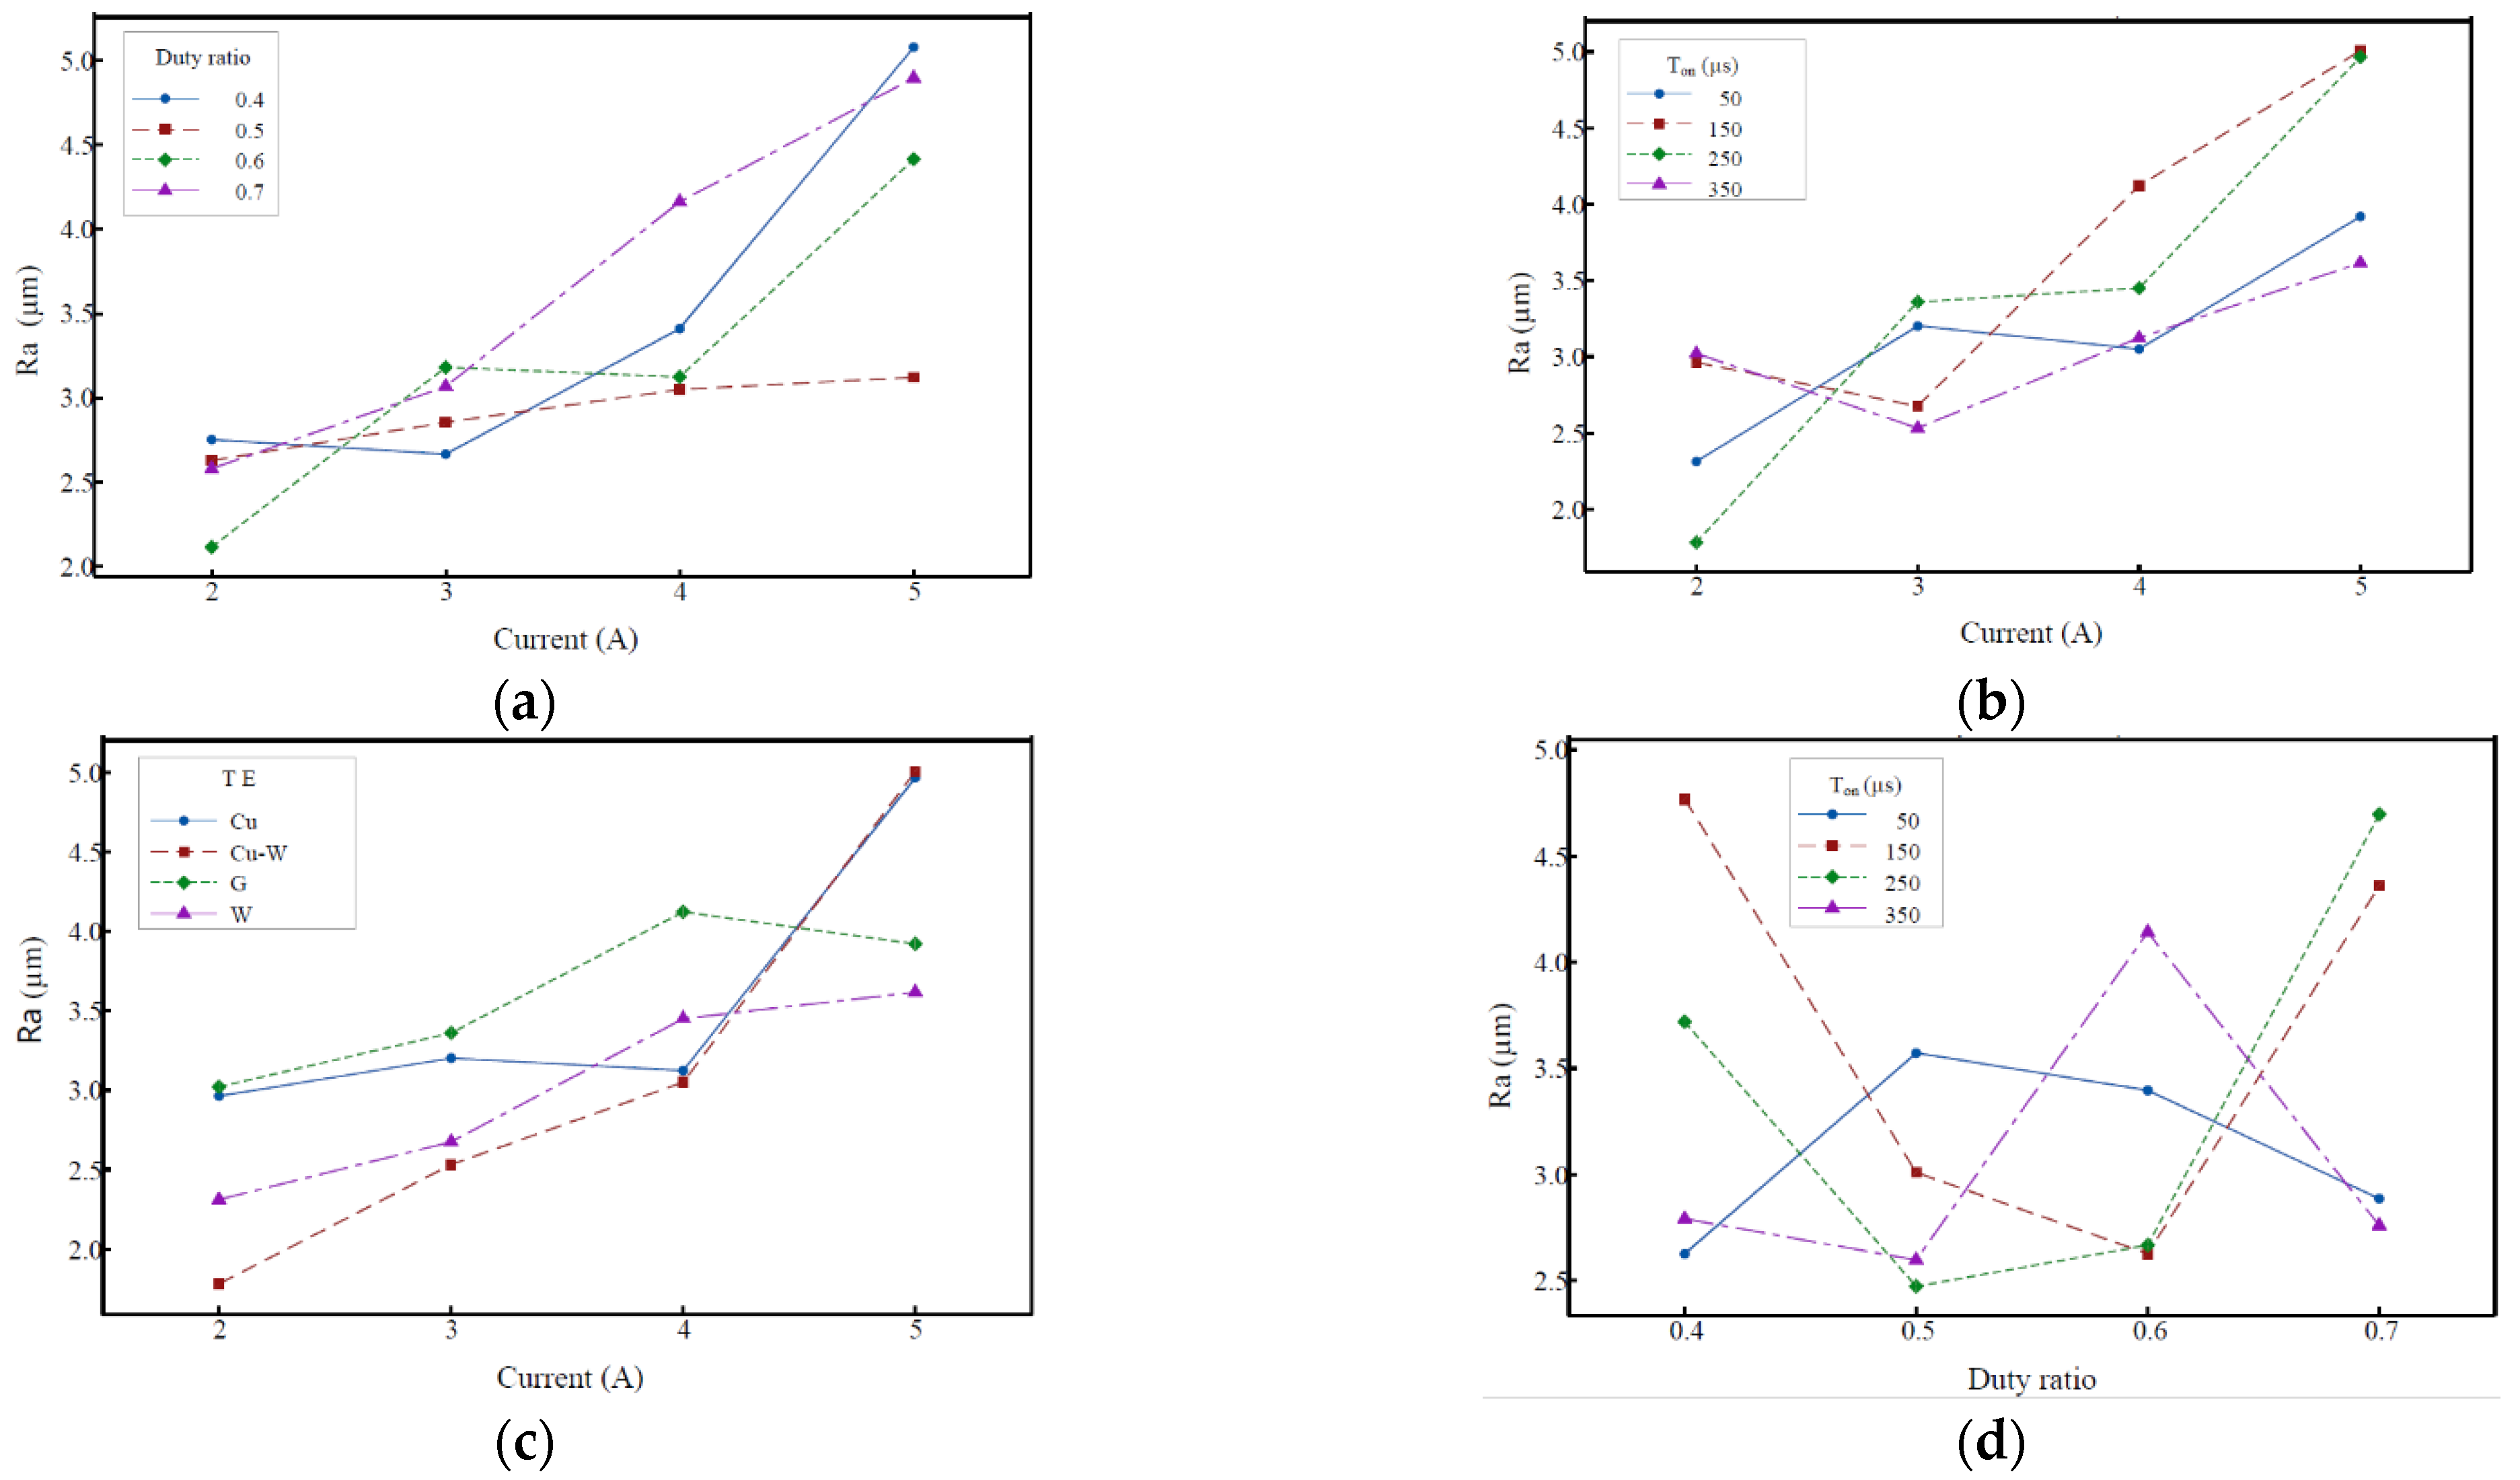
3.1.2. Ra
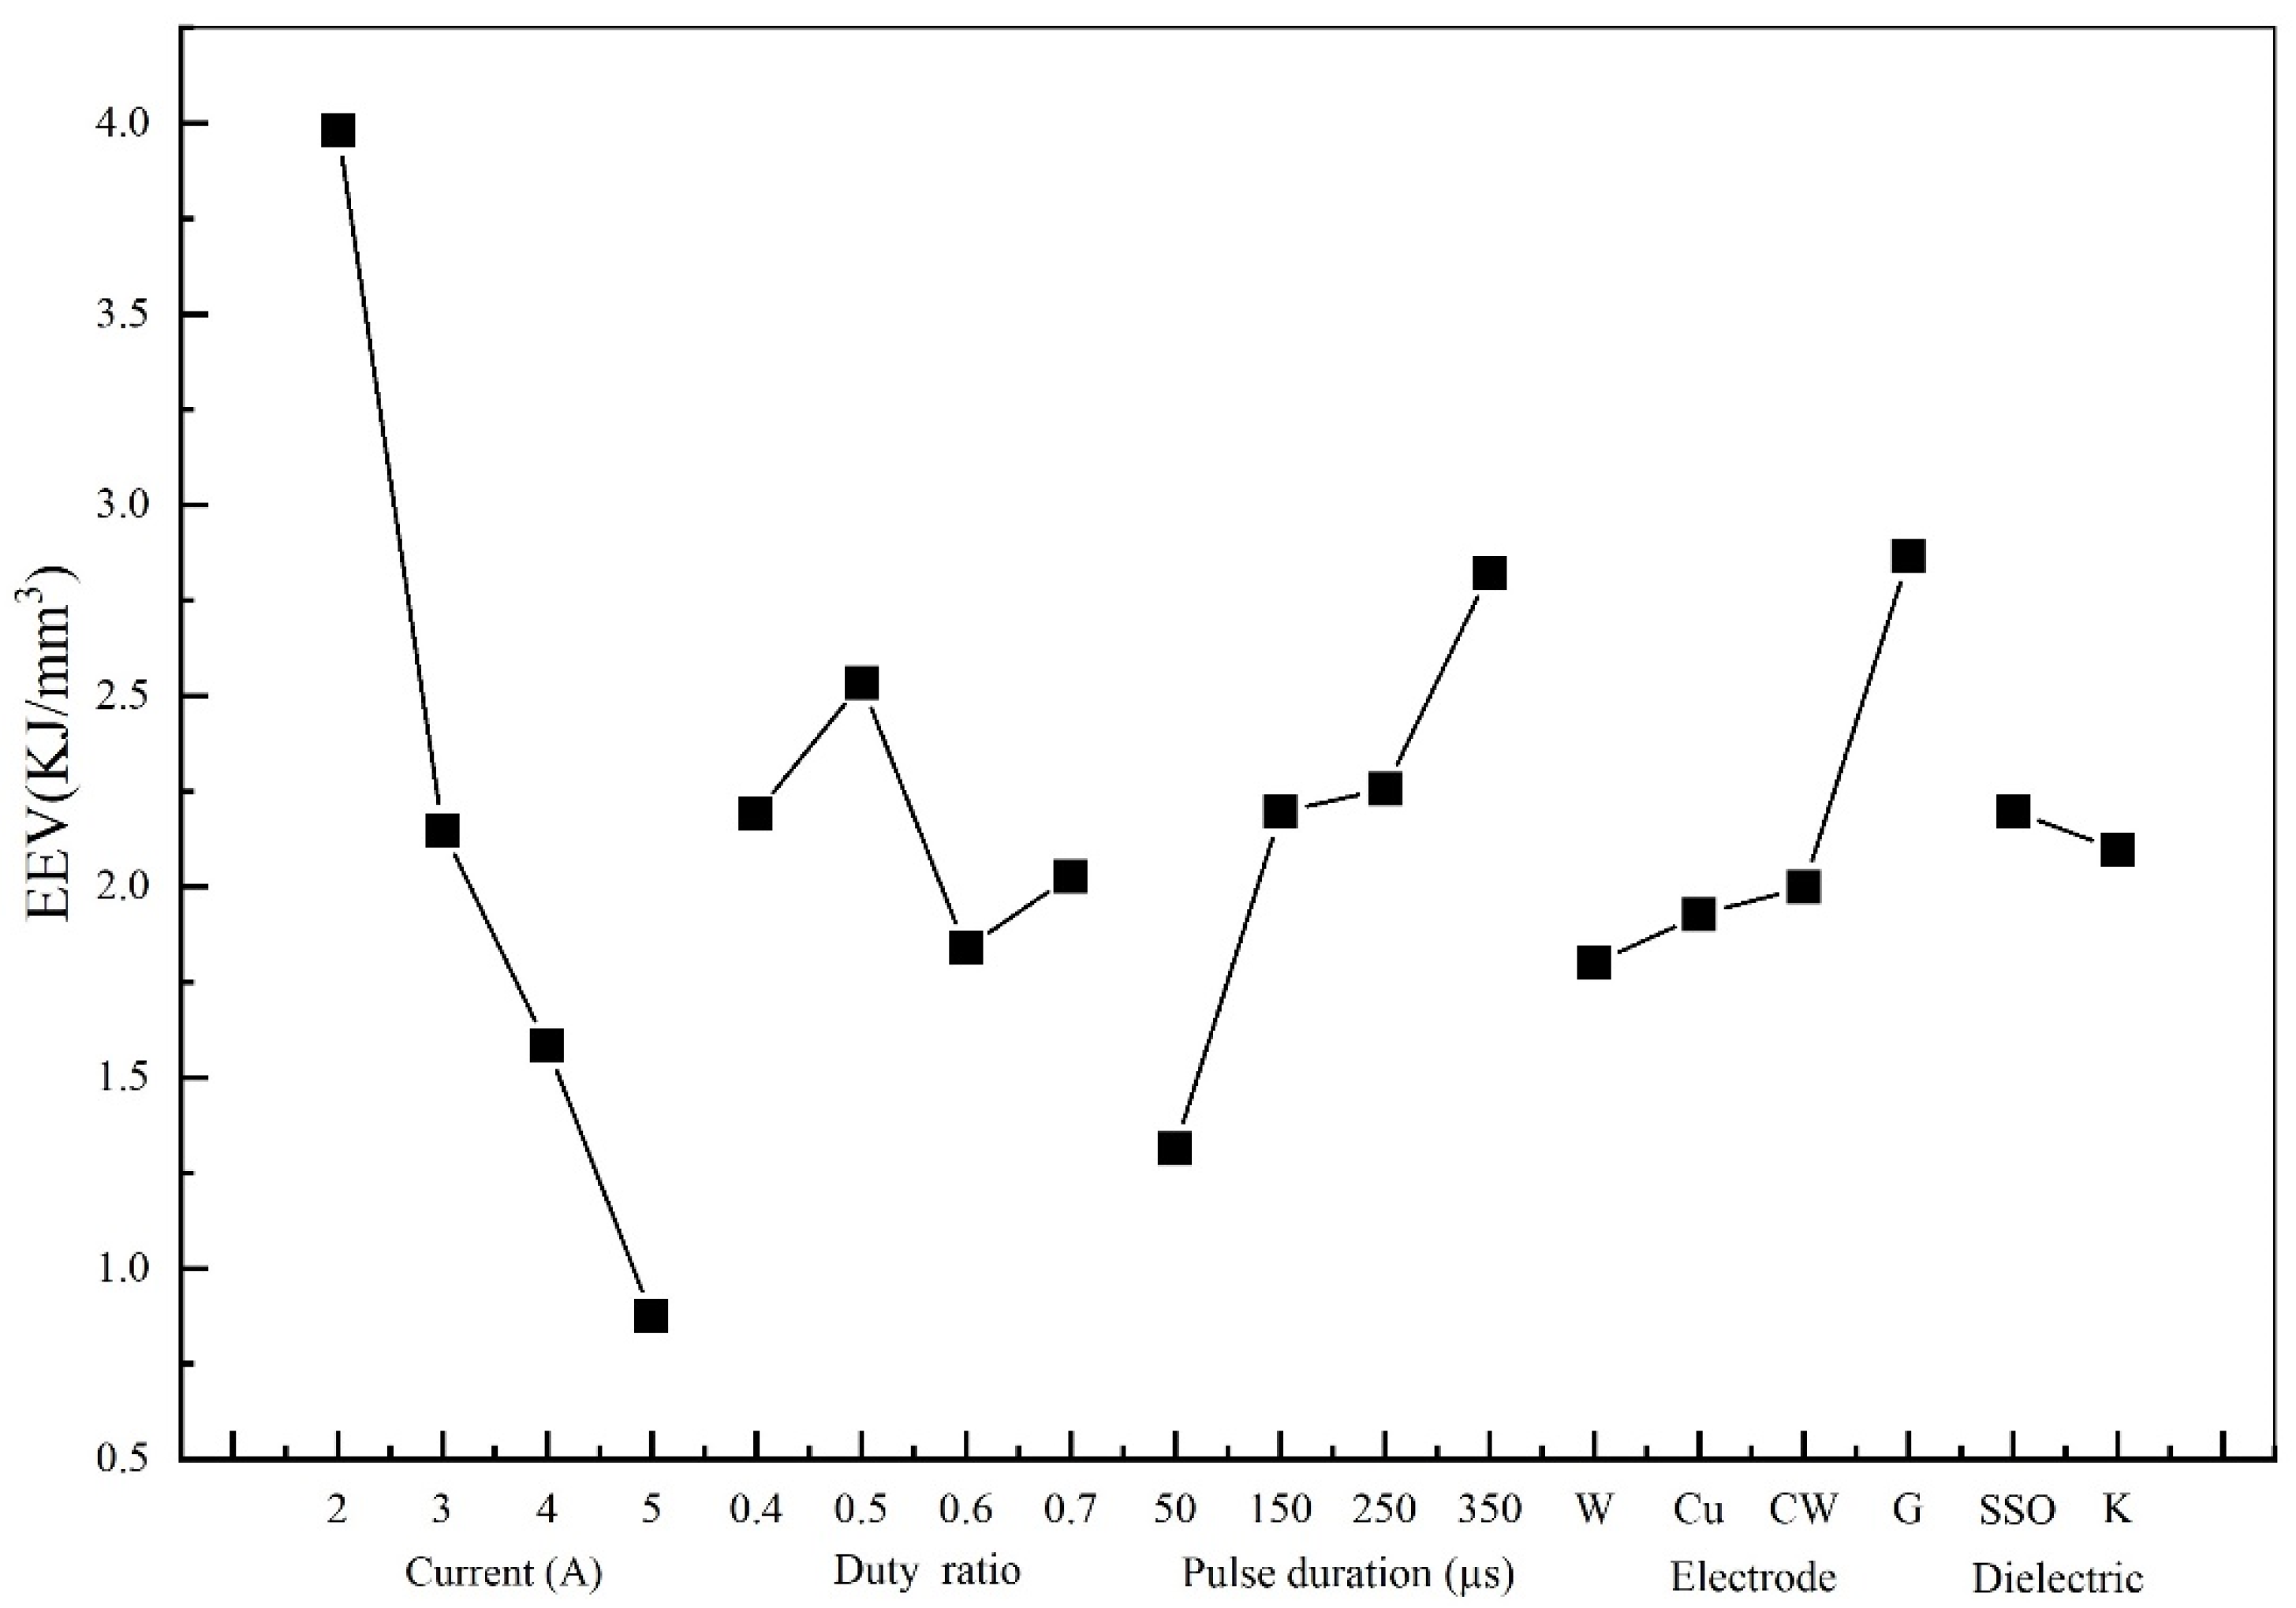
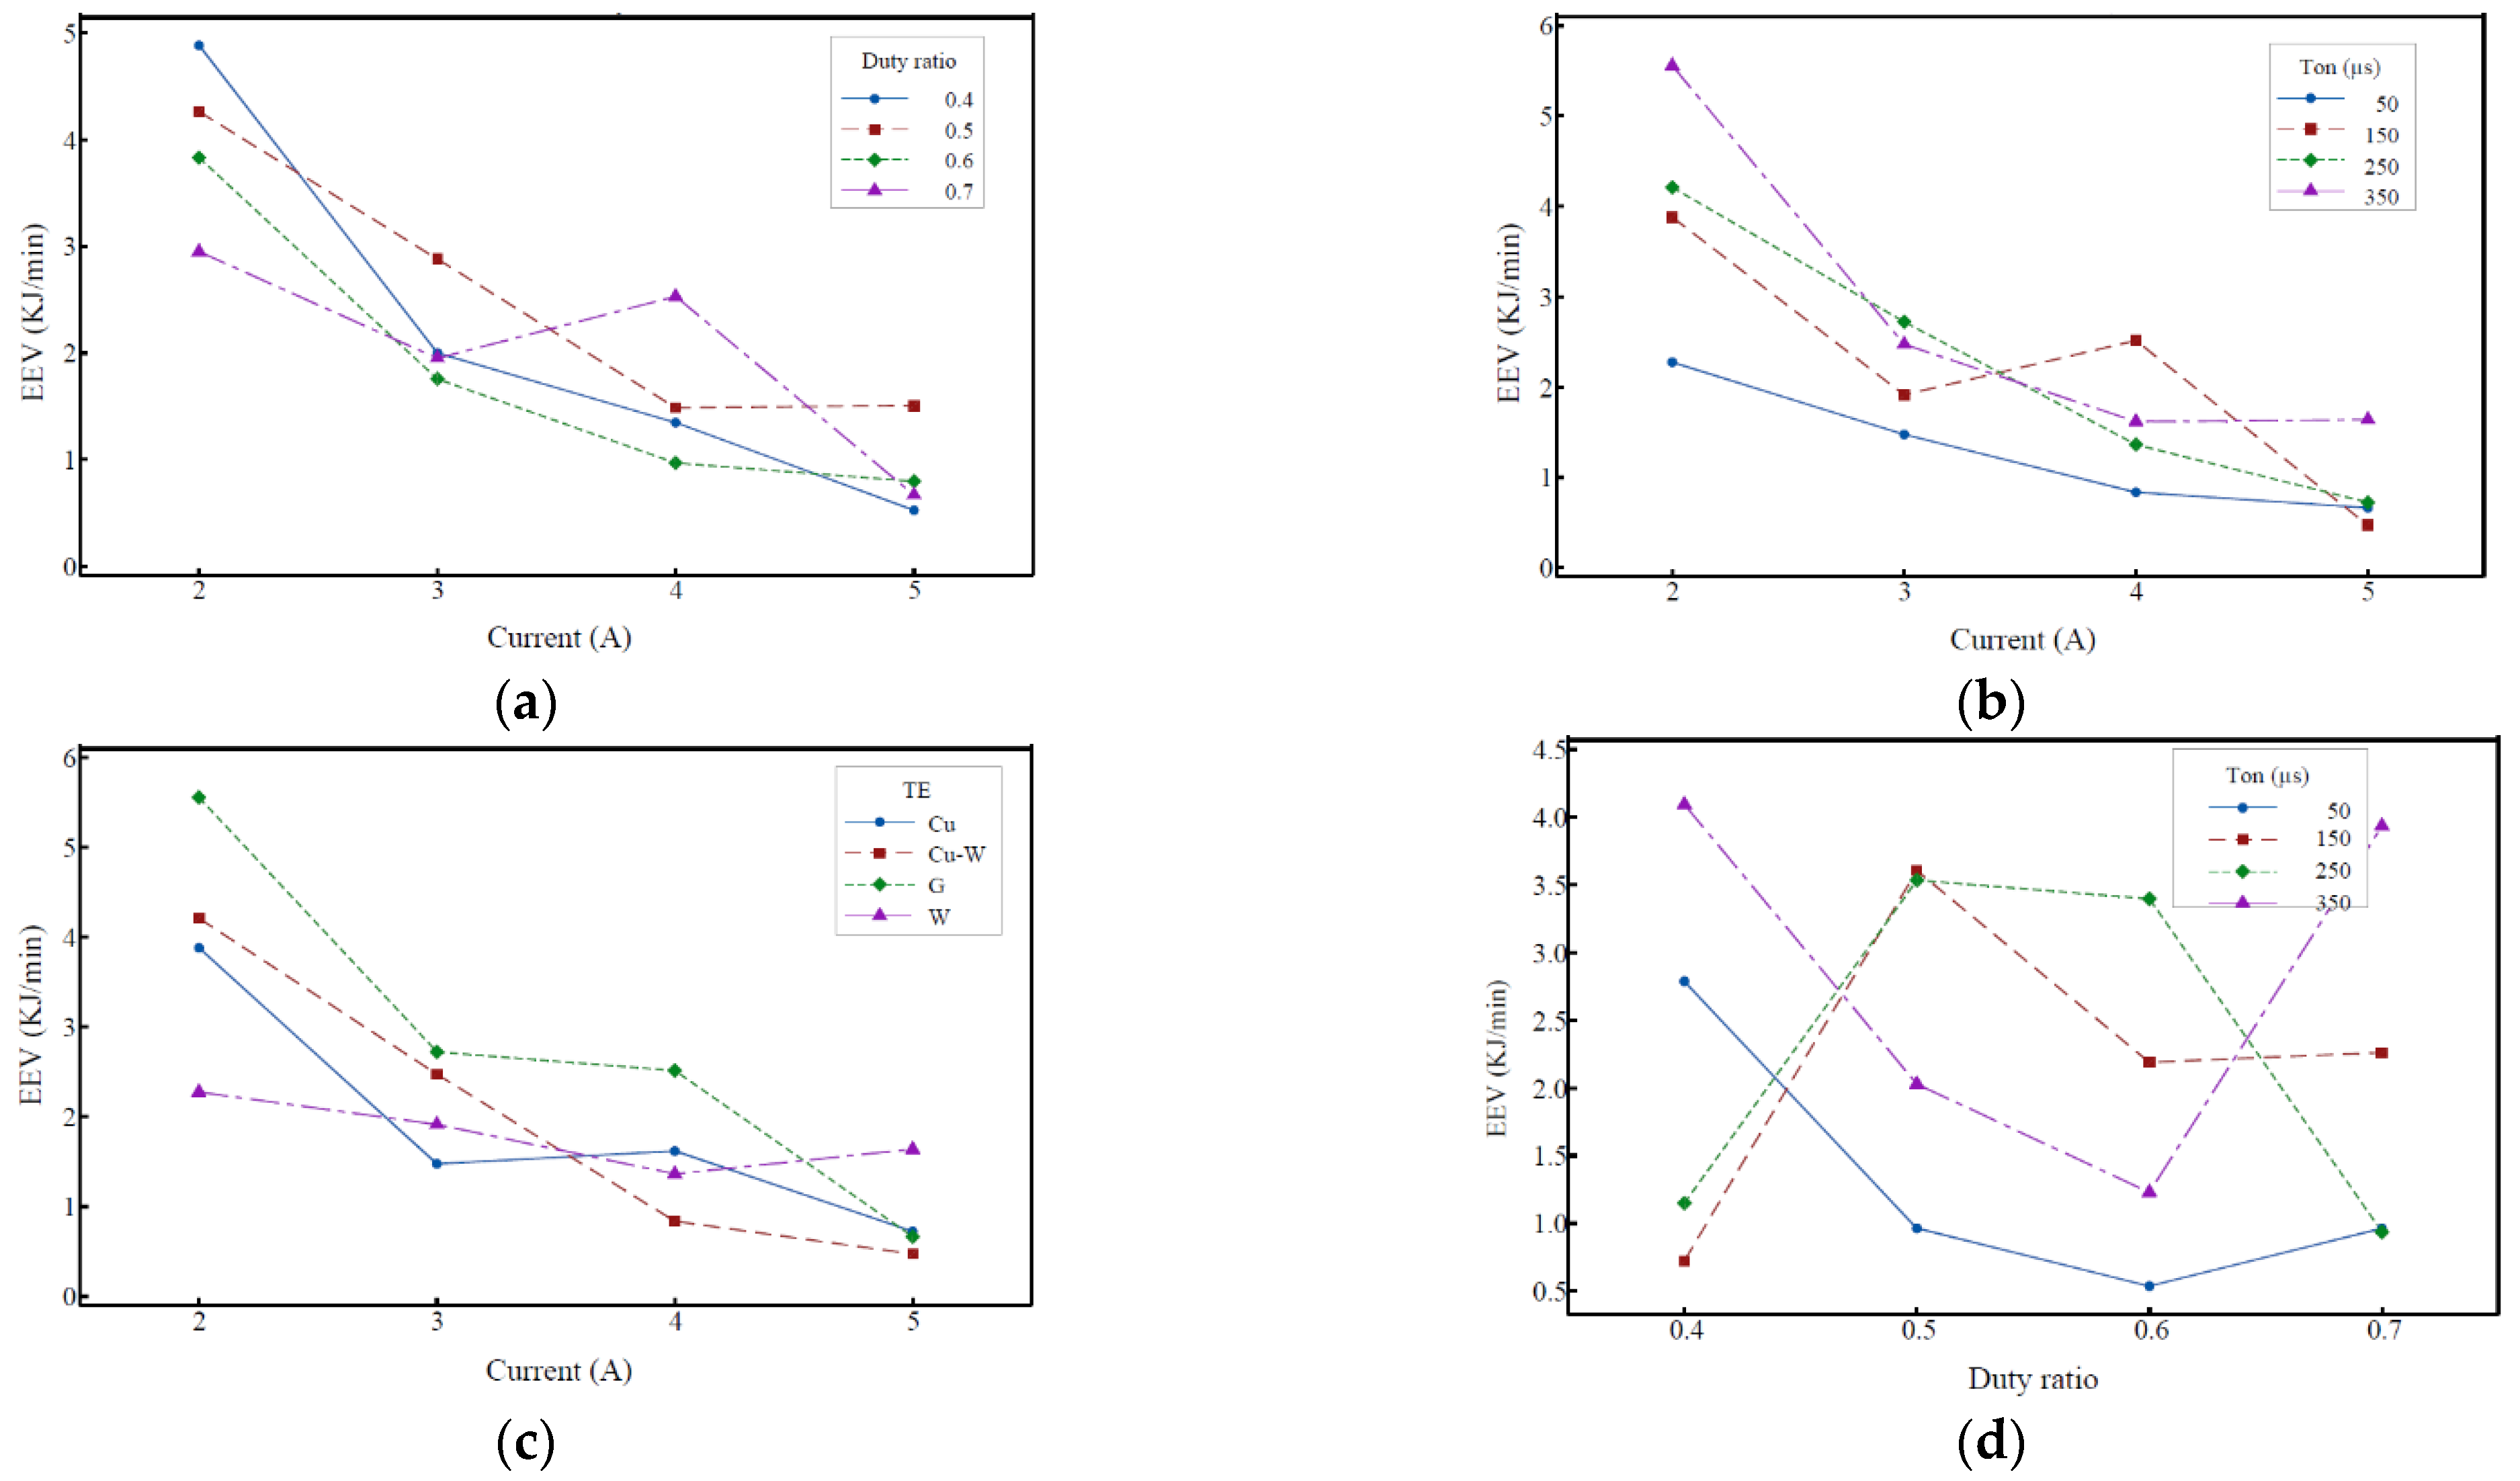
3.1.3. EEV
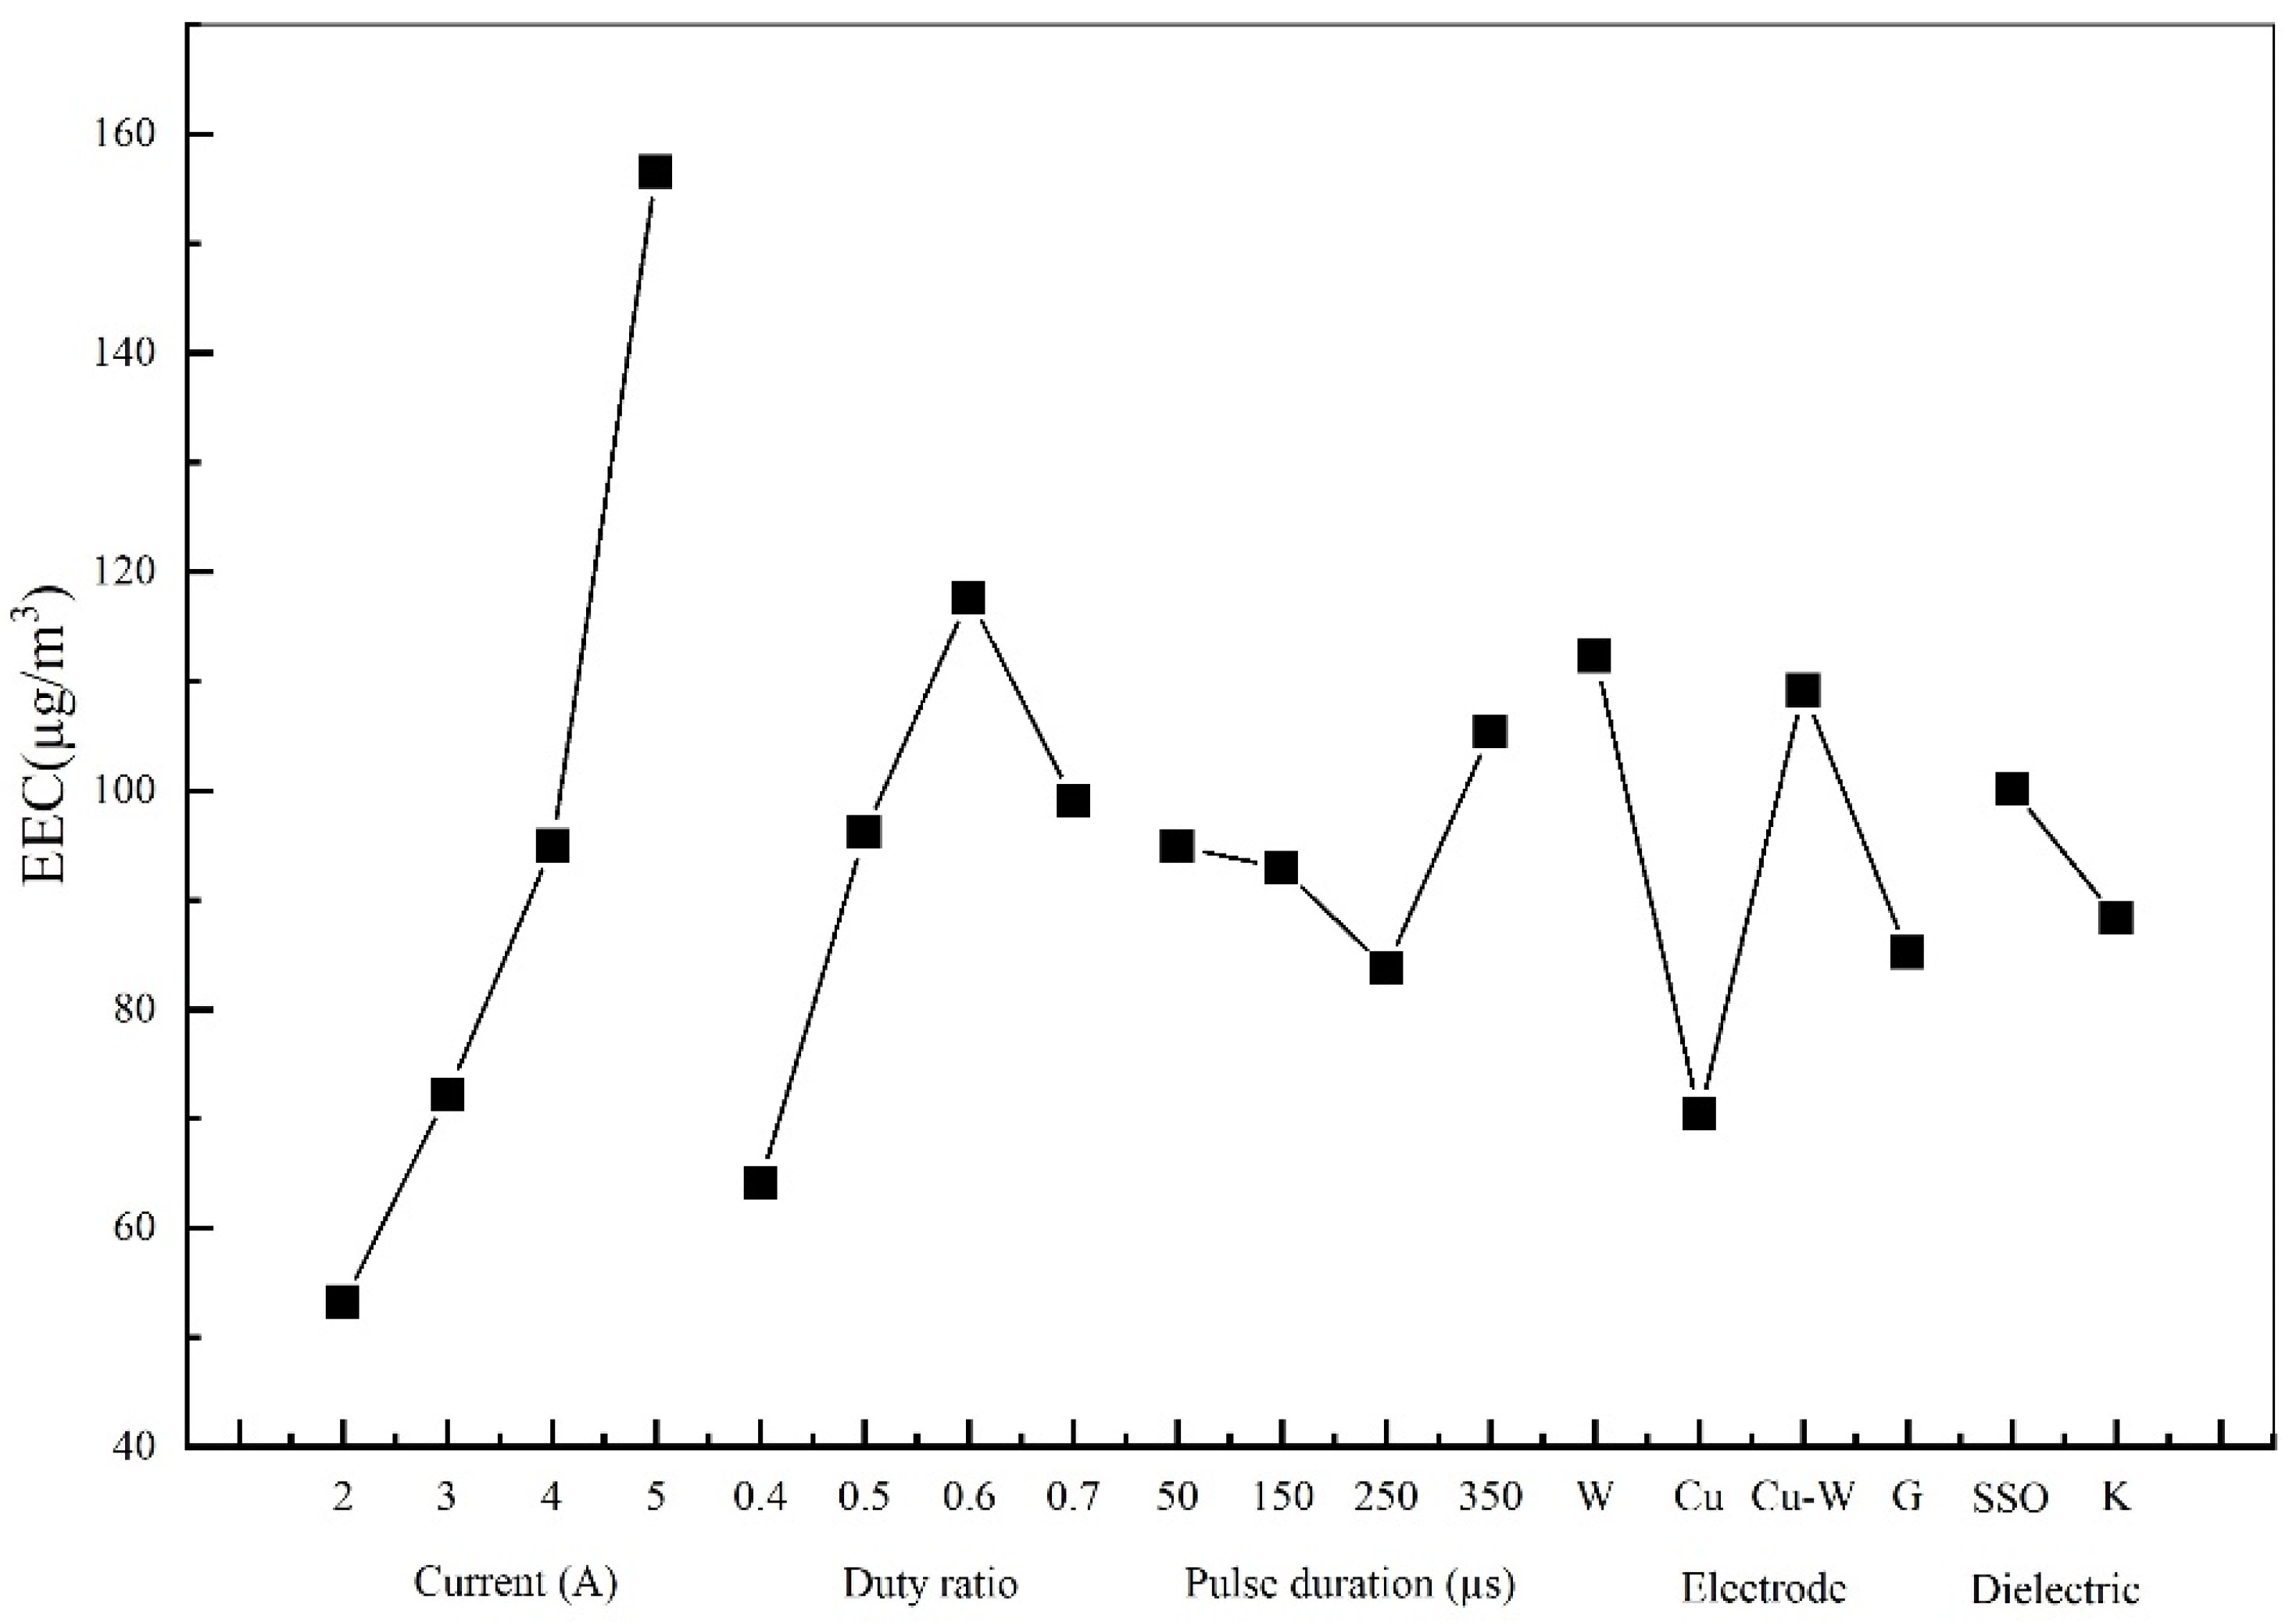
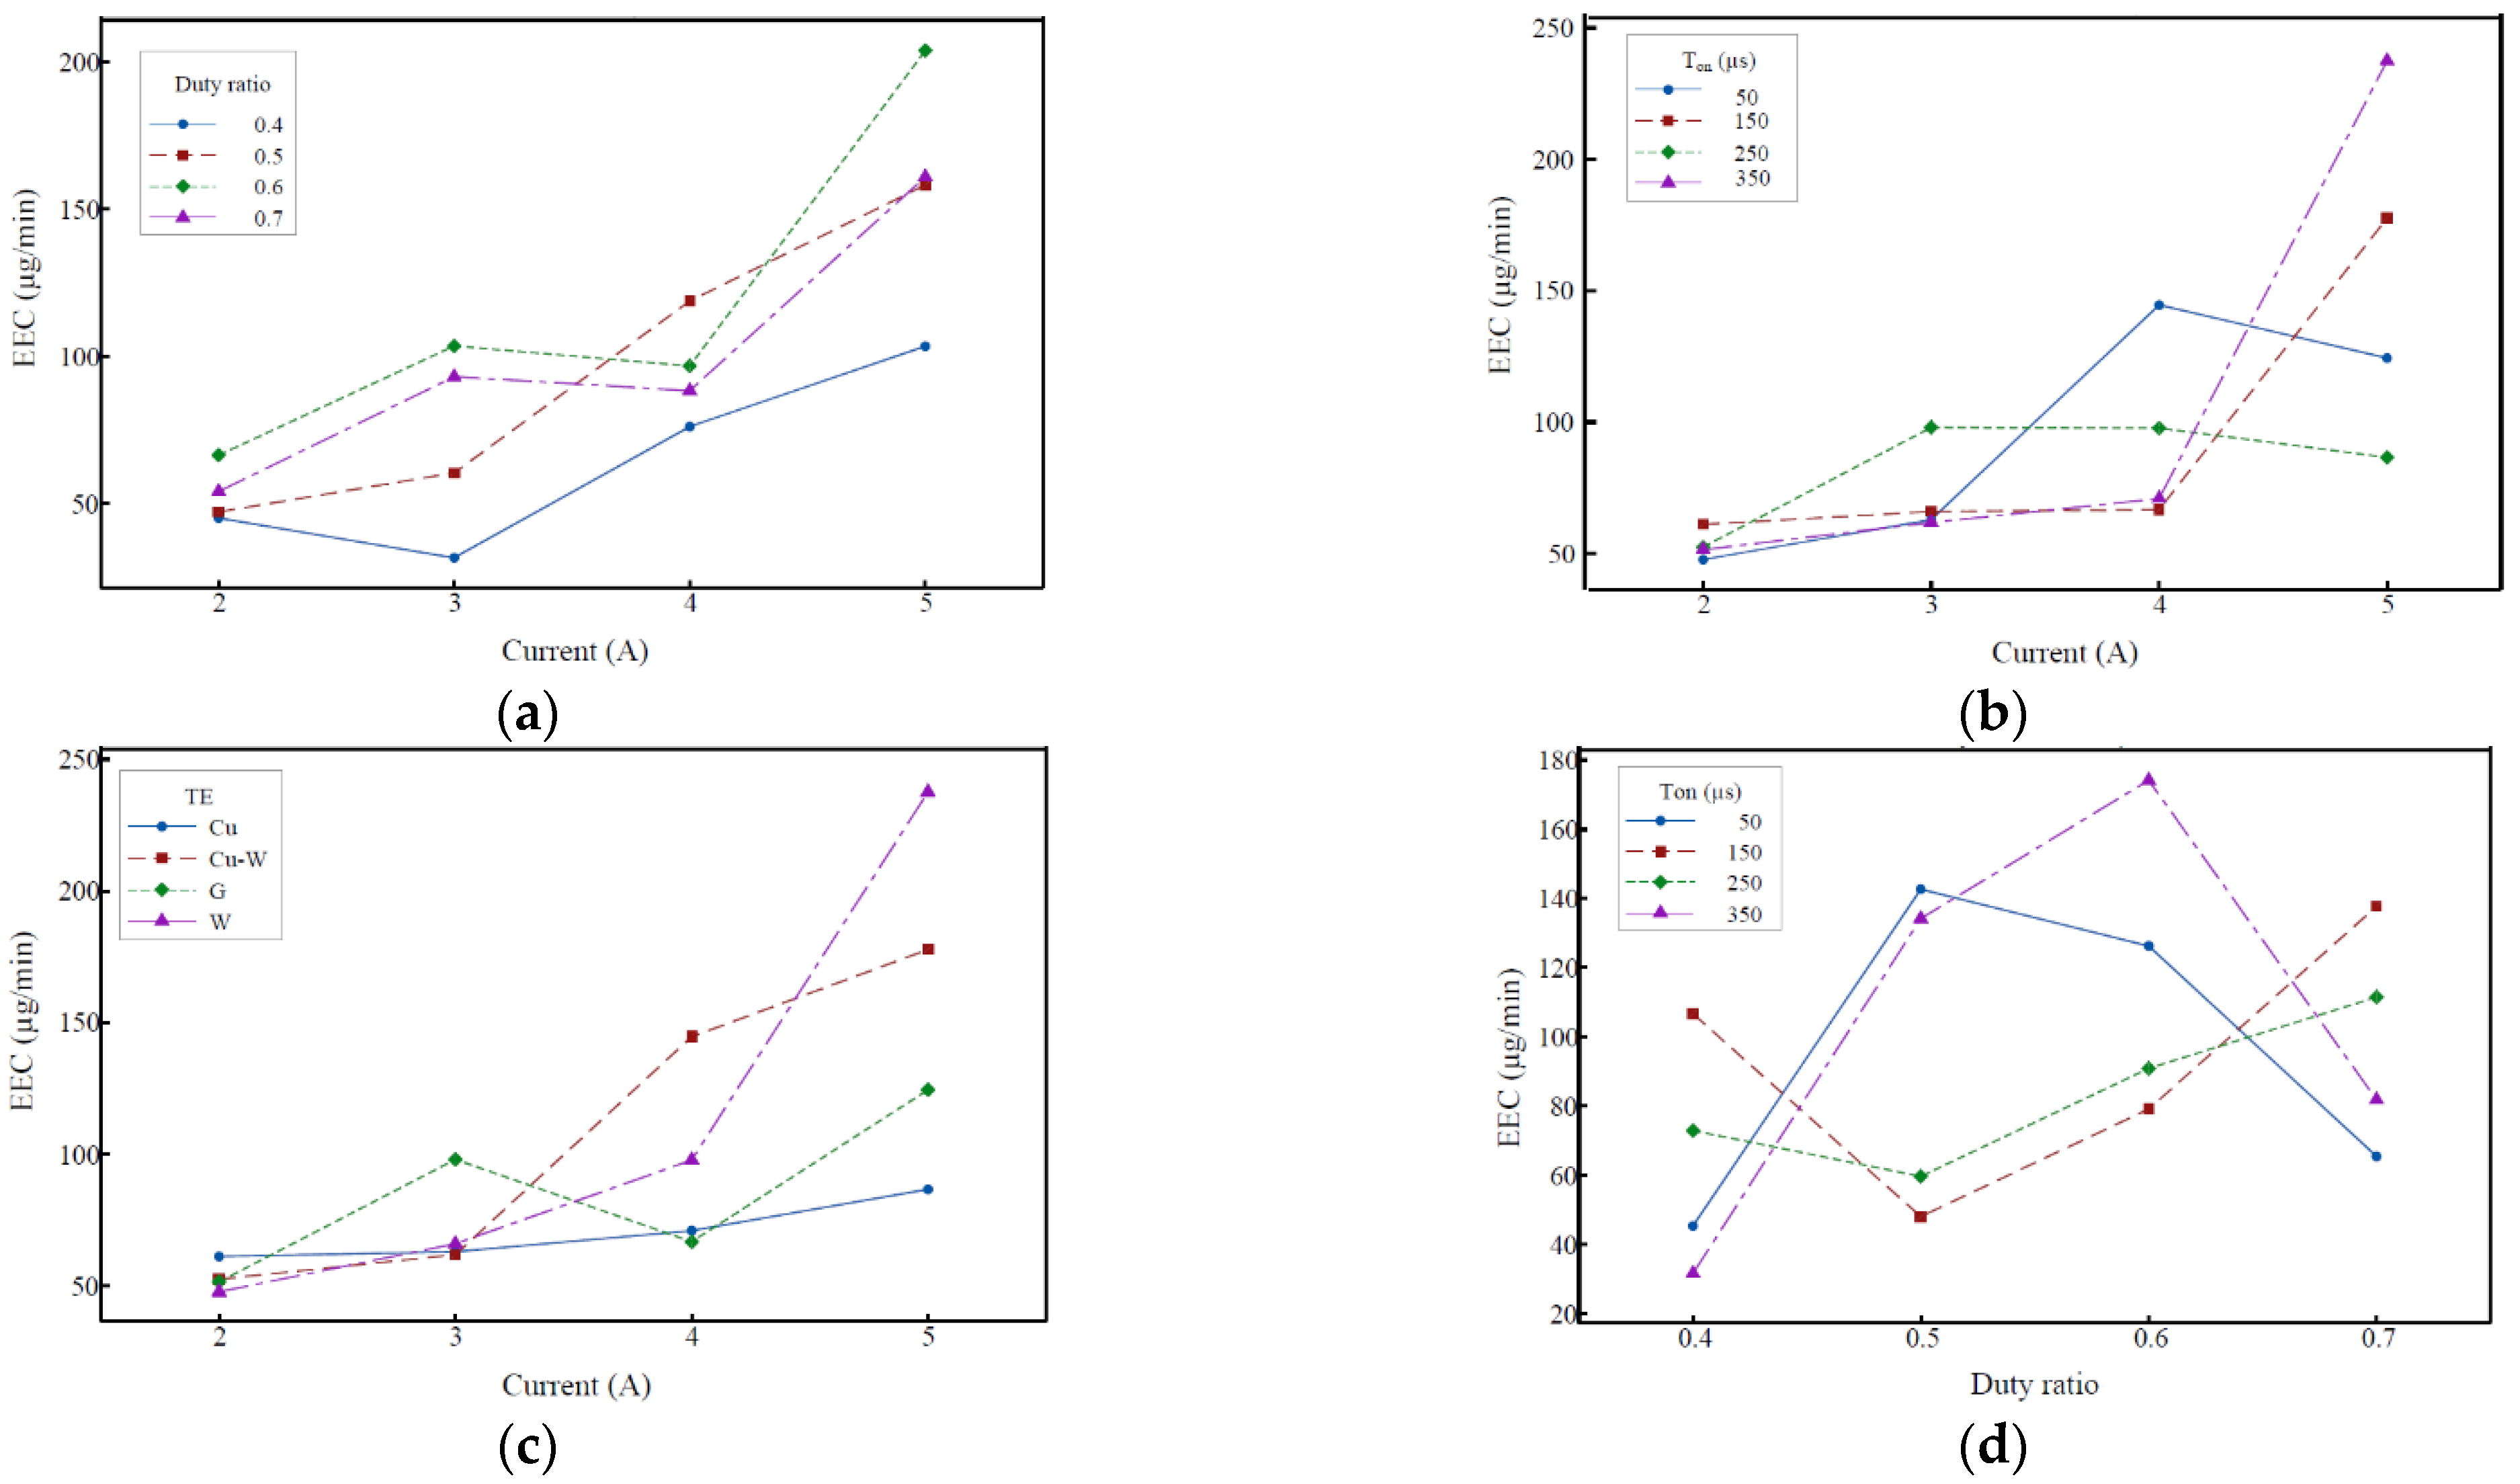
3.1.4. EEC
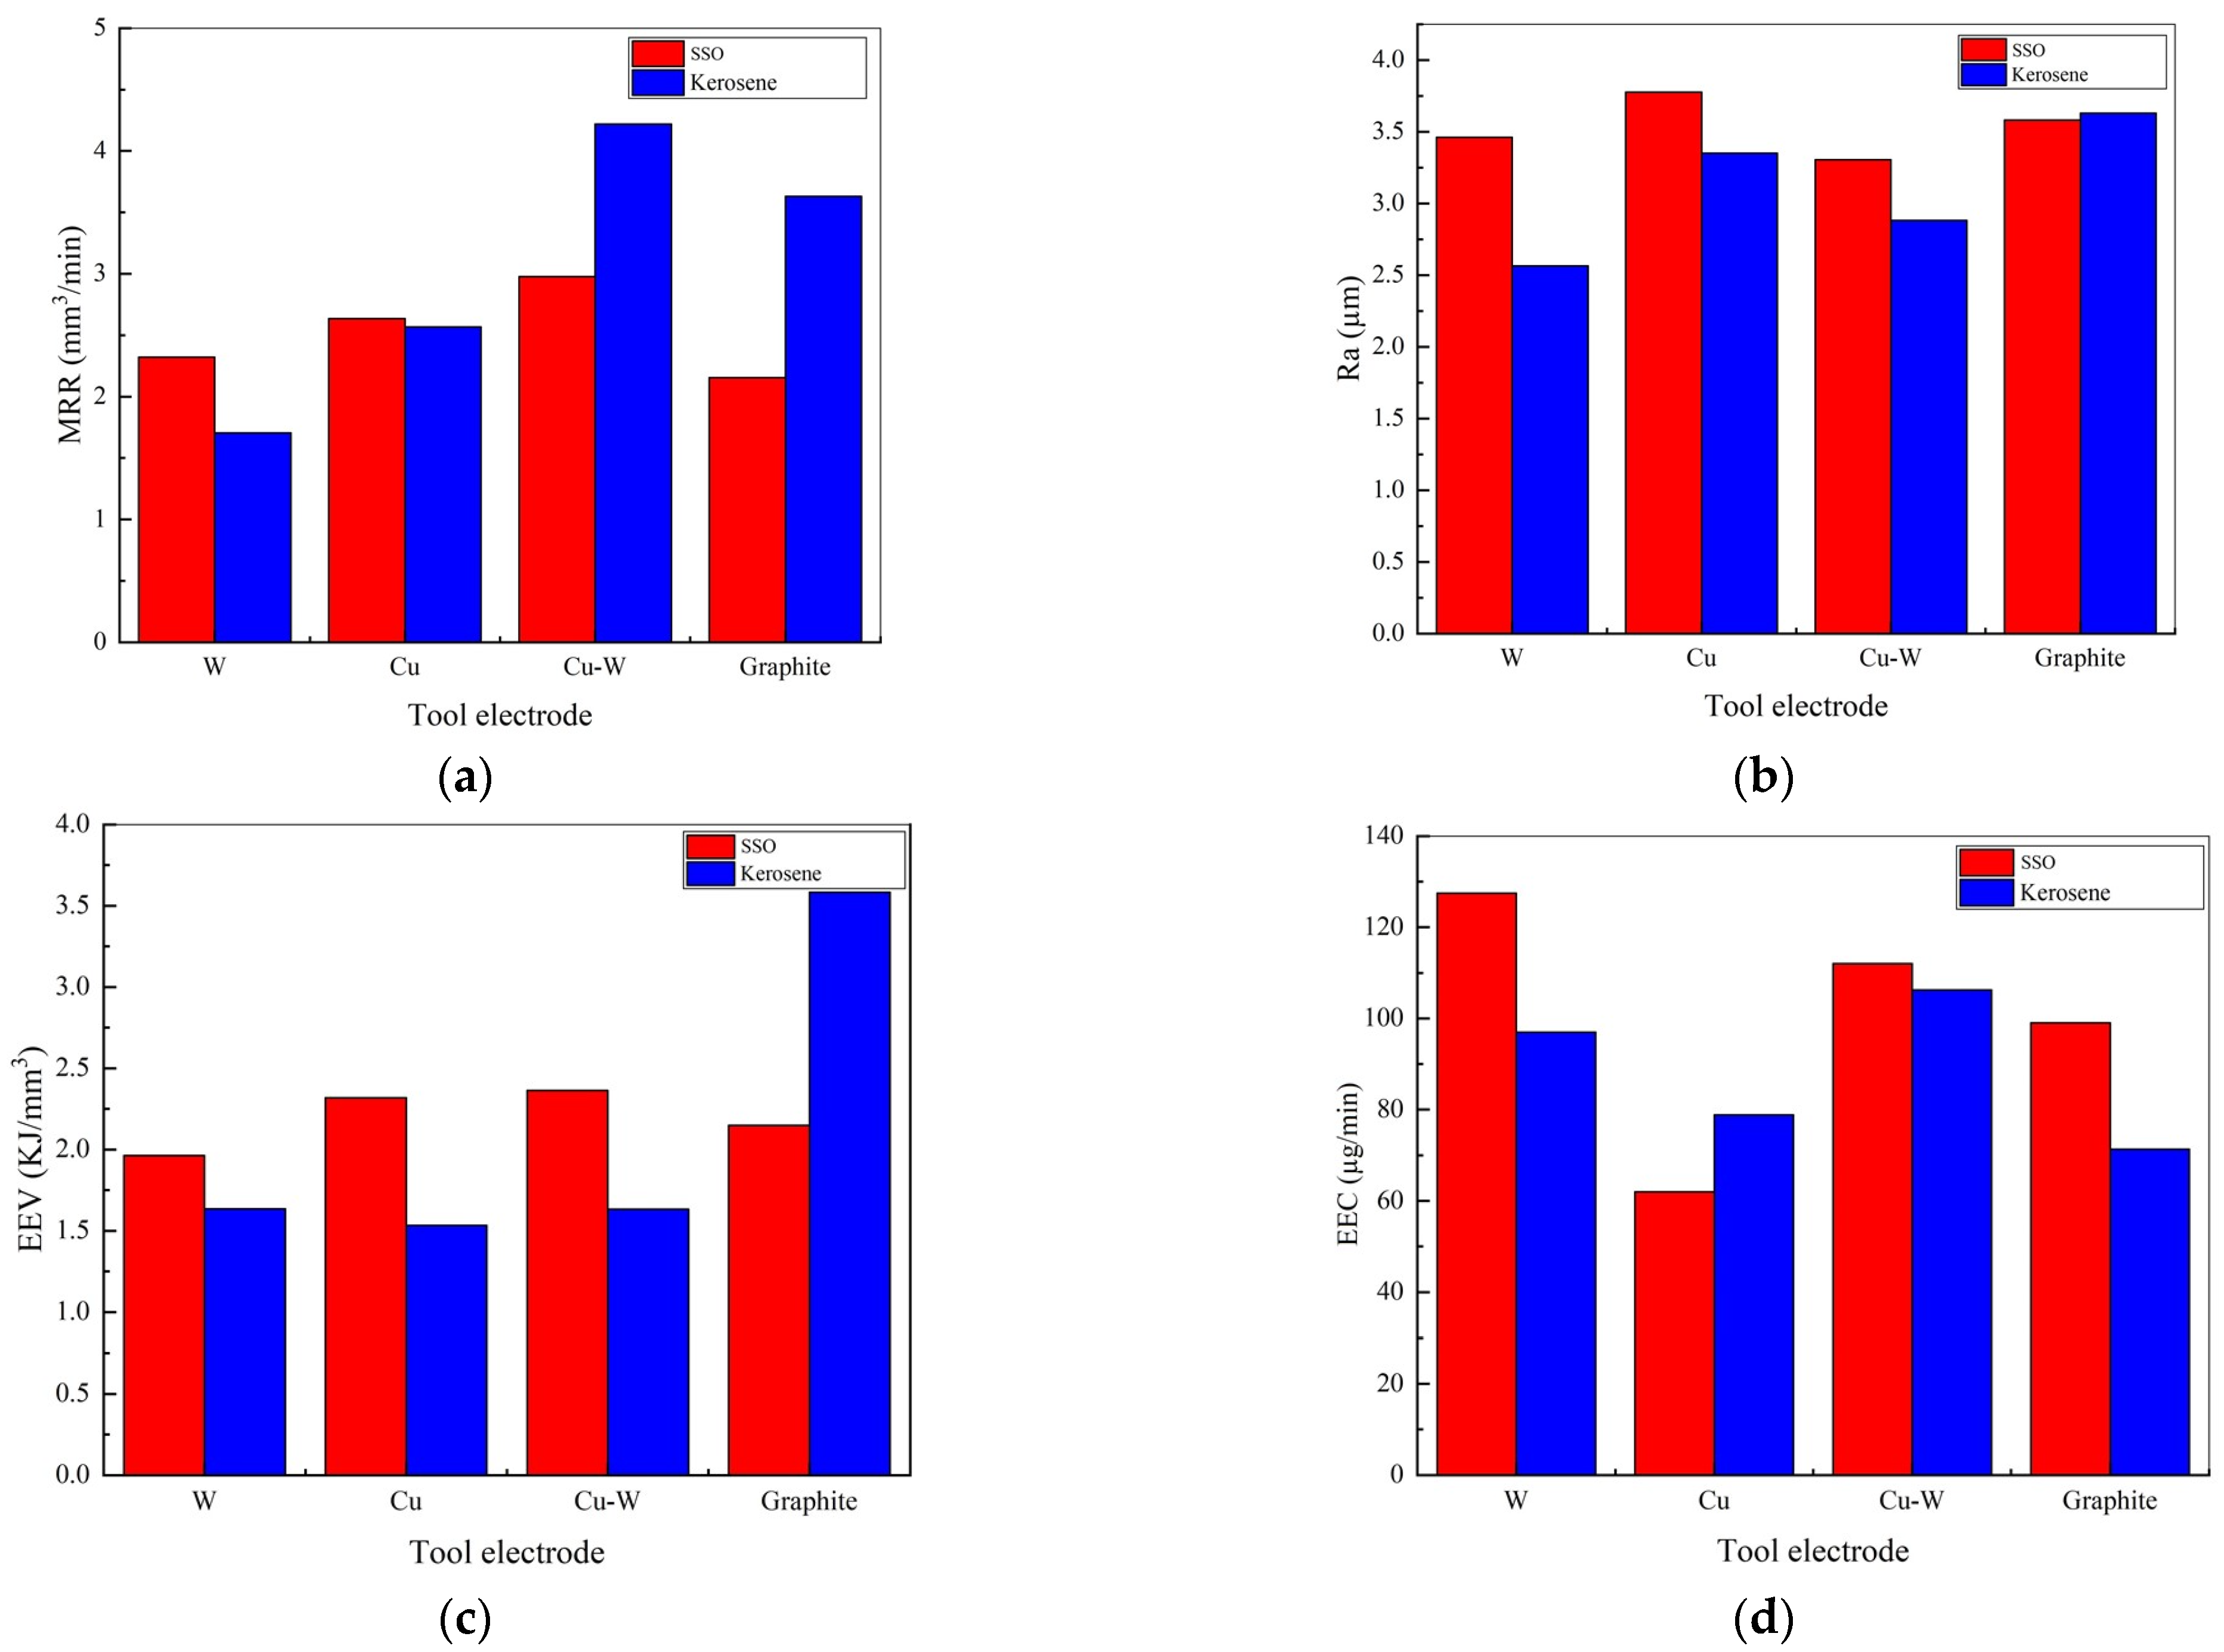
3.2. Machining Performance of Different Electrodes under SSO/Kerosene Dielectric
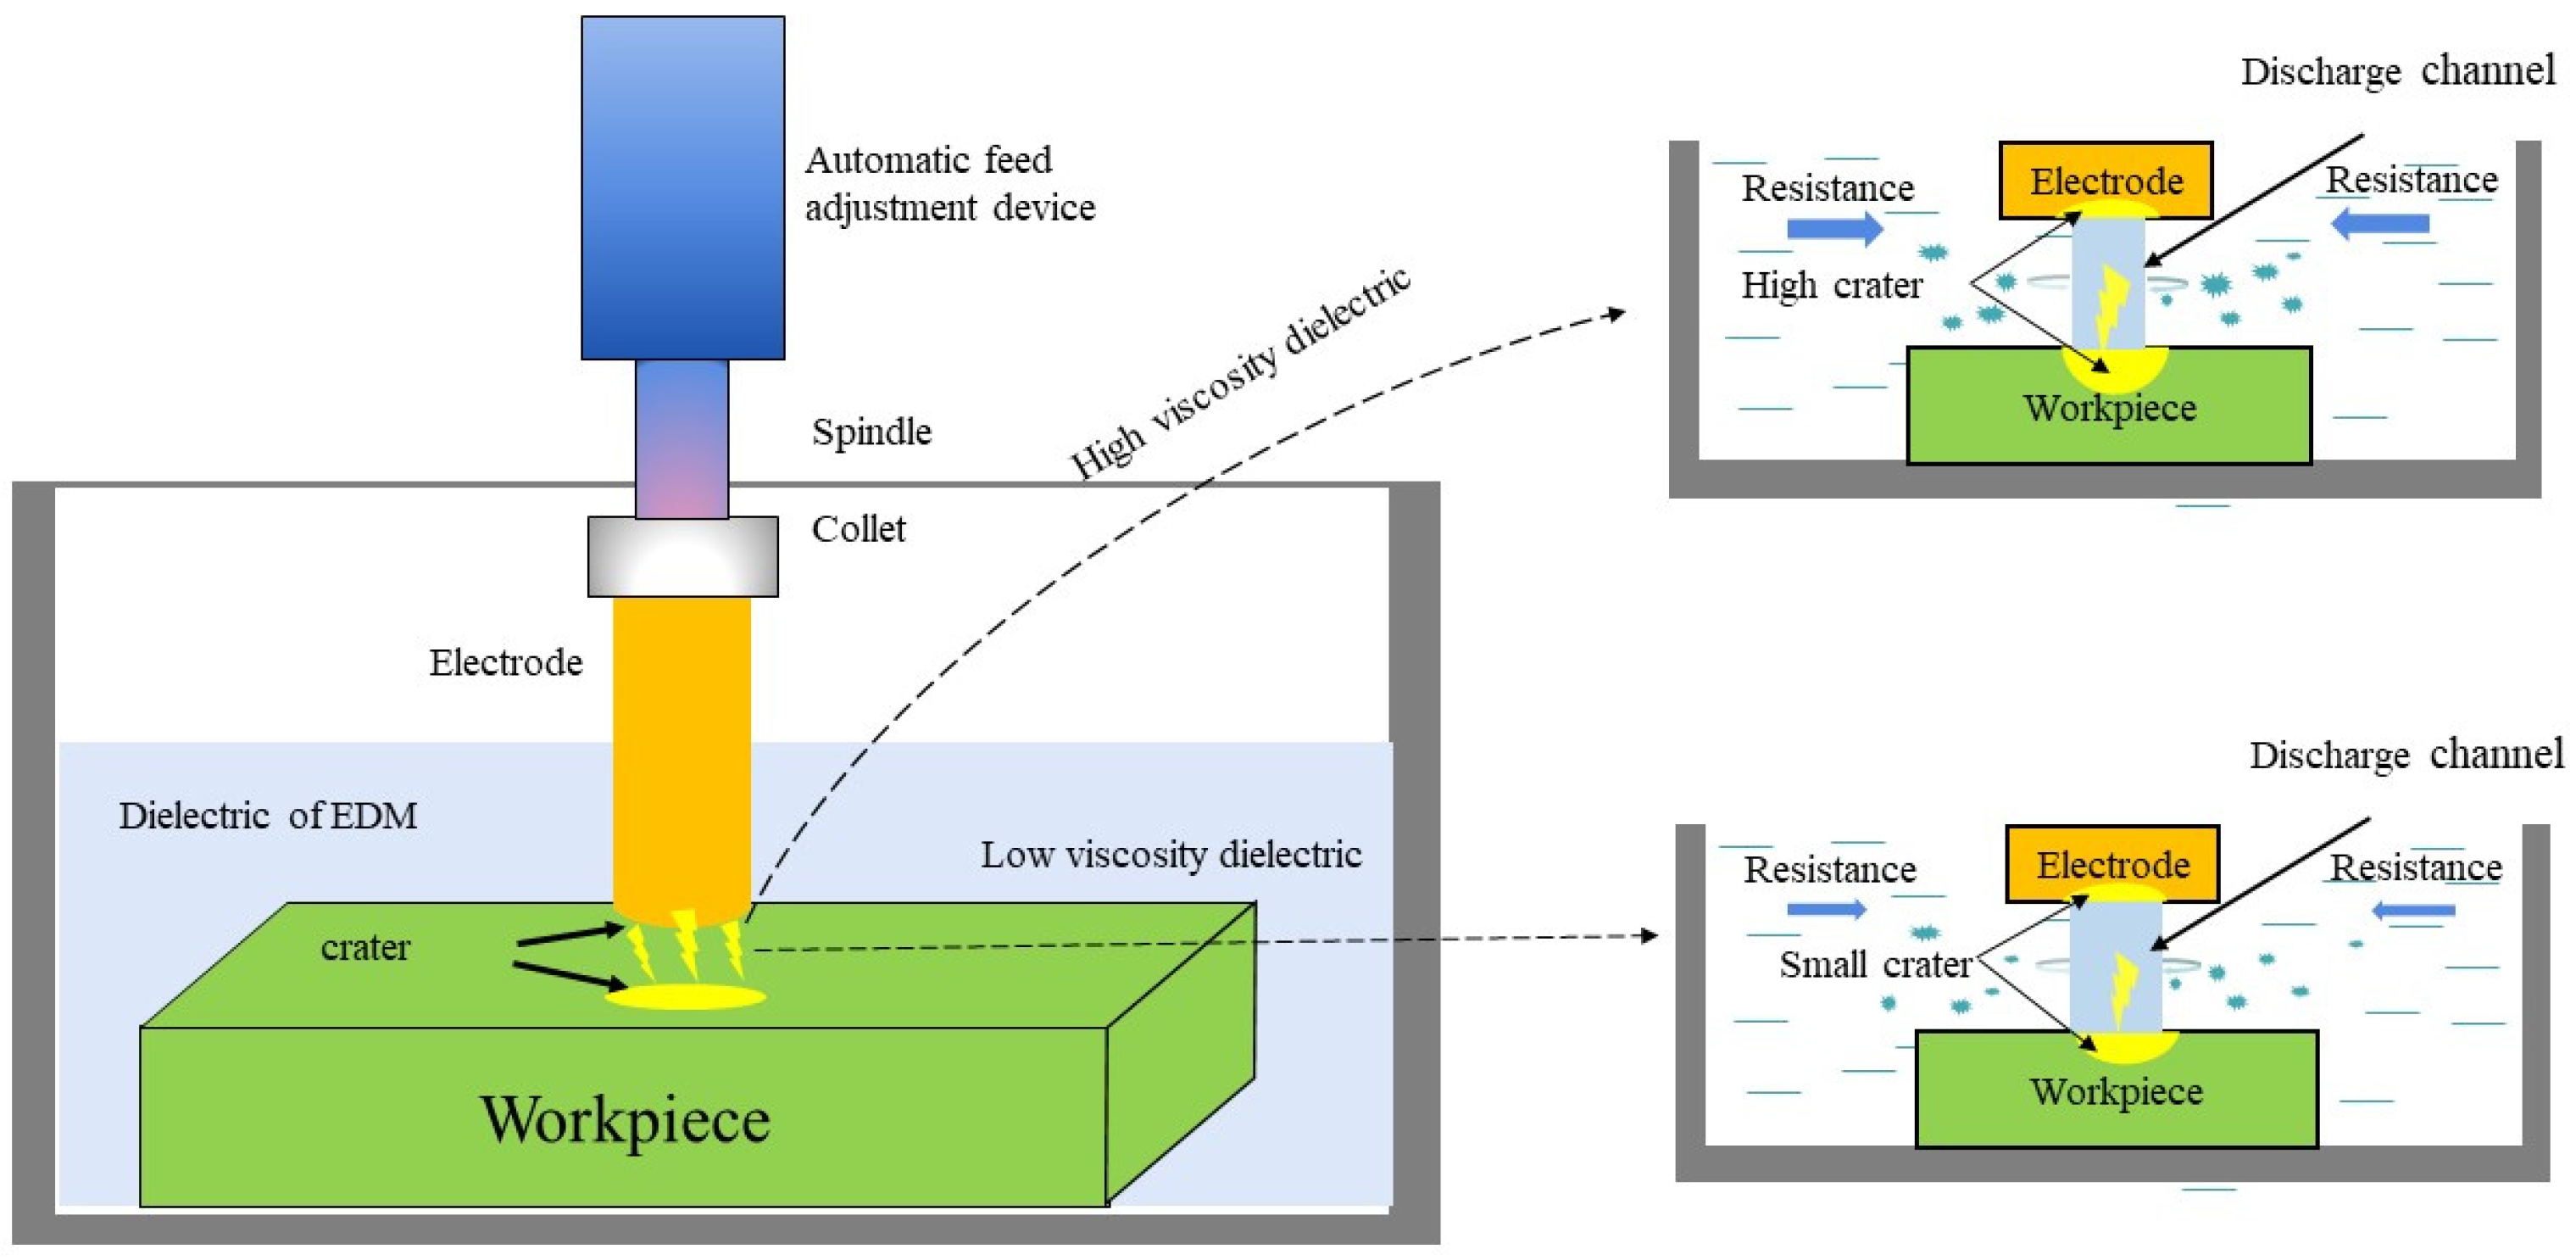
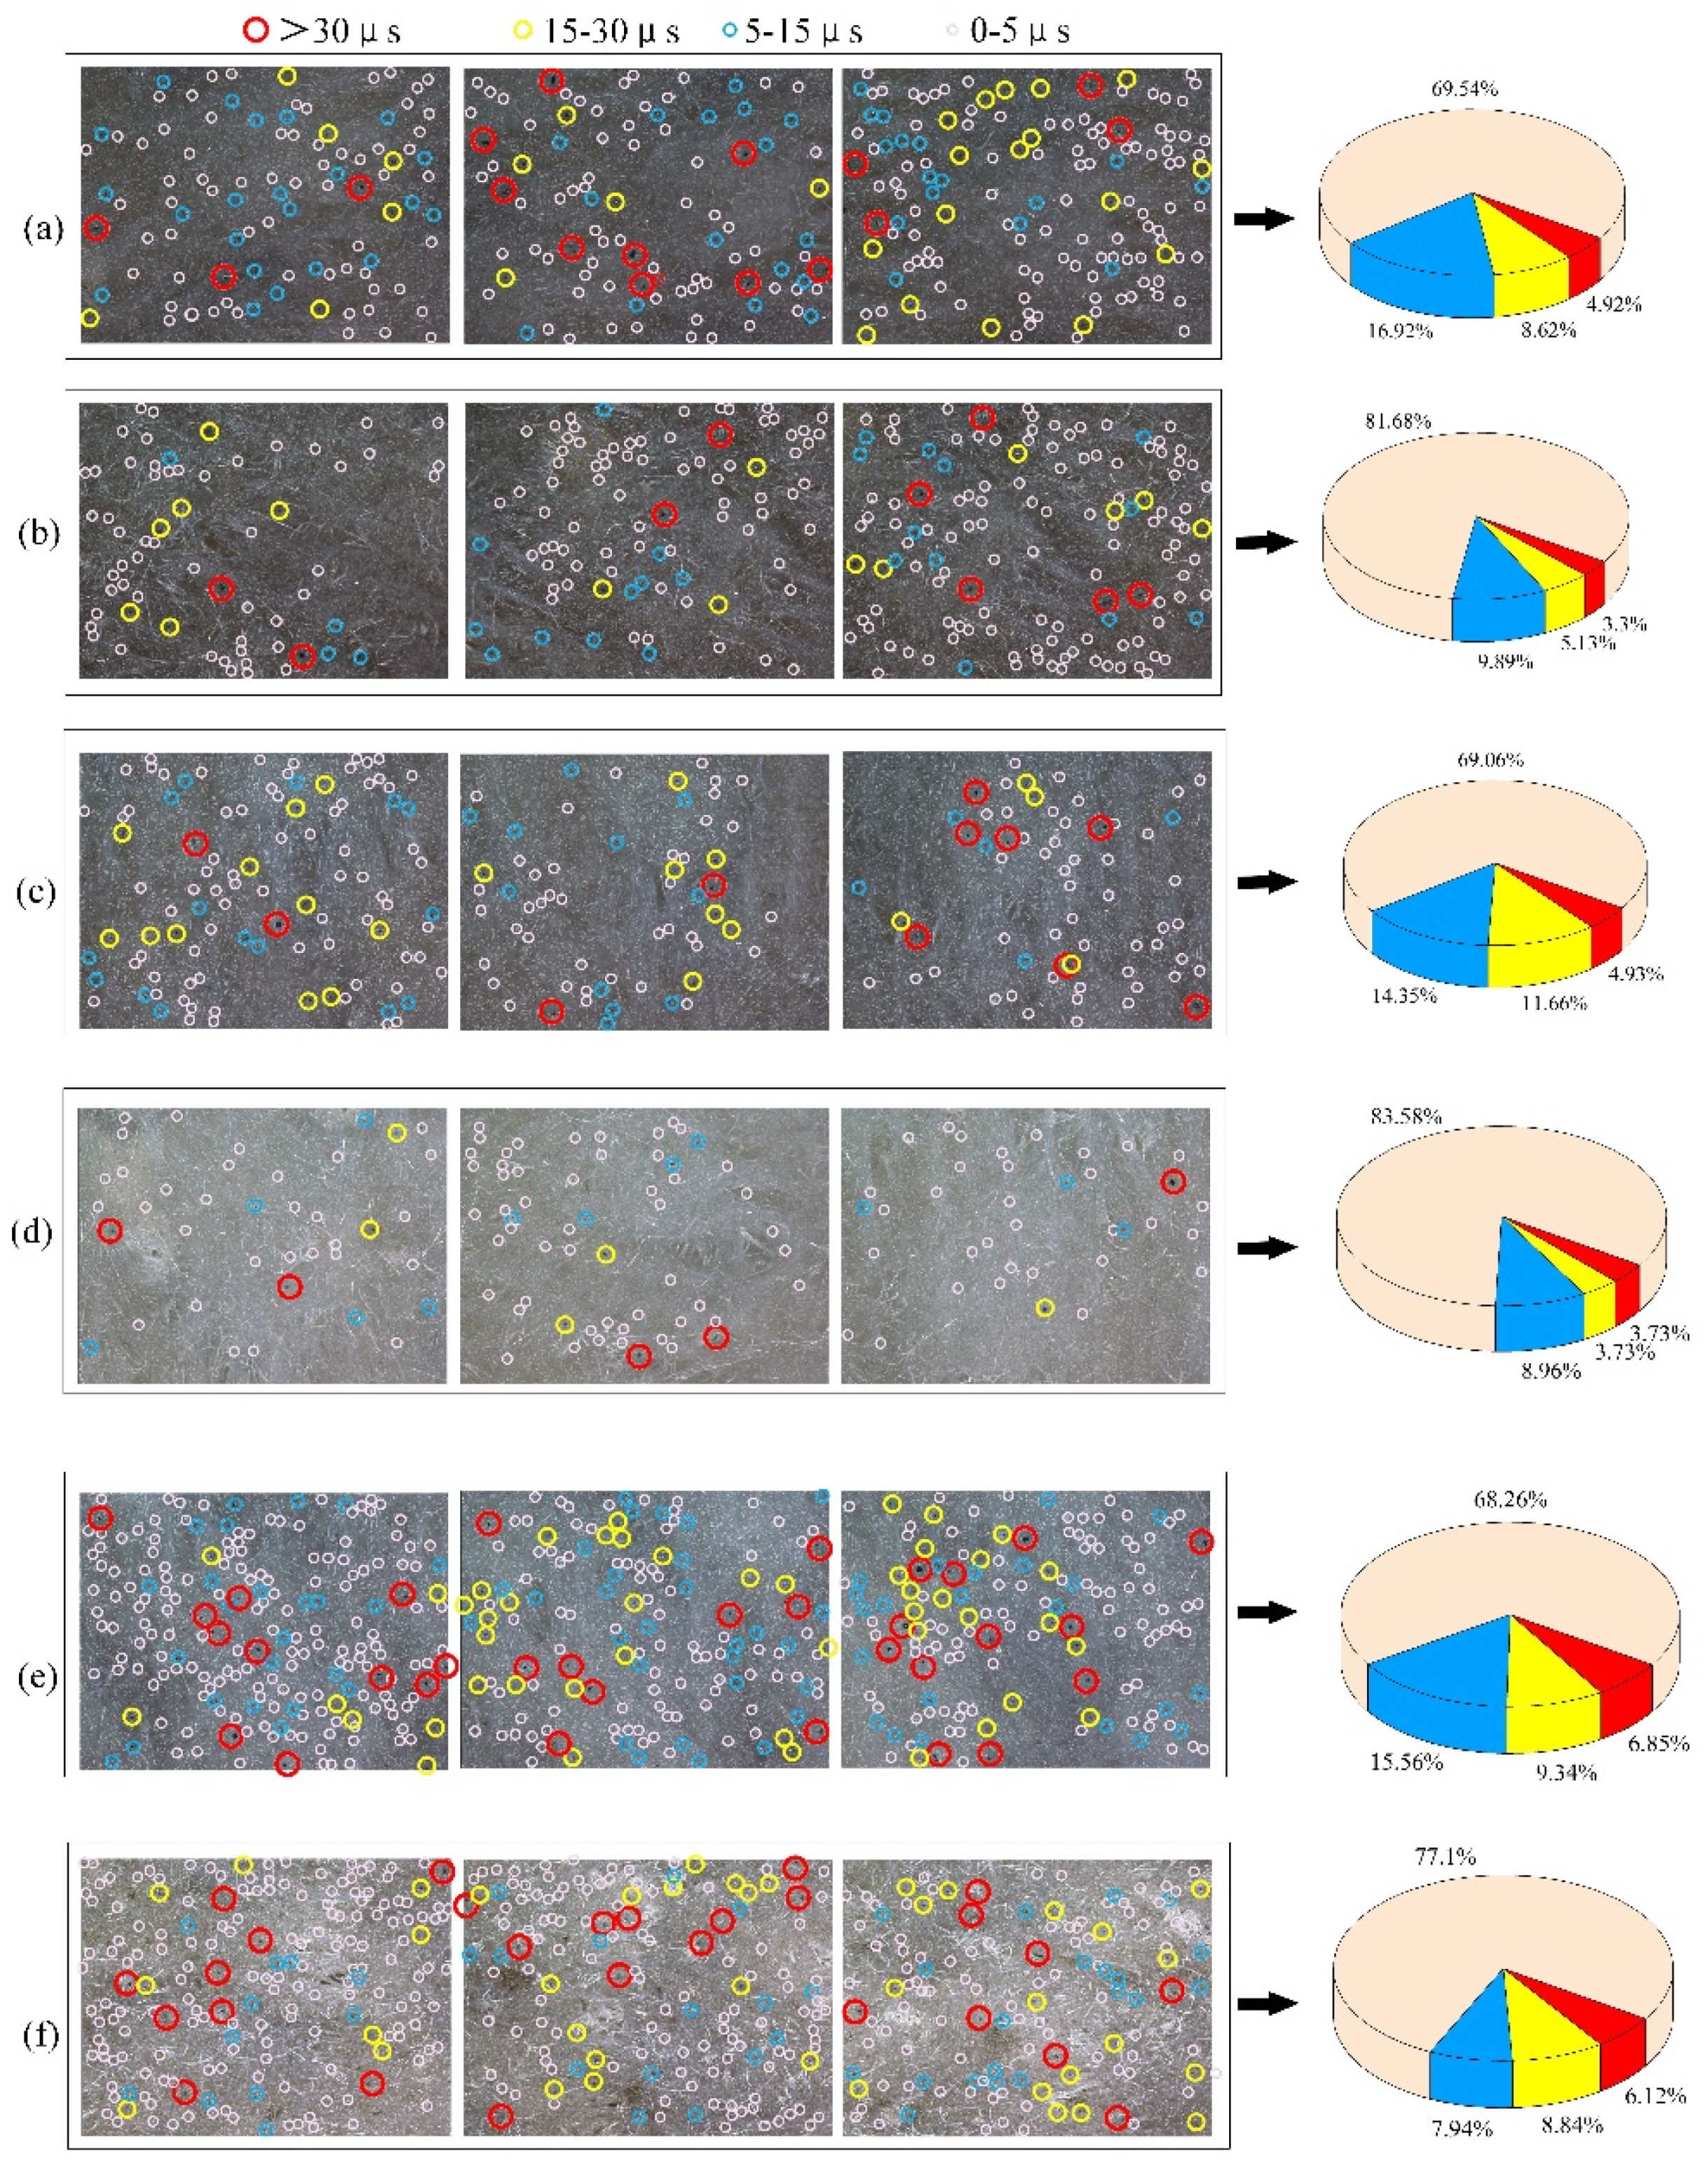
3.3. Analysis of the Effect of Dielectrics on Debris Size
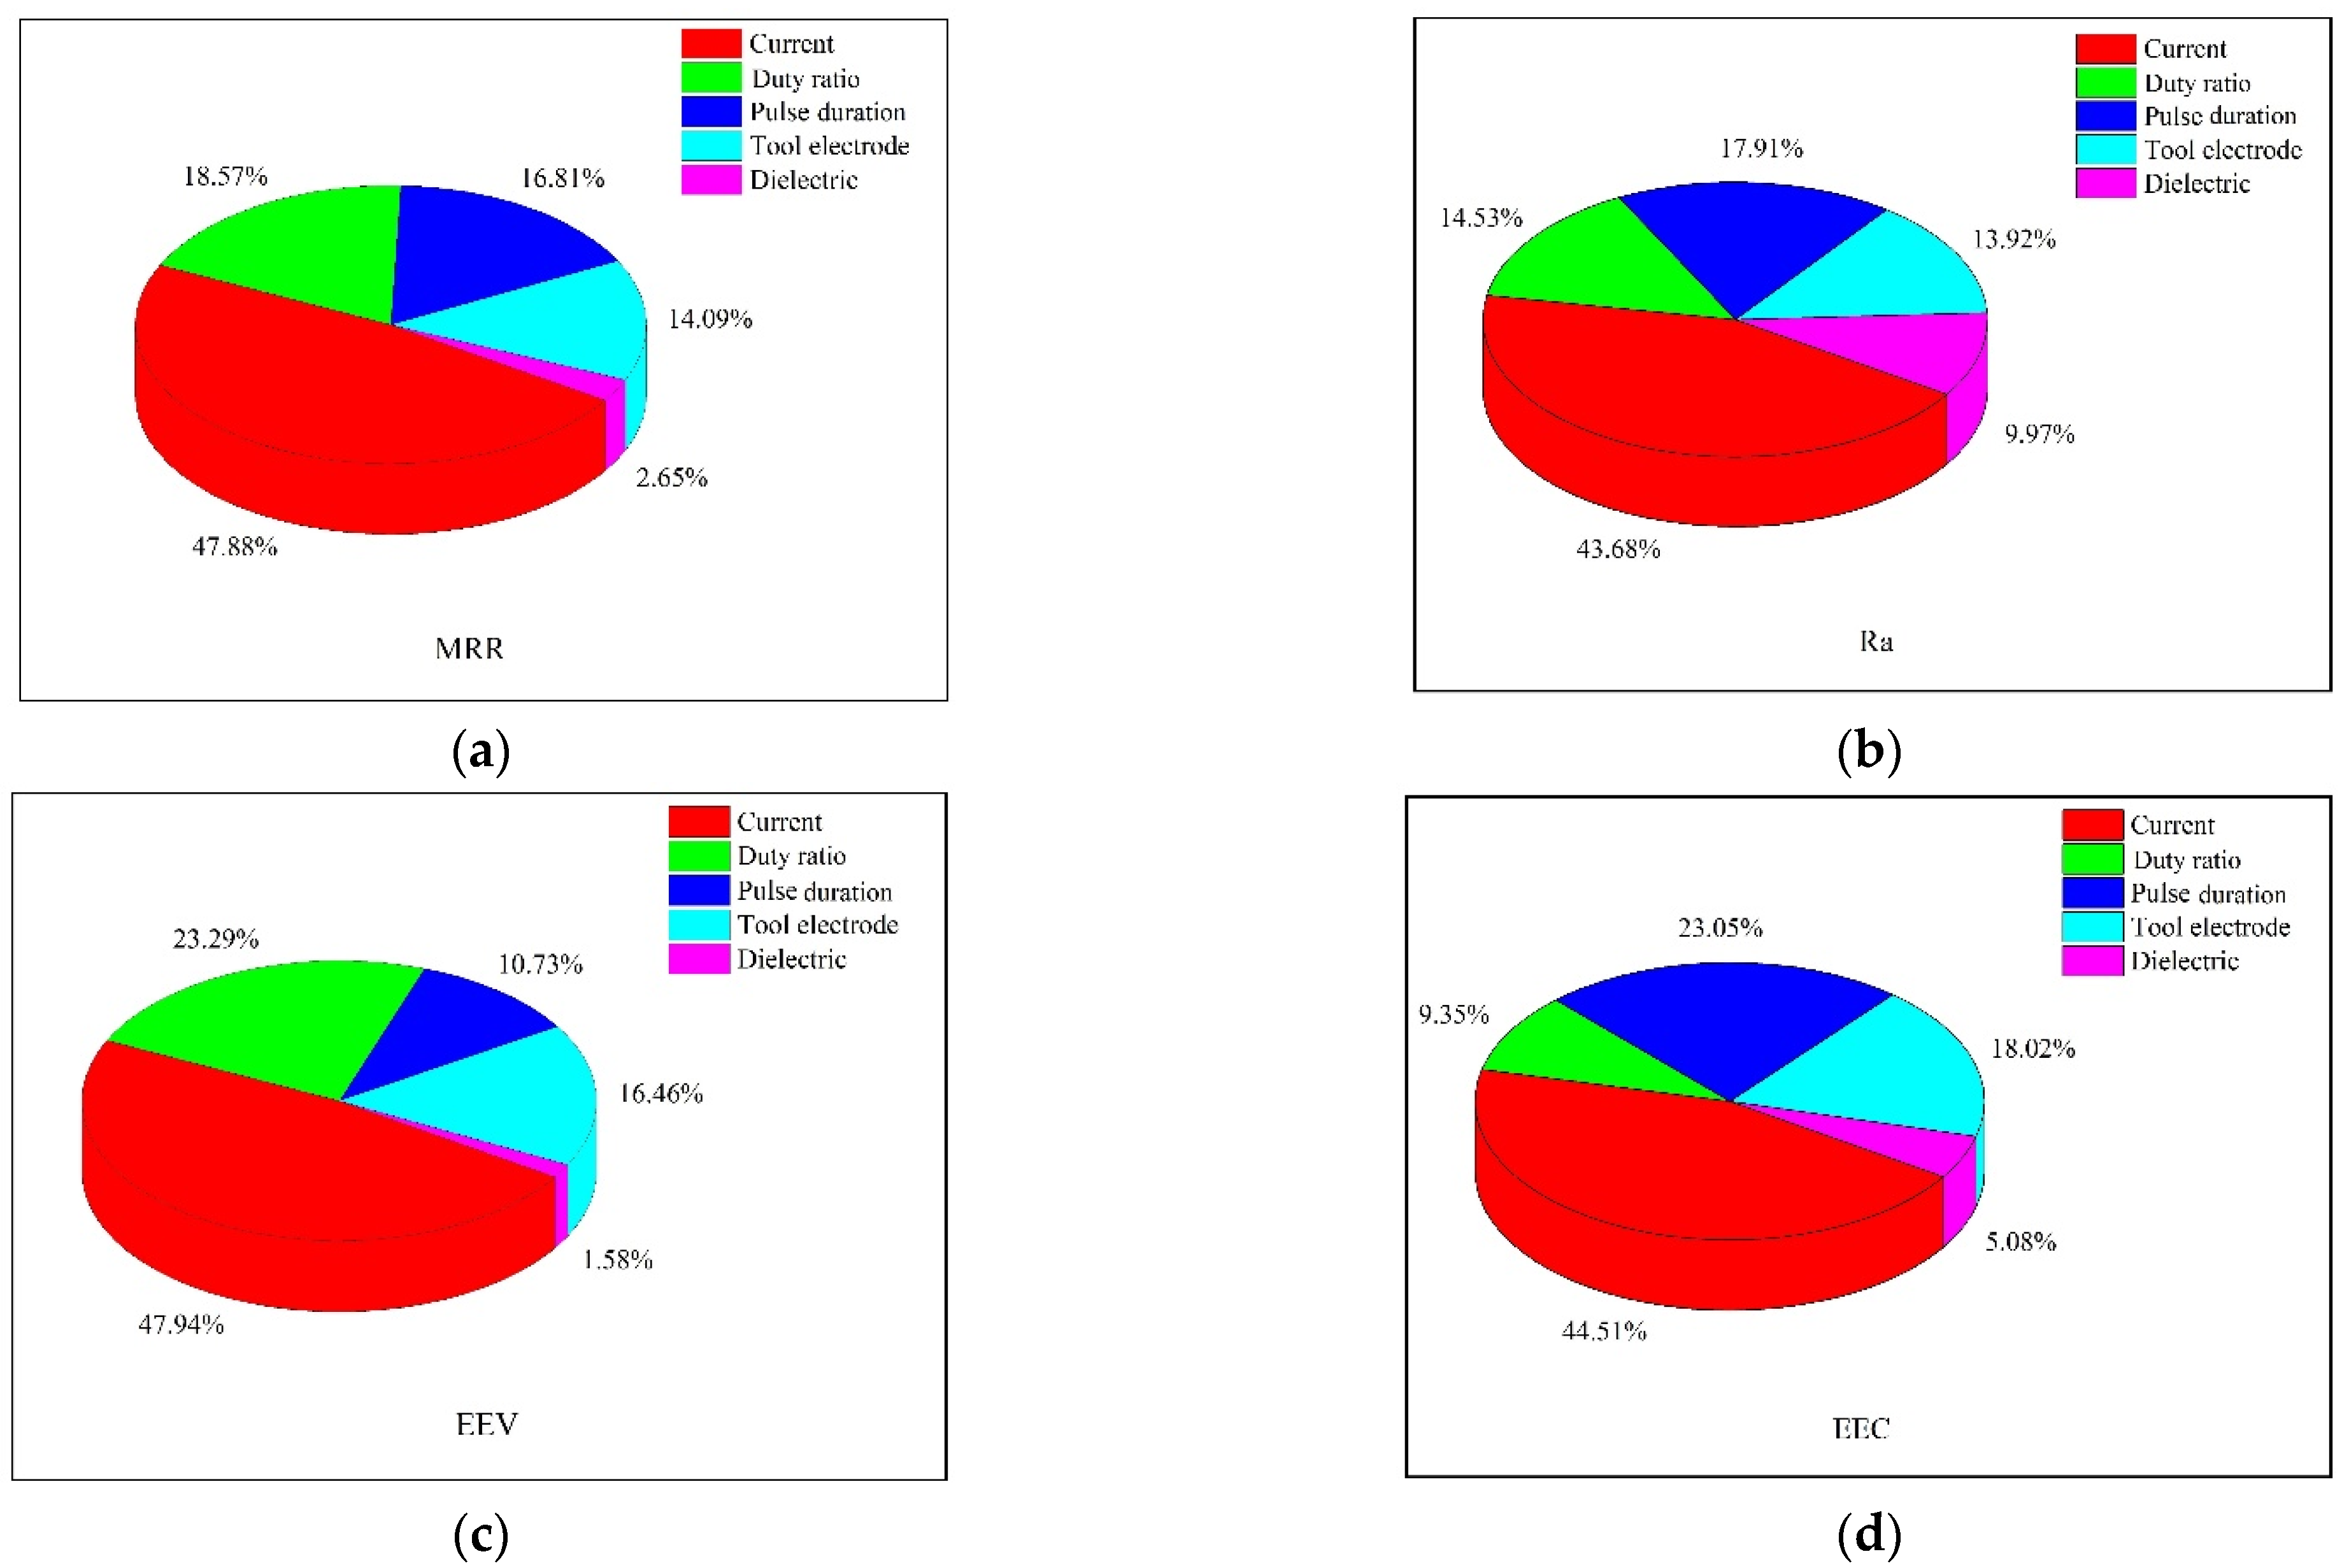
3.4. Analysis of Interaction Effect
4. Discussion
5. Conclusions
- (1)
- The MRR of kerosene is about 13% higher than that of SSO; the EEV of SSO is about 4.6% higher than that of kerosene; the Ra of SSO is about 12% higher than that of kerosene; and the emission rate of SSO is about 11.8% higher than that of kerosene. Overall, SSO had a similar machining performance to kerosene. However, from the experimental results of a single group, the minimum value of EEV in SSO is 0.3879 kJ/mm3, which is about 25% lower than the minimum value of 0.4849 kJ/mm3 in kerosene, and the minimum Ra value of SSO is 1.7103 µm, while the minimum Ra value of kerosene is 1.8537 µm, which indicates that under suitable parameter conditions, the machining performance of SSO could be better than that of kerosene. This means that SSO has the potential to replace kerosene as a dielectric for EDM. From the influence of process parameters on the processability, the dielectric has the least influence on the machining performance. So replacing kerosene with SSO does not have a considerable impact on the machining performance. Moreover, SSO has similar properties to kerosene, and as a renewable resource, SSO costs less than kerosene. Moreover, there is no pollutant risk in the process of preparing SSO, so it will not pollute soil and water sources after accidental leakage, and the biodegradability is high. Both the flash and fire points of SSO compare with those of kerosene, which indicates that SSO is fire-resistant and is a cleaner, greener, and safer dielectric.
- (2)
- The experimental results show that the MRR of the W electrode in SSO is 2.3218 mm3/min, which is about 35.15% higher than that in kerosene, and the MRR of the Cu electrode in SSO is 2.6354 mm3/min, which is 2.67% higher than that in kerosene. The EEV of the graphite electrode in SSO is 2.1478 kJ/mm3, which is about 40% lower than the EEV of the graphite electrode in kerosene. The Ra of the graphite electrode in SSO is 3.5808 µm, and the Ra in kerosene is 3.6303 µm. Obviously, the Ra of the graphite electrode in SSO is smaller than that in kerosene. In SSO, the EEC of the Cu electrode is significantly smaller than that of the kerosene, and the EEC of the Cu electrode in SSO is 62.017 µg/min, which is about 21.36% lower than that of kerosene with 78.857 µg/min. This demonstrates that under certain conditions, Cu electrodes in SSO could obtain higher MRR, lower emission rates, and good machining performance. In addition, Cu electrodes are widely used in EDM with lower cost. The EEV and Ra of graphite electrodes were lower in SSO, indicating that the EDM performance with SSO as the dielectric can be preferable to that with kerosene as the dielectric.
- (3)
- SSO has similar properties to kerosene, and as a renewable resource, SSO costs less than kerosene. Moreover, there is no pollutant risk in the process of preparing SSO, so it will not pollute soil and water sources after accidental leakage, and its biodegradability is high. Both the flash and fire points of SSO compare with those of kerosene, which indicates that SSO is fire-resistant and is a cleaner, greener, and safer dielectric. In this study, the applicability of SSO in EDM was assessed on the basis of the successful experimental operation. Adding some additives to SSO to improve the processing performance is a future research direction.
Author Contributions
Funding
Institutional Review Board Statement
Informed Consent Statement
Data Availability Statement
Conflicts of Interest
References
- Lazarenko, B.R. To Invert the Effect of Wear on Electric Power Contacts; Dissertation of The All-Union Institute for Electro Technique in Moscow/CCCP; Scientific Research Publishing Inc.: Moscow, Russia, 1943. [Google Scholar]
- Kunieda, M.; Lauwers, B.; Rajurkar, K.P.; Schumcher, B.M. Advancing EDM through Fundamental Insight into the Process. CIRP Ann. 2005, 54, 64–87. [Google Scholar] [CrossRef]
- Ho, K.H.; Newman, S.T. State of the art electrical discharge machining (EDM). Int. J. Mach. Tools Manuf. 2003, 43, 1287–1300. [Google Scholar] [CrossRef]
- Ming, W.; Shen, F.; Zhang, Z.; Huang, H.; Du, J.; Wu, J. A comparative investigation on magnetic field–assisted EDM of magnetic and non-magnetic materials. Int. J. Adv. Manuf. Technol. 2020, 109, 1103–1116. [Google Scholar] [CrossRef]
- Descoeudres, A.; Hollenstein, C.; Wälder, G.; Demellayer, R. Time- and spatially-resolved characterization of electrical discharge machining plasma. Plasma Sources Sci. Technol. 2008, 17, 431–438. [Google Scholar] [CrossRef] [Green Version]
- Joshi, S.N.; Pande, S.S. Development of an intelligent process model for EDM. Int. J. Adv. Manuf. Technol. 2009, 45, 300–317. [Google Scholar] [CrossRef]
- Natsu, W.; Ojima, S.; Kobayashi, T.; Kunieda, M. Temperature Distributi on Measurement in EDM Arc Plasma Using Spectroscopy. JSME Int. J. Ser. C-Mech. Syst. Mach. Elem. Manuf. 2004, 47, 384–390. [Google Scholar] [CrossRef] [Green Version]
- Wang, J.; Han, F.; Cheng, G.; Zhao, F. Debris and bubble movements during electrical discharge machining. Int. J. Mach. Tools Manuf. 2012, 58, 11–18. [Google Scholar] [CrossRef]
- Xu, B.; Chen, S.; Liang, X.; Lei, J.; Shi, H.; Fu, L.; Yang, J.; Peng, T.; Zhao, H.; Zhu, L. Recast layer removal of 304 stainless steel by combining micro-EDM with negative polarity micro-EDM. Int. J. Adv. Manuf. Technol. 2020, 107, 4713–4723. [Google Scholar] [CrossRef]
- Leão, F.N.; Ian, R.; Pashby, L.R. A review on the use of environmentally-friendly dielectric fluids in electrical discharge machining. J. Mater. Process. Technol. 2004, 149, 341–346. [Google Scholar] [CrossRef]
- Jose, M.; Sivapirakasam, S.P.; Surianarayanan, M. Analysis of aerosol emission and hazard evaluation of electrical discharge machining (EDM) process. Ind. Health 2010, 48, 478–486. [Google Scholar] [CrossRef] [Green Version]
- Singh, S.S.; Mehta, V.; Manchanda, J.; Phull, G.S. Investigation of electric discharge machining of Inconel 718 using special graphite electrode. IOSR J. Mech. Civ. Eng. 2015, 12, 56–61. [Google Scholar]
- Dewangan, S.K. Multi-Objective Optimisation and Analysis of EDM of AISI P20 Tool Steel. Ph.D. Thesis, Department of Mechanical Engineering, National Institute of Technology, Rourkela, India, 2014. [Google Scholar]
- Posinasetti, N.R. Manufacturing Technology: Metal Cutting and Machine Tools; McGraw-Hill Education (India) Pvt Limited: New Delhi, India, 2013; Volume 2. [Google Scholar]
- Jagadessha, T. Non-Traditional Machining Processes; IK International Publishing House Pvt. Limited: New Delhi, India, 2016. [Google Scholar]
- Bommeli, B. Study of the harmful emanations resulting from the machining by electro-erosion. In Proceedings of the Seventh International Symposium on Electro Machining (ISEM VII), Birmingham, UK, 12–14 April 1983; pp. 469–478. [Google Scholar]
- Tönshoff, H.K.; Egger, R.; Klocke, F. Environmental and Safety Aspects of Electrophysical and Electrochemical Processes. CIRP Ann.-Manuf. Technol. 1996, 45, 553–568. [Google Scholar] [CrossRef]
- Liu, Y.; Zhang, Y.; Ji, R.; Cai, B.; Wang, F.; Tian, X.; Dong, X. Experimental characterization of sinking electrical discharge machining using water in oil emulsion as dielectric. Mater. Manuf. Process 2013, 28, 355–363. [Google Scholar] [CrossRef]
- Masuzawa, T. Machining characteristics of EDM using water as a dielectric fluid. In Proceedings of the 22nd Machine Tool Design and Research Conference; Palgrave: London, UK, 1982; pp. 441–447. [Google Scholar]
- Masuzawa, T.; Tanaka, K.; Nakamura, Y.; Kinoshita, N. Water-Based Dielectric Solution for EDM. CIRP Ann.-Manuf. Technol. 1983, 32, 119–122. [Google Scholar] [CrossRef]
- Zhang, Q.H.; Zhang, J.H.; Deng, J.X.; Qin, Y.; Niu, Z. Ultrasonic vibration electrical discharge machining in gas. J. Mater. Processing Technol. 2002, 129, 135–138. [Google Scholar] [CrossRef]
- König, W.; Klocke, F.; Sparrer, M. EDM-sinking using water-based dielectrics and electropolishing—A new manufacturing sequence in tool-making. In Proceedings of the 11th International Symposium on Electromachining (ISEM XI), Lausanne, Switzerland, 17–21 April 1995; pp. 225–234. [Google Scholar]
- Chen, S.L.; Yan, B.H.; Huang, F.Y. Influence of kerosene and distilled water as dielectrics on the electric discharge machining characteristics of Ti-6Al-4V. J. Mater. Process. Technol. 1999, 87, 107–111. [Google Scholar] [CrossRef]
- Tang, L.; Du, Y. Experimental study on green electrical discharge machining in tap water of Ti-6Al-4V and parameters optimization. Int. J. Adv. Manuf. Technol. 2014, 70, 469–475. [Google Scholar] [CrossRef] [Green Version]
- Kunieda, M.; Furuoya, S.; Taniguchi, N. Improvement of EDM Efficiency by Supplying Oxygen Gas into Gap. Ann. Cirp. 1991, 40, 215–218. [Google Scholar] [CrossRef]
- Valaki, J.B.; Rathod, P.P. Assessment of operational feasibility of waste vegetable oil based bio-dielectric fluid for sustainable electric discharge machining (EDM). Int. J. Adv. Manuf. Technol. 2016, 87, 1509–1518. [Google Scholar] [CrossRef]
- Ng, P.S.; Kong, S.A.; Yeo, S.H. Investigation of biodiesel dielectric in sustainable electrical discharge machining. Int. J. Adv. Manuf. Technol. 2016, 90, 1–8. [Google Scholar] [CrossRef]
- Valaki, J.B.; Rathod, P.P.; Khatri, B. Investigations on Palm Oil based Biodielectric Fluid for Sustainable Electric Discharge Machining. In Proceedings of the International Conference on Advances in Materials and Manufacturing (ICAMM-2016), Bangkok, Thailand, 29–30 October 2016. [Google Scholar]
- Valaki, J.B.; Rathod, P.P.; Sankhavara, C.D. Investigations on technical feasibility of Jatropha curcas oil based bio dielectric fluid for sustainable electric discharge machining (EDM). J. Manuf. Processes 2016, 22, 151–160. [Google Scholar] [CrossRef]
- Khan, M.Y.; Rao, P.S.; Pabla, B.S. Investigations on the feasibility of jatropha curcas oil based biodiesel for sustainable dielectric fluid in edm process. Mater. Today Proc. 2020, 26, 335–340. [Google Scholar] [CrossRef]
- Das, S.; Paul, S.; Doloi, B. Feasibility investigation of neem oil as a dielectric for electrical discharge machining. Int. J. Adv. Manuf. Technol. 2020, 106, 1–11. [Google Scholar] [CrossRef]
- Abdullahi, U.U.; Bashi, S.M.; Yunus, R.; Mohibullah; Nurdin, H.A. The potentials of palm oil as a dielectric fluid. In Proceedings of the National Power and Energy Conference, Kuala Lumpur, Malaysia, 29–30 November 2004; pp. 29–30, 224–228.
- Paramashivan, S.S.; Mathew, J.; Mahadevan, S. Mathematical modeling of aerosol emission from die sinking electrical discharge machining process. Appl. Math. Modell. 2012, 36, 1493–1503. [Google Scholar] [CrossRef] [Green Version]
- Ming, W.Y.; Zhang, Z.; Wang, S.Y.; Huang, H.; Zhang, Y.M.; Zhang, Y.; Shen, D.L. Investigating the energy distribution of workpiece and optimizing process parameters during the EDM of Al6061, Inconel718, and SKD11. Int. J. Adv. Manuf. Technol. 2017, 92, 1–18. [Google Scholar] [CrossRef]
- Lin, Y.; Chen, Y.; Wang, D.; Lee, H.O. Optimization of machining parameters in magnetic force assisted EDM based on Taguchi method. J. Mater. Processing Technol. 2009, 209, 3374–3383. [Google Scholar] [CrossRef]
- Ming, W.Y.; Hou, J.J.; Zhang, Z.; Huang, H.; Xu, Z.; Zhang, G.J.; Huang, Y. Integrated ANN-LWPA for cutting parameter optimization in WEDM. Int. J. Adv. Manuf. Technol. 2016, 84, 1277–1294. [Google Scholar] [CrossRef]
- Ming, W.Y.; Xie, Z.B.; Ma, J.; Du, J.G.; Zhang, G.J.; Cao, C.; Zhang, Y. Critical review on sustainable techniques in electrical discharge machining. J. Manuf. Processes 2021, 72, 375–399. [Google Scholar] [CrossRef]
- Ming, W.Y.; Zhang, S.F.; Zhang, G.J.; Du, J.G.; Ma, J.; He, W.B.; Cao, C.; Liu, K. Progress in modeling of electrical discharge machining process. Int. J. Heat Mass Transf. 2022, 187, 122563. [Google Scholar] [CrossRef]
- Huang, Y.; Ming, W.Y.; Guo, J.W.; Zhang, Z.; Liu, G.D.; Li, M.Z.; Zhang, G.J. Optimization of cutting conditions of YG15 on rough and finish cutting in WEDM based on statistical analyses. Int. J. Adv. Manuf. Technol. 2013, 69, 993–1008. [Google Scholar] [CrossRef] [Green Version]


| Materials | Melting Point (°C) | Boiling Point (°C) | Resistivity (Ω·m) | Specific Heat Capacity (J/(kg·K)) | Thermal Conductivity (J/(m·s·k)) | Density (g/cm³) |
|---|---|---|---|---|---|---|
| W | 3410 | 5930 | 5.48 × 10⁻⁸ | 4.91 | 170 | 19.3 |
| Cu | 1083 | 2595 | 1.75 × 10⁻⁸ | 393.56 | 401 | 8.9 |
| Cu-W | 2711 | 4930 | 4.36 × 10⁻⁸ | 117.27 | 240 | 13.8 |
| Graphite | 3727 | 4830 | 6.1 × 10⁻⁸ | 1774.7 | 80 | 2.2 |
| Dielectric | Viscosity (at 40 °C) | Flash Point (°C) | Burning Point (°C) | Density (g/cm3) |
|---|---|---|---|---|
| SSO | 4.9 | 330 | 355 | 0.92 |
| Kerosene | 2.71 | 47 | 52 | 0.8 |
| Level | D | I (A) | Duty Ratio | Ton (µs) | TE |
|---|---|---|---|---|---|
| 1 | SSO | 2 | 0.4 | 50 | Cu |
| 2 | Kerosene | 3 | 0.5 | 150 | W |
| 3 | 4 | 0.6 | 250 | Cu-W | |
| 4 | 5 | 0.7 | 350 | Graphite |
| Number | D | I (A) | Duty Ratio | Ton (µs) | TE | Ra (µm) | MRR (mm3/min) | EEV (kJ/mm3) | EEC (µg/min) |
|---|---|---|---|---|---|---|---|---|---|
| 1 | 1 | 2 | 0.4 | 50 | 1 | 2.2513 | 0.3408 | 3.5213 | 57.7735 |
| 2 | 1 | 2 | 0.5 | 150 | 2 | 3.4047 | 0.2951 | 5.0830 | 51.2856 |
| 3 | 1 | 2 | 0.6 | 250 | 3 | 1.7103 | 0.3612 | 4.9835 | 61.8735 |
| 4 | 1 | 2 | 0.7 | 350 | 4 | 2.7880 | 0.4312 | 4.8706 | 70.5176 |
| 5 | 1 | 3 | 0.4 | 50 | 2 | 3.0023 | 0.8755 | 2.0561 | 32.8438 |
| 6 | 1 | 3 | 0.5 | 150 | 1 | 2.6158 | 1.0564 | 2.1299 | 44.8150 |
| 7 | 1 | 3 | 0.6 | 250 | 4 | 3.6260 | 1.4893 | 1.8129 | 119.8800 |
| 8 | 1 | 3 | 0.7 | 350 | 3 | 2.7330 | 1.0490 | 3.0028 | 93.1107 |
| 9 | 1 | 4 | 0.5 | 50 | 3 | 3.4490 | 2.7669 | 1.0842 | 177.6000 |
| 10 | 1 | 4 | 0.4 | 150 | 4 | 4.2130 | 2.2591 | 1.0624 | 97.8612 |
| 11 | 1 | 4 | 0.7 | 250 | 1 | 4.2927 | 3.8419 | 1.0932 | 141.0353 |
| 12 | 1 | 4 | 0.6 | 350 | 2 | 3.5975 | 2.6690 | 1.3488 | 81.9692 |
| 13 | 1 | 5 | 0.5 | 50 | 4 | 3.6965 | 4.4352 | 0.8455 | 107.7573 |
| 14 | 1 | 5 | 0.4 | 150 | 3 | 5.3233 | 7.7332 | 0.3879 | 115.5470 |
| 15 | 1 | 5 | 0.7 | 250 | 2 | 5.1002 | 6.7021 | 0.7833 | 81.9692 |
| 16 | 1 | 5 | 0.6 | 350 | 1 | 4.6858 | 4.0482 | 1.1116 | 266.4000 |
| 17 | 2 | 2 | 0.7 | 50 | 1 | 2.3723 | 2.0378 | 1.0305 | 37.7575 |
| 18 | 2 | 2 | 0.6 | 150 | 2 | 2.5213 | 0.6717 | 2.6798 | 71.0400 |
| 19 | 2 | 2 | 0.5 | 250 | 3 | 1.8537 | 0.4361 | 3.4392 | 43.2000 |
| 20 | 2 | 2 | 0.4 | 350 | 4 | 3.2540 | 0.1922 | 6.2448 | 32.5098 |
| 21 | 2 | 3 | 0.7 | 50 | 2 | 3.4015 | 3.5069 | 0.8982 | 93.1107 |
| 22 | 2 | 3 | 0.6 | 150 | 1 | 2.7350 | 1.5873 | 1.7010 | 87.1855 |
| 23 | 2 | 3 | 0.5 | 250 | 4 | 3.0937 | 0.6193 | 3.6332 | 76.1143 |
| 24 | 2 | 3 | 0.4 | 350 | 3 | 2.3313 | 0.9251 | 1.9457 | 30.5427 |
| 25 | 2 | 4 | 0.6 | 50 | 3 | 2.6515 | 6.0928 | 0.5909 | 111.5163 |
| 26 | 2 | 4 | 0.7 | 150 | 4 | 4.0304 | 1.0582 | 3.9689 | 35.6520 |
| 27 | 2 | 4 | 0.4 | 250 | 1 | 2.6078 | 1.4676 | 1.6353 | 54.4909 |
| 28 | 2 | 4 | 0.5 | 350 | 2 | 2.6493 | 1.5873 | 1.8900 | 59.9400 |
| 29 | 2 | 5 | 0.6 | 50 | 4 | 4.1430 | 9.2798 | 0.4849 | 141.0353 |
| 30 | 2 | 5 | 0.7 | 150 | 3 | 4.6903 | 9.4248 | 0.5570 | 239.7600 |
| 31 | 2 | 5 | 0.4 | 250 | 2 | 4.8313 | 4.5014 | 0.6665 | 91.3371 |
| 32 | 2 | 5 | 0.5 | 350 | 1 | 2.5470 | 1.7283 | 2.1697 | 208.4870 |
| Number | Dielectric | I (A) | Duty Ratio | Ton (µs) | Electrode |
|---|---|---|---|---|---|
| 1 | SSO | 3 | 0.7 | 350 | W |
| 2 | Kerosene | 3 | 0.7 | 350 | W |
| 3 | SSO | 4 | 0.5 | 250 | Cu-W |
| 4 | Kerosene | 4 | 0.5 | 250 | Cu-W |
| 5 | SSO | 5 | 0.4 | 150 | Graphite |
| 6 | Kerosene | 5 | 0.4 | 150 | Graphite |
Publisher’s Note: MDPI stays neutral with regard to jurisdictional claims in published maps and institutional affiliations. |
© 2022 by the authors. Licensee MDPI, Basel, Switzerland. This article is an open access article distributed under the terms and conditions of the Creative Commons Attribution (CC BY) license (https://creativecommons.org/licenses/by/4.0/).
Share and Cite
Ming, W.; Xie, Z.; Cao, C.; Liu, M.; Zhang, F.; Yang, Y.; Zhang, S.; Sun, P.; Guo, X. Research on EDM Performance of Renewable Dielectrics under Different Electrodes for Machining SKD11. Crystals 2022, 12, 291. https://doi.org/10.3390/cryst12020291
Ming W, Xie Z, Cao C, Liu M, Zhang F, Yang Y, Zhang S, Sun P, Guo X. Research on EDM Performance of Renewable Dielectrics under Different Electrodes for Machining SKD11. Crystals. 2022; 12(2):291. https://doi.org/10.3390/cryst12020291
Chicago/Turabian StyleMing, Wuyi, Zhuobin Xie, Chen Cao, Mei Liu, Fei Zhang, Yuan Yang, Shengfei Zhang, Peiyan Sun, and Xudong Guo. 2022. "Research on EDM Performance of Renewable Dielectrics under Different Electrodes for Machining SKD11" Crystals 12, no. 2: 291. https://doi.org/10.3390/cryst12020291
APA StyleMing, W., Xie, Z., Cao, C., Liu, M., Zhang, F., Yang, Y., Zhang, S., Sun, P., & Guo, X. (2022). Research on EDM Performance of Renewable Dielectrics under Different Electrodes for Machining SKD11. Crystals, 12(2), 291. https://doi.org/10.3390/cryst12020291