Abstract
Here we study the effects of nano clay and polypropylene fiber on the unconfined compression and splitting properties of lime soil. Through a series of unconfined compressive strength (UCS) tests and splitting strength (STS) tests, the mechanical properties of lime soil (LS), nano clay modified lime soil (NLS), fiber modified lime soil (FLS), nano clay and fiber composite modified lime soil (NFLS) are analyzed, and the volume calculation formula of each phase in NFLS is deduced. Nano clay content αn, porosity volume η and lime volume LVi as independent variables, and the prediction models of UCS and STS of NFLS were established. Furthermore, the microstructure of LS, NLS, FLS and NFLS was analyzed by scanning electron microscope (SEM). It can be concluded that (1) with the increase in nano clay content, the UCS and STS of LS and FLS gradually increase. With the increase in fiber content, the UCS of LS first increases and then decreases, while the UCS and STS of NLS and STS of LS increase with the increase in fiber content, and the optimal fiber content is 0.75%. (2) UCS and STS of NFLS and η/LVi meet the linear relationship. The empirical formulas of UCS and STS established in this paper have a prediction accuracy of less than 10%. The strength of NFLS can be predicted according to the dry density of the sample and the content of each component material. (3) Nano clay can fill the pores of LS and promote the pozzolanic reaction between lime and soil, while fiber mainly plays a reinforcing role in LS, so as to improve the UCS and STS of LS. In NFLS, nano clay can improve the interfacial properties between fiber and LS, so as to improve its UCS and STS. This study can provide a reference for the modification technology of lime soil.
1. Introduction
Lime can improve the compressive strength and shear strength of soil, so as to meet the needs of engineering construction. Therefore, many scholars have studied the mechanical properties and strength formation mechanism of lime modified soil. It is found that the volcano ash reaction between lime and soil will lead to the formation of calcium silicate hydrate (C–S–H) and calcium aluminate hydrate (C–A–H). These two kinds of gel materials can make the structure of soil compact and pore size decrease. With the increase in curing time, cementitious material can enhance the cohesion of lime soil, thus increasing its shear strength [1,2,3,4]. Robin’s research shows that the more lime is added, the smaller the pore ratio of lime soil is and the higher the strength is. The mathematical relationship between strength and pore ratio is established [5]. Pu et al. further studied the mechanical properties of lime stabilized sludge and obtained some useful research results [6]. Zhou et al. studied the deformation characteristics and failure mechanism of lime improved soil through unconfined uniaxial compression test. The test results show that under the condition of unconfined uniaxial compression test, the failure of lime soil is a typical brittle failure mode [7]. In conclusion, the research shows that lime can effectively improve the strength of soil, but the brittle failure mode of lime soil needs to be further improved.
The incorporation of fiber into soil can not only improve the strength of soil, but also improve the brittleness and toughness of soil. Many scholars have carried out research on fiber modified soil and obtained useful research results [8,9,10,11,12]. Yang et al. studied the reinforcement and stability of loess with fiber as reinforcing material and cement as stabilizing material, and found that fiber as a connecting “bridge” can improve the brittle failure of cement soil under the action of pressure [13]. Diambra et al. studied the strength enhancement effect of fiber modified cohesive soil through drainage shear test. The results show that fiber can significantly improve the shear strength of cohesive soil, and proposed a new constitutive model of fiber reinforced cohesive soil [14]. Festugato et al. uses fiber to strengthen the splitting tensile strength and unconfined compressive strength of clay, and puts forward a theoretical model to predict the splitting tensile strength unconfined compressive strength of fiber reinforced soil [15]. Chegenizadeh’s experimental research shows that fiber solidified sand can improve the strength and liquefaction resistance of sand [16]. Cai et al. studied the influence law and improvement mechanism of polypropylene fiber on the engineering properties of lime clayey soil through unconfined compressive strength, direct shear and consolidation tests [17]. By adding fiber materials into the lime soil, Wei uses the good tensile properties of fiber to change the brittleness of lime soil and improve the overall strength and stability of subgrade soil [18]. Saygili et al. studied the effect of polypropylene fiber and silica fume on the mechanical properties of lime soil under freeze-thaw cycle through unconfined compressive strength. The results show that the addition of fiber can effectively improve the frost resistance of lime soil [19]. In conclusion, the research shows that fiber can not only improve the compressive strength, shear strength and tensile strength of soil, but also change the crack development and failure mode of soil from brittleness to ductility.
With the development of material science, nano materials began to be used as stable materials to improve the mechanical properties of soil [20,21,22,23]. Due to the large number of atoms and molecules on the free surface of nano materials, the surface activity of soil particles can be improved from the perspective of physics, chemistry and reactivity [24]. Due to the high surface area and surface charge of nanoparticles, even a small amount of these additives can significantly improve soil properties. Nanotechnology has two contributions to geotechnical engineering. Firstly, it is helpful to study soil structure and its behavior on nano scale. Secondly, the analysis of soil behavior on atomic and molecular scales promotes the application of nanoparticles as soil additives [20,25]. Asskar et al. used nano calcium carbonate and carpet waste fiber to stabilize the soil, and conducted unconsolidated undrained triaxial test. The research results showed that the use of nano calcium carbonate and carpet waste fiber almost doubled the undrained cohesion of the soil [26]. Tanzadehcaiy et al. modified the subgrade soil with lime powder and lime nanoparticles. The research results show that the optimal mass percentages of lime powder and lime nanoparticles are about 4% and 1% respectively. The strength test results increased significantly, such as the CBR of subgrade soil increased by six times. Compared with lime powder, the performance of lime nanoparticles in terms of consumption and initial setting time is improved [27]. The above research shows that nano materials can effectively improve the mechanical properties of soil and the initial setting time of lime soil. Therefore, it can be considered to add a small amount of nano materials to lime soil to improve its mechanical properties. Nano clay is a commonly used soil reinforcement material. Zaid et al. conducted liquid plastic limit and unconfined compression tests on soft soil samples by changing the weight percentage of nano clay (0.05–1%). The results show that the addition of nano clay reduces the plasticity index and improves the compressive strength [28]. Arabani et al. studied the use of nano clay and improved the mechanical properties of cement stabilized sand by using unconfined compressive strength (UCS) test and California bearing ratio (CBR) test. The results showed that nano clay improved its strength properties. By adding 2% nano clay, the tensile elastic modulus increased from 7.6 MPa to 11.23 MPa after 28 days curing age. In addition, after 7 days curing age, the CBR value increased from 84.66 to 112.75 [29].
In conclusion, fiber and nano materials can improve the mechanical properties of lime soil, and unconfined compressive strength and splitting strength are the basic mechanical indexes of modified lime soil. In order to study the effects of nano clay and fiber on the unconfined compression and splitting properties of lime soil. The mechanical properties of lime soil (LS), nano clay modified lime soil (NLS), fiber modified lime soil (FLS) and nano clay and fiber composite modified lime soil (NFLS) were analyzed by unconfined compressive strength (UCS) test and splitting strength (STS) test. On this basis, the volume calculation formula of each phase component in NFLS is deduced, the volume calculation formula of each phase in NFLS is deduced, and the prediction models of UCS and STS of NFLS were established. Furthermore, the microstructure of LS, NLS, FLS and NFLS was analyzed by scanning electron microscope (SEM).
2. Materials and Methods
2.1. Matreials
The nano clay used in the test is produced by Hubei Jinxi Montmorillonite Technology Co., Ltd. (Jinxi, China). the surface of nano clay has a large number of atoms and molecules, which can improve the surface activity of soil and promote the volcanic ash reaction of soil, so as to improve the internal structure and enhance the strength of soil. The main technical indexes of nano clay are shown in Table 1.

Table 1.
Main technical indicators of Nano-clay.
Polypropylene fiber has high toughness, corrosion resistance, deformation resistance, and good dispersion, which makes it difficult to form clusters in the process of mixing with soil, and can give full play to its performance in soil. The polypropylene fiber used in this test is produced by Shaoxing Fiber High Tech Co., Ltd. (Shaoxing, China). Table 2 lists the physical and mechanical technical indexes of polypropylene fiber.
Table 2.
Physical indicators of polypropylene fiber.
Lime is quicklime powder produced by Jiangxi Xinyu Liangliang Trading Co., Ltd. (Xinyu, China) with CaO content of 87%, purity of 98%, and effective calcium and magnesium content of 81.2%.
The soil used in the test was taken from a foundation pit project in Shaoxing, China. The physical indexes of the soil used in the sample are shown in Table 3, it is clay. According to the code for highway geotechnical test (JTG 3430-2020), the particle grading of soil was analyzed by screening method. The grading curve is shown in Figure 1, and the soil sample is well graded.
Table 3.
Physical indicators of soil.
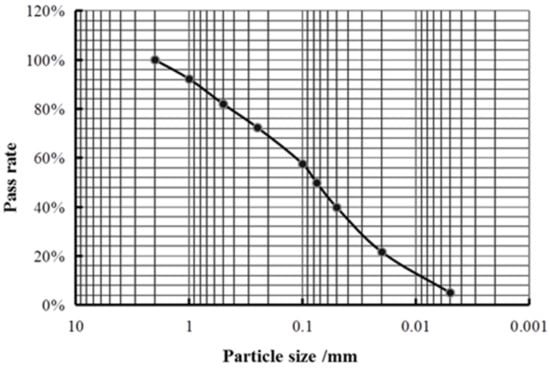
Figure 1.
Gradation curve of soil sample.
Figure 2 shows scanning electron microscope (SEM) images of nano clay, polypropylene fiber, lime and soil.
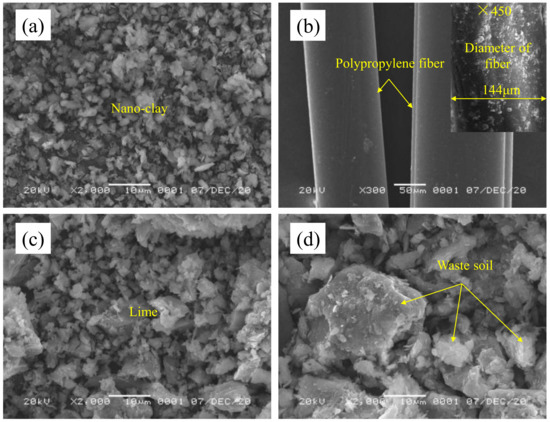
Figure 2.
Test materials: (a) SEM image of Nano-clay; (b) SEM image of Polypropylene fiber; (c) SEM image of lime; and (d) soil.2.2 Sample making and curing.
UCS test specimen and STS test specimen have a height of 50 mm and diameter of 50 mm, according to the Test Code for Inorganic Binder Stabilized Materials in Highway Engineering (JTG E51-2009). The sample preparation is as follows:
- (1)
- Soil treatment. Put the soil block into an oven with a temperature of 105 ℃ for drying, and then put the dry soil into a crusher for crushing. Finally, remove the large particle soil block through a 2 mm sieve to obtain the fine-grained soil used in the test.
- (2)
- Calculate the mass of each mixing material. According to the maximum dry density of 1.762 g/cm3, the optimal water content of 17.5%, the target compactness of 98% and the test design mix proportion, calculate the amount of water added and the mass of each materials, and make six samples for each mix proportion sample.
- (3)
- Mix the mixture. First mix the screened soil with lime, nano clay and polypropylene fiber, as shown in Figure 3a, and then added the calculated target water content. In the mixing process, ensure that soil particles, lime particles, nano clay and polypropylene fibers were dispersed as much as possible, and avoid agglomeration. Put the evenly mixed mixture into the sealed plastic bag and stew for 12~24 h, as shown in Figure 3b.
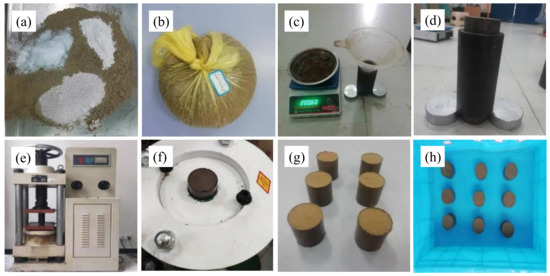 Figure 3. Sample production process: (a) Mixture mixing; (b) Mixture wetting; (c) Mixture weighing; (d) Sample making; (e) Sample compaction; (f) Sample demoulding; (g) Sample after demoulding; (h) Sample during soaking.
 - (4)
- Sample forming. Apply oil on the inner side of the test mold, and the lower cushion block matched with the test mold is placed at the lower part of the test mold and exposed for about 2 cm. The weighed mixture shall be poured into the trial mold twice. After each pouring, it shall be evenly inserted and vibrated with a tamping rod, as shown in Figure 3c. Then put the upper cushion block matching with the test mold into the test mold, and the upper cushion block shall also be exposed for about 2 cm, as shown in Figure 3d. Put the whole test mold together with the upper and lower cushion blocks on the press, pressurize at the loading rate of 1 mm/min until the upper and lower cushion blocks were pressed into the test mold, stabilized the pressure for 2 min and stand for 30 min, as shown in Figure 3e. Finally, take out the test mold from the press and take out the sample with a hydraulic demoulder, as shown in Figure 3f. Six samples under one mix ratio are shown in Figure 3g.
- (5)
- Sample curing. According to the curing method of inorganic binder in the Test Code for Inorganic Binder Stabilized Materials in Highway Engineering (JTG E51-2009), the standard curing method was adopted in this test. Wrap the demoulded sample with fresh-keeping film and put it into a standard curing box with a temperature of 20 ℃ ± 2 ℃ and a relative humidity of more than 95% for curing. After curing for 27 days, take out the sample and soak it in water at room temperature for 24 h. During soaking, the water surface shall be about 2.5 cm higher than the top surface of the sample, as shown in Figure 3h. UCS tests and STSh tests shall be carried out after the sample was soaked for 24 h.
2.2. Unconfined Compressive Strength Test
A series unconfined compressive strength tests were carried out according to the Code for Highway Geotechnical Test (JTG 3430-2020) to measure the unconfined compressive strength (UCS), qu. Through the UCS test, the unconfined compressive stress-strain curves with different lime content of LS can be obtained, as shown in Figure 4.
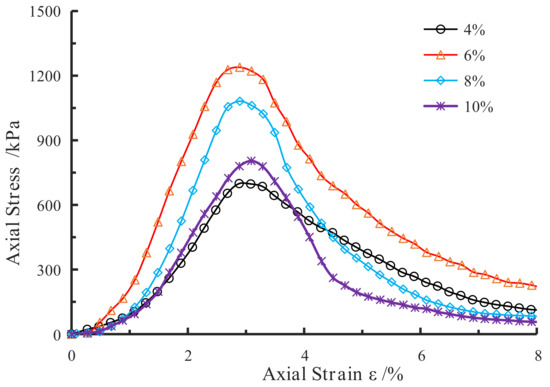
Figure 4.
The unconfined compressive stress-strain curves of LS with different lime content.
It can be seen from Figure 4 that LS with 6% lime content has the highest unconfined compressive strength. Therefore, in this paper, the optimal content of lime is 6%. On this basis, the experiments of single mixing nano clay, single mixing polypropylene fiber and double mixing nano clay and polypropylene fiber were carried out. The loading rate of 1 mm/min was adopted, and the test mix design and unconfined compressive strength test results are shown in Table 4. In Table 4, the contents of lime, nano clay and fiber were respectively αl, αn, αf. These contents are the percentage of lime, nano clay, fiber to soil mass.
Table 4.
Test scheme and test results.
2.3. Splitting Tensile Strength Test
A series of STS tests were carried out according to the Test Code for Inorganic Binder Stabilized Materials in Highway Engineering (JTG E51-2009) to test the splitting tensile strength (STS), qt. During the test, the splitting fixture was placed on the lifting table of the pressure testing machine. The splitting fixture was composed of upper and lower pressure strips, and the width of the pressure strip is 6.35 mm. During the test, the sample was placed between the upper and lower pressing strips and kept in alignment. The test loading rate was 1 mm/min. The force displacement curves were obtained through the data acquisition system of the pressure testing machine, and qt was calculated according to Equation (1).
where P (N) is the maximum force on the force displacement curve, H (mm) is the height of the sample after soaking in water, and the splitting strength test results are shown in Table 4.
2.4. SEM Test
The instrument used in the SEM test was the Nissan high and low vacuum scanning electron microscope with the model of JSM-6360LV. The test started from the microstructure and combines the characteristics, spatial distribution and contact relationship of the sample micro unit to characterize the microstructure characteristics of NFLS. It is worth noting that due to the poor conductivity of geotechnical materials, the charge is easy to accumulate on the sample surface under the irradiation of incident electron beam, which affects the imaging quality. Therefore, it is necessary to spray a layer of platinum film on the sample surface before the test.
2.5. Porosity and Phase Volume
The composition of various materials of NFLS sample is shown in Figure 5. It is assumed that the volume of the sample is 1 and the dry density of the sample is ρd. The specific gravity of lime, nano clay, fiber and soil are GL, GN, Gf and Gs, respectively. According to the mix proportion of each component material of the sample, the mass of soil in the sample can be obtained, as shown in Equation (2).
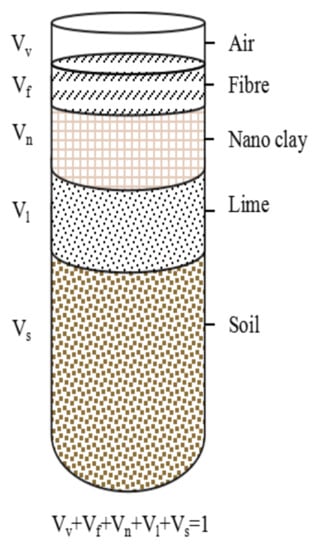
Figure 5.
Schematic diagram of each material in NFLS.
Then, the volume of soil can be calculated according to Equation (3),
Equations (4)–(7) can be used to calculate the volumes of lime, nano clay, polypropylene fiber and air, respectively.
According to Equations (4)–(7), the porosity η (%) of the sample can be calculated. As shown in Equation (8).
Similarly, the volume rate LVi (%) of lime can be obtained, as shown in Equation (9). The calculation results of LVi and η are shown in Table 4.
3. Test Results and Discussion
3.1. Stress-Strain Behavior
For UCS tests, the typical stress-strain curves of NFLS with different nano clay and polypropylene fiber content are shown in Figure 6.
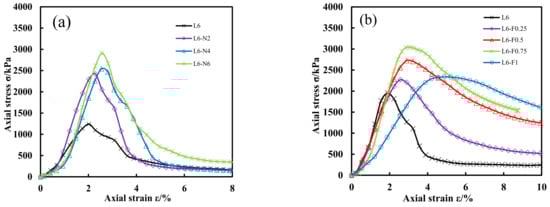
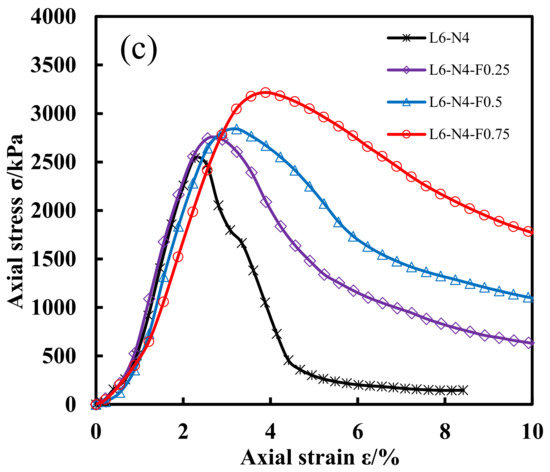
Figure 6.
Stress-strain curves of UCS tests. (a) NLS with different nano clay content; (b) FLS with different fiber content; (c) NFLS with 4% nano clay content and different fiber content.
It can be seen from Figure 6 that the stress-strain curves of NLS, FLS and NFLS under axial load are softening curves, that is, with the increase in strain, the stress first increases, reaches the peak value (qu), then gradually decreases and converges to the residual strength. It can be seen from Figure 6a that due to the addition of nano clay, the UCS of lime soil has been greatly improved, and increases with the increase in nano clay content. Compared with L6 without nano clay, the strength growth rate of NLS with 8% nano clay is 51%. This is because with the increase in nano clay, on the one hand, nano clay can fill the pores between lime soil particles and make its internal structure more dense. On the other hand, it can promote the more complete pozzolanic reaction between lime and soil and produce more cementitious substances such as hydrated calcium silicate C–S–H and hydrated calcium aluminate C–A–H. Figure 6b shows that the UCS of FLS first increases and then decreases with the increase in polypropylene fiber content, and the polypropylene fiber reaches the optimum at 0.75%. This is because when the content of polypropylene fiber is less than 0.75%, the content of fiber is less and the cementation between polypropylene fiber and soil is greater. When the fiber content exceeds 0.75%, due to the excessive fiber content, the fibers form agglomeration in the soil, which reduces the compactness of the soil. In the process of soil immersion, the strength of the sample decreases due to water absorption and expansion, but its UCS is still higher than that of lime soil without polypropylene fiber. When the content of nano clay is 2%, 4% and 6%, the addition of polypropylene fiber can improve the UCS of NFLS, and the axial strain corresponding to the peak strength increases, a typical picture is shown in Figure 6c. Because fiber can slow down the failure and crack development of lime soil, there is still a certain bearing capacity after NFLS failure. With the increase in fiber content, the crack development is slower and the bearing capacity is greater.
For STS tests, the typical stress-strain curves of NFLS with different nano clay and polypropylene fiber content are shown in Figure 7.
Figure 7.
Stress-strain curves of STS tests. (a) NLS with different nano clay content; (b) FLS with different fiber content; (c) NFLS with different nano clay content and fiber content.
According to Figure 7a, with the increase in nano clay content, the STS of NLS increases from 135 kPa to 216 kPa, but its failure strain (strain corresponding to splitting strength) is basically the same, which is 0.01%. This may be because the addition of nano clay only improves the strength of LS, does not change the failure mode of the LS sample, and the failure mode of NLS is still brittle failure. Figure 7b shows that with the increase in polypropylene fiber, the STS of LS increases from 226 kPa to 363 kPa, and the failure strain increases from 0.01% to 0.021%. It can be seen from Figure 7c that when L6 and L6-N6 curves reach the highest point, the curve decreases rapidly, and the curves of L6-F0.75 and L6-N4-F0.75 reach the highest point, the curve decreases slowly, and after adding nano clay, FLS has a higher STS value. It shows that polypropylene fiber can improve the failure strain of LS and NLS under the splitting load, while nano clay can improve the STS of LS and FLS.
3.2. Empirical Formula of UCS and STS
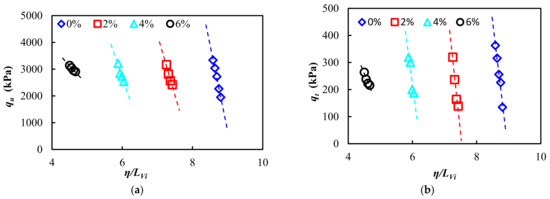
Figure 8.
The relationship curves between NFLS strength and η/ LVi at different nano-clay content: (a) The relationship curves between UCS and η/ LVi; (b) The relationship curves between STS and η/ LVi.
As can be seen from Figure 8, the relationship between UCS and STS of NFLS and η/LVi satisfy linear relationship, and its empirical formula can be expressed by Equation (10).
According to the fitting calculation, the relationship between Au(t), Au(t) and the content of nano clay are shown in Figure 9.
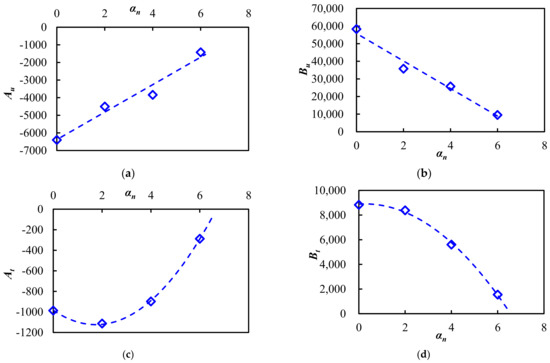
Figure 9.
The relationship between Au(t), Bu(t) and nano-clay content αn: (a) The relationship between Au and αn; (b) The relationship between Bu and αn; (c) The relationship between At and αn; (d) The relationship between Bt and αn.
It can be seen from Figure 9 that there is a linear relationship between Au, Bu and αn, and the relationship between At, Bt and αn meet the quadratic function. Combined with the least square method, the empirical formulas of UCS and STS of NFLS can be expressed as Equations (11) and (12).
Compare the calculation results of Equations (11) and (12) with the test results in Table 4, as shown in Figure 10.
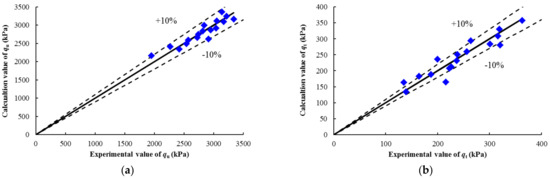
Figure 10.
Comparison between strength calculation value and test value of NFLS: (a) UCS; (b) STS.
It can be seen from Figure 10 that the fitting errors of UCS and STS of NFLS are less than 10%, indicating that Equations (11) and (12) can be used to characterize the change law of UCS and STS of NFLS. When determining the content of nano clay and the content of η/ LVi of NFLS, the strength of NFLS can be predicted by Equations (11) and (12).
3.3. Micro Mechanism Analysis
Figure 11, Figure 12, Figure 13 and Figure 14 show the SEM images of LS, NLS, FLS and NFLS, respectively, corresponding to sample L6, sample L6-N6 and sample L6-F0.55 and sample L6-N4-F0.75. According to the SEM images with different magnification shown in Figure 11, a small amount of large particle aggregate, C–S–H and C–A–H cementitious material are accumulated on the microstructure plane of LS [30], but there are many macropores, the overall skeleton is very dispersed, and the macro performance is low strength and poor brittleness.
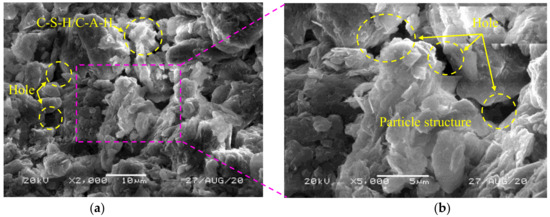
Figure 11.
SEM images of LS: (a) 2000×; (b) 5000×.
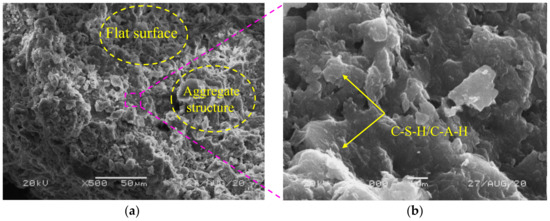
Figure 12.
SEM images of NLS: (a) 500×; (b) 2000×.
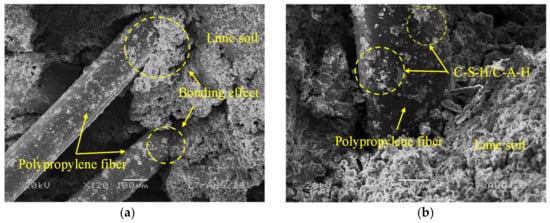
Figure 13.
SEM images of FLS: (a) 120×; (b) 800×.
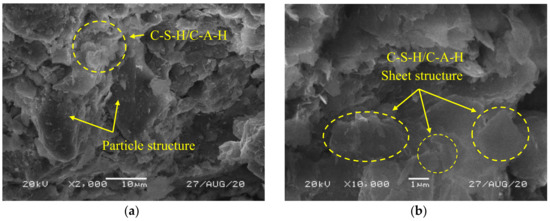
Figure 14.
SEM images of NFLS: (a) 2000; (b) 10,000×.
When nano clay is added, Figure 12a shows that the pores of the microstructure plane of NLS decrease, the structure surface is flat and dense, and the large particle flake structure increases. Specifically, because nano clay fills the pores between lime soil particles, it increases the compactness of lime soil. It promotes the hydration reaction of lime soil and generates more C–S–H and C–A–H cementitious substances, so as to agglomerate the loose soil particles to form flake large aggregate, and enhance the integrity of lime soil, as shown in Figure 12b.
In Figure 13a, the fibers are bonded by lime soil, which mainly shows the bonding effect and supporting skeleton in the process of improving the strength. In Figure 13b, the white crystal on the fiber surface is the product of lime soil hydration, which makes the fiber and lime soil bond with each other and have better integrity. The microstructure plane of NFLS is more dense than that of LS, NLS and FLS, and there are many flakes of large particle crystal structures, as shown in Figure 14. This is caused by the joint action of nano clay and polypropylene fiber. The macro mechanical performance is that the UCS and STS of NFLS are higher than those of LS, NLS and FLS.
4. Conclusions
Through a series of unconfined compressive strength tests and splitting strength tests, the change laws of UCS and STS of NLS, FLS and NFLS were studied, and the action mechanism of fiber and nano clay is analyzed. The following conclusions can be obtained.
- (1)
- With the increase in nano clay content, the UCS and STS of LS and FLS gradually increased. With the increase in fiber content, the UCS of LS first increases and then decreases, while the UCS and STS of NLS and STS of LS increase with the increase in fiber content, and the optimal fiber content is 0.75%.
- (2)
- UCS and STS of NFLS and η/LVi meets the linear relationship. The empirical formulas of UCS and STS established in this paper have a prediction accuracy of less than 10%. The strength of NFLS can be predicted according to the dry density of the sample and the content of each component material.
- (3)
- The addition of nano clay can fill the pores of lime soil on the one hand, and promote the pozzolanic reaction of lime soil on the other hand, so as to improve the strength of lime soil. The addition of fiber can play a reinforcing role through the bonding between fiber and lime soil, so as to improve the strength and ductility of lime soil. In NFLS, nano clay can not only improve the compactness of FLS, but also promote pozzolanic reaction to increase the interface strength between fiber and lime, so as to comprehensively improve the strength and ductility of FLS.
Author Contributions
Formal analysis, P.J.; writing—review and editing, L.Z. and P.J.; investigation, W.Z.; conceptualization, W.W. and N.L. All authors have read and agreed to the published version of the manuscript.
Funding
This research was funded by the National Natural Science Foundation of China (grant number 41772311), Zhejiang Provincial Natural Science Foundation of China (Grant number LQ20E080042), the Open Research Fund of State Key Laboratory of Geomechanics and Geotechnical Engineering, Institute of Rock and Soil Mechanics, Chinese Academy of Science (Grant number Z017013) and the Scientific Research Projects of Zhejiang Department of Housing and Urban and Rural Construction of China (Grant number 2017K179, 2019K171).
Institutional Review Board Statement
Not applicable.
Informed Consent Statement
Not applicable.
Data Availability Statement
Not applicable.
Conflicts of Interest
The authors declare no conflict of interest.
References
- Lemaire, K.; Deneele, D.; Bonnet, S.; Legret, M. Effects of lime and cement treatment on the physicochemical, microstructural and mechanical characteristics of a plastic silt. Eng. Geol. 2013, 166, 255–261. [Google Scholar] [CrossRef]
- Jiang, P.; Qian, J.; Li, N. Reliability Analysis of a Direct Shear Test of Modified Iron Tailings Based on the Monte Carlo Algorithm. Adv. Civ. Eng. 2020, 2020, 8897094. [Google Scholar] [CrossRef]
- Rasul, J.M.; Ghataora, G.S.; Burrow, M.P.N. The effect of wetting and drying on the performance of stabilized subgrade soils. Transp. Geotech. 2017, 14, 1–7. [Google Scholar] [CrossRef]
- Jiang, P.; Qiu, L.Q.; Li, N.; Wang, W.; Zhou, A.Z.; Xiao, J.P. Shearing Performance of Lime Reinforced Iron Tailing Powder Based on Energy Dissipation. Adv. Civ. Eng. 2018, 2018, 1–8. [Google Scholar] [CrossRef]
- Robin, V.; Cuisinier, O.; Masrouri, F.; Javadi, A.A. Chemo-mechanical modelling of lime treated soils. Appl. Clay. Sci. 2014, 95, 211–219. [Google Scholar] [CrossRef] [Green Version]
- Pu, S.Y.; Zhu, Z.D.; Wang, H.R.; Song, W.L.; Wei, R.J. Mechanical characteristics and water stability of silt solidified by incorporating lime, lime and cement mixture, and SEU-2 binder. Constr. Build. Mater. 2019, 214, 111–120. [Google Scholar] [CrossRef]
- Zhou, B.C.; Kong, L.; Guo, A. Stress-strain-strength behaviour and constitutive description of limetreated expansive soil. Rock Soil Mech. 2012, 33, 999–1005. [Google Scholar]
- Okonta, F.N.; Nxumalo, S.P. Strength properties of lime stabilized and fibre reinforced residual soil. Geomech. Eng. 2022, 28, 35–48. [Google Scholar]
- Jiang, P.; Lv, S.W.; Wang, Y.; Li, N.; Wang, W. Investigation on direct shear and energy dissipation characteristics of iron tailings powder reinforced by polypropylene fiber. Appl. Sci. 2019, 9, 5098. [Google Scholar] [CrossRef] [Green Version]
- Hejazi, S.M.; Sheikhzadeh, M.; Abtahi, S.M.; Zadhoush, A. A simple review of soil reinforcement by using natural and synthetic fibers. Constr. Build. Mater. 2012, 30, 100–116. [Google Scholar] [CrossRef]
- Jiang, P.; Zhou, L.; Wang, Y.; Wang, W.; Li, N.; Zhang, F. Freeze–Thaw Damage Model of Polypropylene Fiber Reinforced Cement Stabilized Waste Construction Slurry under Uniaxial Action. Minerals 2021, 11, 743. [Google Scholar] [CrossRef]
- Chao, S.T.; Bin, S.; Wei, G.; Feng, J.C.; Yi, C. Strength and mechanical behavior of short Polypropylene fiber reinforced and cement stabilized clayey soil. Geotext. Geomembr. 2007, 25, 194–202. [Google Scholar]
- Yang, B.H.; Weng, X.Z.; Liu, J.Z.; Kou, Y.N.; Jiang, L.; Li, H.L.; Yan, X.C. Strength characteristics of modified Polypropylene fiber and cement-reinforced loess. J. Cent. South Univ. 2017, 24, 560–568. [Google Scholar] [CrossRef]
- Diambra, A.; Ibraim, E. Modelling of fibre–cohesive soil mixtures. Acta Geotech. 2014, 9, 1029–1043. [Google Scholar] [CrossRef]
- Festugato, L.; da Silva, A.P.; Diambra, A.; Consoli, N.C.; Ibraim, E. Modelling tensile/compressive strength ratio of fibre reinforced cemented soils. Geotext. Geomembr. 2018, 46, 155–165. [Google Scholar] [CrossRef] [Green Version]
- Chegenizadeh, A.; Keramatikerman, M.; Nikraz, H. Liquefaction resistance of fibre reinforced low-plasticity silt. Soil Dyn. Earthq. Eng. 2018, 104, 372–377. [Google Scholar] [CrossRef]
- Yi, C.; Bin, S.; Charles, W.W.N. Effect of Polypropylene fibre and lime admixture on engineering properties of clayey soil. Eng. Geol. 2006, 87, 230–240. [Google Scholar]
- Wei, L.; Chai, S.X.; Zhang, H.Y.; Shi, Q. Mechanical properties of soil reinforced with both lime and four kinds of fiber. Constr. Build. Mater. 2018, 172, 300–308. [Google Scholar] [CrossRef]
- Saygili, A.; Dayan, M. Freeze-thaw behavior of lime stabilized clay reinforced with silica fume and synthetic fibers. Cold Reg. Sci. Technol. 2019, 161, 107–114. [Google Scholar] [CrossRef]
- Foad, C.Z.; Abdolhosein, H. Strength properties of soft clay treated with mixture of nano-SiO2 and recycled polyester fiber. J. Rock Mech. Geotech. Eng. 2015, 7, 367–378. [Google Scholar]
- Choobbasti, A.J.; Vafaei, A.; Kutanaei, S.S. Static and cyclic triaxial behavior of cemented sand with nanosilica. J. Mater. Civ. Eng. 2015, 30, 04018269. [Google Scholar] [CrossRef]
- Edalati, S.A.; Bayat, M.; Pakar, I.; Bayat, M. A novel approximate solution for nonlinear problems of vibratory systems. Struct. Eng. Mech. 2016, 57, 1039–1049. [Google Scholar] [CrossRef]
- Anvari, S.M.; Shooshpasha, I.; Kutanaei, S.S. Effect of granulated rubber on shear strength of fine-grained sand. J. Roc. Mech. Geotech. Eng. 2017, 9, 936–944. [Google Scholar] [CrossRef]
- Jiang, P.; Zhou, L.; Wang, W.; Li, N.; Zhang, F. Performance and mechanisms of fly ash for graphene oxide removal from aqueous solution. Environ. Sci. Pollut. R. 2021, 29, 1–11. [Google Scholar] [CrossRef]
- Meng, T.; Qiang, Y.J.; Hu, A.F.; Xu, C.T.; Lin, L. Effect of compound nano-CaCO3 addition on strength development and microstructure of cement-stabilized soil in the marine environment. Constr. Build. Mater. 2017, 151, 775–781. [Google Scholar] [CrossRef]
- Choobbasti, A.J.; Samakoosh, M.A.; Kutanaei, S.S. Mechanical properties soil stabilized with nano calcium carbonate and reinforced with carpet waste fibers. Constr. Build. Mater. 2019, 211, 1094–1104. [Google Scholar] [CrossRef]
- Tanzadeh, R.; Vafaeian, M.; Fard, M.Y. Effects of micro-nano-lime (CaCO3) particles on the strength and resilience of road clay beds. Constr. Build. Mater. 2019, 217, 193–201. [Google Scholar] [CrossRef]
- Zaid, H.M.; Mohd, R.T. Effect of Nanomaterial Treatment on Geotechnical Properties of A Penang Soft Soil. J. Asian Sci. Res. 2012, 2, 587. [Google Scholar]
- Arabani, M.; Haghi, A.K.; Mohamadzadeh, S.A. Use of Nano-clay for improvement the microstructure and mechanical properties of soil stabilized by cement. In Proceedings of the 4th International Conference on Nanostructures (ICNS4), Kish Island, Iran, 1 March 2012. [Google Scholar]
- Eisazadeh, A.; Kassim, K.A.; Nur, H. Solid-state NMR and FTIR studies of lime stabilized montmorillonitic and lateritic clays. Appl. Clay Sci. 2012, 67-68, 5–10. [Google Scholar] [CrossRef]
Publisher’s Note: MDPI stays neutral with regard to jurisdictional claims in published maps and institutional affiliations. |
© 2022 by the authors. Licensee MDPI, Basel, Switzerland. This article is an open access article distributed under the terms and conditions of the Creative Commons Attribution (CC BY) license (https://creativecommons.org/licenses/by/4.0/).