Article

Crystal Plasticity Modeling of Grey Cast Irons under Tension, Compression and Fatigue Loadings

Integrated Computational Materials Engineering, VTT Technical Research Centre of Finland Ltd., 02044 Espoo, Finland
*
Author to whom correspondence should be addressed.
Crystals 2022, 12(2), 238; https://doi.org/10.3390/cryst12020238
Submission received: 1 December 2021 / Revised: 1 February 2022 / Accepted: 3 February 2022 / Published: 9 February 2022
(This article belongs to the Special Issue Micromechanical Modelling and Its Applications to Polycrystals)

Abstract

:
The study of the micromechanical performance of materials is important in explaining their macrostructural behavior, such as fracture and fatigue. This paper is aimed, among other things, at reducing the deficiency of microstructural models of grey cast irons in the literature. For this purpose, a numerical modeling approach based on the crystal plasticity (CP) theory is used. Both synthetic models and models based on scanning electron microscope (SEM) electron backscatter diffraction (EBSD) imaging finite element are utilized. For the metal phase, a CP model for body-centered cubic (BCC) crystals is adopted. A cleavage damage model is introduced as a strain-like variable; it accounts for crack closure in a smeared manner as the load reverses, which is especially important for fatigue modeling. A temperature dependence is included in some material parameters. The graphite phase is modeled using the CP model for hexagonal close-packed (HCP) crystal and has a significant difference in tensile and compressive behavior, which determines a similar macro-level behavior for cast iron. The numerical simulation results are compared with experimental tensile and compression tests at different temperatures, as well as with fatigue experiments. The comparison revealed a good performance of the modeling approach.

1. Introduction

For centuries, cast iron has been one of the most widespread materials used by humankind for industrial applications. Grey cast iron, in turn, is the most commonly used metal material in foundries [1]. The popularity of grey irons is determined by their outstanding physical properties, which provide a good machinability combined with low manufacturing and processing costs.
However, grey cast irons possess numerous disadvantages, one of which being the low ductility of the material. A large amount of carbon is contained in the form of graphite flakes, which makes cast iron a complex natural composite. Graphite, on the one hand, is a natural lubricant that provides a high wear resistance. On the other hand, being much less rigid than metal, it can cause local stress concentrations in the metal matrix. In this context, a proper study of the damage initiation and propagation (including fatigue) should be conducted at the microstructural level.
It is well known that cast iron demonstrates different elastic and plastic behavior in tension and compression. Material models that take into account this difference at the macro (homogeneous) level exist in abundance [2,3,4,5,6,7]. The cast iron plasticity model embedded in Abaqus finite element software [8] assumes different yield strengths, different hardening behavior and different inelastic volume changes in tension and compression. The constitutive formulations used there are based on the modified Huber–von Mises–Hencky condition adopted in [4,5]. This approach was criticized as insufficient in [7], where the Gurson–Tveergard–Needleman yield function and the phenomenological creep damage model are used for thermomechanical fatigue life predictions. Models for cast iron under cyclic loading in different temperature conditions can be found in, e.g., [9,10].
Remarkably, to the best of the authors’ knowledge, the literature on the microstructural modeling of grey irons is very limited, especially when compared to the widely used nodular cast iron. Various works, such as [11], have focused on a detailed evaluation of the micromechanics from an experimental perspective under, e.g., cyclic loading, but full field micromechanical works attempting to model the behavior are almost completely lacking. Conceivably, the most comprehensive study published recently is the series of papers by Metzger and Seifert [12,13,14,15]. The papers are devoted to the finite element analysis of a 3D microstructural model represented by a statistical volume element created by image processing. A homogeneous elastoplastic material model with nonlinear kinematic hardening is used for the metal matrix, while graphite is defined as a nonlinear elastic material with a strain-dependent Young’s modulus. A new yield function has been proposed for cast iron. Issues of the robustness and efficiency of the numerical method are addressed. In the work of Pina et al. [16], the unit-cell model for grey cast iron is considered, and the graphite material is highly anisotropic and modeled as a multilayer of graphene. In [17], an experimental and numerical study of cast irons with vermicular graphite particles is presented. The models are created by processing 2D SEM images. The emphasis is on the high anisotropy of the particles and how they affect the elastoplastic response and damage resistance of the metal matrix. Thus, no attention has been paid to the effect of the metallic grain structure itself with respect to its defect structures (e.g., pores) or grain-to-grain interactions affecting local stress and strain heterogeneity.
In the present work, we extend the micromechanical perspective to include the grain structure for the graphite phase, essentially by using crystal plasticity. Grain interactions can then be taken into account, as well as the interaction of the metallic grain with the graphite flake. This provides a more physical foundation for the analysis of stress concentrations and strain localizations taking place within the metallic phase. This helps to identify the different sources in the microstructure that are able to nucleate damage and fracture under various loading scenarios, either describing the anisotropic deformation behavior of material or, more generally, its fatigue response.
This paper is structured as follows. First, we describe the grey cast iron material used in this work and the mechanical experiments performed to define the mechanical behaviour of the material. Then, crystal plasticity models are formulated to define the mechanical behavior and anisotropy of the graphite and metallic phases utilizing a finite element solver. For the metallic phase, an extension of the crystal plasticity damage model is proposed to describe the nucleation and evolution of cracks at the microstructural scale. Model parameterization strategies are addressed using several different computational microstructures. The results section includes a discussion of the experimental results demonstrating the mechanical response of the material under tension and compression at different temperatures. Finally, we investigate the ability of the model to predict the peculiarities of material behavior under cyclic loading, along with the damage evolution at the microstructural scale.

2. Materials and Methods

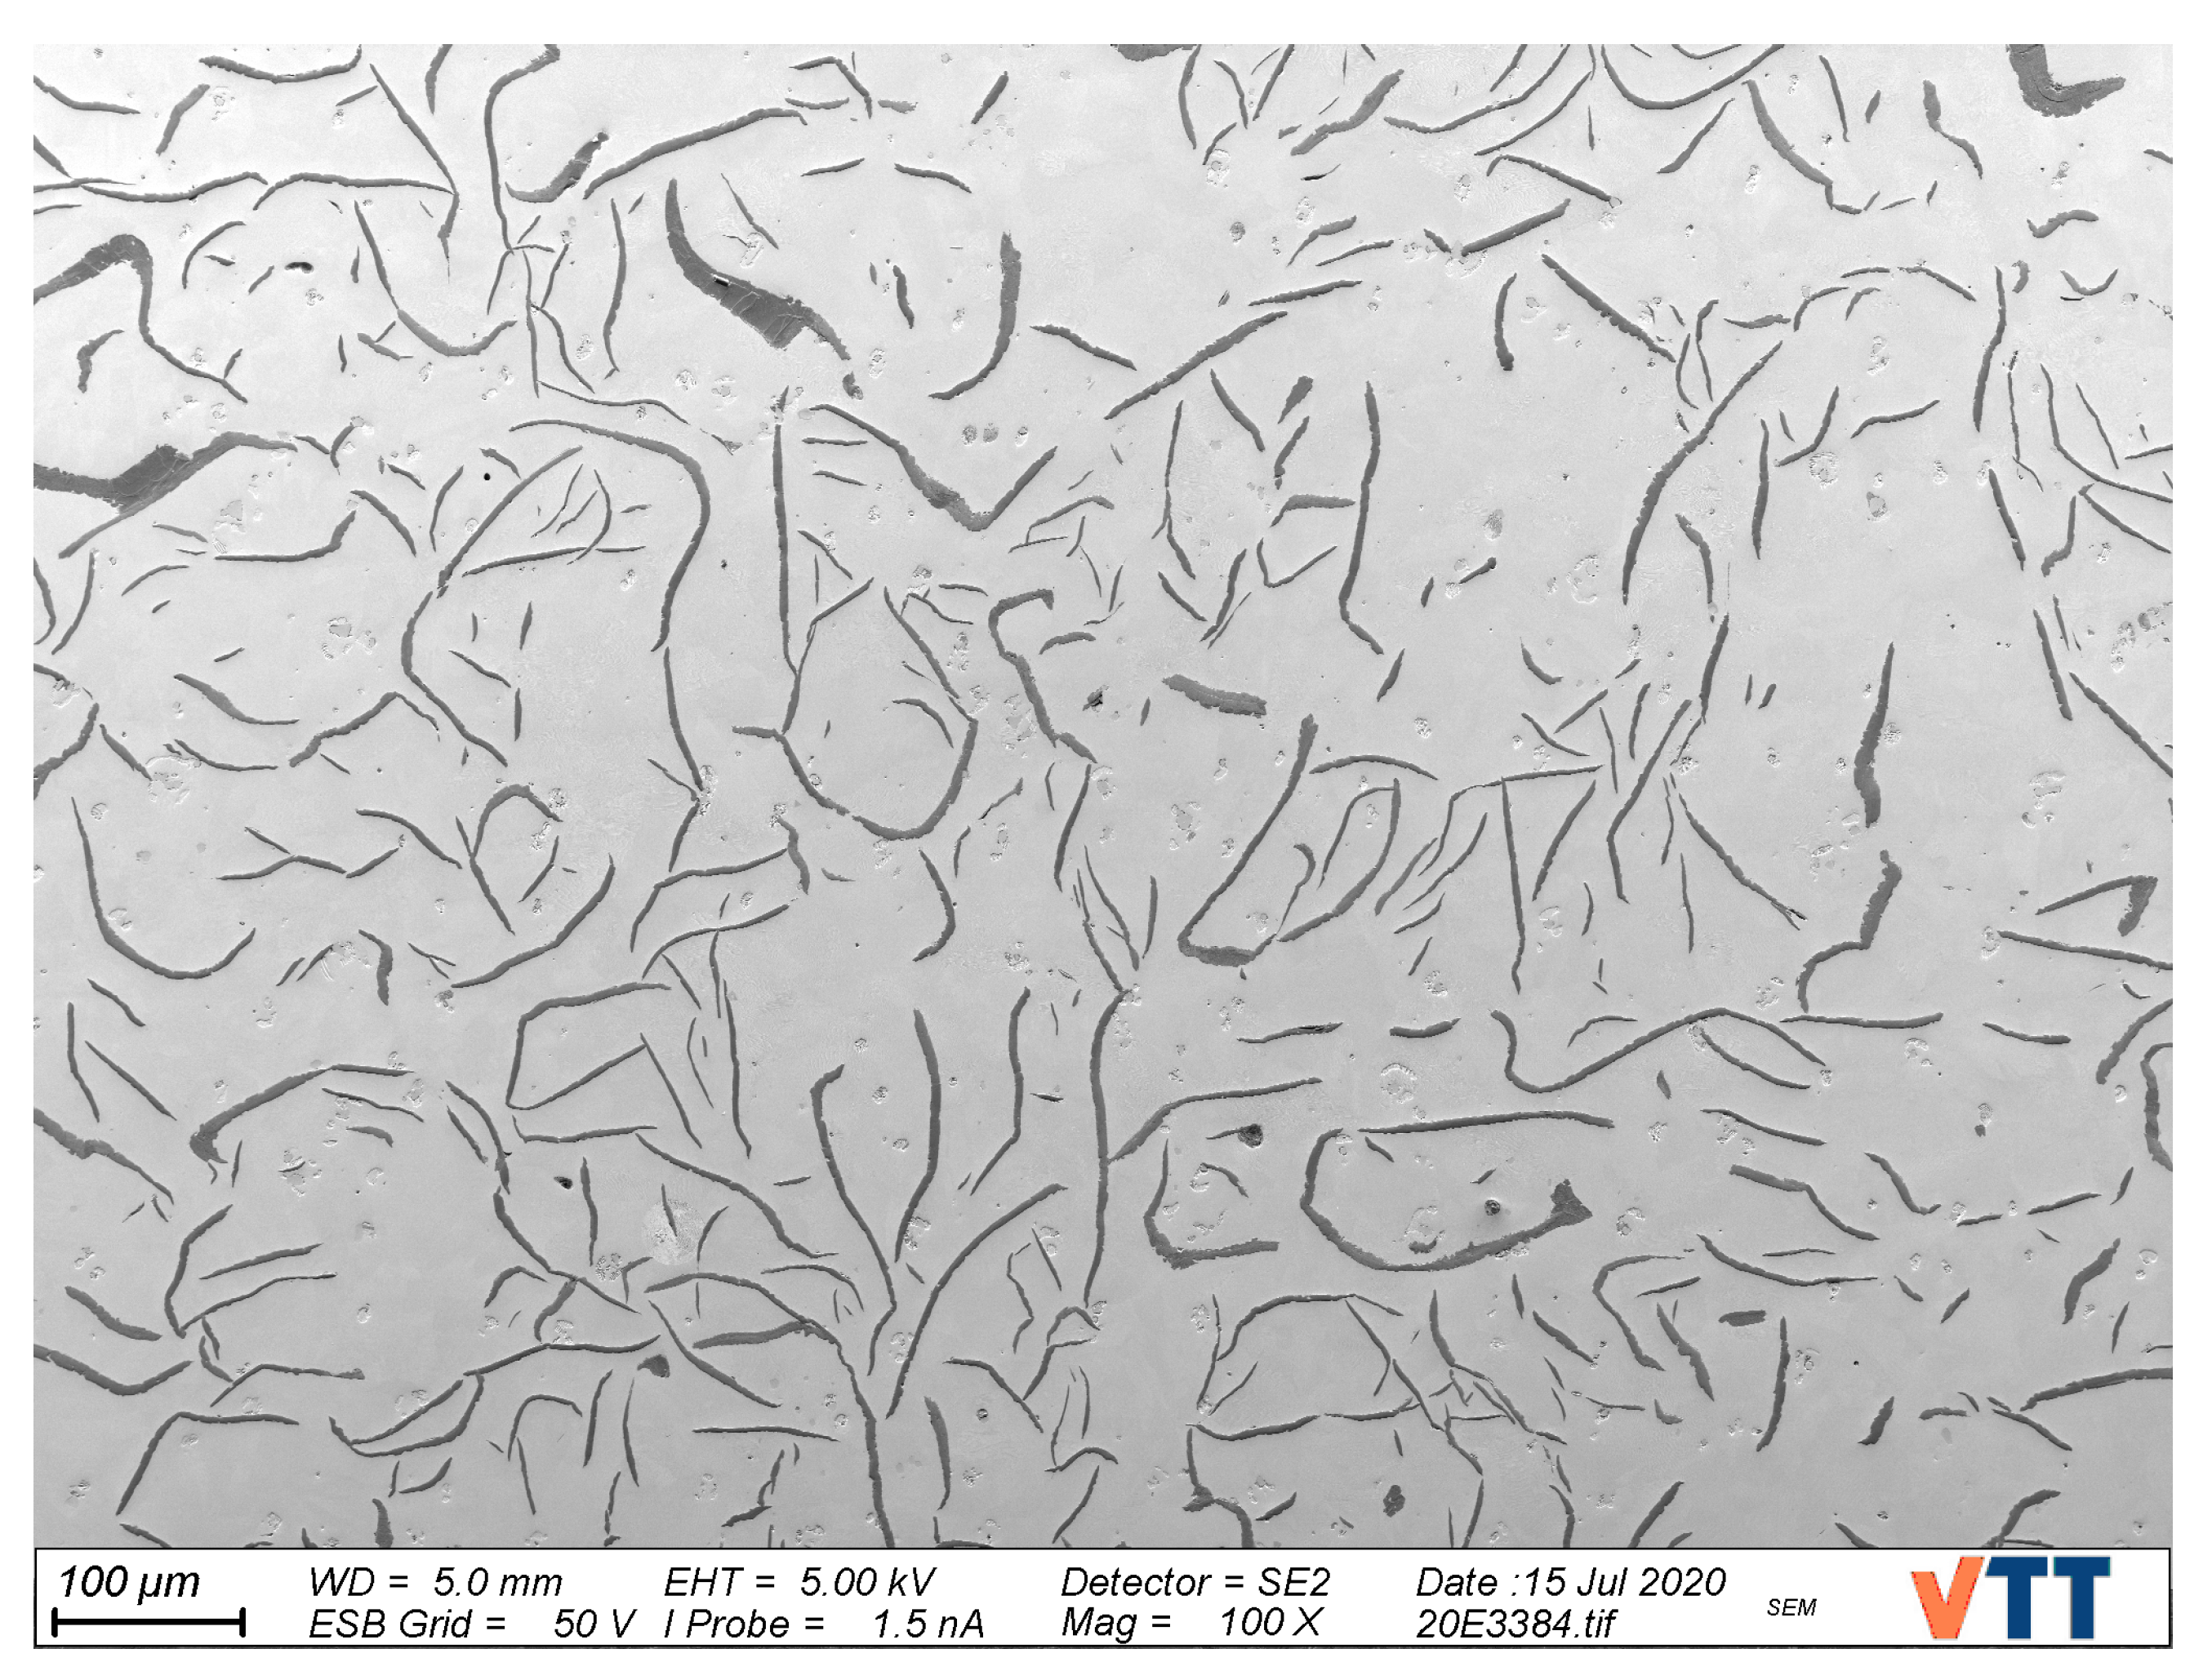
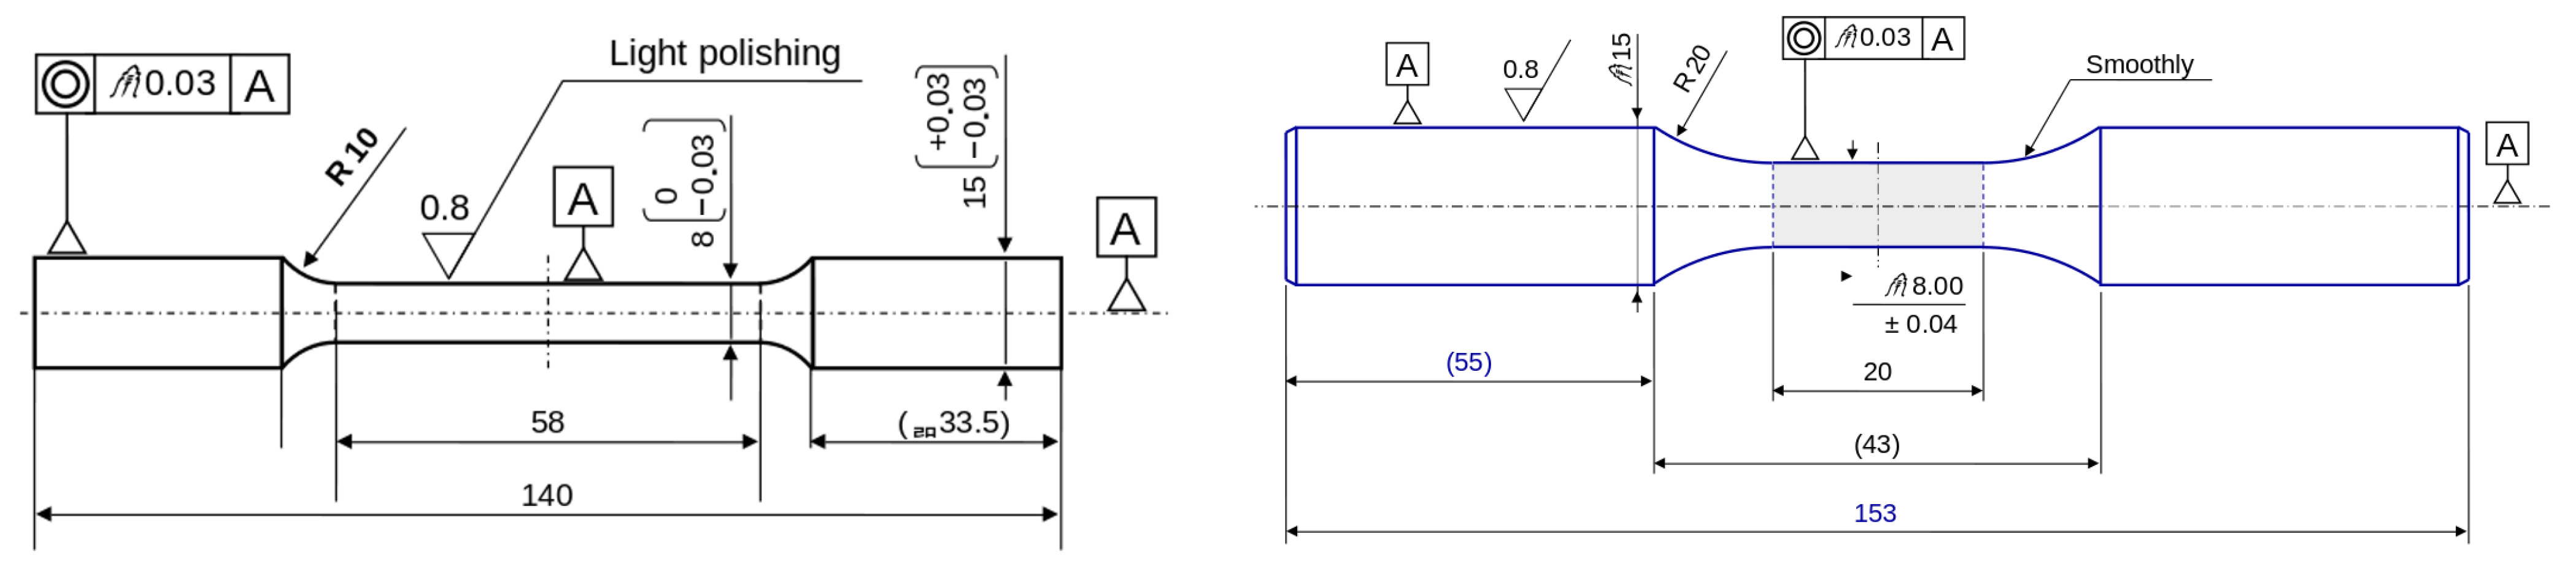
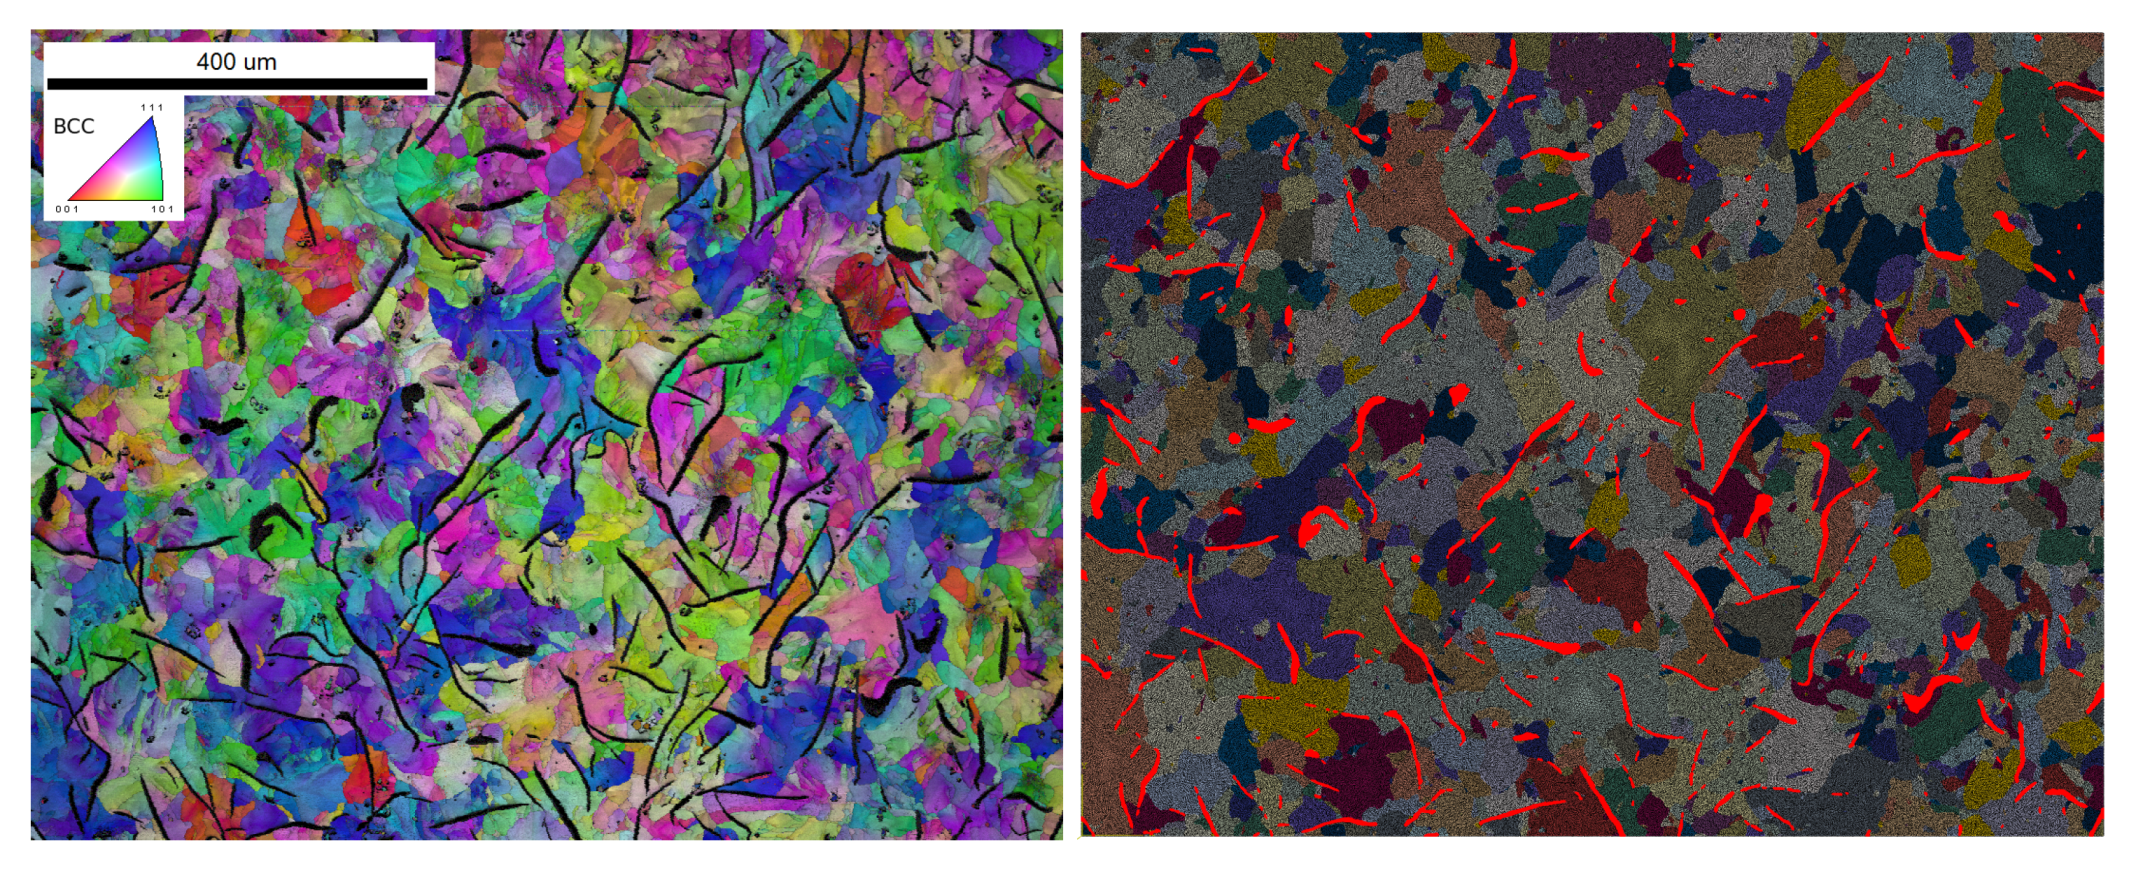
2.1. Material and Experimental Conditions

In this contribution, grey cast iron grade 300 (GJL-300) is studied experimentally and numerically. Metallographic examination of the material was carried out on several samples. Image analysis of polished and unetched cross-sections showed that the graphite content is ∼10–14% of the volume. Perlite and ferrite fractures in the metal matrix were analyzed on Nital etched samples. The microstructures are almost fully perlitic with perlite/ferrite ratio 90–97%/10–3%.
Type C graphite is present on the surface of most samples. This usually indicates that the iron is hypereutectic, i.e., with a carbon equivalent greater than 4.3. Depending on the orientation, graphite flakes can act as potential crack initiation sites. Figure 1 presents the typical microstructure that exists near the surface of practically all samples. There are sharp graphite flakes in a perpendicular orientation relative to the casting surface. This, combined with anomalies in surface quality, may increase the possibility of fatigue crack initiation.
The drawings of specimens used in experiments are depicted in Figure 2. Tensile tests were made with test bars using an 8 mm MTS extensometer according to ISO 6892 standard. Compression and fatigue tests were performed with fatigue test bars using an MTS 8 mm extensometer that can be used to measure compression up to 2%.

2.2. Crystal Plasticity Modeling

Crystal plasticity models are used to describe microscale deformation behavior of both metallic and graphite phases of cast iron. The models are implemented in the Z-set finite element software [18]. Finite strain formalism is utilized with decomposition of the deformation gradient to elastic F ̲ E and plastic F ̲ P parts:
F ̲ = F ̲ E · F ̲ P .
The plastic deformation is carried over by dislocation slip. A total of 24 BCC slip systems with slip families of twelve { 110 } <111> and twelve { 112 } <111> slip systems are included in the model used for the metallic phase. The viscoplastic slip rate of a slip system is defined as:
γ ˙ s = | τ s x s | R s K n s i g n ( τ s ) ,
where τ s is the resolved shear stress of a slip system s, x s is a kinematic hardening term and R s is an isotropic hardening term. The resolved shear stress is computed with τ s = Π ̲ M : N ̲ s , where N ̲ s is the orientation tensor of a slip system s computed in the intermediate configuration. Mandel stress in the relaxed configuration (isocline) is defined as Π ̲ M = C ̲ e · ( Λ ̲ ̲ : E ̲ g l ) , where C ̲ e is the Cauchy–Green tensor, E ̲ g l is the Green–Lagrange strain tensor and Λ ̲ ̲ is the elastic stiffness tensor. Parameters K and n define the viscosity. The evolution of isotropic hardening is given by the initial shear resistance τ 0 and the hardening evolution part coming from dislocation interactions. Hall–Petch effect is not separated here and is considered to be included in the value of τ 0 , as well as the effect of the initial dislocation density:
R s = τ 0 + Q s = 1 N s H s r ( 1 e x p ( b ν r ) ) ,
where τ 0 is the initial shear resistance, Q describes the magnitude of the hardening, H s r is the interaction matrix, b defines saturation of the hardening and ν r is the cumulative plastic slip of a slip system r with ν r = 0 t | γ ˙ r | d t . The kinematic hardening is given by [19]:
x s = c α s ; w h e r e α ˙ = ( s i g n ( τ s x s ) d α s ) ν s ,
where material parameters c and d define the kinematic hardening evolution.
Plasticity in the graphite phase is also enabled with a crystal plasticity model. This restricts the stress growth in the graphite phase and in the interface region. Four HCP slip families are included: basal { 0001 } < 11 2 ¯ 0 > , prismatic { 10 1 ¯ 0 } < 11 2 ¯ 0 > , pyramidal <a> { 10 1 ¯ 1 } < 11 2 ¯ 0 > and pyramidal <c+a> { 11 2 ¯ 2 } < 11 2 ¯ 3 > . The same definitions of slip rate, isotropic hardening and kinematic hardening are used as in Equations (2)–(4), respectively. In general, deformation twinning is possible at low temperatures [20], for example. For simplicity, however, both tensile and compression twins are omitted here.

2.3. Damage Extension

A crystal plasticity level damage model is included to introduce damage into the metal matrix. The main concept is that the plastic deformation gradient includes a contribution from damage, which transforms it into an inelastic deformation gradient. Hence, damage is formulated as a strain-like variable following the damage concept of Aslan et al. [21,22] and Sabnis et al. [23]. Later, a similar model was applied for martensitic steels by Lindroos et al. [24] and extended to strain gradient plasticity with the micromorphic model [25] with some variations. It is assumed that damage can occur on the cleavage plane family { 100 } of BCC crystals. The opening strain of the available cleavage planes is tracked, and the shear modes are accommodated with shear damage systems acting on the same planes as strain variables [21], whereas Sabnis et al. [23] used only opening planes of { 111 } -crystal, with shear accommodated by slip systems. It is possible that, when the loading is reversed (e.g., fatigue loading), the opening strain of a damage plane reaches zero again and mimics crack closure in a smeared manner. In this situation, the strength of the material is partially restored; see details in [24]. This aspect is the key difference between the present approach and conventional (isotropic) degraded elasticity damage models, where damage can still be effective even in compressive stress states, e.g., extending beyond the crack closure state. In the current model, the inelastic velocity gradient takes the form:
L ̲ i = F ̲ i · F ̲ i 1 ˙ = s = 1 N s γ ˙ s ( m s n s ) + k = 1 N d a m a g e δ ˙ c k ( n d k n d k ) + δ ˙ 1 k ( d 1 k n d k ) + δ ˙ 2 k ( d 2 k n d k ) .
The onset of damage is controlled by opening the cleavage planes using the viscoplastic flow rule after reaching the initial damage threshold. In the intermediate configuration, cleavage damage is accomplished by opening δ c of cleavage planes ({100}) with the normal vector n d k . Shear systems ( δ i k ) accommodate in-plane deformation in the orthogonal directions d 1 k and d 2 k , but only when crack opening has occurred. The crack opening rate is given by:
δ ˙ c k = | σ d c | Y c k K d n d s i g n ( σ d c ) w i t h σ d c = n d k · Π ̲ M · n d k .
Crack opening damage strain δ ˙ c k is activated when the cleavage opening resistance Y c k is exceeded by the driving normal stress σ d c subjected to the cleavage planes. To avoid a negative crack closure effect, a constraint utilised is that δ c k 0 .
The rates of damage shear mechanisms use the same rate dependent formulation:
δ ˙ i k = | τ d i | Y i k K d n d s i g n ( τ d i ) w i t h τ d i = n d k · Π ̲ M · d i k ,
where the shear stress τ d i activates the damage shear mechanisms after the shear resistance Y i k is reached. The viscous parameters K d and n d are taken to be the same for the crack opening and shear mechanisms.
It is assumed that local damage softens the slip resistance when nano-cracks and micro-cracks form. A coupling between plasticity and damage is established with a modification of Equation (3):
R s = τ 0 + Q s = 1 N s H s r ( 1 e x p ( b ν r ) σ c 0 β d e x p ( β ν c u m ) ) ,
where ν c u m is the cumulative plastic slip of all slip systems and β describes the coupling intensity of slip and damage.
The damage variable d, which controls softening effects, is updated as the cumulative sum of all three damage mechanisms:
d ˙ = k = 1 N d a m a g e | δ ˙ c k | + | δ ˙ 1 k | + | δ ˙ 2 k | .
The damage resistance decreases with increasing damage d and by slip activity. Dislocation slip localization promotes damage susceptibility by two possible mechanisms: (i) stress concentrations resulting from local hardening and grain interactions, and (ii) the accumulation of plastic slip to reduce cleavage resistance. After damage nucleation, the damage resistance decreases with softening modulus H due to increased damage in the material. The damage resistances Y c k and Y i k are set to always remain positive and are allowed to decrease until the limit value σ u l t . A small non-zero value—for example, σ c 0 / 200 —can be assigned for numerical convenience. A material point can be considered completely cracked when the damage resistance has reached the limit value. However, inelastic strains driven by damage flow are still tracked to be able to represent crack closure if loading conditions facilitate the cleavage plane closure.
Y c k = Y i k = σ c 0 exp β ν c u m + H d .

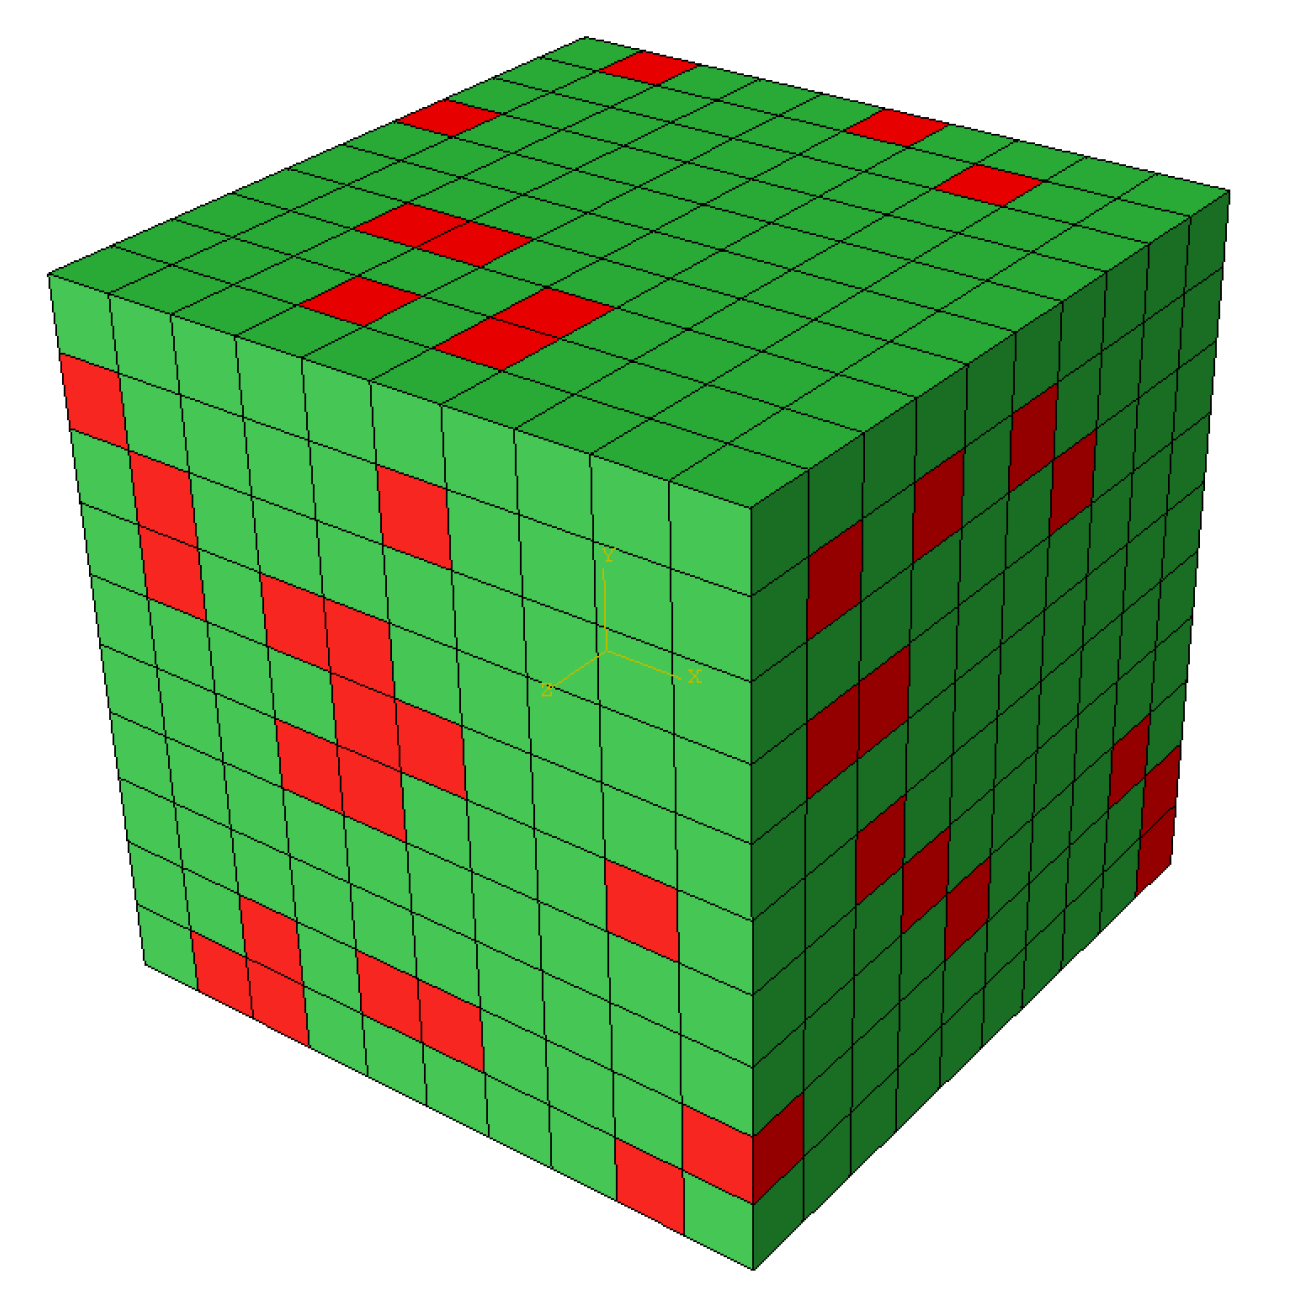
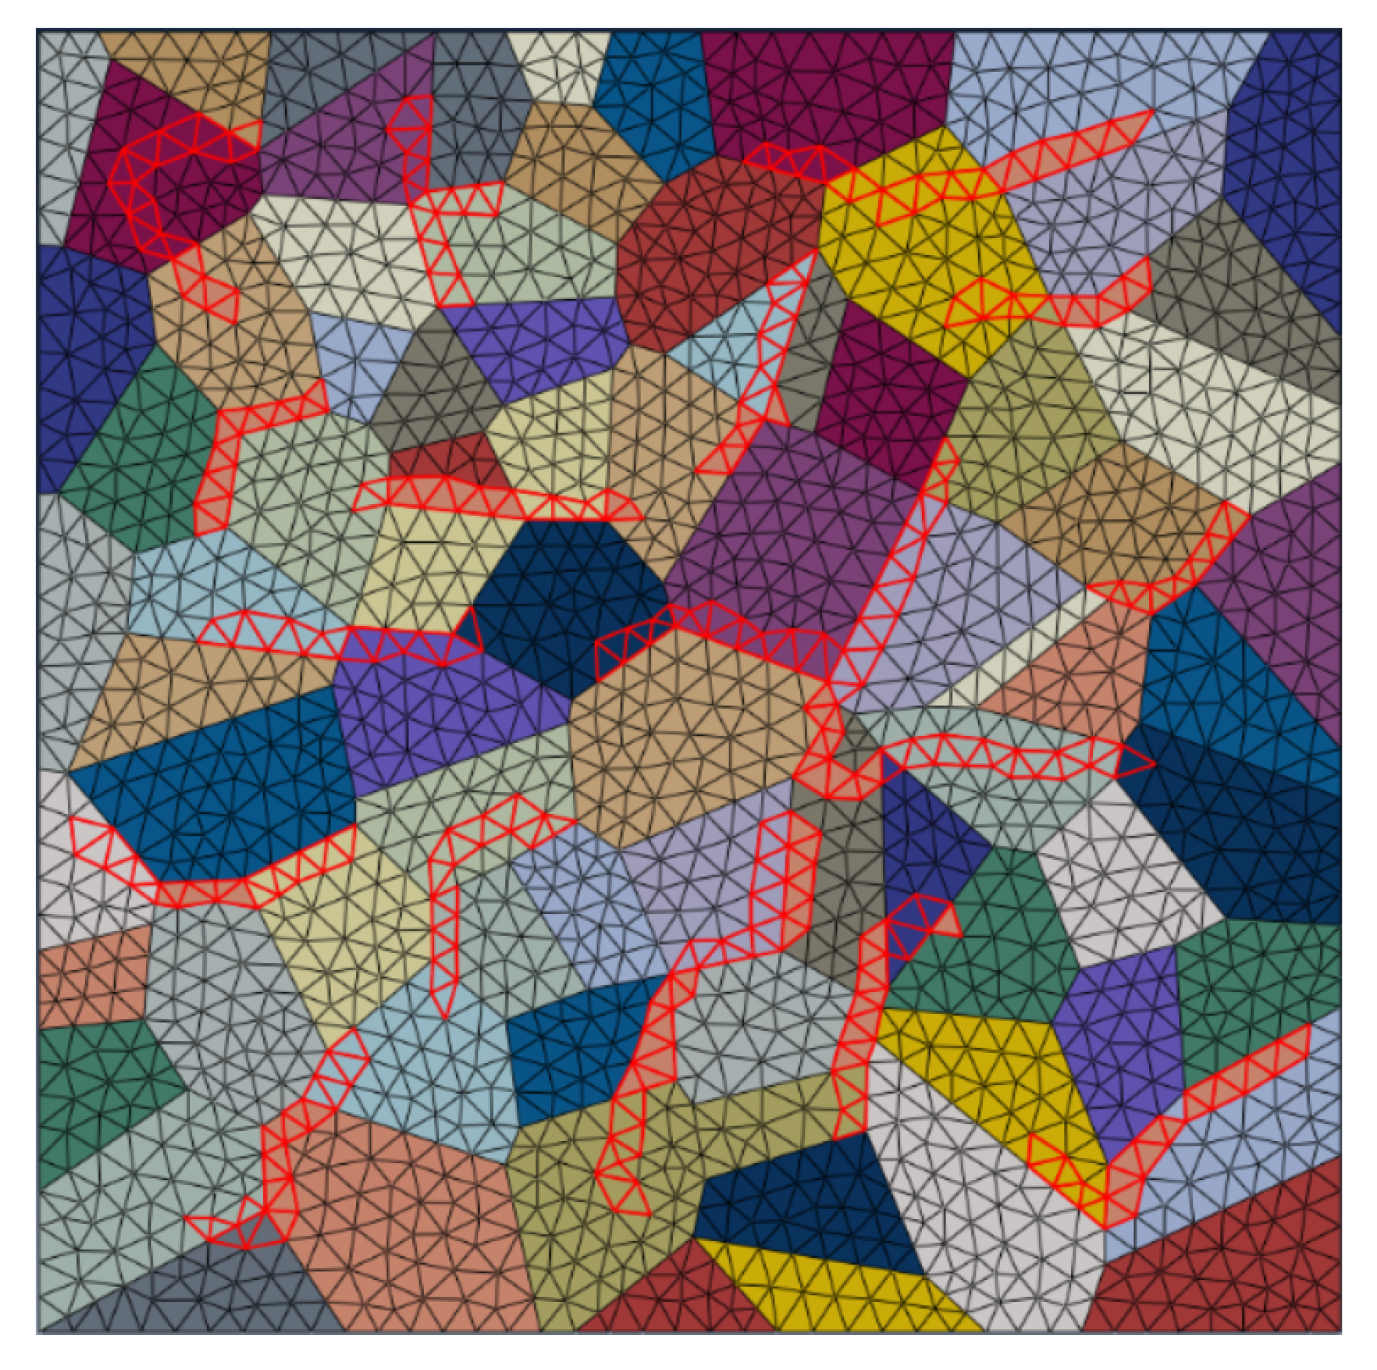
2.4. Finite-Element Models

Three different finite element models were used for the purposes of the current contribution. Model 1 is a cube consisting of 1000 cubic trilinear finite elements (see Figure 3 for an example). Each element represents a randomly oriented crystal. The 144 (14.4% of volume) randomly selected elements, marked in red in Figure 3, represent the graphite, whereas the green elements represent the metal matrix.
To minimize the influence of randomness in the selection and orientation of graphite elements, the following was performed. To estimate the global response (mainly meaning stress–strain curves) of a cubic structure, up to ten cubic models with a random configuration are considered, and the average curve is used for further studies.
Model 2 (see Figure 4 for an example) is constructed of 80 Voronoi grains. The graphite phase is introduced into the microstructure to describe continuous flakes inside the polycrystalline metal matrix. This modeling choice improves the interaction between metal grains applied to different orientations and the graphite phase. In the simulations, the orientation distribution was chosen to be random.
Models 1 and 2 were used for the preliminary studies, being fast but efficient, and for checking the model and initial parameter fittings (as shown in [24]). Only at the final stages of parameters fitting and comparison with experiment were the heavier and more realistic Model 3 and its parts used.
Model 3 is a “2.5D” structure based on a 2D SEM EBSD image of the microstructure and is extended to the third direction with thickness of one element. Beside the metal grains and graphite inclusions, it includes voids naturally existing in the material. The orientations were extracted directly from the EBSD map, which generates a step towards realism with phase and grain-to-grain interactions. The model can present the high stress and strain localizations near phase interfaces or voids. However, specific interface elements and material behavior have been omitted in the present study for simplicity, and it remains a partially open topic for future work. Interfacial damage, as expected, plays an important role in the overall damage process [26]. Damage extension enables intra-grain damage behavior characteristically, but also phase/grain boundary-like damage in the nearest elements of the boundary, which can be interpreted as interfacial damage. Figure 5 demonstrates an example of finite element mesh based on EBSD map. Different subsections of this model scope were also used in preliminary tests to reduce computational time.
A comparison of all the models used is presented in Table 1. The wall-clock time is the simulation time of tensile test performed on the cluster node with 30 CPUs.

3. Results and Discussion

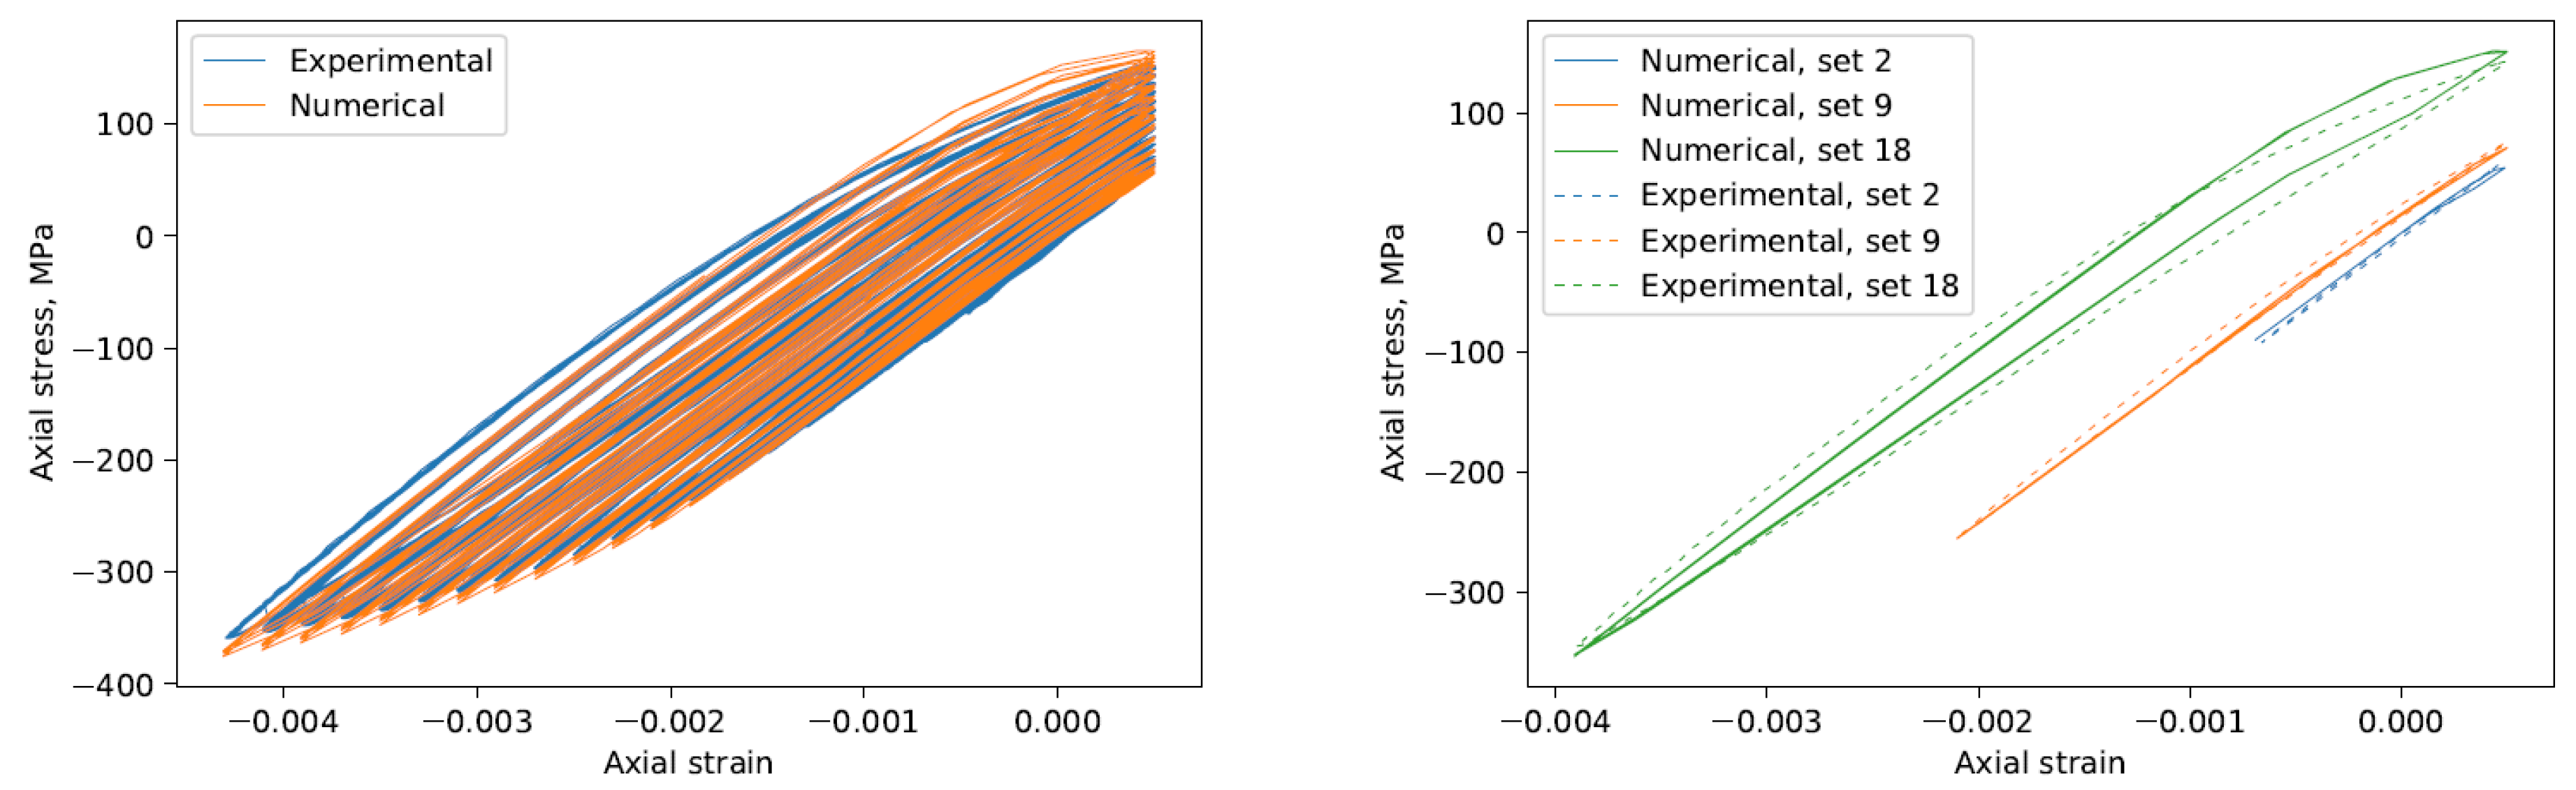
3.1. Experimental Results

The results of the experimental tensile and compression tests are presented in Figure 6. To study the temperature dependence of material behavior, tensile tests were conducted at temperatures of 20 C, 200 C and 350 C, and compression at 20 C, 100 C and 350 C. A typical difference in the mechanical behavior of grey cast iron under tension and compression (see, e.g., [6]) is observed. In tension, the material demonstrates a softer elasticity without a pronounced elastic regime. In compression, the yield strength is significantly higher (and more distinguishable). The failure limits are also 50–100% higher in compression. The dependence of the tensile-compressive behavior on temperature changes is also in line with expectations (e.g., [27]). In both tension and compression, an increasing temperature causes a drop in the yield strength, as well as an insignificant decrease in elastic rigidity. The strain failure limits, in contrast, increase with higher temperatures.
Figure 7 shows the result of the experimental fatigue test. The experiment was performed in a series (or set) of 100 asymmetric loading cycles of 0.2 s, each with a dwell time of approximately one hour between sets. The test was strain-controlled; the peak positive value was always constant and equal to 0.05%. The negative (compressive) peak values increase from set to set, starting at 0.05% in 0.02% increments to a maximum of 0.45 % when complete specimen failure occurs. Such asymmetry in the applied tension and compression is chosen to avoid early fatigue failure before the specimen takes some valuable strain. With a symmetrical increase in amplitude, a rather early failure occurs due to the extreme brittleness of the material under tension.

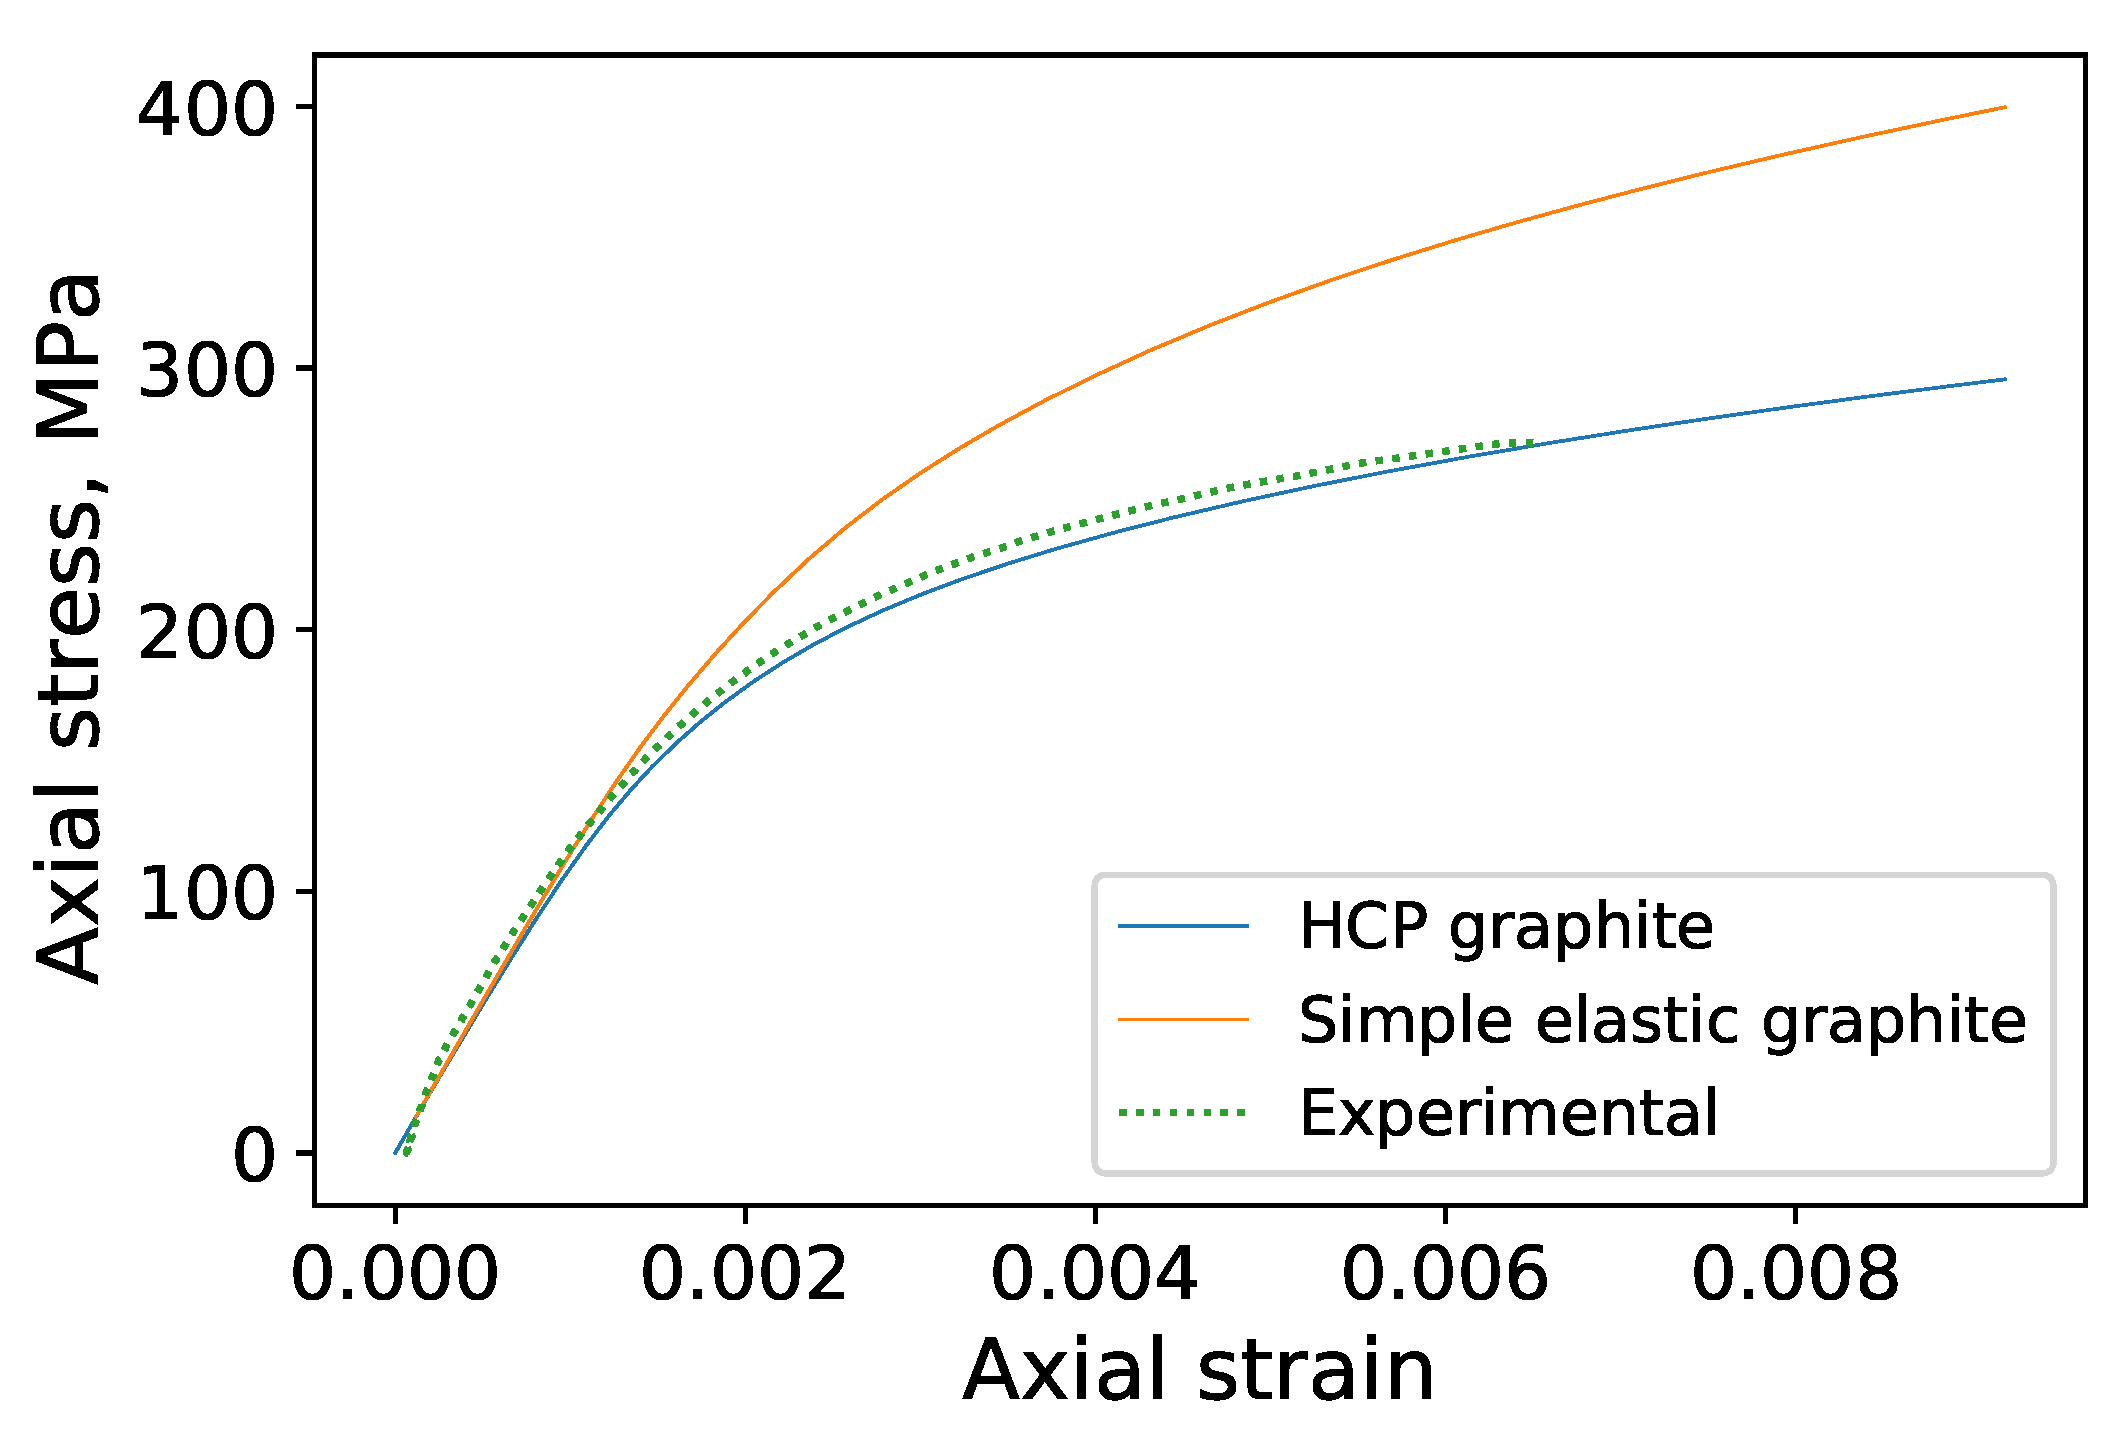
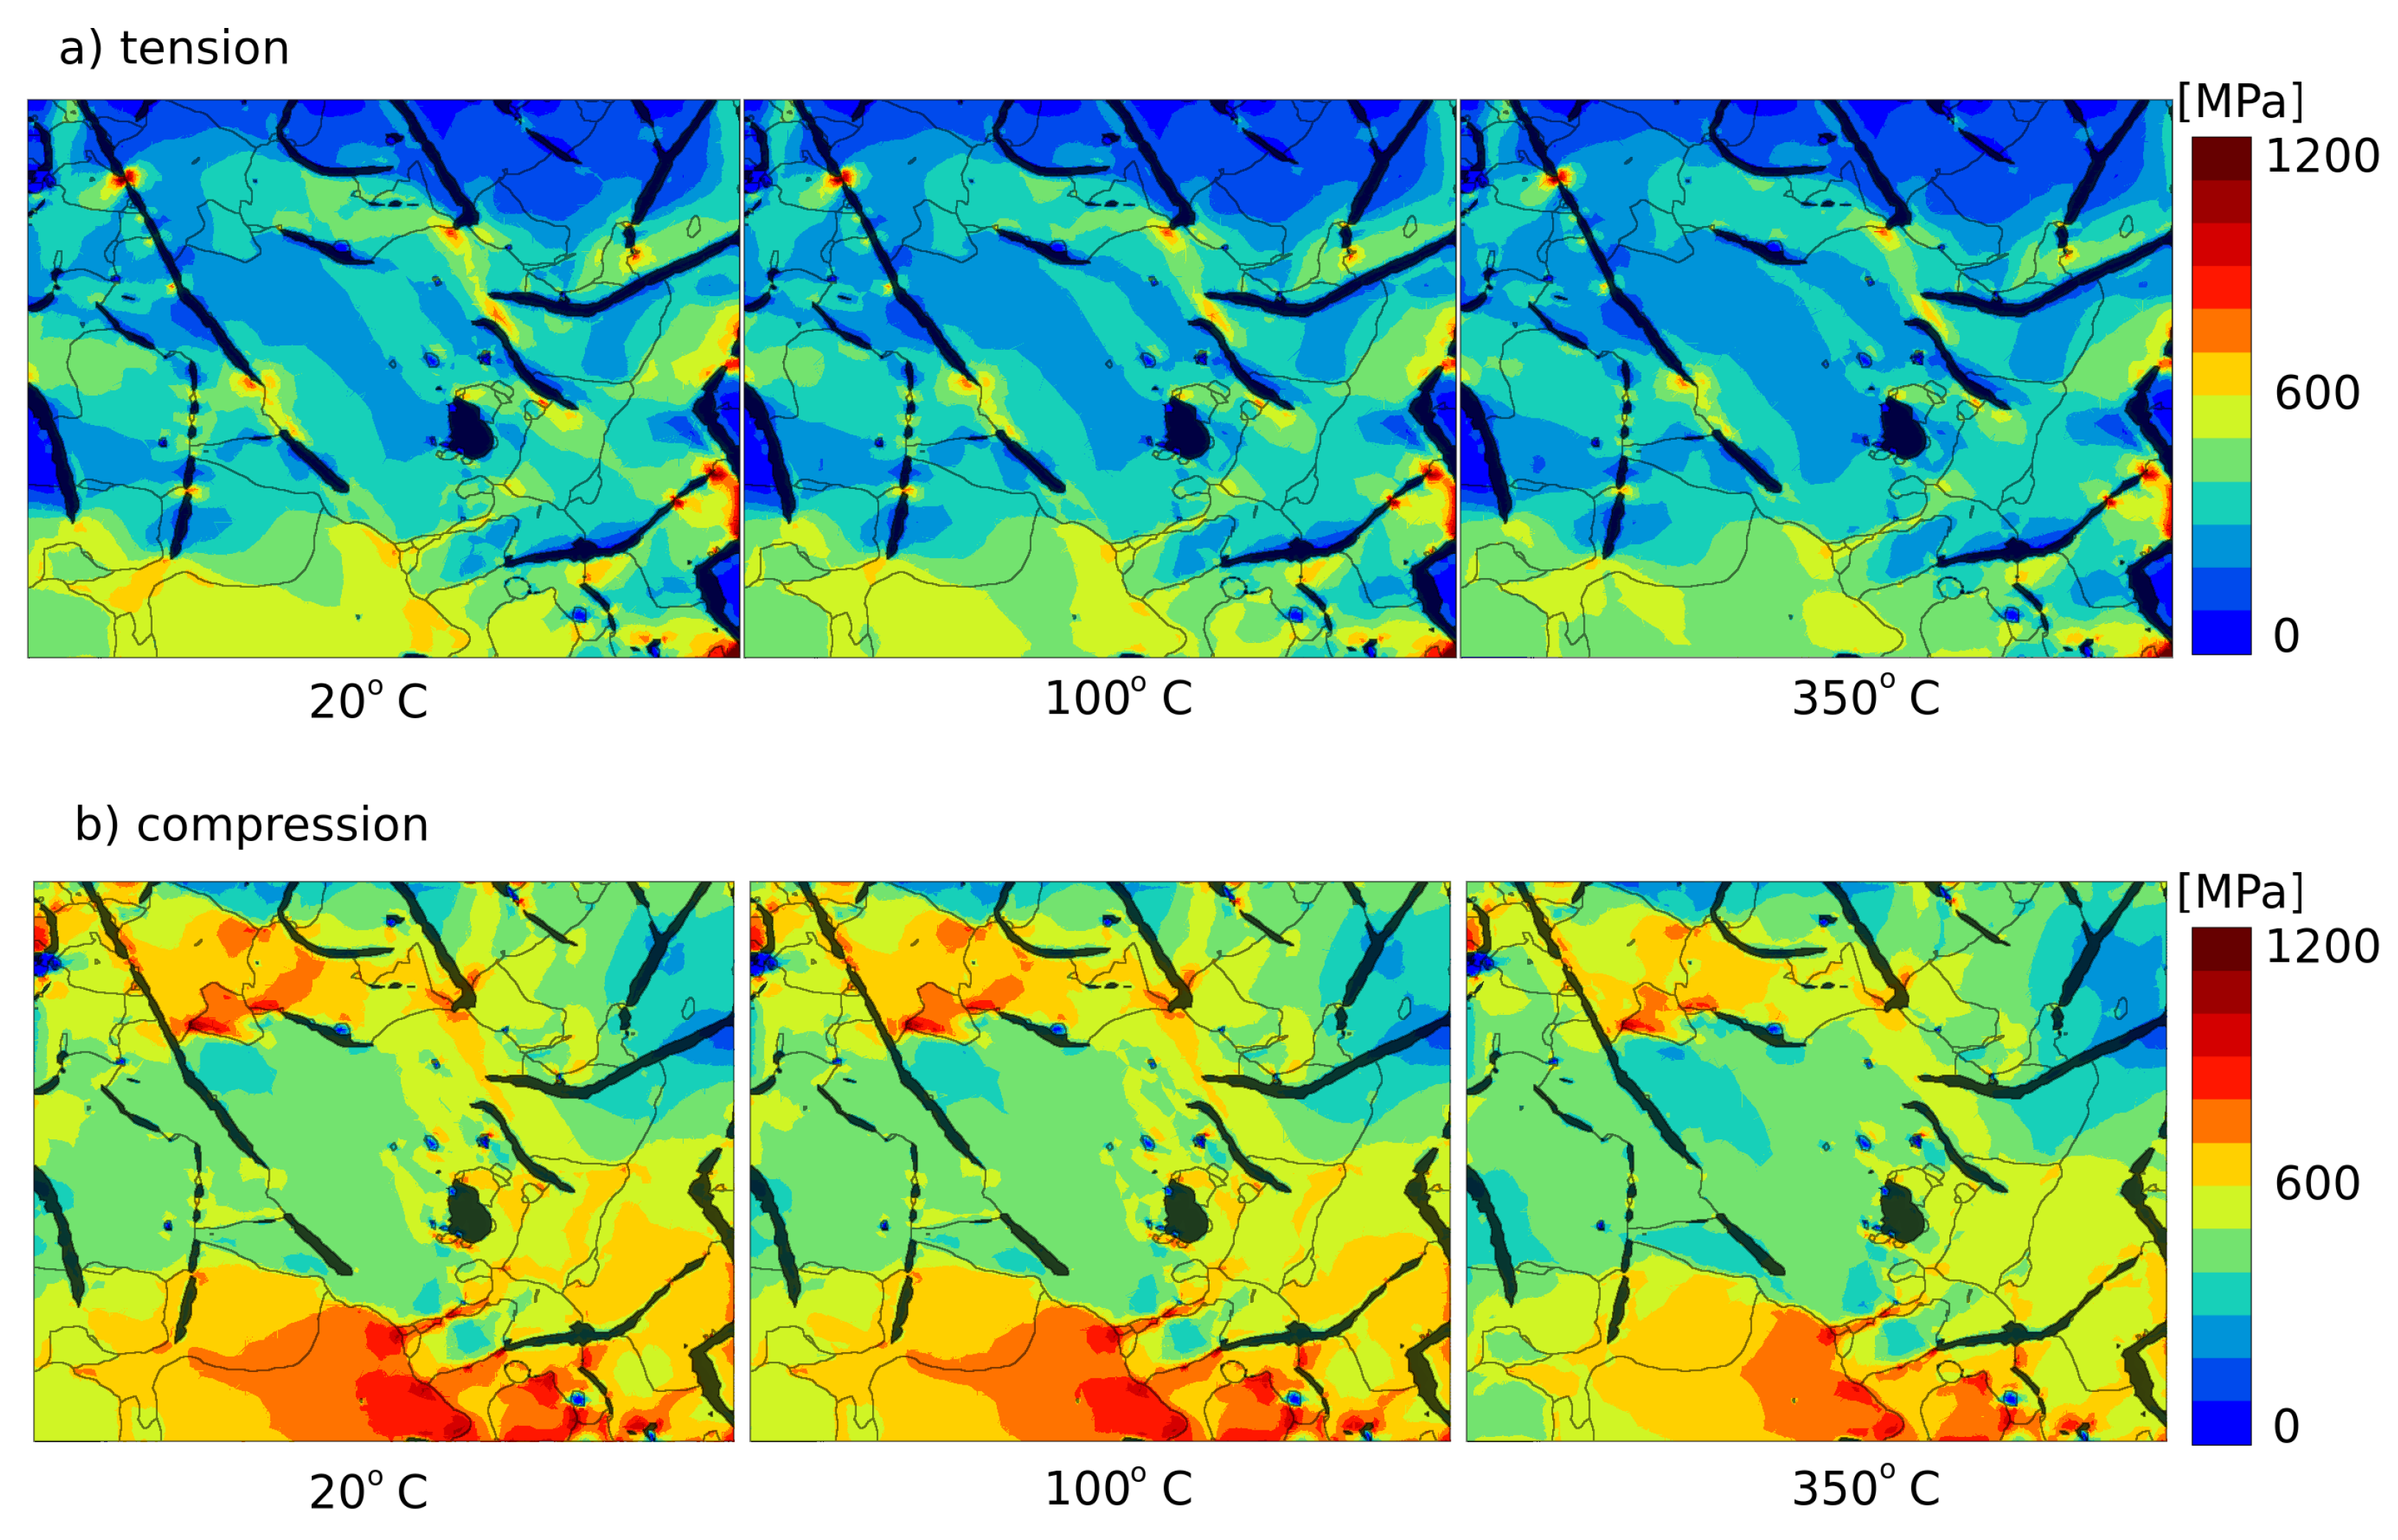
3.2. Model of Graphite

There are several approaches to modeling graphite material. Classically, graphite inclusions are treated as voids, and this assumption imposes critical limitations to the micromodel: it cannot, for example, take into account that the graphite nodules in ductile cast irons are nearly incompressible under hydrostatic pressure [28]. In [17], the graphite flake is considered as a graphene multilayer, i.e., an extremely anisotropic material with E a = 1020.4 GPa, E c = 36.36 GPa, ν a = 0.163 and ν a c = 0.012 (with “a” denoting the crystallographic direction within the basal planes of the layered structure and “c” the out-of-plane direction). At the same time, in [29], Young’s modulus of graphite nodules was calculated by means of statistical techniques (Oliver and Pharr method) and interpreted on the basis of the internal structure of the nodule. The resulting value is E = 16.2 ± 7.0 GPa, which agrees with the results from the literature observed in [29]. In [12], the different values in compression ( E c o m p = 7.0 GPa) and tension ( E t e n s = 0.3 GPa) are used, with a smooth transition between them.
In the present study, Young’s modulus in compression is assigned as E c o m p = 20.0 GPa, and in tension as E t e n s = 6.0 GPa, with a linear transition between them (Figure 8 left). In principle, slight changes in the elastic coefficients of graphite do not significantly affect the global response of cast iron to uniaxial loading. The difference can only be distinguished at large deformations, as shown in Figure 9. It should be noted that the strains are nonphysically high here for demonstration purposes only.
Investigations have shown that, in order to capture the experimentally observed effects, it is necessary to introduce plasticity into the material model of graphite (see Figure 10). The HCP crystal plasticity model described in Section 2.2 was used for this purpose. The graphite material parameters were obtained so that the behavior of the cast iron model fits as well as possible to the experimental results without drastic changes in the metal matrix parameters. The final set of values for tension-compression are listed in Table 2. Note that, for simplicity, in the numerical fatigue tests, only Young’s modulus is different in tension and compression, and the other parameters are constant and equal to their values in compression. This is justified by the small applied tensile strains (up to 0.05%; see Section 3.1). The same CP parameters were used for all families of slip systems (basal, prismatic and both pyramidal).
The resulting stress–strain curve is depicted in Figure 8 right. The curve was calculated with the use of Model 1, where every element is replaced by the same material with a different random orientation (the same was carried out for the metal matrix to obtain Figure 11). It can be seen that graphite is stiffer under compression, and that the yield stress value is much higher. In addition, in compression, there is a noticeable strain hardening observed, whereas in tension, a nearly ideal plasticity is reached right after the yield strength.

3.3. Model of Matrix Metal

In the scope of the present work, the detailed microstructure of the perlite (which includes ferrite and cementite) was neglected and the whole matrix, including both perlite and ferrite phases, was assumed for simplicity to be a homogenized BCC metal matrix phase (see Section 2.2). The temperature dependence was introduced into Young’s modulus E, the viscous parameter K and the initial shear resistance τ 0 by analogy with the approach used in [30]. Damage was introduced according to the theory described in Section 2.3. The damage parameters were identified on the basis of data from fatigue experiments described in more detail in Section 3.5. Table 3 lists the values of the parameters used in this work.
Figure 11 presents the resulting stress–strain curves for the metal matrix material at different temperatures.

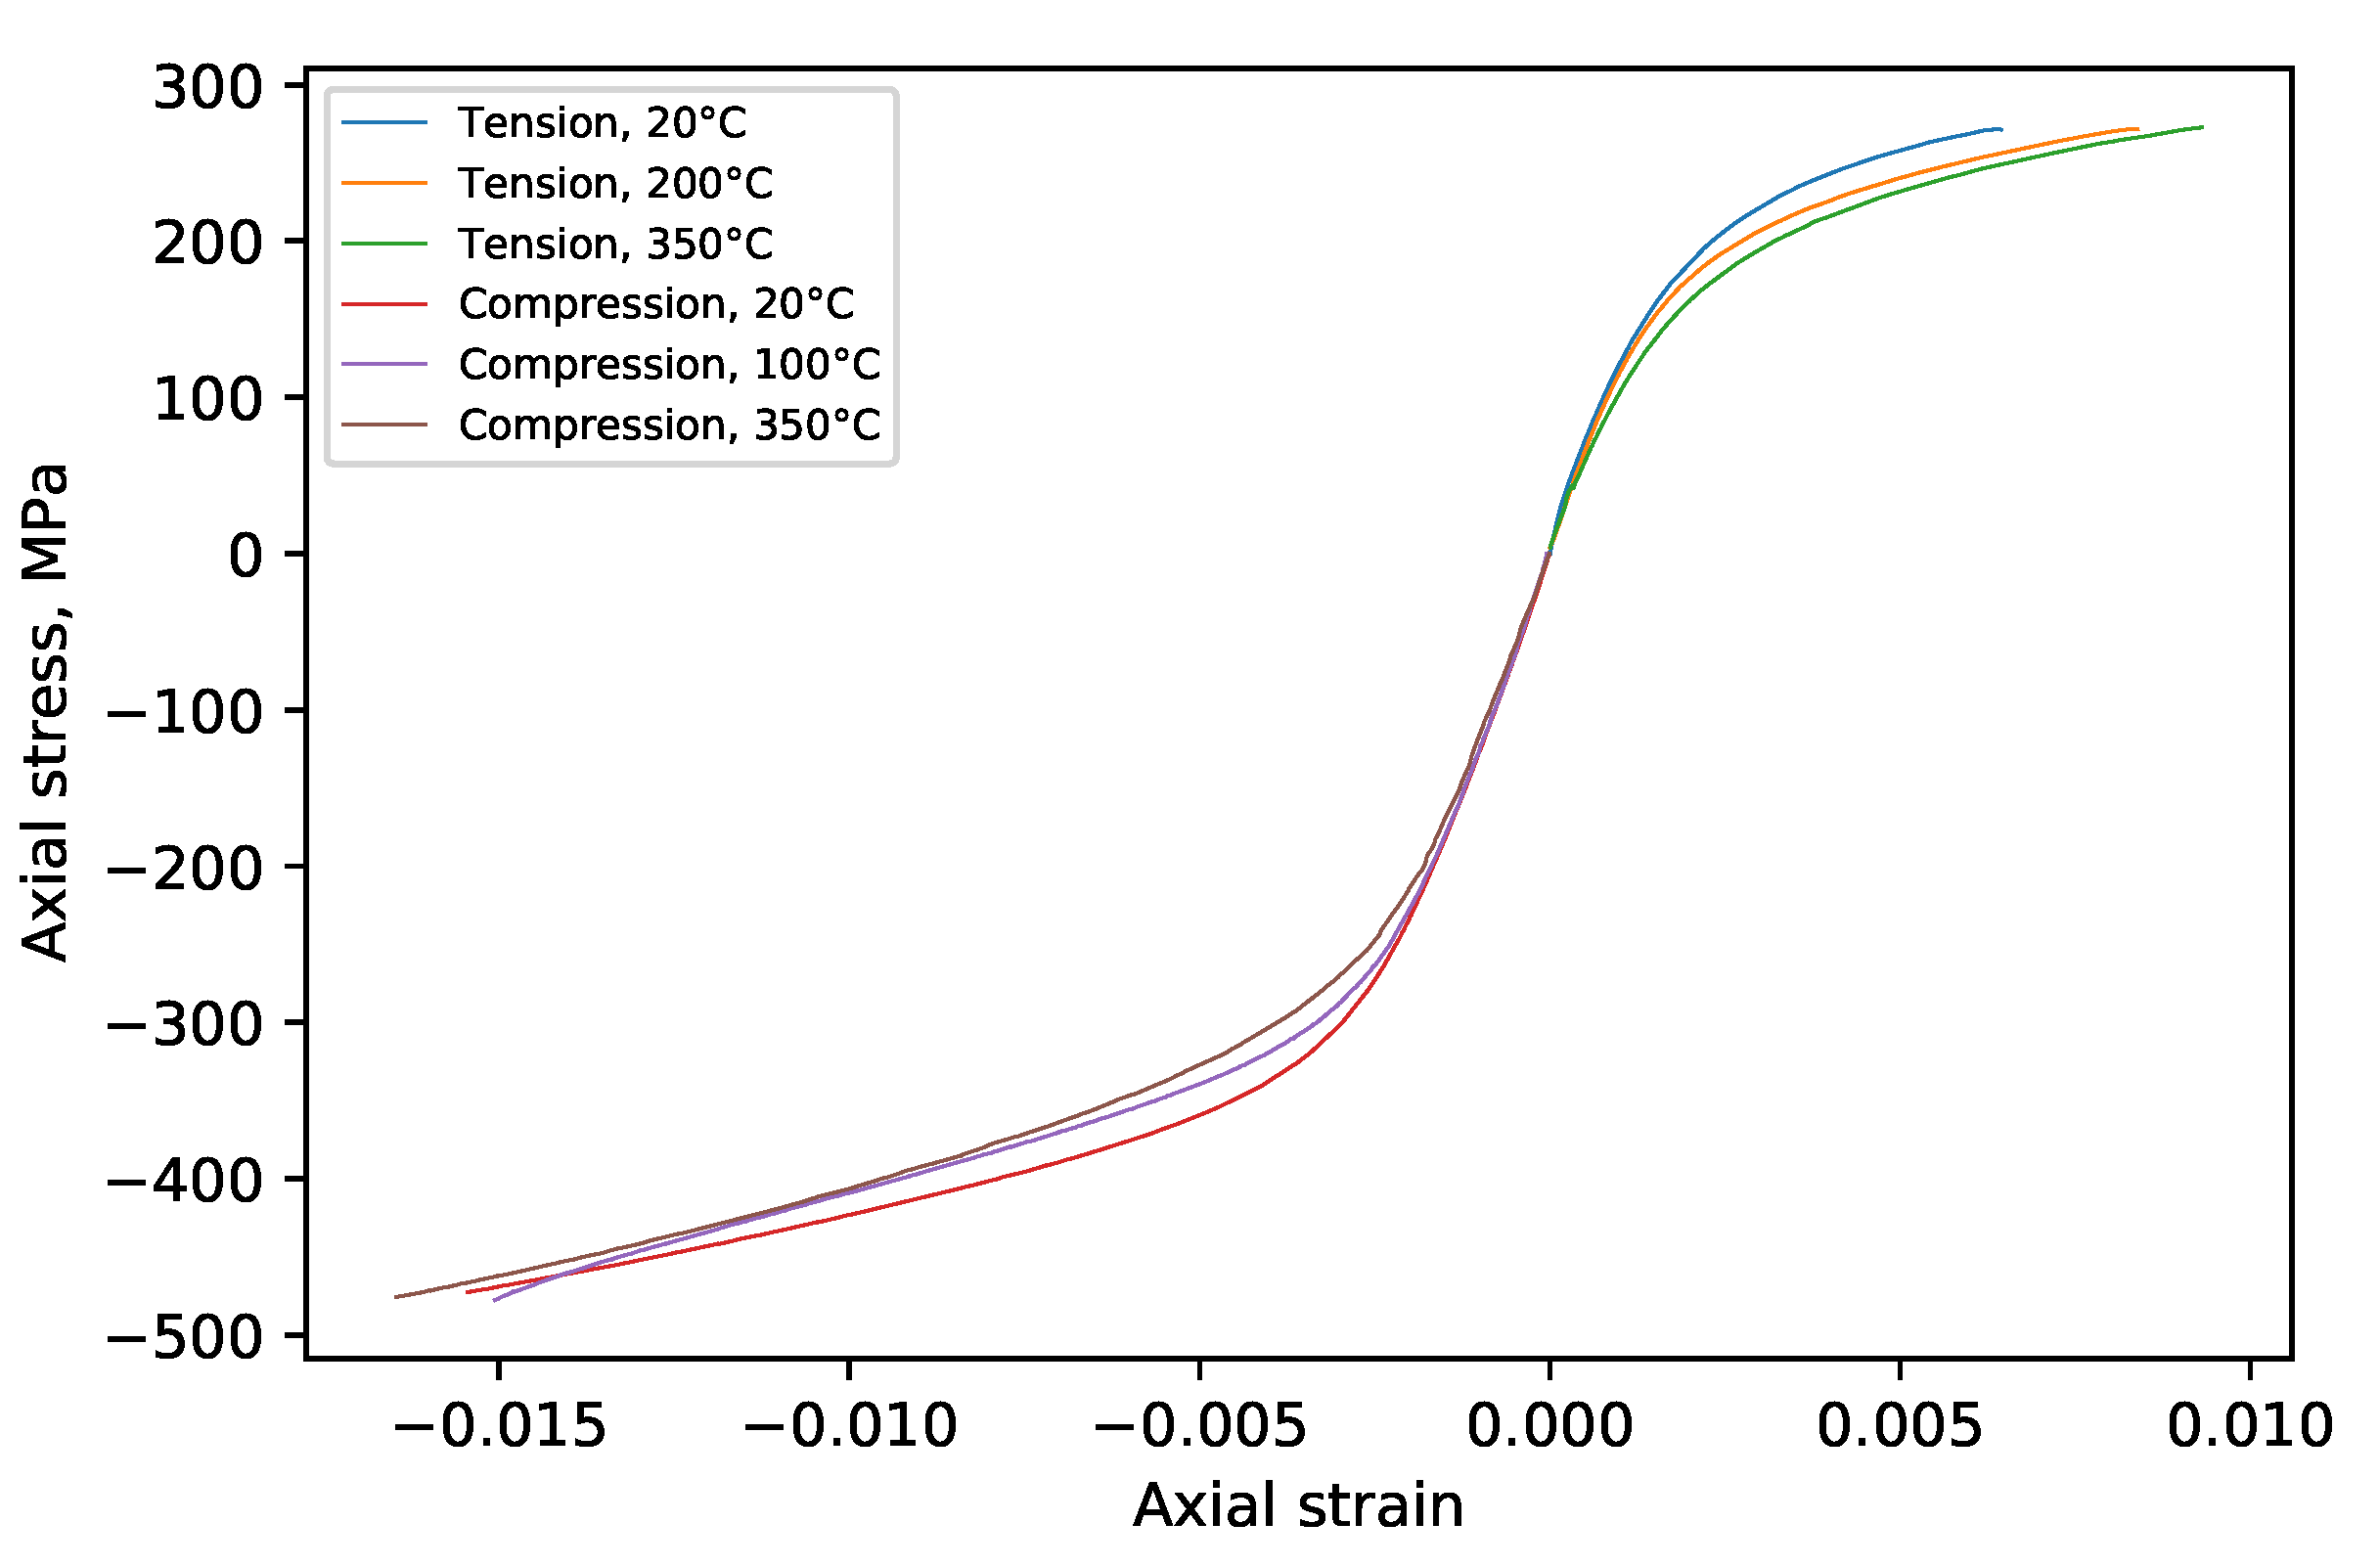
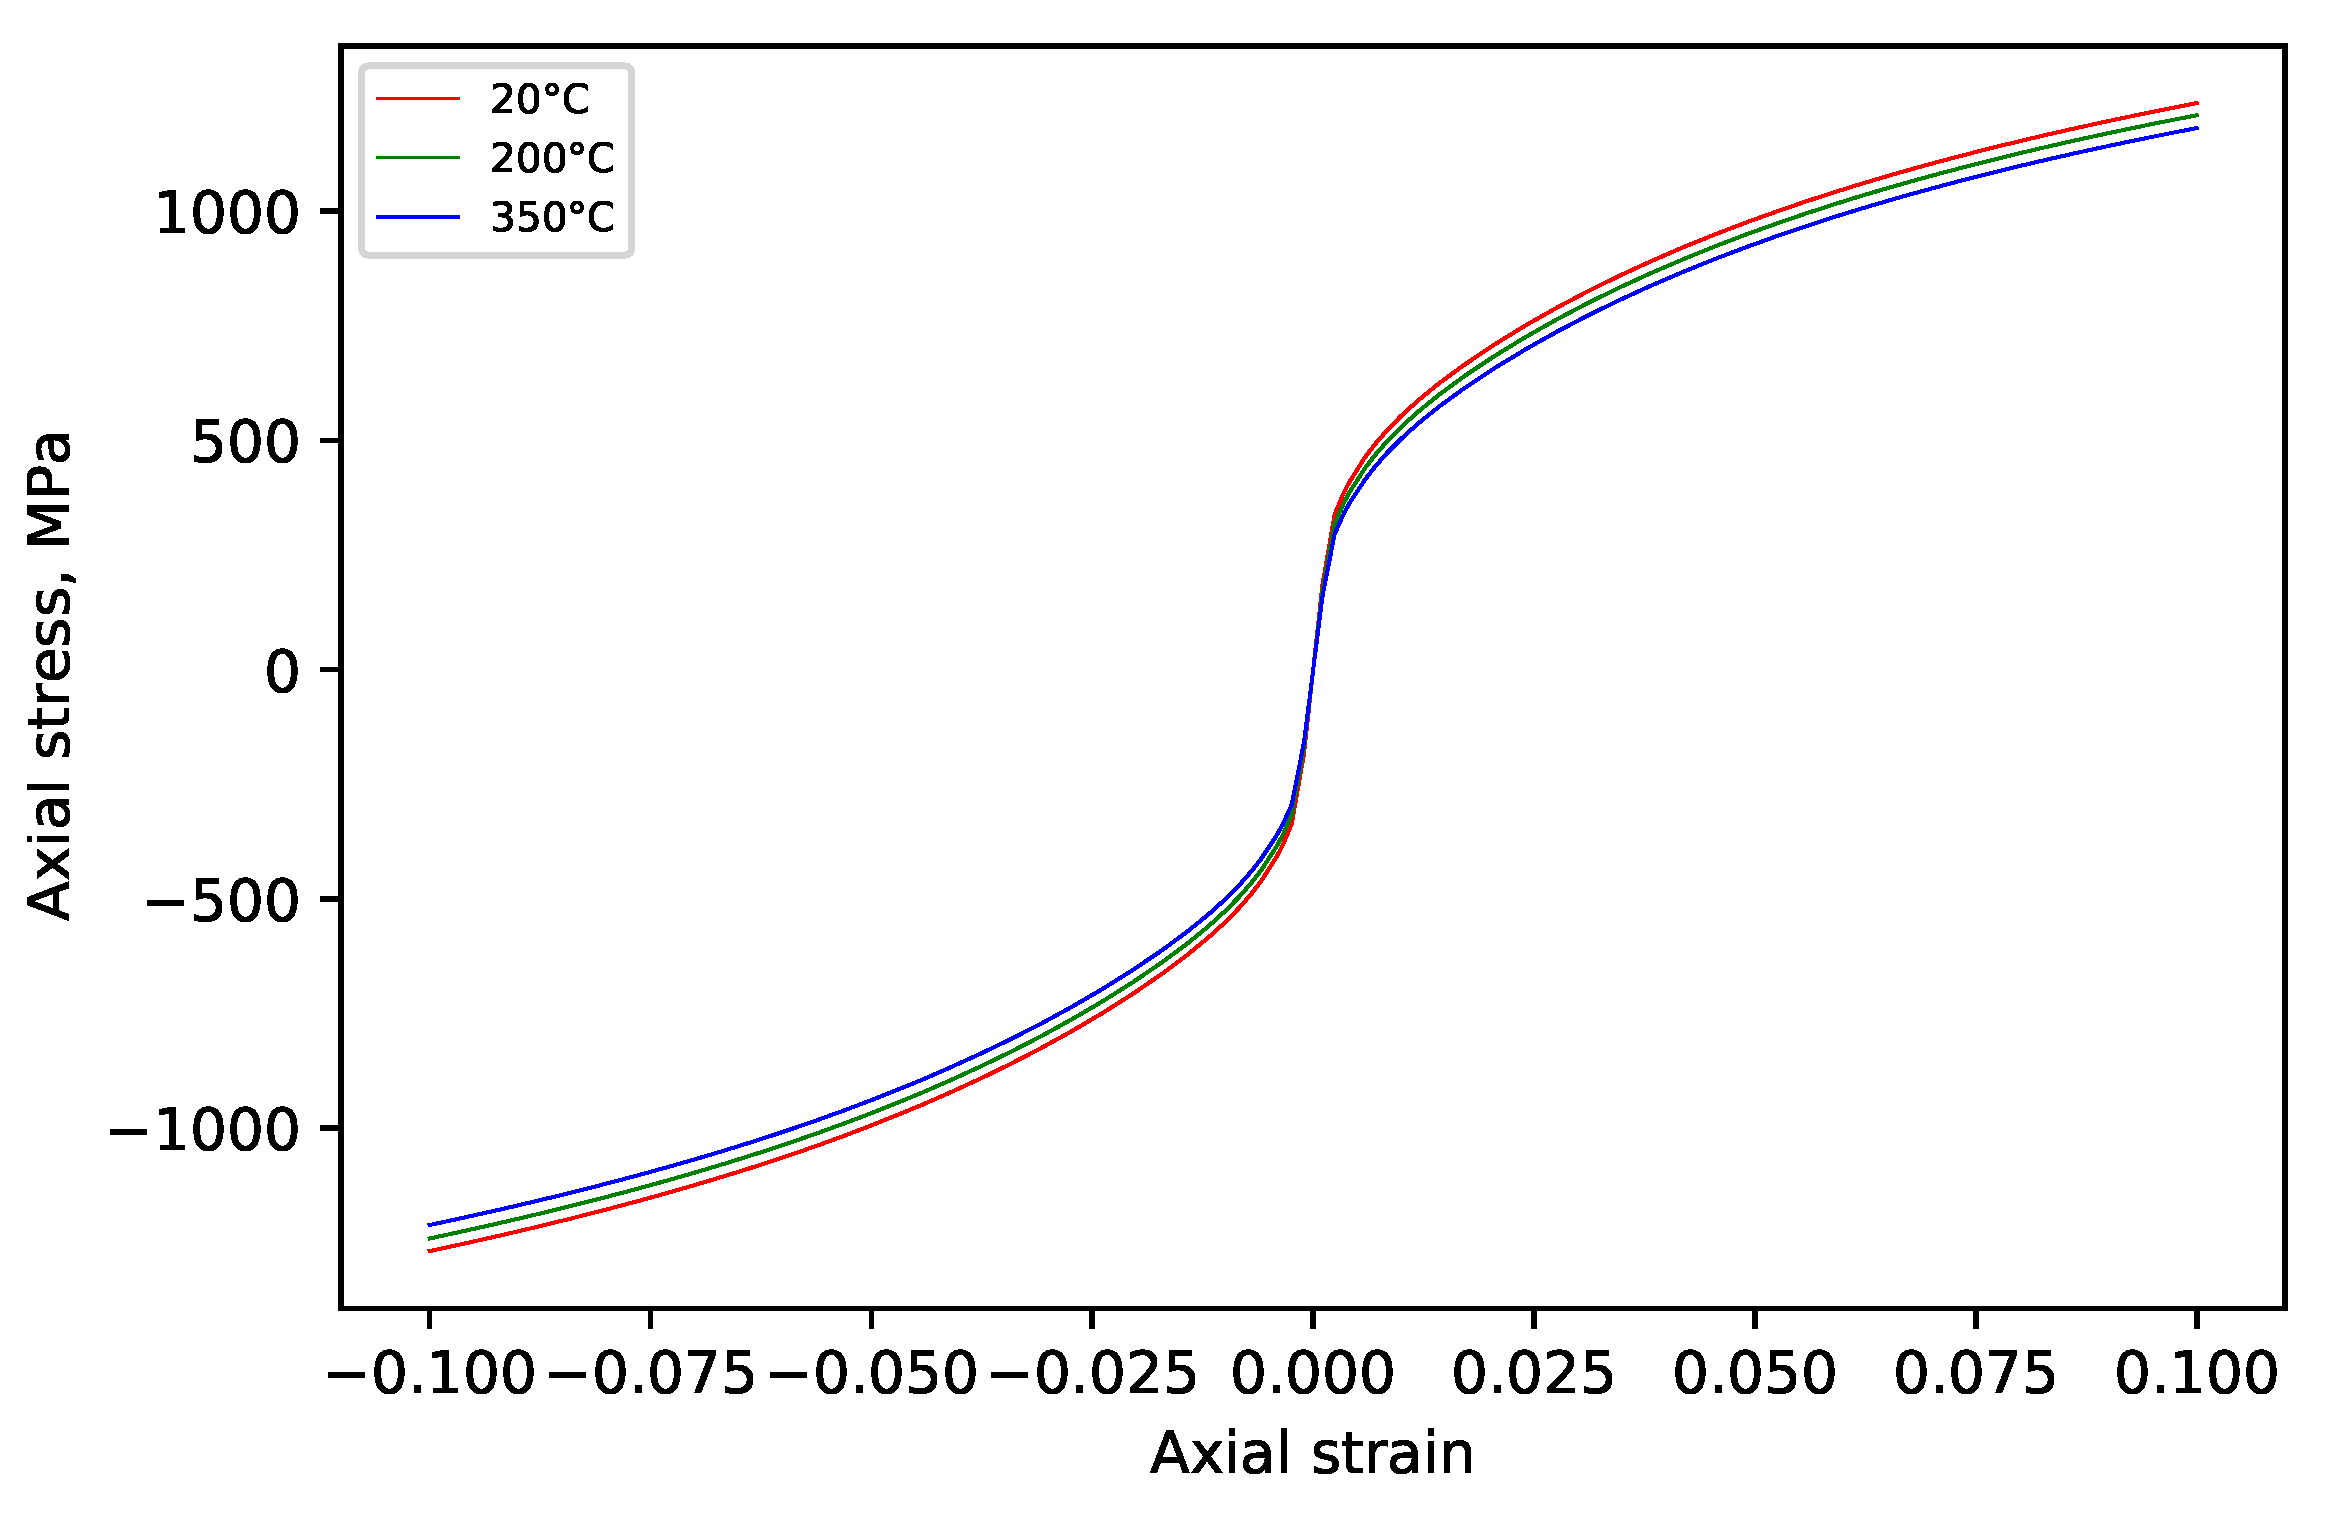
3.4. Stress–Strain Behavior of the Model in Tension and Compression at Different Temperatures

Figure 12 shows a comparison of the experimental and numerical stress–strain curves of grey cast iron subjected to uniaxial tension and compression. The simulations were performed using Model 3 and the material models described in Section 3.2 and Section 3.3. Stress–strain curves were produced by averaging over all finite elements of the microstructural mesh involving both metal and graphite phases.
It can be observed that, in both tension and compression, the simulations demonstrate a good correlation with the experimental data. As in the experiment, the material model shows a more distinct elastic region in compression and a higher absolute value of the yield strength, as well as the correct plastic hardening. The temperature dependence is also qualitatively well modeled, i.e., the material becomes softer with an increasing temperature.
The 1 24 part of Model 3 is used to plot von Mises stress distributions at the maximum global strain (0.92% for tension and 1.61% for compression) for different temperatures depicted in Figure 13. The dark areas indicate graphite inclusions and the dark lines indicate metal grain boundaries.
It can be seen that there is no drastic difference between the stress distributions for different temperatures. According to the stress–strain curves in Figure 12, the stress level decreases with an increasing temperature. Stress concentrations at the “tips” of the graphite flakes are very well distinguished in tension. In compression, the graphite inclusions do not appear as the main source of stress concentrations in the simulations, but, instead, the highest stresses are observed at grain triple points and also stem from the grain boundaries due to the soft/hard grain interactions.

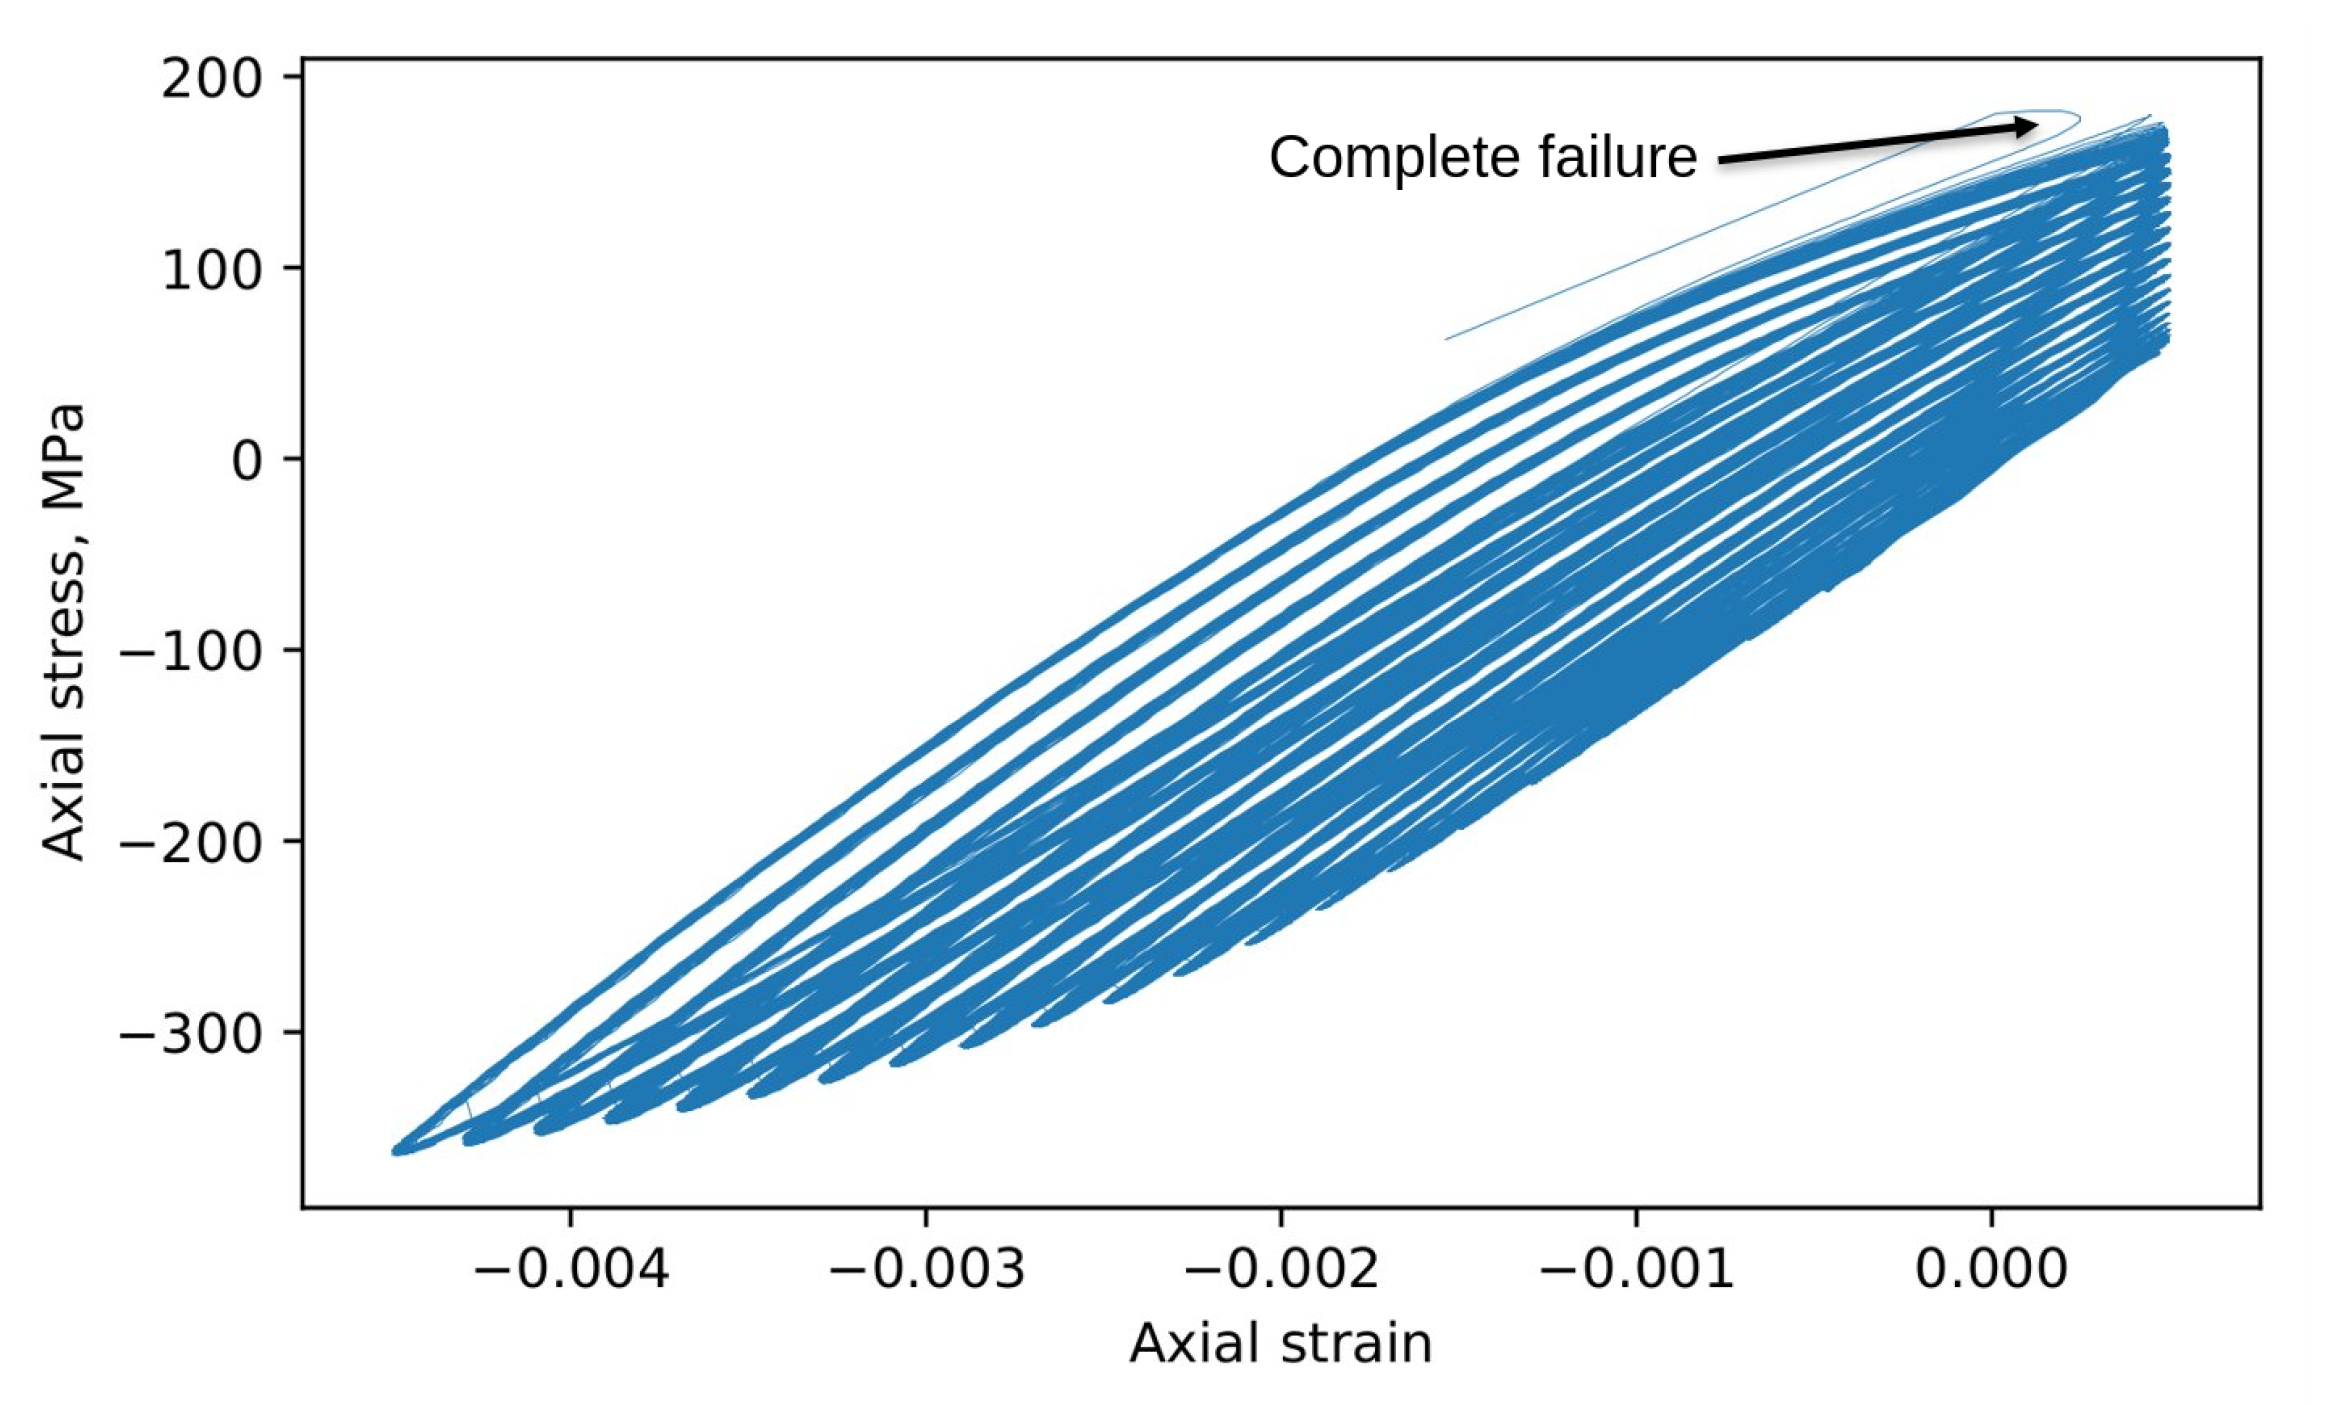
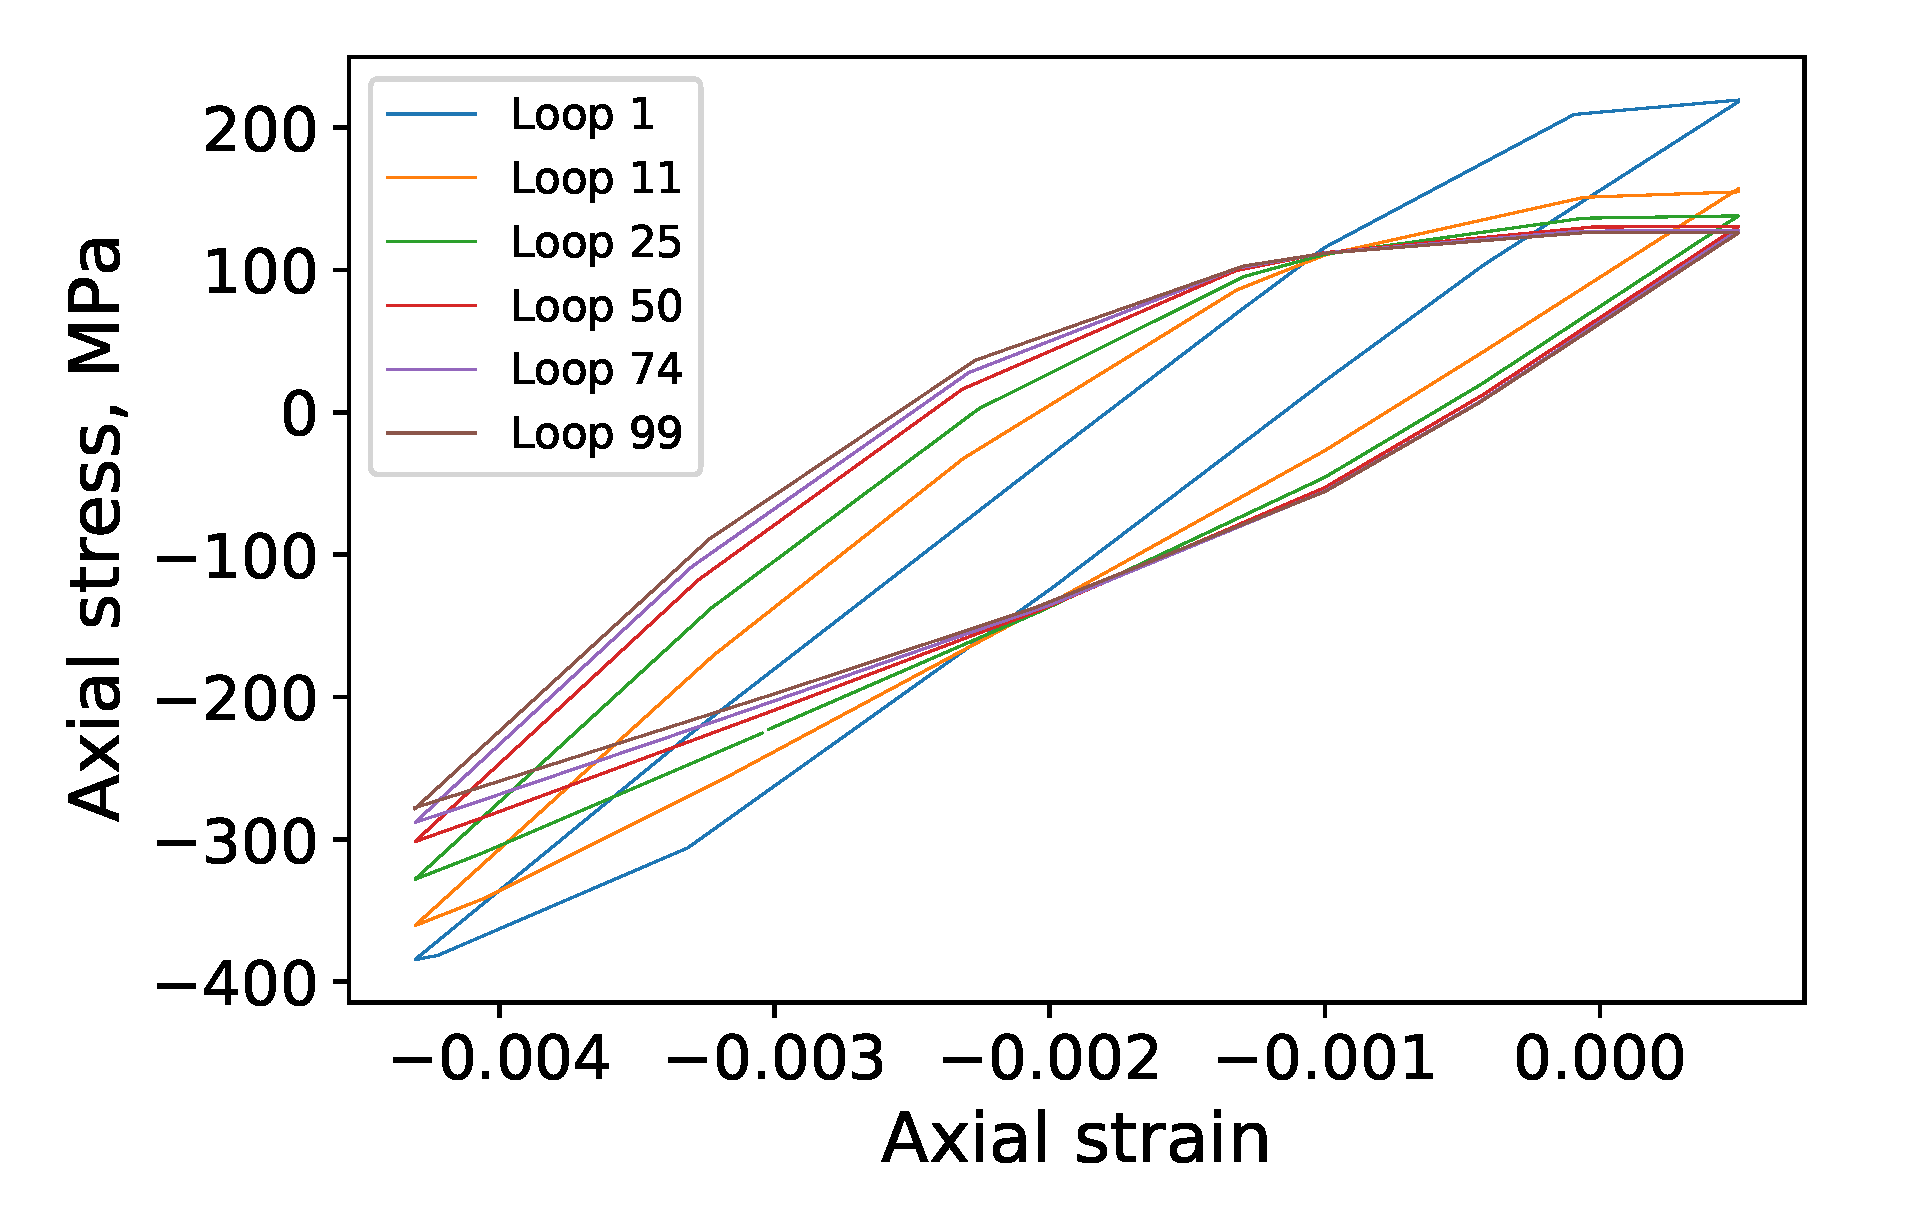
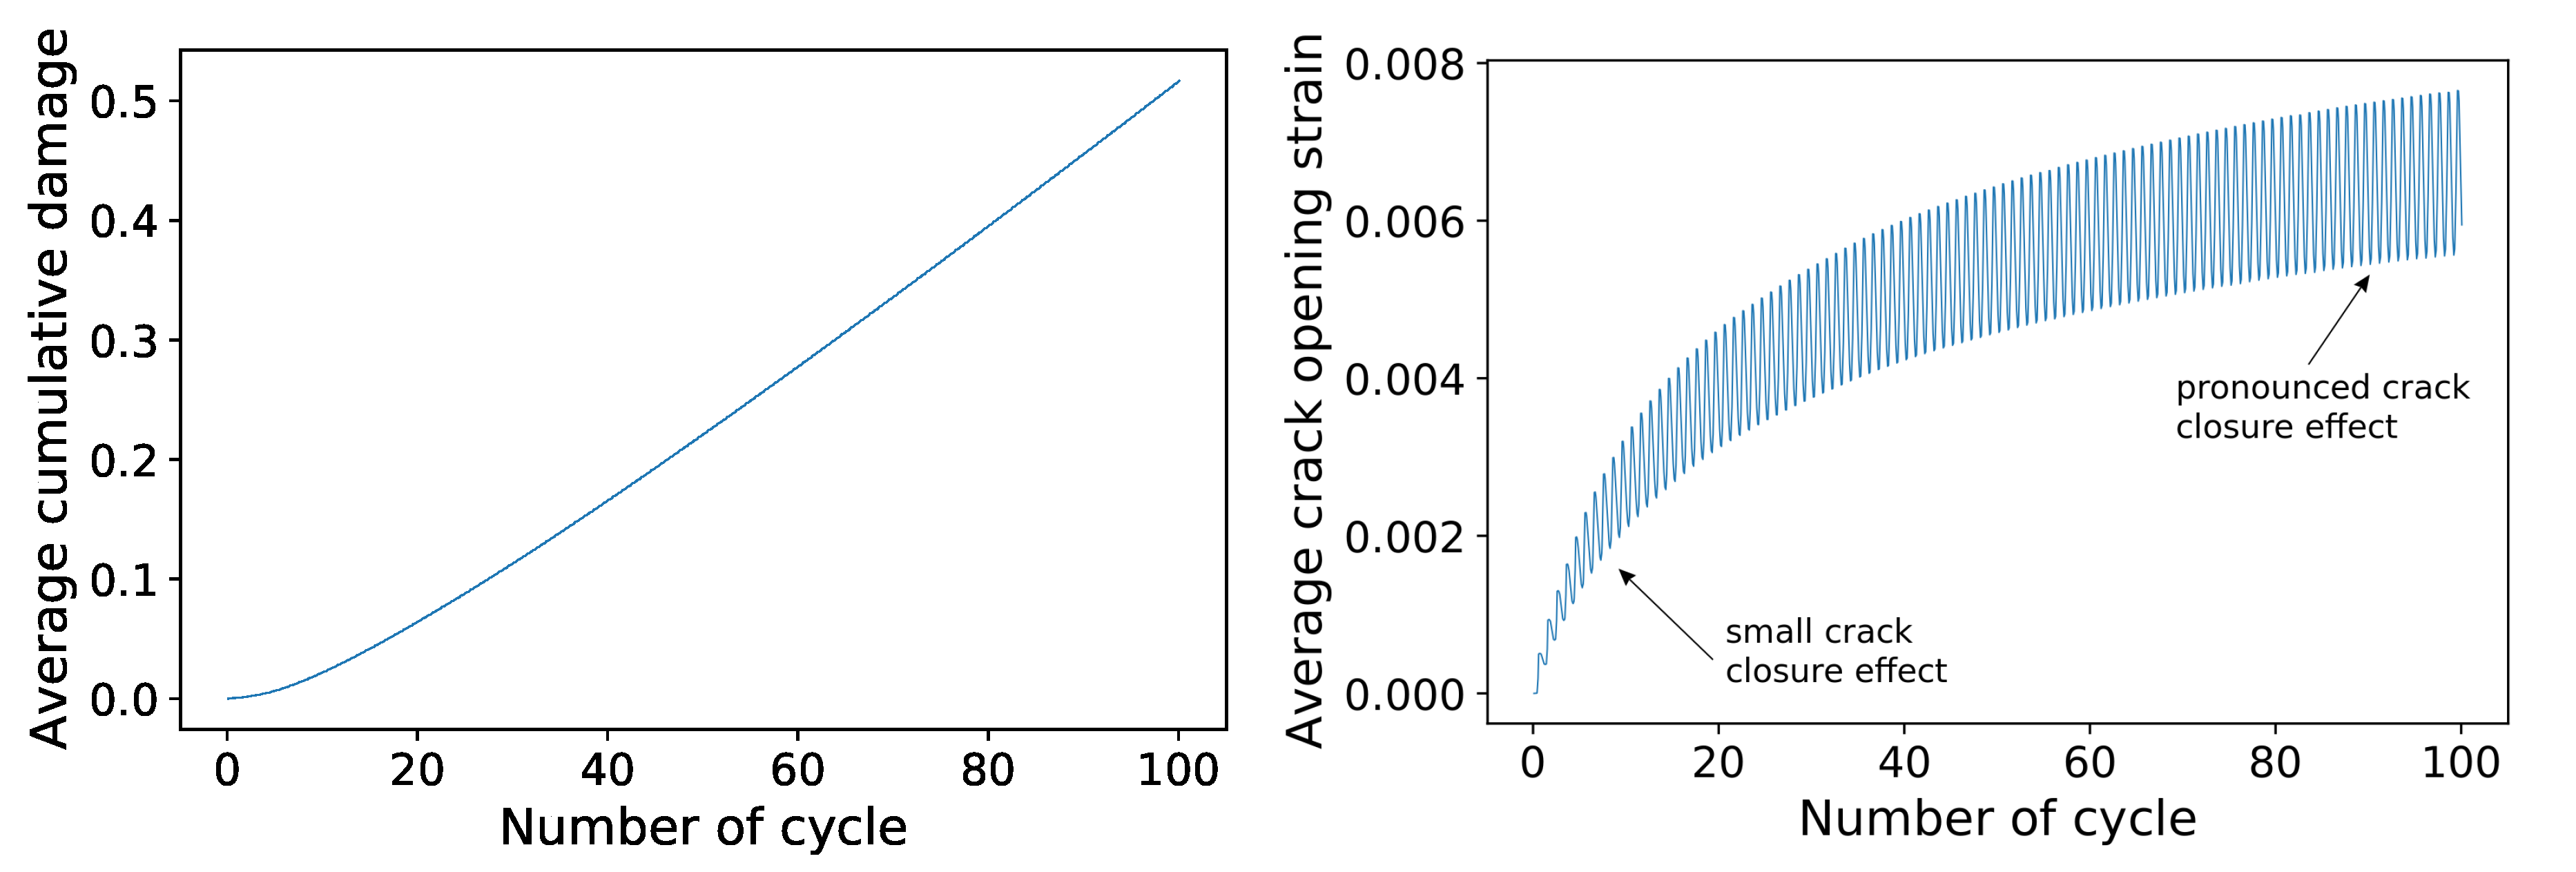
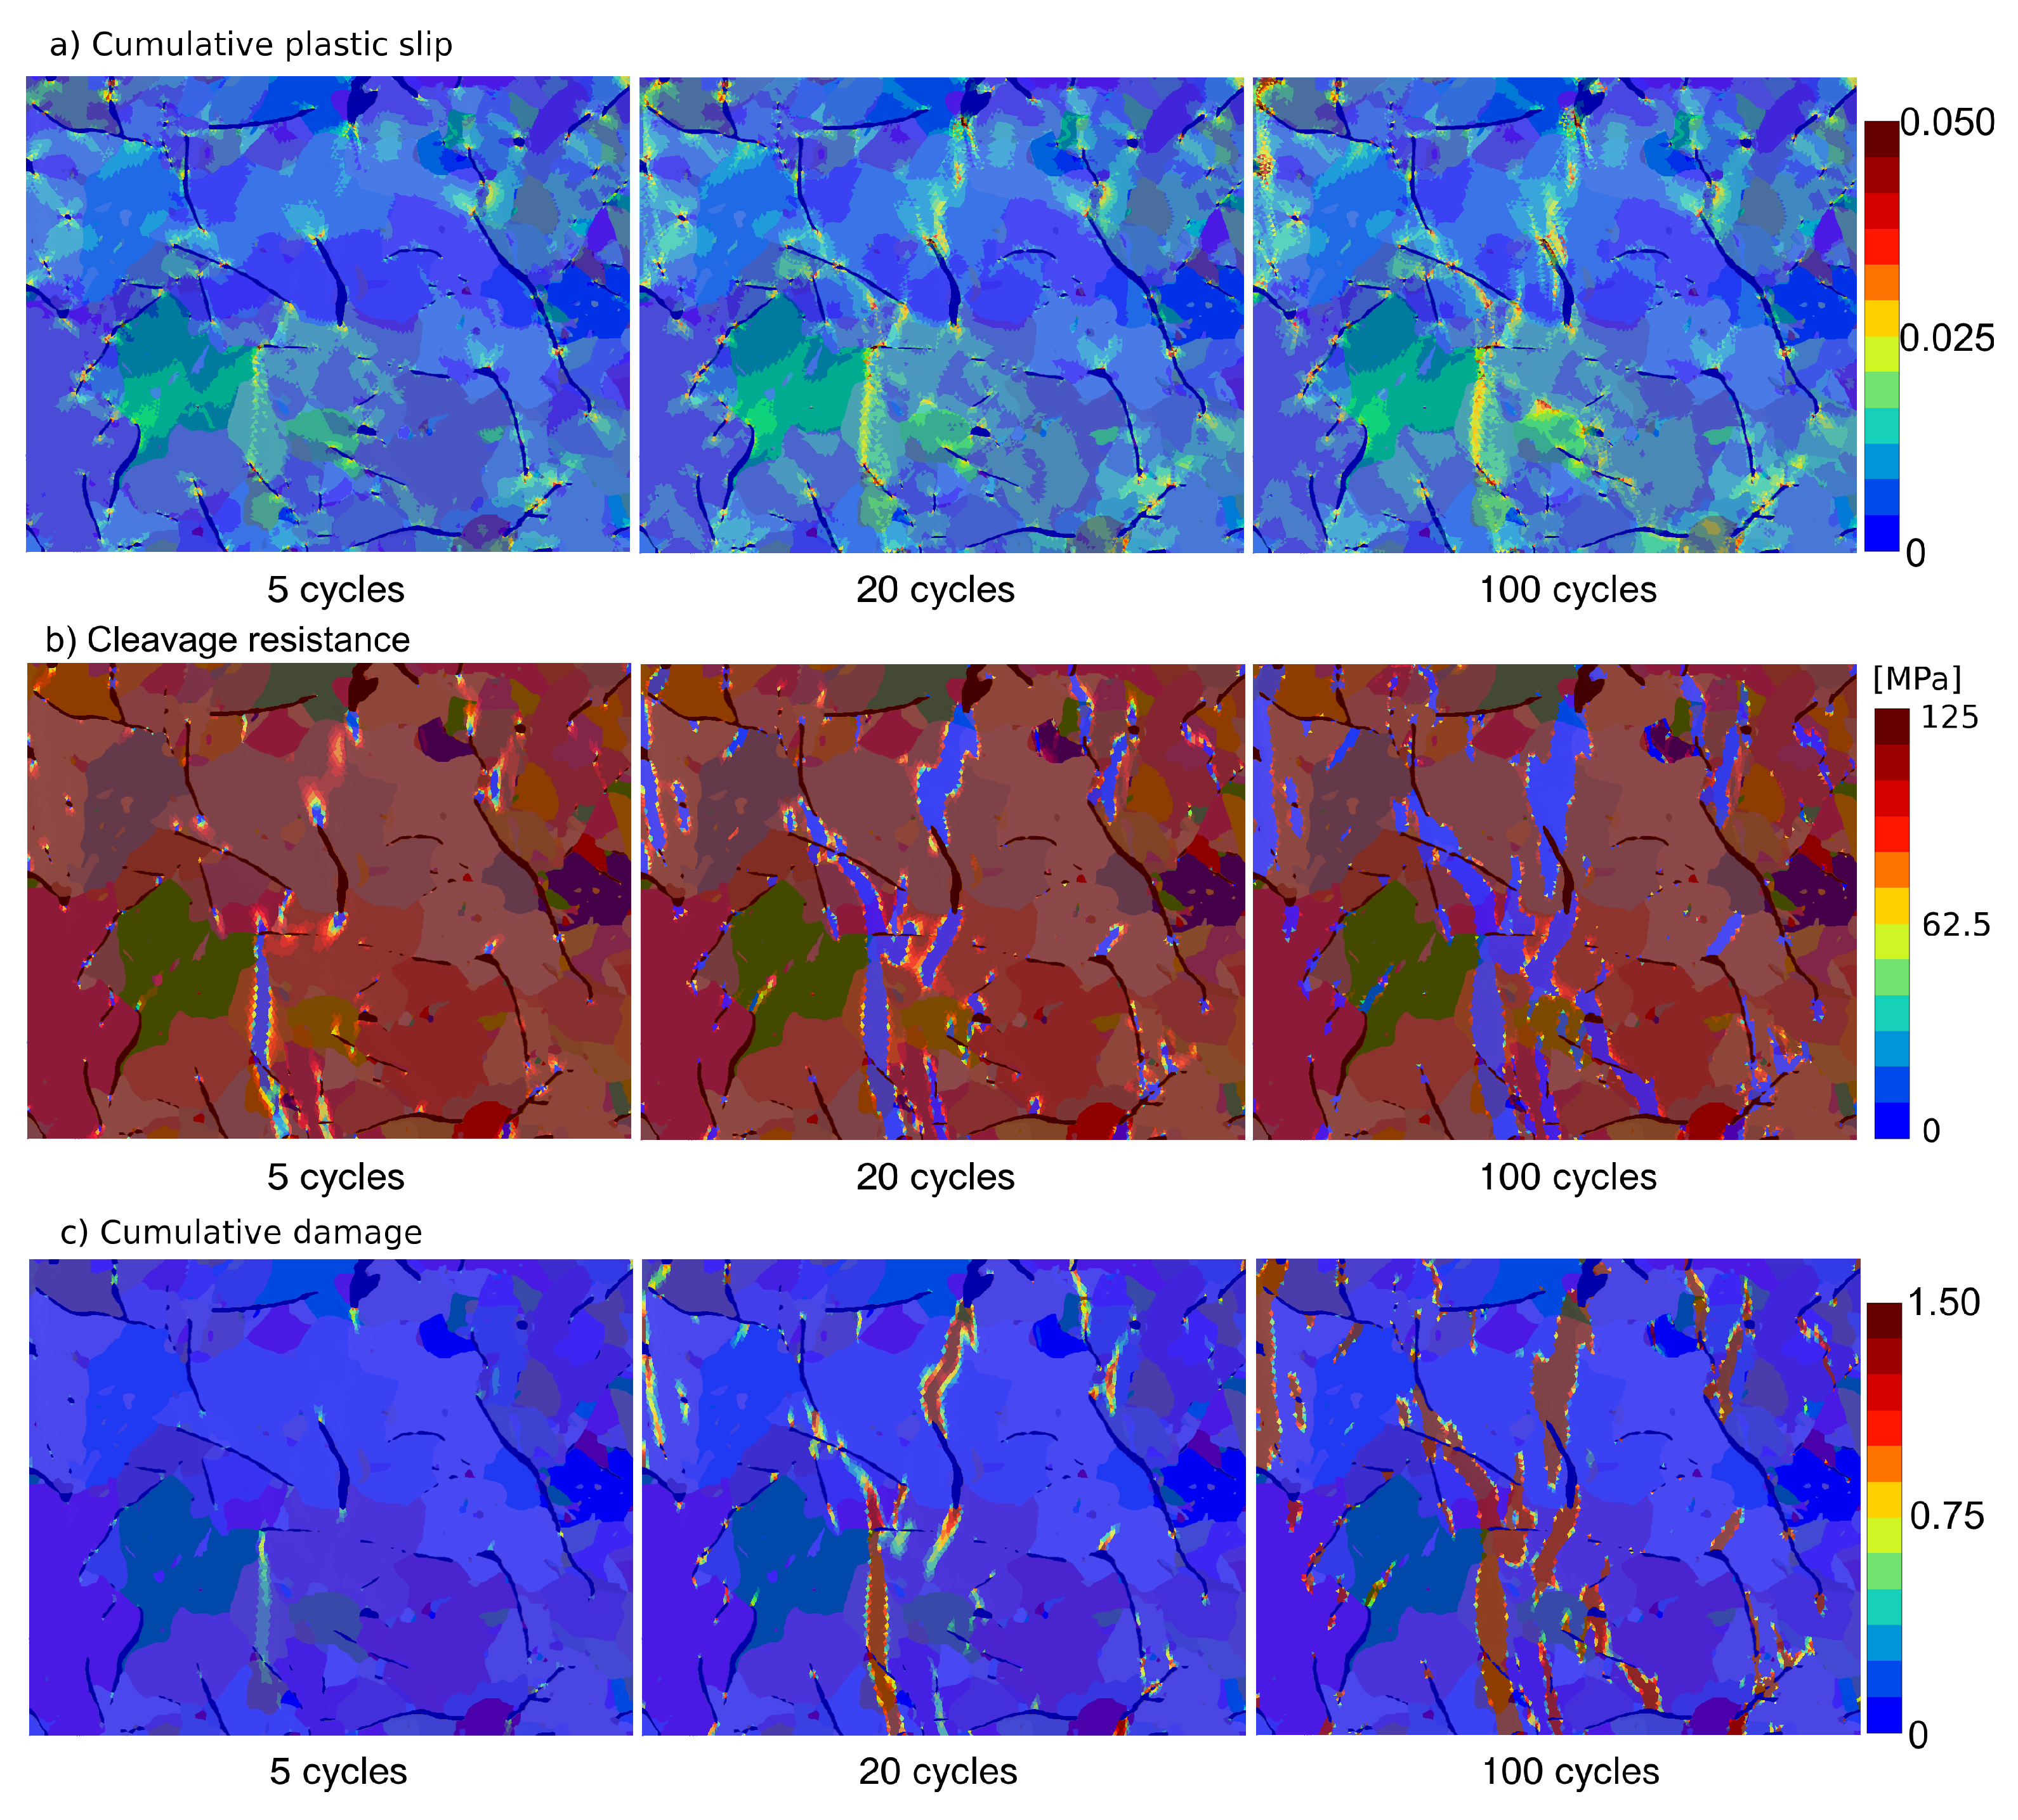
3.5. Fatigue Behavior of the Model

Observing and properly interpreting the effects at the microstructural level may play a key role in understanding and explaining fatigue damage. Since it is extremely difficult (or even impossible) to observe such effects experimentally, modeling becomes crucial.
Figure 14 shows a comparison of experimental and numerical stress–strain loops. As in the case of tension-compression, the numerical curves were obtained by averaging the results over all finite elements, involving both metal and graphite materials. Fatigue was simulated by sets of steadily increasing applied strains, as in the experiment described in Section 3.1, with the only difference being that, instead of 100 repetitions, only 3 are performed for each set. This simplification was made in order to decrease the simulation time and is considered sufficient to demonstrate the capability of the numerical model in capturing the experimentally observed effects.
For a more detailed comparison, one can address Figure 14 right, where the separate sets of loops are considered for convenience. The stress levels in the simulation and experiment are close, yet the numerical model has a slightly narrower hysteresis loop (this is especially pronounced for relatively small strain amplitudes, as for set 9). The asymmetry in tension and compression is quite well captured and especially emphasizes the observed critical softening in tension.
To study low-cycle fatigue, the maximum amplitude (last set number 20 from Figure 14 right) was used and repeated for 100 cycles. Figure 15 demonstrates softening and the effect of damage on hysteresis. Damage causes a noticeable softening in the stress–strain loops. It is especially noticeable at the beginning of the process and becomes less distinguishable with more cycles. This is because crack growth in the microstructure is limited by strain localization and crack opening in the damaged regions. After repeated opening–closing sequences, the material has a diminishing and small resistance against crack opening. However, the regions that are only partially damaged and can further exhibit plasticity and damage, or regions with non-opened cracks, still carry out resistance against deformation. Figure 16 shows the averaged cumulative damage d (see Equation (9)) and crack opening strain over the microstructure. A rather steady damage effect is observed as the number of loading cycles increases. The damage opening strain shows that the damage plane closure is ineffective in the early damage process. When more cycles are applied, a distinguishable saturation behavior is observed and the crack closure effect increases markedly, i.e., the average crack opening strain decreases more effectively during a tension–compression cycle. This implies that the existing crack is partially closed when loading is continued, which is also the cause of asymmetric stress–strain behavior. It should be noted that more extensive crack networks occur after more loading cycles, and therefore it is also more probably for individual cracked regions to close.
An illustration of plastic slip accumulation for different numbers of cycles is presented in Figure 17a. The simulation shows that strain localization precedes the damage initiation, and the effective cleavage resistance is reduced, as depicted in Figure 17b. Damage becomes very susceptible already at five cycles, and multiple damage sites are observed. An increase in the number of cycles leads to the formation of inter-grain damage networks, which dominate the degradation of material strength. The tips of graphite flakes are probable sites of damage accumulation; however, the simulation shows that selection of the primary cracks occur. Secondary damage sites contribute to the overall damage presence in the material, but some regions also show damage stalling. Cracks in the grain structure are occasionally observed to arrest at the graphite interface due to an absence of the damage model for the graphite itself. However, damage then begins to propagate along the interface region, accelerating the growth of the crack network that can be distinguished to mimic interface damage.

4. Conclusions

In the present work, the micromechanical modeling of grey cast irons was taken further by means of CP modeling: the material was simulated in tension and compression, as well as in fatigue. The specifics of the mechanical behavior of grey cast iron are taken into account at the microstructural level. This was accomplished with the aid of crystal plasticity models, which are applied to both metal crystals and graphite inclusions. Furthermore, a crystal level damage model was proposed to account for the complex anistropy associated with the strength degradation of materials. The following conclusions can be drawn on the present modeling results:
  • Crystal plasticity microstructural models with a damage model involved are able to capture some of the main material response features observed in the experiment, such as asymmetry of the behavior in tension and compression, tensile softening in fatigue tests and temperature dependence. In addition, it is important to include plasticity properties for graphite to capture the experimental results (not only elastic, and it can be strongly argued that they cannot be modelled by voids, as can be found in the literature);
  • Qualitative studies were performed to demonstrate the ability of the model to simulate experimentally observed effects. A further refinement of the model parameters can be achieved; however, this requires more extensive experimental data, as well as revealing the underlying damage phenomena and plasticity–damage couplings. This is evident in the present work, since damage was introduced into the model mainly for the proper modeling softening behavior. Thus, further work is required to gain proper confidence in fatigue modeling based on the model with micromechanical damage, especially in terms of the choice of parameters;
  • Utilization of different representations of polycrystalline and phase structures at the microscale allows for the investigation of fine-scale mechanical behavior. The use of EBSD-based computational domains allows for the analysis of general microstructural characteristics and damage progression. However, a fully discretized 3D microstructure with tomography data would contribute to an understanding of the influence of graphite networks, grain structure and local defects (e.g., voids), which will ultimately allow for the tailoring of better cast iron microstructures, depending on the specific performance and cost requirements of the material.

Author Contributions

Conceptualization, A.L.; Data curation, M.L. and T.A.; Formal analysis, V.B. and M.L.; Funding acquisition, T.A. and A.L.; Investigation, V.B.; Methodology, V.B. and A.L.; Project administration, T.A.; Resources, A.L.; Software, M.L.; Supervision, A.L.; Validation, V.B.; Visualization, V.B.; Writing—original draft, V.B. and M.L.; Writing—review & editing, V.B., M.L., T.A. and A.L. All authors have read and agreed to the published version of the manuscript.

Funding

The authors were supported by Business Finland in the form of research project ISA VTT Dnro 7980/31/2018.

Data Availability Statement

Not applicable.

Conflicts of Interest

The authors declare no conflict of interest.

Abbreviations

The following abbreviations are used in this manuscript:
BCCBody-Centered Cubic (crystal system)
CPCrystal Plasticity
EBSDElectron Backscatter Diffraction
HCPHexagonal Close Packed (crystal system)
FEMFinite Element Method
FIBFocused Ion Beam
SEMScanning Electron Microscope

References

  1. Riposan, I.; Chisamera, M.; Stan, S. Special Report CHINA FOUNDRY New developments in high quality grey cast irons. China Foundry 2014, 11, 351–364. [Google Scholar]
  2. Downing, S.D.; Socie, D.F. Stress/strain simulation model for grey cast iron. Int. J. Fatigue 1982, 4, 143–148. [Google Scholar] [CrossRef]
  3. Wiese, J.W.; Dantzig, J.A. Modeling stress development during the solidification of gray iron castings. Metall. Trans. A 1990, 21, 489–497. [Google Scholar] [CrossRef]
  4. Josefson, B.L.; Hjelm, H.E. Modelling Elastoplastic Deformations in Grey Cast Iron. In Low Cycle Fatigue and Elasto-Plastic Behaviour of Materials—3; Rie, K.T., Grünling, H.W., König, G., Neumann, P., Nowack, H., Schwalbe, K.H., Seeger, T., Eds.; Springer: Dordrecht, The Netherlands, 1992; pp. 465–472. [Google Scholar] [CrossRef]
  5. Hjelm, H.E. Yield Surface for Grey Cast Iron Under Biaxial Stress. J. Eng. Mater. Technol. 1994, 116, 148–154. [Google Scholar] [CrossRef]
  6. Altenbach, H.; Stoychev, G.B.; Tushtev, K.N. On elastoplastic deformation of grey cast iron. Int. J. Plast. 2001, 17, 719–736. [Google Scholar] [CrossRef]
  7. Seifert, T.; Riedel, H. Mechanism-based thermomechanical fatigue life prediction of cast iron. Part I: Models. Int. J. Fatigue 2010, 32, 1358–1367. [Google Scholar] [CrossRef]
  8. Manual, A.U. Abaqus User’s Manual, Version 2020; Dassault Systèmes Simulia Corp.: Johnston, RI, USA, 2020. [Google Scholar]
  9. Hosseini, E.; Holdsworth, S.R.; Flueeler, U. A temperature-dependent asymmetric constitutive model for cast irons under cyclic loading conditions. J. Strain Anal. Eng. Des. 2017, 53, 106–114. [Google Scholar] [CrossRef]
  10. Norman, V.; Calmunger, M. On the micro- and macroscopic elastoplastic deformation behaviour of cast iron when subjected to cyclic loading. Int. J. Plast. 2019, 115, 200–215. [Google Scholar] [CrossRef]
  11. Oksanen, V.; Valtonen, K.; Andersson, P.; Vaajoki, A.; Laukkanen, A.; Holmberg, K.; Kuokkala, V. Comparison of laboratory rolling–Sliding wear tests with in-service wear of nodular cast iron rollers against wire ropes. Wear 2015, 340–341, 73–81, Papers from the NORDTRIB 2014 conference co-edited by Prof. Ion Marius Sivebæk and Lars Pleth Nielsen. [Google Scholar] [CrossRef]
  12. Metzger, M.; Seifert, T. Computational assessment of the microstructure-dependent plasticity of lamellar gray cast iron—Part I: Methods and microstructure-based models. Int. J. Solids Struct. 2015, 66, 184–193. [Google Scholar] [CrossRef]
  13. Metzger, M.; Seifert, T. Computational assessment of the microstructure-dependent plasticity of lamellar gray cast iron—Part II: Initial yield surfaces and directions. Int. J. Solids Struct. 2015, 66, 194–206. [Google Scholar] [CrossRef]
  14. Metzger, M.; Seifert, T. Computational assessment of the microstructure-dependent plasticity of lamellar gray cast iron—Part III: A new yield function derived from microstructure-based models. Int. J. Solids Struct. 2016, 87, 102–109. [Google Scholar] [CrossRef]
  15. Metzger, M.; Seifert, T. Computational assessment of the microstructure-dependent plasticity of lamellar gray cast iron—Part IV: Assessment of the yield surface after plastic loading. Int. J. Solids Struct. 2018, 141–142, 173–182. [Google Scholar] [CrossRef]
  16. Pina, J.; Kouznetsova, V.; Geers, M. Thermo-mechanical analyses of heterogeneous materials with a strongly anisotropic phase: The case of cast iron. Int. J. Solids Struct. 2015, 63, 153–166. [Google Scholar] [CrossRef]
  17. Pina, J.; Shafqat, S.; Kouznetsova, V.; Hoefnagels, J.; Geers, M. Microstructural study of the mechanical response of compacted graphite iron: An experimental and numerical approach. Mater. Sci. Eng. A 2016, 658, 439–449. [Google Scholar] [CrossRef]
  18. Besson, J.; Foerch, R. Object-oriented programming applied to the finite element method part I. general concepts. Rev. Eur. Des Eléments Finis 1998, 7, 535–566. [Google Scholar] [CrossRef]
  19. Méric, L.; Cailletaud, G. Single crystal modeling for structural calculations. Part 1—Model presentation. J. Eng. Mater. Technol 1991, 113, 162–170. [Google Scholar] [CrossRef]
  20. Zhang, X.; Qu, Y.; Li, R. Fracture Mechanism of Ferritic Ductile Iron under Instrumented Impact Load at Low Temperatures. ISIJ Int. 2014, 54, 2309–2313. [Google Scholar] [CrossRef] [Green Version]
  21. Aslan, O.; Cordero, N.; Gaubert, A.; Forest, S. Micromorphic approach to single crystal plasticity and damage. Int. J. Eng. Sci. 2011, 49, 1311–1325. [Google Scholar] [CrossRef]
  22. Aslan, O.; Quilici, S.; Forest, S. Numerical modeling of fatigue crack growth in single crystals based on microdamage theory. Int. J. Damage Mech. 2011, 20, 681–705. [Google Scholar] [CrossRef]
  23. Sabnis, P.; Forest, S.; Cormier, J. Microdamage modelling of crack initiation and propagation in FCC single crystals under complex loading conditions. Comput. Methods Appl. Mech. Eng. 2016, 312, 468–491. [Google Scholar] [CrossRef]
  24. Lindroos, M.; Laukkanen, A.; Andersson, T.; Vaara, J.; Mantyla, A.; Frondelius, T. Micromechanical modeling of short crack nucleation and growth in high cycle fatigue of martensitic microstructures. Comput. Mater. Sci. 2019, 170, 109185. [Google Scholar] [CrossRef]
  25. Lindroos, M.; Scherer, J.M.; Forest, S.; Laukkanen, A.; Andersson, T.; Vaara, J.; Mantyla, A.; Frondelius, T. Micromorphic crystal plasticity approach to damage regularization and size effects in martensitic steels. Int. J. Plas. 2022, 151, 103187. [Google Scholar] [CrossRef]
  26. Andriollo, T.; Zhang, Y.; Fæster, S.; Thorborg, J.; Hattel, J. Impact of micro-scale residual stress on in-situ tensile testing of ductile cast iron: Digital volume correlation vs. model with fully resolved microstructure vs. periodic unit cell. J. Mech. Phys. Solids 2019, 125, 714–735. [Google Scholar] [CrossRef]
  27. Herrmann, C.; Schmid, S.; Schneider, D.; Selzer, M.; Nestler, B.; Skobir Balantič, D. Computational Determination of Macroscopic Mechanical and Thermal Material Properties for Different Morphological Variants of Cast Iron. Metals 2021, 11, 1588. [Google Scholar] [CrossRef]
  28. Bonora, N.; Ruggiero, A. Micromechanical modeling of ductile cast iron incorporating damage. Part I: Ferritic ductile cast iron. Int. J. Solids Struct. 2005, 42, 1401–1424. [Google Scholar] [CrossRef]
  29. Andriollo, T.; Fæster, S.; Winther, G. Probing the structure and mechanical properties of the graphite nodules in ductile cast irons via nano-indentation. Mech. Mater. 2018, 122, 85–95. [Google Scholar] [CrossRef] [Green Version]
  30. Lindroos, M.; Pinomaa, T.; Antikainen, A.; Lagerbom, J.; Reijonen, J.; Lindroos, T.; Andersson, T.; Laukkanen, A. Micromechanical modeling approach to single track deformation, phase transformation and residual stress evolution during selective laser melting using crystal plasticity. Addit. Manuf. 2021, 38, 101819. [Google Scholar] [CrossRef]
Figure 1. SEM image of typical GJL300 cast iron microstructure.
Crystals 12 00238 g001
Figure 2. The drawings of specimens used in tension (left) and fatigue (right) experiments.
Crystals 12 00238 g002
Figure 3. Example of a cubic model consisting of graphite (red) and BCC (green) grains used as Model 1.
Crystals 12 00238 g003
Figure 4. Model 2: Synthetic grain structure with embedded graphite flakes.
Crystals 12 00238 g004
Figure 5. EBSD SEM images of the cast iron microstructure (left); example of a finite element model based on the EBSD map (right) typifying Model 3.
Crystals 12 00238 g005
Figure 6. Experimental results for tension and compression at different temperatures.
Crystals 12 00238 g006
Figure 7. Experimental results for low cycle fatigue at room temperature.
Crystals 12 00238 g007
Figure 8. Model of graphite material. (Left): Young’s modulus of graphite as a function of volume strain. (Right): stress–strain curve for graphite under uniaxial tension and compression.
Crystals 12 00238 g008
Figure 9. Sensitivity analysis of graphite elastic parameters. Single stress–strain hysteresis loop for the cast iron model. (Left): different Young’s modulus ( ν = 0.3 ); (right): different Poisson’s ratio ( E = 15 GPa).
Crystals 12 00238 g009
Figure 10. Difference between the cast iron model behavior for graphite without and with introduced plasticity.
Crystals 12 00238 g010
Figure 11. Stress–strain curve for metal matrix.
Crystals 12 00238 g011
Figure 12. Comparison of numerical and experimental stress–strain curves in tension (left) and compression (right) for different temperatures.
Crystals 12 00238 g012
Figure 13. Von Mises stress distributions for different temperatures in tension (a) and compression (b).
Crystals 12 00238 g013
Figure 14. Stress–strain loops for the numerical model under steadily increasing applied strains. Full picture (left), separate loading sets (right).
Crystals 12 00238 g014
Figure 15. Behavior of the numerical model under constant cyclic loading (separate loops).
Crystals 12 00238 g015
Figure 16. Cumulative damage across the entire microstructure (left) and average crack opening strain for all opening damage systems (right) under cyclic loading.
Crystals 12 00238 g016
Figure 17. Cumulative plastic slip (a), cleavage resistance (b) and cumulative damage (c) after different number of cycles.
Crystals 12 00238 g017
Table 1. Comparison of the models.
ModelType of ElementsNumber of ElementsWall-Clock Time, s
Model 13D cubic100061
Model 22D triangular373150
Model 33D triangular prism1,215,85836,200
1 6 part of Model 33D triangular prism41,2657502
1 24 part of Model 33D triangular prism15,4812296
Table 2. Material parameters of graphite.
ParameterValue in TensionValue in Compression
E m [GPa]620
ν 0.250.25
n9.79.7
K [MPa/s n ]1100
τ 0 [MPa]1100
Q [MPa]550
b220
c25,00025,000
d1200600
H s r all 1.0all 1.0
Table 3. Material parameters of metal matrix.
ParameterValue
E m [GPa] 0.05 T 2 28.4 T + 190000
n9.7
K [MPa/s n ] 90 ( 0.05 T 2 28.4 T + 190000 ) / 177400
τ 0 [MPa] 90 ( 0.05 T 2 28.4 T + 190000 ) / 177400
Q [MPa]80
b30
c30000
d600
H s r all 1.0
Damage parameters
σ c 0 125.0
β 0.1
H−1000.0
K d 90.0
n d 11.0
σ u l t 10.0
Publisher’s Note: MDPI stays neutral with regard to jurisdictional claims in published maps and institutional affiliations.

