Abstract
The dynamic tensile extrusion (DTE) behavior and microstructural evolution of fine-grained (FG, ~1 μm < d < ~10 μm) Cu fabricated by powder injection molding (PIM) were investigated. The FGM Cu was fabricated by PIM with commercial micro-sized Cu powder sintering at 850 °C for 2 h, while the FGH Cu was developed by the hot isostatic pressing (HIP) of the FGM at 780 °C for 2 h under a pressure of 1000 bar. In order to compare the DTE behavior of the FG Cu manufactured using different methods, the ultrafine-grained-B (UFG, d < ~1 μm) Cu was developed by performing 16 passes of equal-channel angular pressing with route Bc, and the FG-150 Cu was fabricated by annealing the UFG-B Cu bar at 150 °C for 1 h. The DTE tests were performed with identical flyer velocities using an all-vacuum gas gun. The fragments and remnants were carefully recovered after the DTE tests and examined by electron backscattered diffraction measurement and a micro-Vickers hardness test. A strong dual <001> + <111> texture was developed during the DTE for both FGM and FGH Cu. In contrast to the outcome of the UFG-B and FG-150, little evidence of dynamic recrystallization taking place during the DTE in the FGM and FGH was found during analysis of the grain morphology and grain orientation spread. Premature failure based on void coalescence was induced at the vertex region of the FGM fragments due to pre-existing pores. The HIP treatment on the FGM Cu increased the relative density by reducing the pre-existing pores and, as a result, increased the DTE ductility of the FGH Cu.
1. Introduction
In defense and civilian applications, extreme operating conditions such as supersonic impact, penetration, and explosion accompany the dynamic mechanical behavior of materials. These can cause severe plastic deformation involving considerable increases in temperature due to the adiabatic heating conditions at high strain rates [1]. The shaped charge, known as a high explosive anti-tank weapon system, could be a good representative for describing the extremely deformed condition and is based on the Munroe–Neumann effect, which makes the explosive energy focus specifically on the hollow cavity [2]. As explosive energy is transmitted to a conical metal sheet called a liner, it deforms forward along the axis, becoming a high-velocity jet of metallic particles which accompany very large plastic deformation involving high strain rates over 105 s−1 [2,3]. The length of this jet is an important parameter in penetration capacity.
The mechanical response of liner materials under both high strain rate and adiabatic deformation conditions is similar to the dynamic tensile extrusion (DTE) test proposed by Gray Ⅲ et al. [4]. In the DTE test, a spherical shaped projectile is launched with high velocity through a gun barrel into a conical extrusion die, which severely deforms with the considerable strain (~500%) and high strain rate of over 106 s−1. The DTE ductility can be defined as the sum of the axial length of each fragment with respect to the initial projectile diameter as follows:
where is the longitudinal length of the th fragment and is the initial diameter of the projectile. The condition of the DTE test is similar to the jet formation of the shaped charge mentioned above; therefore, the DTE ductility was applied to evaluate the jet formability of several liner metals and alloys [4,5,6,7,8,9].
It has been reported that the DTE ductility of oxygen-free high-conductivity Cu under the same projectile velocity increases with a decrease in the grain size in the coarse grain (CG) range over 10 μm as a result of grain refinement and dual <001> + <111> texture development [4,5,6]. On the contrary, it was recently reported that the DTE ductility increases as the grain size increases for ultrafine-grained (UFG, d < ~1 μm) and fine-grained (FG, ~1 μm < d < ~10 μm) Cu, which are manufactured by equal-channel angular pressing (ECAP); this is clearly an opposite trend compared with that observed for CG Cu [9]. During DTE deformation, the higher energy state and temperature increment of the UFG Cu can induce the occurrence of meta-dynamic recrystallization (mDRX) faster in comparison to the FG Cu and leads to a decrease in the DTE ductility [9]. Hence, it is revealed that the DTE ductility of the FG Cu can increase through a reduction in the residual stress and retardation of the mDRX.
To develop FG Cu with stable sub-structures, powder injection molding (PIM) can be a suitable process because it uses a metal powder with few defects, followed by sintering and post-annealing treatments. Kim et al. [10] addressed the differences in the DRX domain between wrought and powder sintered Cu, showing a higher activation energy in the powder-sintered Cu rather than the wrought Cu through processing maps. Hence, it is expected that the DTE ductility could be increased by the retardation of the mDRX of the FG Cu manufactured by the PIM.
Thus, the present study aimed to produce fine-grained Cu fabricated by the PIM and investigate the dynamic behavior by microstructural evolution during the DTE test. The DTE tests were carried out using an all-vacuum gas gun. The microstructure analysis and micro-Vickers hardness measurement of the DTE fragments were conducted after the DTE test. In order to compare the microstructure evolution during the DTE deformation, misorientation distribution, and grain orientation spread (GOS), an analysis of the electron backscatter diffraction (EBSD) results was carried out. In addition, fracture characterization was accompanied by an investigation of the DTE fragments’ morphology.
2. Materials and Methods
Commercial micro-sized Cu powder with a purity of more than 99.9%, manufactured by a gas-atomizing process, was prepared. The average powder size was approximately 1.3 μm, showing spherical morphology with little agglomeration, as indicated in Figure 1a. The feedstock, which was a mixture of Cu powder and a binder comprising paraffin wax and polyethylene, was granulated. The feedstock was molten and injected into a mold cavity in the molding machine, then allowed to cool and solidify. After the binding components were removed through the solvent and thermal debinding process, highly porous pure Cu was obtained. The FG Cu was fabricated by the sintering process at 850 °C for 2 h under a hydrogen atmosphere, while the shape was maintained (hereinafter FGM).
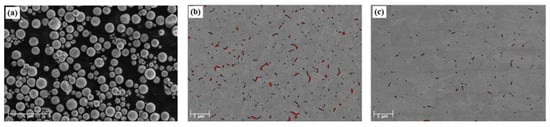
Figure 1.
(a) Cu powder consisting of ~1.3 mm with 99.9% purity. SEM micrographs for (b) FGM and (c) FGH with ultrafine pores indicated in red.
During the powder injection molding (PIM) sintering process, the void between powders where the binder had been removed was shrunk but still remained, especially at the grain boundaries and triple junctions, which were marked in red by using Matlab image processing, as shown in Figure 1b. The fraction and distribution of these pre-existed pores are closely related to the relative density, a key parameter of sintered materials. The relative density of the FGM is 8.82 g/cc, 98.5% of the theoretical density. To increase the density by reducing closed pores, the hot isostatic pressing (HIP) process was performed at 780 °C for 2 h under a pressure of 1000 bar with argon gas (hereinafter FGH). The FGH Cu showed higher relative density, 99.3%, with tiny pores. This was less than that of the FGM, as shown in Figure 1c. In order to compare the DTE behavior of FG Cu depending on the manufacturing methods used, the UFG and FG Cu were fabricated by the equal-channel angular pressing (ECAP) process using commercially extruded OFHC Cu bars. The detailed procedure of the ECAP is described elsewhere [5,9]. The UFG-B Cu was developed by 16 ECAP passes with route Bc, and the FG Cu was fabricated by annealing the UFG-B Cu bar at 150 °C for 1 h (hereinafter FG-150).
DTE projectiles with a diameter of 7.62 mm were machined from FGM and FGH Cu specimens. The DTE tests were performed with the same flyer velocities using an all-vacuum gas gun, as shown in Figure 2. Details of the DTE facility and procedure, including the configuration of the DTE projectile and die, are described in the literature [5,9]. A high-speed camera was set up to measure the projectile velocity and verify the number and order of fragments exiting the DTE die. The velocity of the projectile was 480 m/s upon reaching the die under identical nitrogen gas pressure inside the gas gun. Three DTE tests were conducted for each FG Cu specimen under identical DTE conditions. All fragments were softly recovered, weighed, and compared to the initial projectile weight to ensure the complete recovery [9].
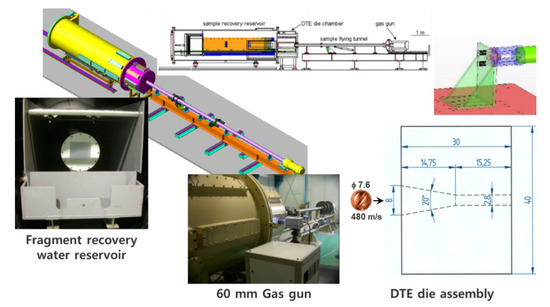
Figure 2.
A scheme of the present DTE facility with an “all-vacuum gas gun”, consisting of the gas gun, sample flying tunnel, DTE die assembly, and fragment recovery water reservoir station [5,9].
Micro-Vickers hardness tests were performed for all fragments on five points at intervals of 2 mm by applying a 0.1 kgf load for 5 s. The specimens used for the electron backscatter diffraction (EBSD) characterization were prepared by mechanical grinding followed by electropolishing using a D2 solution. The microstructures before and after the DTE tests were observed on the longitudinal plane, including the PIM//DTE direction, with a field emission scanning electron microscope (FE-SEM; Apreo LoVac, Waltham, MA USA) equipped with an EDAX TSL OIMTM EBSD system. The critical misorientation angle for grain identification was set above 5°, including twin boundaries. The grain size was calculated as the diameter of a circle with an identical area as the grain. The DTE fragment surface adjacent to the fracture region was observed using the FE-SEM to investigate the fracture mechanism during the DTE of the FG Cu.
3. Results and Discussion
3.1. Initial Microstructures
Figure 3 shows the inverse pole figure (IPF), grain boundary, and grain orientation spread (GOS) maps of the FGM and FGH Cu before DTE tests. ID denotes the powder injection direction. The average grain size of the FGM and FGH is 1.80 μm and 1.82 μm, respectively. The microtextures of both specimens are almost randomly distributed with an equiaxed shape. In addition, a noticeable fraction of Σ3 twin boundaries (ideal misorientation of 60°), indicated as red in both grain boundary maps, can be found, which explains the formation of annealing twins during the sintering and HIP treatment of the PIM process. Through the PIM and the supplemental HIP, the recrystallized microstructure can be well organized by decreasing the density of the deformation substructures. To investigate the recrystallized grains in both specimens, the GOS levels were calculated from the EBSD data, indicating that the recrystallized grains were within 1° of the GOS [11,12]. It is clearly observable that recrystallized grains, indicated by red in Figure 1c, are numerous in both the FGM and FGH specimens.
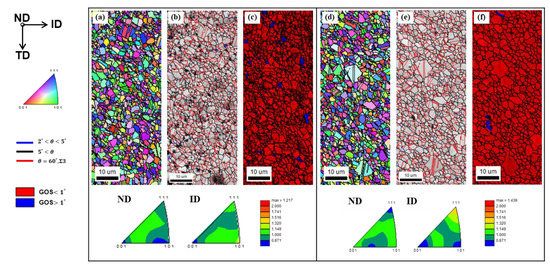
Figure 3.
Inverse pole figure (ID), grain boundary (overlaid on the image quality), and GOS maps of (a–c) FGM Cu and (d–f) FGH Cu before the DTE tests. The horizontal direction is the powder injection direction (ID).
The recrystallized FG microstructures shown in Figure 3 in the present research are quite different from those of the UFG-B and FG-150 fabricated by the ECAP, shown in Figure 1, from the previous study [9], which showed UFG and FG microstructures with a high density of dislocation-related substructures developed due to severe plastic deformation [9,13]. To compare the density of the substructures clearly, the misorientation-angle distributions from the EBSD results for the UFG-B, FG-150, FGM, and FGH Cu are presented in Figure 4. In the UFG-B and FG-150, the majority of low-angle boundaries (LAB, 2° < θ < 5°) were initially developed due to the ECAP process. However, the FGM and FGH indicate that the density of high-angle boundaries (HAB, θ > 5°), including Σ3 CSL boundaries, is higher than that of UFG-B and FG-150. This implies that the deformation substructures and grain boundary character distribution, which are quite different for the two FG Cu groups fabricated by the PIM and ECAP, respectively, are factors that have major effects on the DTE behavior.
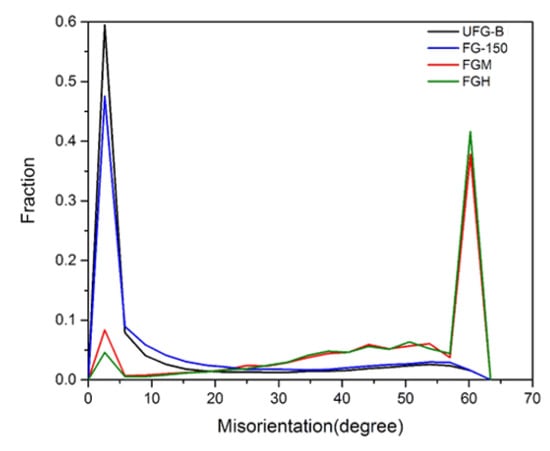
Figure 4.
Misorientation angle distribution from EBSD results for the UFG-B [9], FG-150 [9], FGM, and FGH Cu before DTE tests.
3.2. DTE Behavior of Fine-Grained Cu
Representative soft-recovered fragments of the FGM and FGH Cu in the order they exited the die are shown in Figure 5a. The conical fragments indicated by “Frag. 1” are the remnants that remained in the DTE die. Both the FGM and FGH specimens were fragmented into four pieces. As described in previous research [9], the UFG-B was fragmented into two pieces, including an almost separated conical part, while the FG-150 was fragmented into four pieces. In addition, the tips of the UFG-B and FG-150 fragments exhibited an acicular shape, indicating that a shear failure occurred during fragmentation due to plastic instability or necking [9]. However, the FGM and FGH fragments showed earlier failure, especially between Frag. 1 and Frag. 2, indicating that the fracture surface formed at an angle of 45 degrees with respect to the DTE direction. This means that the fragmentation of the FGM and FGH occurred due to void coalescence rather than plastic instability or necking. Therefore, it is believed that the fracture behaviors during the DTE will also differ depending on the manufacturing process used for the FG Cu.
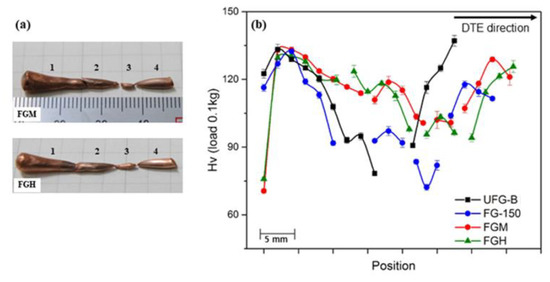
Figure 5.
(a) Soft-recovered DTE fragments of the FGM and FGH Cu specimens in the order they exited the die. Conical fragments indicated by “number 1” are the remnants that remained in the DTE die. (b) Micro-Vickers hardness profiles of the fragments along the DTE direction. The numbers match the fragment numbers in (a) (UFG-B [9], FG-150 [9]).
The DTE ductility calculated using Equation (1) is 372% and 386% for the FGM and FGH specimens, respectively, indicating their higher ductility than the UFG-B (279%) and similar quality to FG-150 (381%). Figure 5b shows the micro-Vickers hardness profiles of the fragments along the DTE direction. The hardness of Frag. 1 in all specimens initially increases to ~130 HV, exhibiting a peak, and then starts to decrease. Both UFG-B and FG-150 show a slight increase at the beginning of Frag. 1 and then decrease sharply as the DTE strain increases. The lowest hardness of the UFG-B (78 HV) is observed at the end of the conical remnant, and for the FG-150 it is 72 HV located at Frag. 3. These dramatic decreases can be explained by the occurrence of the mDRX [6,9]. On the other hand, the hardness profiles of the FGM and FGH fragments show a slight decrease but retain at a certain level above 90 HV, indicating that the mDRX behavior is retarded compared with that of the UFG-B and FG-150. All first exiting fragment specimens were recovered and their hardness were determined to the level of their conical remnants.
3.3. Microstructure Characterization of DTE Fragments
To verify the microstructural evolution during the DTE, EBSD measurements were performed on the FGM and FGH fragments. The regions of DTE strain levels of 0.5, 1.0, and 1.5, with respect to the initial projectile, were scanned where the positions corresponded to 3.8, 7.6, and 11.4 mm from the rear of the conical remnants. Figure 6 and Figure 7 present the inverse pole figure (extrusion direction) and GOS maps of the FGM and FGH Cu, respectively, at the DTE strain levels of 0.5, 1.0, and 1.5. Both specimens show a deformed microstructure with several elongated grains along the DTE direction and the development of strong dual <001> + <111> fiber textures. Several previous studies have reported this type of dual-fiber texture along the deformation axis on FCC metals and alloys subjected to a uniaxial process, such as extrusion or wire drawing [14]. The FGM and FGH fragments show that the fractions of both <001> and <111> components increase as the DTE strain increases without any extensive reduction, which is in contrast to the UFG-B fragment and indicates that the <111> fibers are replaced by the <001> fibers as a result of mDRX, as shown in Figure 5, Figure 6, Figure 7, Figure 8 and Figure 9 in the previous study [9].
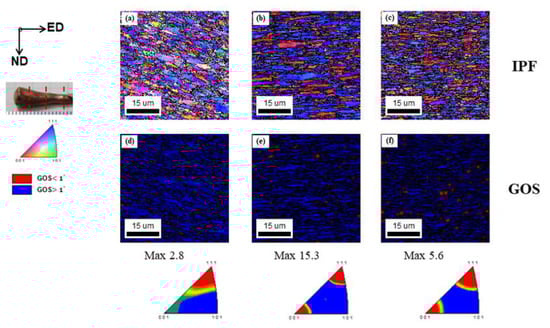
Figure 6.
Inverse pole figure (extrusion direction) and GOS maps of FGM Cu at the region of DTE strain level of (a,d) 0.5, (b,e) 1.0, and (c,f) 1.5 in the conical remnant, indicated by red dash lines. The horizontal direction is the DTE direction of the specimen.
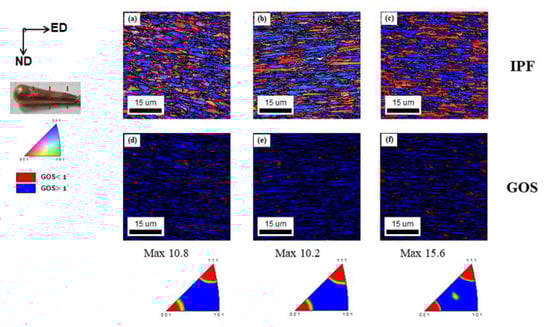
Figure 7.
Inverse pole figure (extrusion direction) and GOS maps of FGH Cu at the region of DTE strain level of (a,d) 0.5, (b,e) 1.0, and (c,f) 1.5 in the conical remnant, indicated by red dash lines. The horizontal direction is the DTE direction of the specimen.
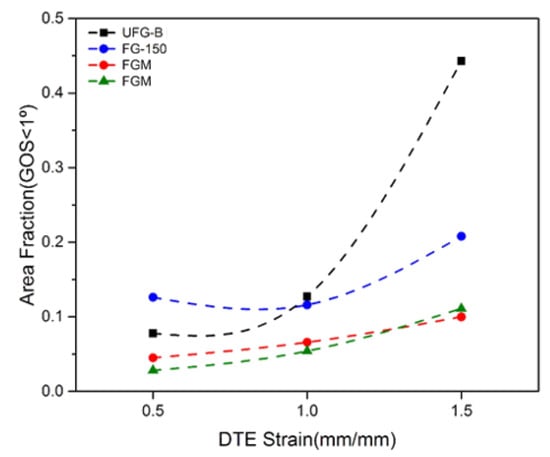
Figure 8.
Fraction for which GOS < 1° with respect to the DTE strain for the UFG-B [9], FG-150 [9], FGM, and FGH Cu, respectively.
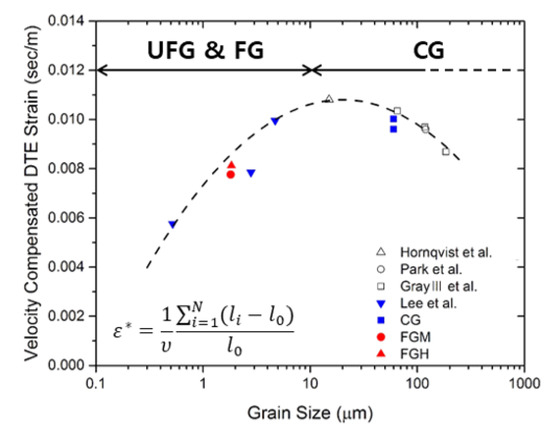
Figure 9.
Velocity-compensated DTE strain of Cu as a function of initial grain size. The symbol of “*” means the velocity compensated DTE strain as represented in Equation (2) (△ Hörnqvist et al. [6], ○ Park et al. [5], □ Gray et al. [4], ▼ Lee et al. [9]).
The occurrence of mDRX during the DTE can be confirmed by GOS levels from the EBSD data, indicating that the mDRX grains are within 1° of the GOS [11,12]. The GOS maps indicate that both specimens show rare, recrystallized grains with few defects (colored in red, GOS < 1°) but display more numerous deformed grains with the substructure (colored in blue, GOS > 1°). The fraction within 1° of the GOS according to the DTE strain for the UFG and FG Cu indicating the DRX fraction is displayed in Figure 7. The UFG-B case shows a dramatic increase in the DRX fraction up to 0.45 at a DTE strain level of 1.5. In addition, in the FG-150 a clear increase in the fraction of the recrystallized grains is observed as the DTE strain increases. However, both the FGM and FGH specimens show a small increment in the DRX fraction, indicating the retardation of the mDRX behavior, as clearly presented in the GOS maps of Figure 6 and Figure 7. Therefore, the mDRX behavior during DTE occurs much more rapidly in the UFG-B and FG-150 compared with the FGM and FGH cases.
3.4. DTE Ductility of Cu According to the Initial Grain Size
Since the DTE ductility is influenced by not only grain size but also the initial velocity of a given projectile, it is necessary to introduce “velocity compensated DTE strain” to compare with the results of several previous DTE investigations which were conducted by different DTE facilities [4,5,6,9]. The velocity-compensated DTE strain can be calculated based on Equation (1) as follows:
where is the projectile velocity. Figure 9 represents the velocity-compensated DTE strain of several Cu specimens as a function of initial grain size. Based on the DTE tests of the UFG and FG Cu fabricated by the ECAP, it is believed that the DTE ductility of the UFG and FG Cu increases as the grain size increases, clearly opposite to the outcome with the CG Cu. Lee et al. [9] reported that the DTE ductility of the CG Cu increases with a decrease in the grain size due to the strong <001> + <111> dual-fiber texture development enhancing the deformation homogeneities, whereas the mDRX behavior is more prominent in the UFG and FG Cu cases resulting in a ductile failure and local necking, with a decrease in the DTE ductility occurring as the initial grain size decreases. The initial microstructure characterization of the FG Cu should be considered in order to understand the occurrence of mDRX. In UFG-B and FG-150, the initial microstructure possesses the cumulative deformation energy and numerous nucleation sites from the SPD process. Because of the process characteristics, the substructure with a high fraction of sub-grain (<5°) boundary was developed implying a high density of dislocation, as shown in Figure 1 in the previous study [9]. This high-energy state of the initial specimen can help to identify the mDRX behavior faster. In summary, there are two contrast tendencies depending on the grain size ranges clearly different from elementary metallurgy. This mechanism of microstructural evolution, rarely observed in the elementary metallurgy or static deformation, can be specified at high deformation rates such as those used in the DTE test.
However, the FGM and FGH Cu which go through the PIM process exhibit a considerable stable state from the initial microstructure, as shown in Figure 2. The noticeable feature of PIM products is a high fraction of GOS < 1° with numerous Σ3 twin boundaries. It is reported that the low index CSL boundary, especially Σ3n, cannot store the strain energy as much as dislocations and could be an active energy dissipation source resulting in the retardation of mDRX [15]. Considering the initial microstructure, the slower mDRX kinetics in the PIM specimens can be attributed to the stable energy state. Accordingly, it can be expected that the DTE ductility of the FG Cu fabricated by the PIM could increase compared with the UFG-B and FG-150 Cu since the FGM and FGH fragments exhibit mDRX behavior which is suppressed during the DTE, as confirmed in Figure 8. The velocity-compensated DTE strain of the FGM and FGH Cu shown in Figure 9 clearly increases more than the UFG-B since the initial grain size increases; however, it is similar to the FG-150 Cu. Considering the effect of the mDRX suppression, the DTE strain of the FGM and FGH is relatively lower than expected. Hence, it is likely that a different mechanism influencing the DTE strain here arises in the FG Cu fabricated by the PIM, besides the deformation texture development and mDRX behavior.
3.5. Fracture Behavior during DTE
In previous research, it was confirmed that a small area of fracture occurs at the vertex of Cu fragments after the DTE test [5,9]. These fragments exhibit a conical shape with a sharp vertex, indicating stable tensile deformation resisting the onset of strain localization. This general fracture behavior was observed not only in the CG Cu but also in the UFG and FG fabricated by the ECAP, regardless of the initial grain size. This can be explained as macroscopic plastic localization dominated failure, indicating that damage nucleation is enlarged during the growth and coalescence taking place after the onset of macroscopic localization when all the straining occurs during the DTE.
However, in the present study, the FGM and FGH show earlier failure facilitated between Frag. 1 and Frag. 2, as presented in Figure 5a. Thus, it can be considered that a different fracture mechanism during the DTE operates in the FGM and FGH Cu, different from the results of previous studies. Figure 10 shows the SEM micrographs of the FGM fragment surfaces near the fracture region. The fracture surface between Frag. 1 and Frag. 2 is clearly formed at an angle of 45 degrees with respect to the DTE direction. Furthermore, the fragment surface of Frag. 2 shown in Figure 10b,c indicates crack propagation at the shear localization site, marked by red. Cleavage planes along the failure region are also observed with a high magnification in Figure 10d. It is likely that the FGM fragments indicate void coalescence-dominated failure, which means that macroscopic localization and void coalescence occur simultaneously before strain/shear localization. Since the void remains in the initial FGM Cu, shown in Figure 1b, pore coalescence occurs during the DTE where the bandwidth is narrow, coinciding with the progression of plastic deformation, which induces a decrease in the DTE ductility.
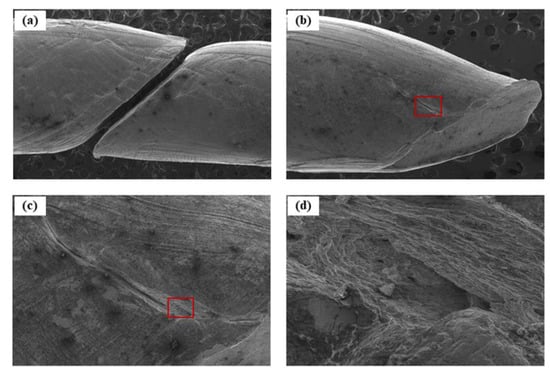
Figure 10.
SEM micrographs of DTE fragment surface near the fracture region in the FGM Cu: (a) Fracture region between Frag. 1 and Frag. 2. (b,c) Fragment surface of Frag. 2 indicates crack propagation at shear localization site marked by red. (d) Cleavage planes along the failure region indicated in (c).
Hence, to reduce the pre-existing pores in the FGM, we conducted HIP treatment and obtained the FGH Cu, as mentioned in the “Materials and Methods” section. The SEM micrographs of FGH fragments surface near the fracture region are presented in Figure 11. The fracture surface between Frag. 1 and Frag. 2 shows similar properties to the FGM; however, a resistance to the onset of strain localization is evident in the middle of Frag. 2, marked by a white dash line in Figure 11c. It is considered that the HIP treatment enhances the resistance to fracture development. As a result, the DTE ductility of the FGH is increased up to 14% more than that of the FGM, as indicated in Figure 9. Consequently, the HIP process on the FG Cu fabricated by the PIM increases the relative density by reducing the pre-existing pores, together with increasing the DTE ductility.
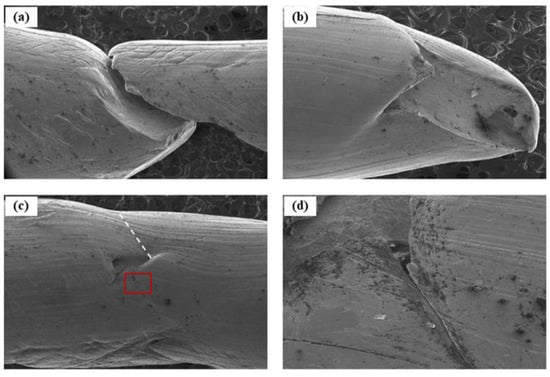
Figure 11.
SEM micrographs of DTE fragment surface near the fracture region in the FGH Cu: (a) Fracture region between Frag. 1 and Frag. 2. (b–d) Fragment surface of Frag. 2 indicates resistance in the onset of strain localization marked by the white dash line.
4. Conclusions
In this research, the DTE behavior and microstructural evolution of the FG Cu fabricated by the PIM were investigated. The DTE tests were performed with identical flyer velocities using an all-vacuum gas gun. The following results were obtained:
- 1.
- The relative density of the FG Cu was improved from 98.5% for the FGM up to 99.3% for the FGH by applying the HIP process while reducing the pre-existing pores.
- 2.
- The DTE ductility of the FGM and FGH under the identical projectile velocity of 480 m/s was 372% and 386%, respectively, corresponding well to the trend of the velocity-compensated DTE strain of the UFG and FG Cu, as shown in Figure 9. The hardness profiles of the FGM and FGH fragments along the extrusion direction showed a gradual decrease with stable hardness variations.
- 3.
- A strong dual <001> + <111> fiber texture was developed during the DTE for both FGM and FGH. There was no indisputable evidence of the mDRX in an analysis of grain morphology and GOS outcomes, since the initial microstructures of the FGM and FGH do not possess enough stored energy to act as a driving force for the mDRX.
- 4.
- Fracture characterization was accompanied by an investigation of the DTE fragments’ morphology. Premature failure based on void coalescence was induced at the vertex region of the FGM fragments due to pre-existing pores, while the UFG-B and FG-150 fabricated by the ECAP presented a shape of conventional ductile failure, as shown in Figure 3 in the previous study [9].
- 5.
- HIP treatment, which increases the relative density by reducing the pre-existing pores, increases the DTE ductility of the FGH Cu.
Author Contributions
Conceptualization, K.L. and L.P.; Methodology, K.L. and S.W.; Data treatment and validation, K.L. and S.W.; Investigation, K.L. and S.W.; Writing—original draft preparation, K.L. and S.W.; Writing—review and editing, K.L. and L.P.; Supervision, K.L. and L.P.; Project administration, L.P.; Funding acquisition, L.P. All authors have read and agreed to the published version of the manuscript.
Funding
This research was supported from the Defense Research Programs under grant number 911555-912455201 and 111555-912440203 funded by Agency for Defense Development (ADD) of Republic of Korea.
Data Availability Statement
The data presented in this study are available on request from the corresponding author. The data are not publicly available due to confidential non-disclosure agreements.
Conflicts of Interest
The authors declare no conflict of interest.
References
- Lee, K.; Lee, Y.; Woo, S.; Lee, C.; Park, L. Experimental characterization of dynamic deformation behaviour for SCM440 steel at high strain rates. EPJ Web Conf. 2018, 183, 02019. [Google Scholar] [CrossRef]
- Walters, W. Introduction to shaped charges. In Army Research Lab Aberdeen Proving Ground MD Weapons and Materials Research Directorate; 2007. Available online: https://www.arl.army.mil/ (accessed on 14 December 2021).
- Murr, L.E.; Niou, C.S.; Sanchez, J.C.; Shih, H.K.; Duplessis, L.; Pappu, S.; Zernow, L. Comparison of beginning and ending microstructures in metal shaped charges as a means to explore mechanisms for plastic deformation at high rates. J. Mater. Sci. 1995, 30, 2747–2758. [Google Scholar] [CrossRef]
- Gray, G.T., III; Cerreta, E.; Yablinsky, C.A.; Addessio, L.B.; Henrie, B.L.; Sencer, B.H.; Lopez, M.F. Influence of shock prestraining and grain size on the dynamic-tensile-extrusion response of copper: Experiments and simulation. AIP Conf. Proc. 2006, 845, 725–728. [Google Scholar]
- Park, K.T.; Park, L.; Kim, H.J.; Kim, S.B.; Lee, C.S. Dynamic tensile extrusion behavior of coarse grained and ultrafine grained OFHC Cu. Mater. Sci. Eng. A 2013, 569, 61–70. [Google Scholar] [CrossRef]
- Hörnqvist, M.; Mortazavi, N.; Halvarsson, M.; Ruggiero, A.; Iannitti, G.; Bonora, N. Deformation and texture evolution of OFHC copper during dynamic tensile extrusion. Acta Mater. 2015, 89, 163–180. [Google Scholar] [CrossRef]
- Cao, F.; Cerreta, E.K.; Trujillo, C.P.; Gray, G.T., III. Dynamic tensile extrusion response of tantalum. Acta Mater. 2008, 56, 5804–5817. [Google Scholar] [CrossRef]
- Park, L.; Woo, S.; Lee, Y.; Lee, K.; Yi, Y.S. Comparison of dynamic tensile extrusion behaviour of WCu composites made by different processes. EPJ Web Conf. 2018, 183, 03004. [Google Scholar] [CrossRef][Green Version]
- Lee, K.; Woo, S.; Kim, S.B.; Lee, S.; Park, L.; Park, K.T. Deformation and microstructural evolution of ultrafine-and fine-grained OFHC Cu during dynamic tensile extrusion. J. Mater. Res. Technol. 2020, 9, 10746–10757. [Google Scholar] [CrossRef]
- Kim, Y.; Lee, S.H.; Lee, S.; Noh, J.W. Characterization of hot deformation behaviors of wrought and P/M oxygen free coppers (OFCs) using processing maps. Mater. Sci. Eng. A 2012, 552, 276–282. [Google Scholar] [CrossRef]
- Jin, Y.; Lin, B.; Bernacki, M.; Rohrer, G.S.; Rollett, A.D.; Bozzolo, N. Annealing twin development during recrystallization and grain growth in pure nickel. Mater. Sci. Eng. A 2014, 597, 295–303. [Google Scholar] [CrossRef]
- Kang, J.Y.; Park, S.; Park, J.Y.; Park, S.J.; Song, Y.H.; Park, S.T.; Oh, K.W. Annealing Textures and Grain Size of Tantalum Sheet. Trans. Mater. Process. 2019, 28, 247–256. [Google Scholar]
- Lee, Y.; Lee, K.; Woo, S.; Lee, C.; Park, L. Static and dynamic behaviour of ECAPed copper alloy. EPJ Web Conf. 2018, 183, 03006. [Google Scholar] [CrossRef][Green Version]
- Humphreys, F.J.; Hatherly, M. Recrystallization and Related Annealing Phenomena; Elsevier: Amsterdam, The Netherlands, 2012. [Google Scholar]
- Padilla, H.A.; Smith, C.D.; Lambros, J.; Beaudoin, A.J.; Robertson, I.M. Effects of deformation twinning on energy dissipation in high-rate deformed zirconium. Metall. Mater. Trans. A 2007, 38, 2916–2927. [Google Scholar] [CrossRef]
Publisher’s Note: MDPI stays neutral with regard to jurisdictional claims in published maps and institutional affiliations. |
© 2022 by the authors. Licensee MDPI, Basel, Switzerland. This article is an open access article distributed under the terms and conditions of the Creative Commons Attribution (CC BY) license (https://creativecommons.org/licenses/by/4.0/).