Article

Effect of Solvent Composition on Solubility, Thermodynamics, Metastable Zone Width (MSZW) and Crystal Habit of L-Ascorbic Acid

1
Department of Chemical Engineering, Indian Institute of Technology Ropar, Rupnagar 140001, Punjab, India
2
Technobis Crystallization Systems B.V., 1812 SC Alkmaar, The Netherlands
*
Authors to whom correspondence should be addressed.
Crystals 2022, 12(12), 1798; https://doi.org/10.3390/cryst12121798
Submission received: 23 November 2022 / Revised: 6 December 2022 / Accepted: 7 December 2022 / Published: 9 December 2022
(This article belongs to the Section Industrial Crystallization)

Abstract

:
This work investigates the effect of different solvent systems on solubility, thermodynamics, metastable zone width (MSZW), and crystal habit of ascorbic acid, in order to help optimize its crystallization process. The solubility curves and metastable zone (MSZ) limits were determined experimentally using the polythermal method in pure solvents: water and alcohols (methanol/ethanol/isopropanol), as well as water-alcohol binary solvent systems. The solubility decreases with increasing alcohol composition for all solvent systems. The solubility data were well correlated using the Jouyban–Acree model as a function of two variables: temperature and solvent composition. The dissolution enthalpy ( Δ H d i s s ), dissolution entropy ( Δ S d i s s ), and Gibbs free energy ( Δ G d i s s ) were determined using Van’t Hoff and Jouyban–Acree models. The thermodynamic properties increase with increasing alcohol composition. The lowest and highest values of enthalpy were obtained for water (20.52 kJ mol 1 ) and isopropanol (35.33 kJ mol 1 ), respectively. Pure alcohols as solvents widen the metastable zone width, indicating high supersaturation required for the nucleation. Crystal images captured during cooling crystallization in water confirm the cubic crystal habit formation, whereas increasing alcohol composition in the solvent system promotes preferential growth along one crystallographic axis, leading to elongated prism-shaped crystals in methanol and ethanol and needle-shaped crystals in isopropanol.

1. Introduction

L-ascorbic acid ( C 6 H 8 O 6 ), commonly known as vitamin C, is an essential compound with a wide range of applications in the pharmaceutical, healthcare, food, and agriculture industries. The antioxidant effect of ascorbic acid is well known for preventing inflammatory diseases and boosting immunity [1,2]. It has uses ranging from multivitamins, drug combinations, nutritional supplements, and personal care products. Ascorbic acid is produced industrially by the Reichstein-Grüssner process from Glucose, followed by crystallization, which is an essential unit operation for the purification and control of crystal properties based on the end application [3,4]. The economic production of the ascorbic acid of high purity and improved yield depends on the performance of the crystallization as a post-treatment step of the process. The modification of the solvent composition is one of the alternatives to make the process economically viable. The solvent employed for crystallization controls the thermodynamic properties: solubility, supersaturation, and solvent-solute interactions; kinetic parameters: nucleation and growth rate; and final crystal attributes like crystal size, crystal habit, and polymorph. Hence, selecting the optimal solvent system is a critical part of ascorbic acid production [5].
For the crystallization of ascorbic acid, water has been used as a prominent solvent because of its high solubility and easy availability. However, many studies have reported the degradation of ascorbic acid in aqueous solutions [6,7]. In addition to water, the effects of other solvents such as methanol, ethanol, isopropanol, and their compositions have been studied on various aspects of the crystallization process [8,9,10,11,12,13].
Solubility is a primary characteristic affected by solvent selection. A suitable solvent has a high temperature coefficient of solubility for enhanced potential recovery and yield [5]. Many researchers have investigated the solubility of ascorbic acid in pure solvents, e.g., water, methanol, ethanol, and isopropanol and their binary mixtures, and have observed high solubility in water and low solubility in alcohols [8,11,13]. The solubility data has also been utilized to investigate the interaction between the solute and solvent in terms of thermodynamic properties: enthalpy and entropy, and kinetic properties: nucleation and growth rate [12,13,14,15,16]. The modified crystal habit of ascorbic acid with changing solvent has been described in the literature, with water resulting in prism or cubic shape crystals and alcohol solvents in more elongated prismatic and needle morphologies. This change in shape has been attributed to the polarity of solvents [11,17,18]. The crystal habit formed in different solvents furthermore determines the thermal stability of the crystals [19,20].
The previous studies suggest the influence of solvent systems on the crystallization of ascorbic acid, which need to be explored further in order to investigate the role of solvent composition for easier scale-up of ascorbic acid production to plant scale. The solubility of ascorbic acid in different solvent systems has been studied extensively. Nevertheless, prediction of solubility depending on two variables, temperature and solvent composition, needs further validation [10]. In addition, a thorough review of the literature suggests that there is no study available that analyses the effect of solvent composition on metastable zone width (MSZW) and crystal habit.
The main aim of this work is to study the effect of solvent composition on solubility, thermodynamic properties, MSZW, and crystal habit of ascorbic acid. The solubility and MSZ limit in binary solvent systems of water with three co-solvents: methanol, ethanol, and isopropanol, covering the range of binary solvent compositions, were determined experimentally. The measured solubilities were correlated using the Jouyban–Acree model. Subsequently, the thermodynamic properties were evaluated using Van’t Hoff and Jouyban–Acree models. Furthermore, the MSZW and crystal habits were analysed in response to the solvent composition.

2. Experimental

2.1. Materials

The L-ascorbic acid (MW: 176.12 g·mol 1 ) structure shown in Figure 1 was purchased from Sigma-Aldrich (KGaA, Darmstadt, Germany) in crystalline powder form with >99.0% purity. Water (MW: 18.02 g·mol 1 ) and ethanol (MW: 46.07 g·mol 1 ) were purchased from Acros Organics (Geel, Belgium), methanol (MW: 32.04 g·mol 1 ) from Merck (KGaA, Darmstadt, Germany) and isopropanol (MW: 60.01 g·mol 1 ) from Fisher Chemical (Fischer scientific, Loughborough, UK). All chemical materials were used as purchased without any further purification.

2.2. Preparation of Binary Solvent Systems

Binary solvent systems were prepared by the addition of alcohol (methanol/ethanol/ isopropanol) as component 2 to water (component 1). The composition of alcohol (mole fraction) varies as 0.2, 0.4, 0.6, and 0.8 for each binary system. The mole fraction of the binary solvent system is defined as
x i = m i / M W i m w M W w + m i M W i
where, m represents mass and M W represents the molecular weight of the respective solvent (w = water and i = methanol/ethanol/isopropanol). The mole fraction of water in the binary system is x w = 1 x i .

2.3. Apparatus and Methodology

2.3.1. Measurement of Solubility and MSZ Limit

The solubility curve and metastable zone limit were determined by the polythermal method using the Crystal16 ® multi-reactor crystallizer (Technobis Crystallization Systems, Alkmaar, The Netherlands ) [21]. Crystal16 ® measures the change in transmissivity of each of the 16 reactors with temperature, which determines the clear and cloud points, indicated as red and blue symbols, respectively, in Figure 2a. The clear point is defined as the temperature corresponding to the 100% transmissivity of the solution on heating, indicating the complete dissolution of solute. The cloud point is defined as the temperature from where the measure of 100% transmissivity of clear solution starts dropping, signaling the appearance of nuclei. Plotting clear and cloud points, one can determine the solubility curve and MSZ limit, respectively, as shown in Figure 2b. This procedure has been successfully employed by several groups to measure solubility [22,23,24,25].
For each solvent system, four different concentrations were prepared by adding a measured amount of ascorbic acid in HPLC vials filled with 1 mL of chosen solvent. Three repeated cycles of heating and cooling in the temperature range of −10 °C to T m a x , depending on the boiling point of the solvent, were programmed at the same heating and cooling rate of 0.3 °C/min. The maximum temperature ( T m a x ) for heating the water-methanol, water-ethanol, and water-isopropanol solvent systems were fixed at 62 °C, 68 °C, and 75 °C, respectively. The vials filled with the solution were stirred continuously at 600 RPM using a magnetic stirrer throughout the measurements. The three repetitions of the heating and cooling cycles were performed to reinforce the reproducibility of this methodology.
The transmissivity data were further analysed in CrystalClear software to determine clear and cloud points. Appropriate clear and cloud points, with a difference in temperature less than 3 °C from the three repeated cycles, were selected, which resulted in a solubility curve and MSZ limit, respectively. The same procedure was repeated for all 16 solvent systems. For each solvent system, the solubility curve was determined with a minimum of 4 saturation temperatures, which is considered to be sufficient to evaluate the solubility model [26,27].

2.3.2. Cooling Crystallization Experiment

Cooling crystallization experiments were conducted using the Crystalline particle view reactor system [28]. The system contains eight independently controlled temperature reactors with 2.5–5 mL working volume. The system monitors the in-line turbidity, captures images, and is equipped with image analysis software for particle size distribution and shape; and has been successfully used by several groups to study crystal morphology and solubility [29,30,31].
For crystallization experiments, a pre-determined amount of ascorbic acid corresponding to the solubility data at 60 °C, was added in 3 mL of solvent. The program was set to begin with heating the solution at 60 °C till the complete dissolution of the solute. In the next step, the solution was cooled down to 20 °C at a constant cooling rate of 0.5 °C/min with continuous stirring at 600 RPM using a magnetic stirrer. The solution was left stirring for 1 h at 20 °C to allow crystal growth. During the experimental run, microscopic images at 2 s intervals were recorded to examine the crystal habit. The same procedure was followed for all the solvent systems.

3. Solubility Prediction: Jouyban-Acree Model

The Jouyban-Acree model is a commonly used model to predict the solubility in solvent mixtures as a function of temperature and solvent composition [32,33,34]. For binary mixture, the model is represented by Equation (2) [35,36].
l n x A A = x 1 l n ( x A A ) 1 + x 2 l n ( x A A ) 2 + x 1 x 2 T Σ i = 0 2 J i ( x 1 x 2 ) i
x A A = m A A M W A A m A A M W A A + m 1 M W 1 + m 2 M W 2
where x A A is the mole fraction of ascorbic acid in the binary solvent system, x 1 and x 2 represent the respective mole fraction of water (component 1) and alcohol (component 2) in the binary solvent system, ( x A A ) i is the ascorbic acid solubility in pure solvent i, T is the absolute temperature, and J i represents model parameter. For binary solvent systems, the equation is represented by three model parameters ( J o , J 1 , J 2 ).
Equation (2) can be simplified by reducing the input variables from five ( x 1 , x 2 , ( x A A ) 1 , ( x A A ) 2 , and T) to two ( x 1 and T) by substituting the following relations.
According to mass balance,
x 2 = 1 x 1
using Van’t Hoff equation for pure solvents,
l n ( x A A ) 1 = a 1 + b 1 T
l n ( x A A ) 2 = a 2 + b 2 T
substituting Equations (4)–(6) in Equation (2),
l n x A A = A 1 + A 2 1 T + A 3 x 1 + A 4 x 1 T + A 5 x 1 2 T + A 6 x 1 3 T + A 7 x 1 4 T
Equation (7) has two independent variables x 1 and T, represented by seven model parameters ( A 1 , A 2 , A 3 , A 4 , A 5 , A 6 , and A 7 ).

4. Results and Discussion

4.1. Effect of Solvent Composition on Solubility

To investigate the effect of solvent composition, the solubility of ascorbic acid was measured in 12 binary mixtures and 4 pure solvents. The solubility (c) in mg/ml has been represented by the Van’t Hoff Equation (2) as a function of temperature (T) in °C.
c ( m g / m l ) = e x p A + B T + 273
The coefficients A and B in Equation (8) are given in Table 1 with R 2 values, employed to determine the solubility within the temperature range of 20 °C to 60 °C.
For the validation of the procedure employed, solubility curves of ascorbic acid in pure solvents: water, methanol, ethanol, and isopropanol are compared with the published work by Shalmashi and Apelblat [37,38] (Figure 3). Figure 3 displays a fair agreement between the present results and the reported data, with an average error of 5.8% for water, 6.9% for methanol, 13.01% for ethanol, and 5.04% error for isopropanol. A larger deviation was observed at higher temperatures. The possible reason could be maintaining the experimental temperature while filtration and measuring the weight in the gravimetric method. From Figure 3, it is noticeable that solubilities increase with the increase in the temperature for all pure solvents. It is also evident that ascorbic acid has higher solubility in water, followed by methanol, ethanol, and isopropanol in decreasing order.
Solubility is a function of the interaction between solute and solvent. Ascorbic acid is a polar molecule with four hydroxyl groups and two hydrophilic oxygen atoms. Consequently, the solubility of ascorbic acid is high in highly polar solvents such as water and progressively decreases in alcohols of decreasing polarity (Methanol > Ethanol > Isopropanol).
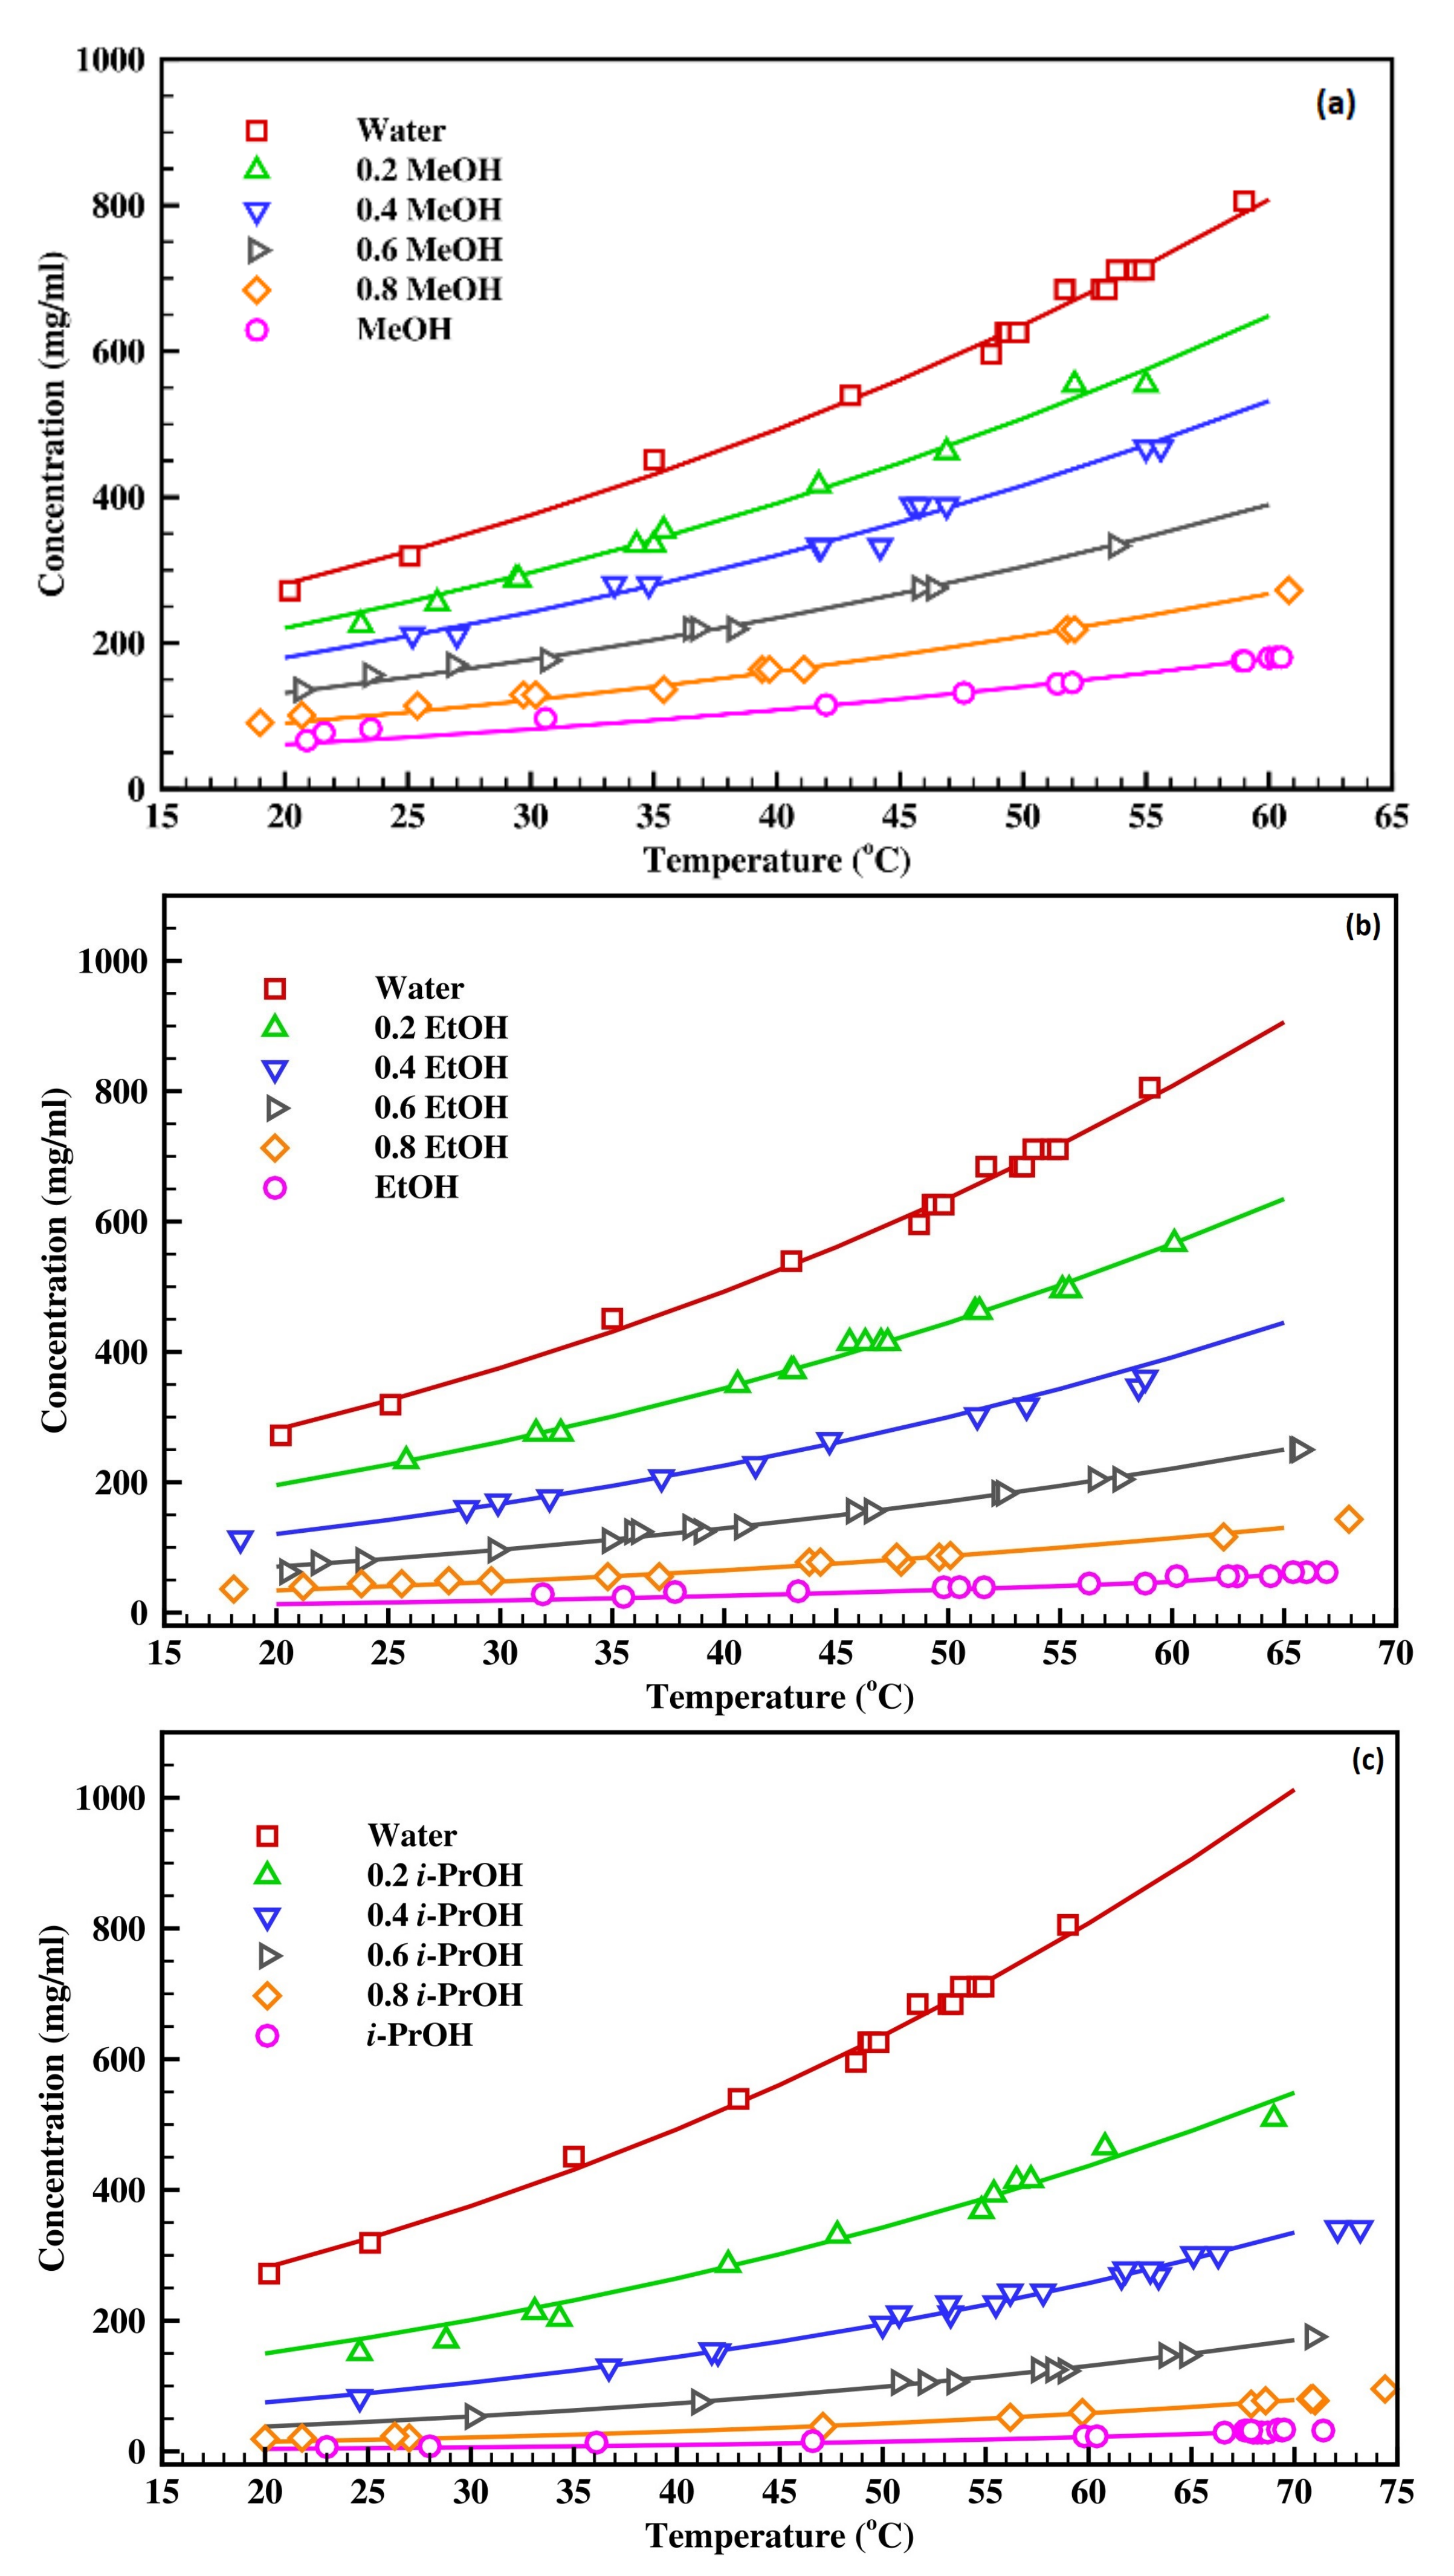
Figure 4 shows the solubility of ascorbic acid in pure and binary solvent systems as a function of temperature, including the fitting of the Van’t Hoff equation. The solubility of ascorbic acid in all the binary mixtures follows the same trend as pure solvents with temperature, i.e., it increases with an increase in temperature. At a fixed temperature, the solubility decreases with the increasing alcohol composition for all three water-alcohol systems. The increasing composition of alcohol in water reduces the polarity of the solvent to intermediate values depending on the composition, leading to lower solubility in binary mixtures with increasing alcohol composition.

4.2. Estimation of Solubility in Binary Solvent Systems

According to Jayban Acree Model, Equation (7) can be employed to predict the solubility using model parameters and experimental data. The model parameters were determined by the MATLAB curve fitting tool, using experimental values for each water-alcohol solvent system. The fitted model parameters are listed in Table 2, with R 2 , MPD (mean percentage deviation), and RMSE (root mean square error). Where MPD and RMSE were calculated from Equations (9) and (10). The equations are as follows:
M P D = 100 N Σ i = 1 N | x A A x A A c a l x A A |
R M S E = Σ i = 1 N ( x A A c a l x A A ) 2 N
where N is the number of performed experiments, x A A and x A A c a l are the experimental and the predicted solubility values, respectively.
Using Equation (8) and model parameters, calculated solubility as a function of solvent composition and temperature, compared with experimental values (symbols), are shown as a surface plot in Figure 5. The colour contours show the range of solubility of ascorbic acid ( x A A ) varying with the temperature and solvent composition. The region mapped with yellow colour represents the span of high solubility of ascorbic acid corresponding to a higher temperature (T) and higher mole fraction of water in binary solvent systems ( x 1 ). Considering the values of MPD 0.5 and RMSE < 0.03 , the Jouyban-Acree model can be accurately employed to determine the solubility of ascorbic acid in solvent mixtures as a function of temperature and solvent composition.

4.3. Analysis of Thermodynamic Properties

Thermodynamic properties, such as change in dissolution enthalpy ( Δ H d i s s ), dissolution entropy ( Δ S d i s s ), and Gibbs free energy ( Δ G d i s s ), give information on the solute and solvent interaction and are crucial for predicting the system behaviour. The thermodynamic properties were determined using (i) Van’t Hoff model and (ii) Jouyban-Acree model parameters [39].

4.3.1. Estimation of Thermodynamic Properties Using Van’t Hoff Model

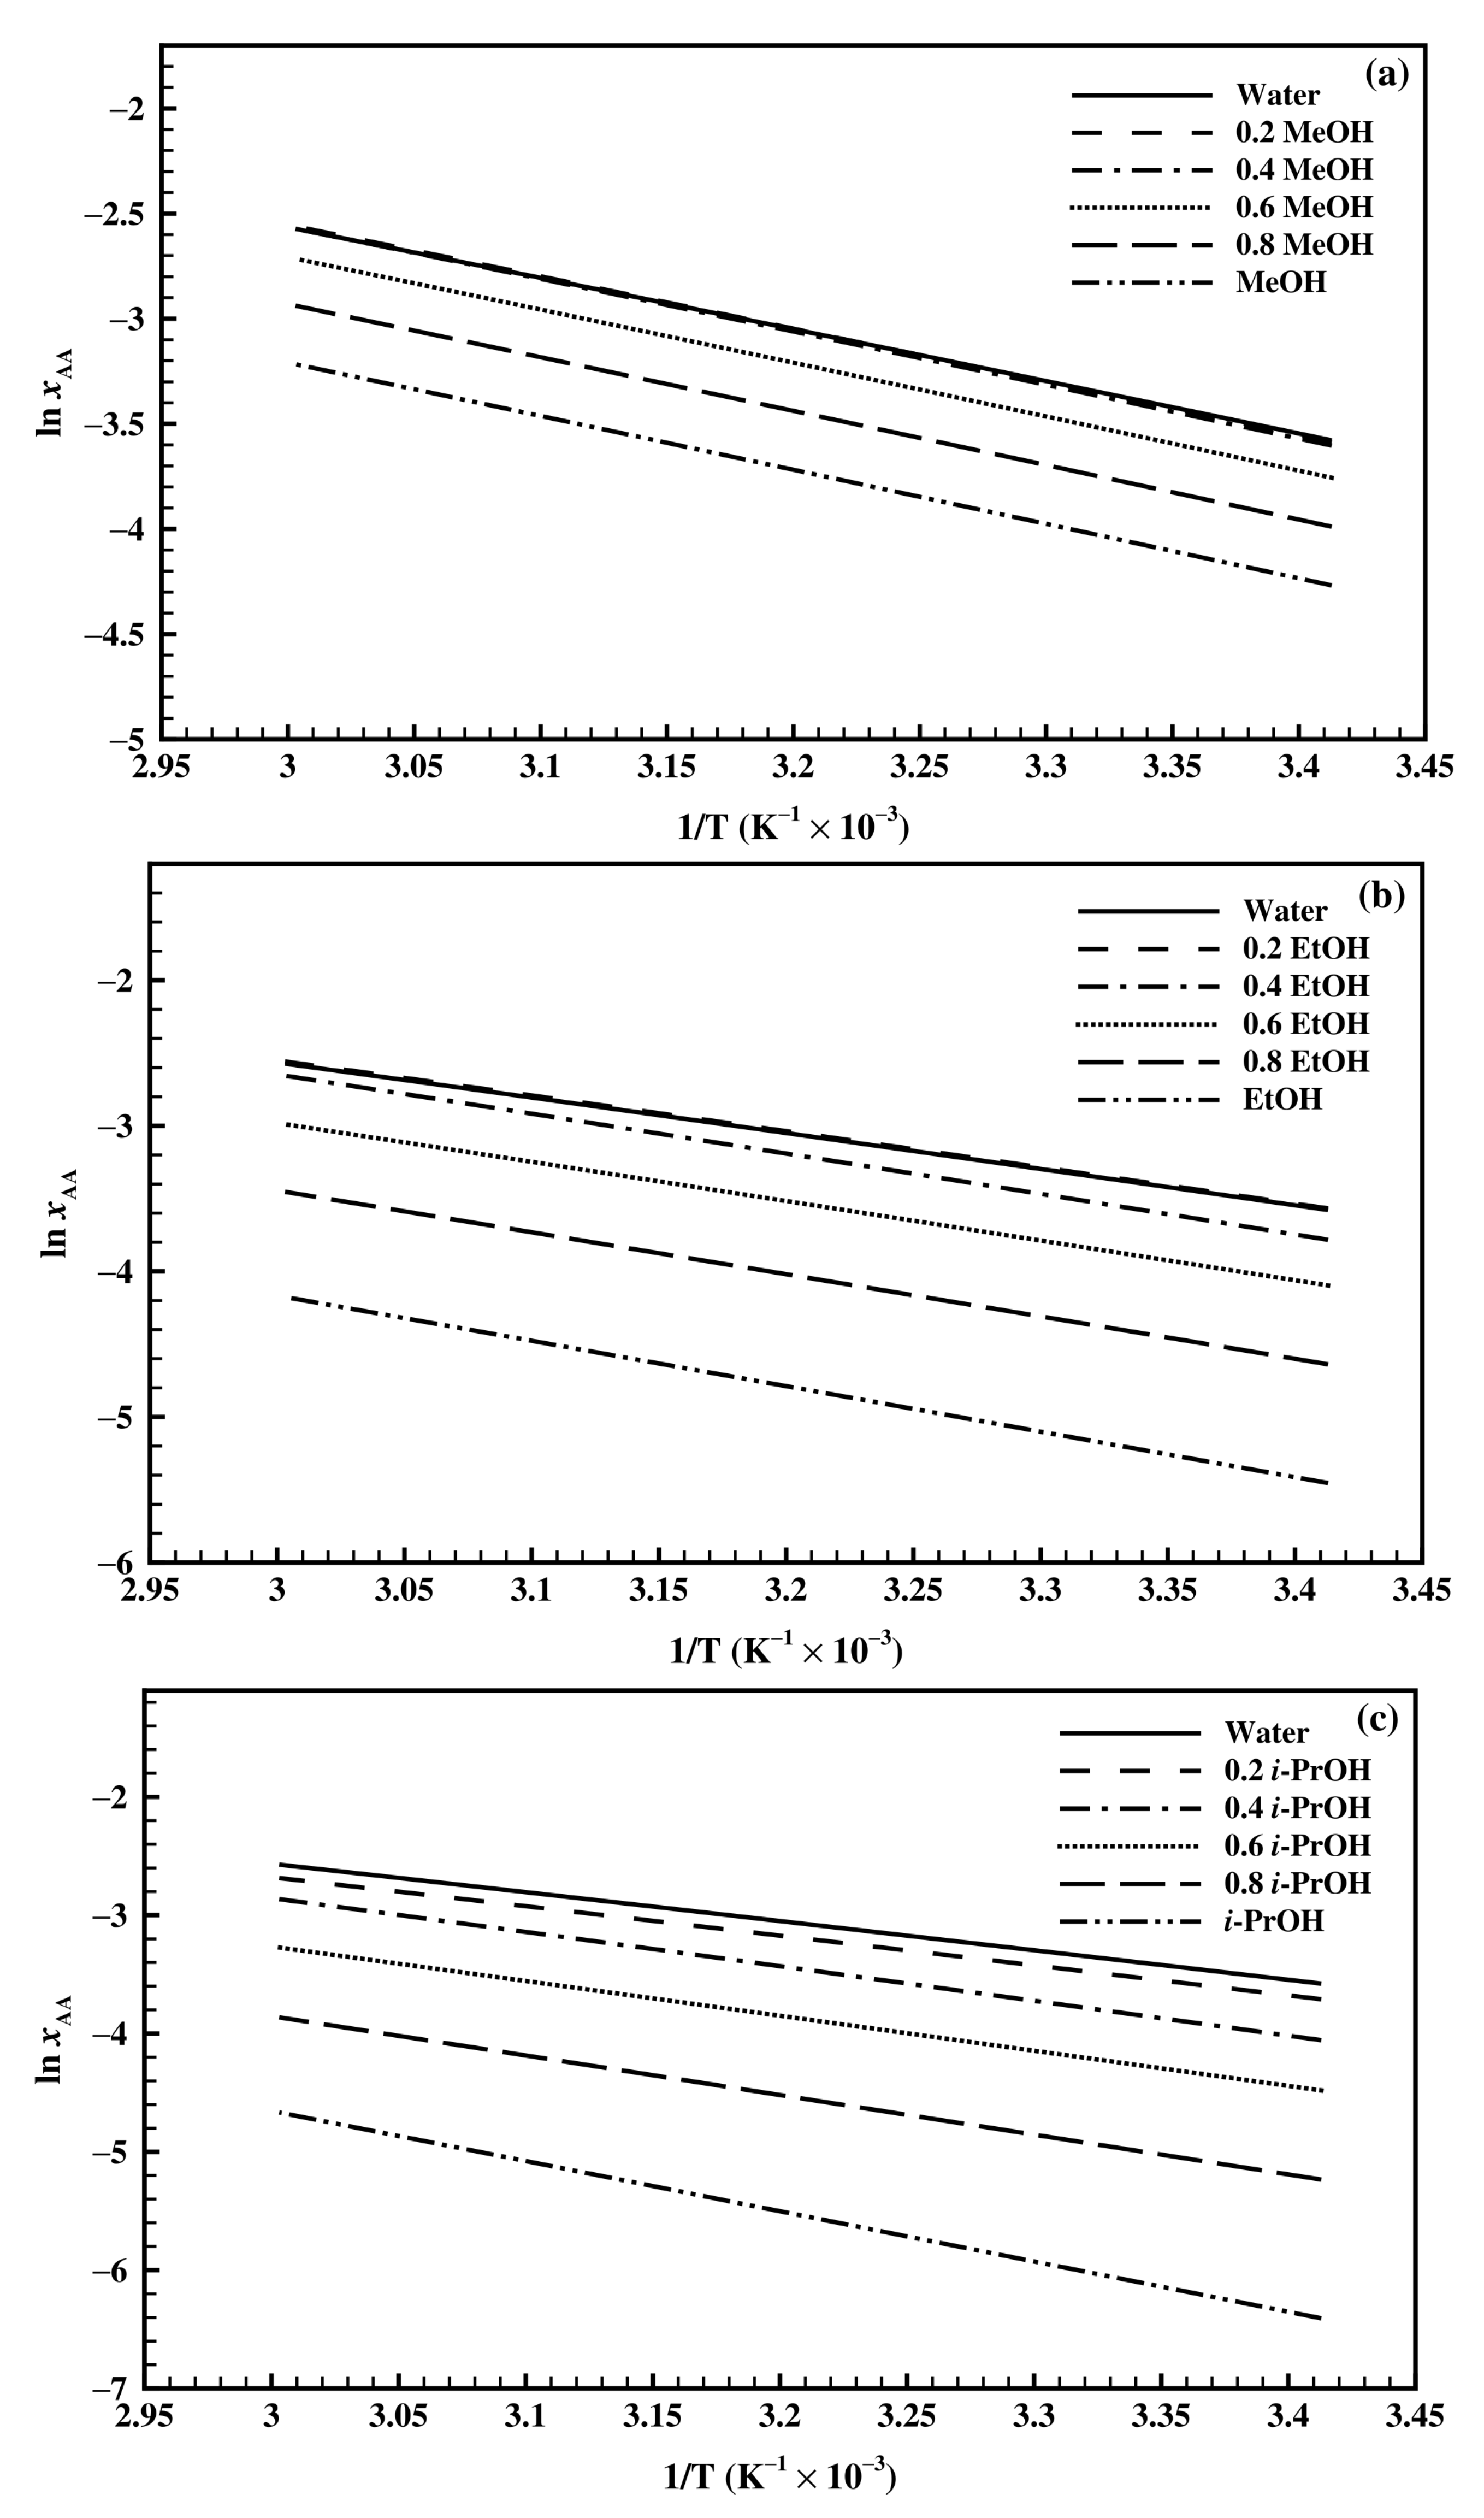
Van’t Hoff equation, given by Equation (11), was applied to plot l n ( x A A ) vs. 1 / T . From the plots (Figure 6), slope and intercept were estimated, representing apparent changes in the dissolution of enthalpy and entropy, respectively. Change in Gibbs free energy was calculated using Equation (12).
l n x A A = Δ H d i s s R T + Δ S d i s s R
Δ G d i s s = Δ H d i s s T Δ S d i s s
The evaluated values of Δ H d i s s , Δ S d i s s , and Δ G d i s s as a function of alcohol composition are given in Table 3. The positive values of Δ H d i s s indicate that dissolution of ascorbic acid in the solvent systems is an endothermic process, i.e., energy is required for the dissolution of the crystals. The lowest and highest values of enthalpy were obtained for water (20.52 kJ mol 1 ) and isopropanol (35.33 kJ mol 1 ), respectively. At the same time, the positive values of entropy imply that the dissolution of the crystals is entropy-driven and not a spontaneous process. The values of enthalpy and entropy increase with the increase in alcohol composition in the binary solvent system.

4.3.2. Estimation of Thermodynamic Properties Using Jouyban-Acree Model

According to the Jouyban-Acree model, thermodynamic properties are determined with model parameters using Equations (13)–(15) [35].
Δ H d i s s = R ( A 2 + A 4 x 1 + A 5 x 1 2 + A 6 x 1 3 + A 7 x 1 4 )
Δ S d i s s = R ( A 1 + A 3 x 1 )
Using Equations (13) and (14) in Equation (12), the change in Gibbs free energy is given:
Δ G d i s s = R T l n x A A
Figure 7 and Figure 8 show the plot of enthalpy and entropy values over the range of alcohol composition, using Jouyban-Acree model parameters (shown with dotted lines) in comparison with the properties estimated from Van’t Hoff plot (shown with symbols). Figure 7 shows a non-linear dependence of dissolution enthalpy on solvent composition [40]. At lower composition of alcohols, there is a marginal difference in enthalpy values estimated by the two models (Figure 7). With the further increase in alcohol composition in water-ethanol and water-isopropanol systems, enthalpy increases indicating a larger difference between the energy required to break the crystalline intermolecular forces and to form the hydrogen bonds between solute and solvent, whereas for the water-methanol system, there is no substantial change in enthalpy.
As shown in Figure 8, the entropy shows a linear dependence on the solvent composition according to Equation (14). It increases with an increase in alcohol composition in binary solvent systems. The entropy values from Van’t Hoff plot shows significant deviation from entropy determined using Jouyban-Acree model parameters. Overall, entropy increases with the increase in alcohol composition, indicating more energy is required to form an ideal solution at high alcohol composition.
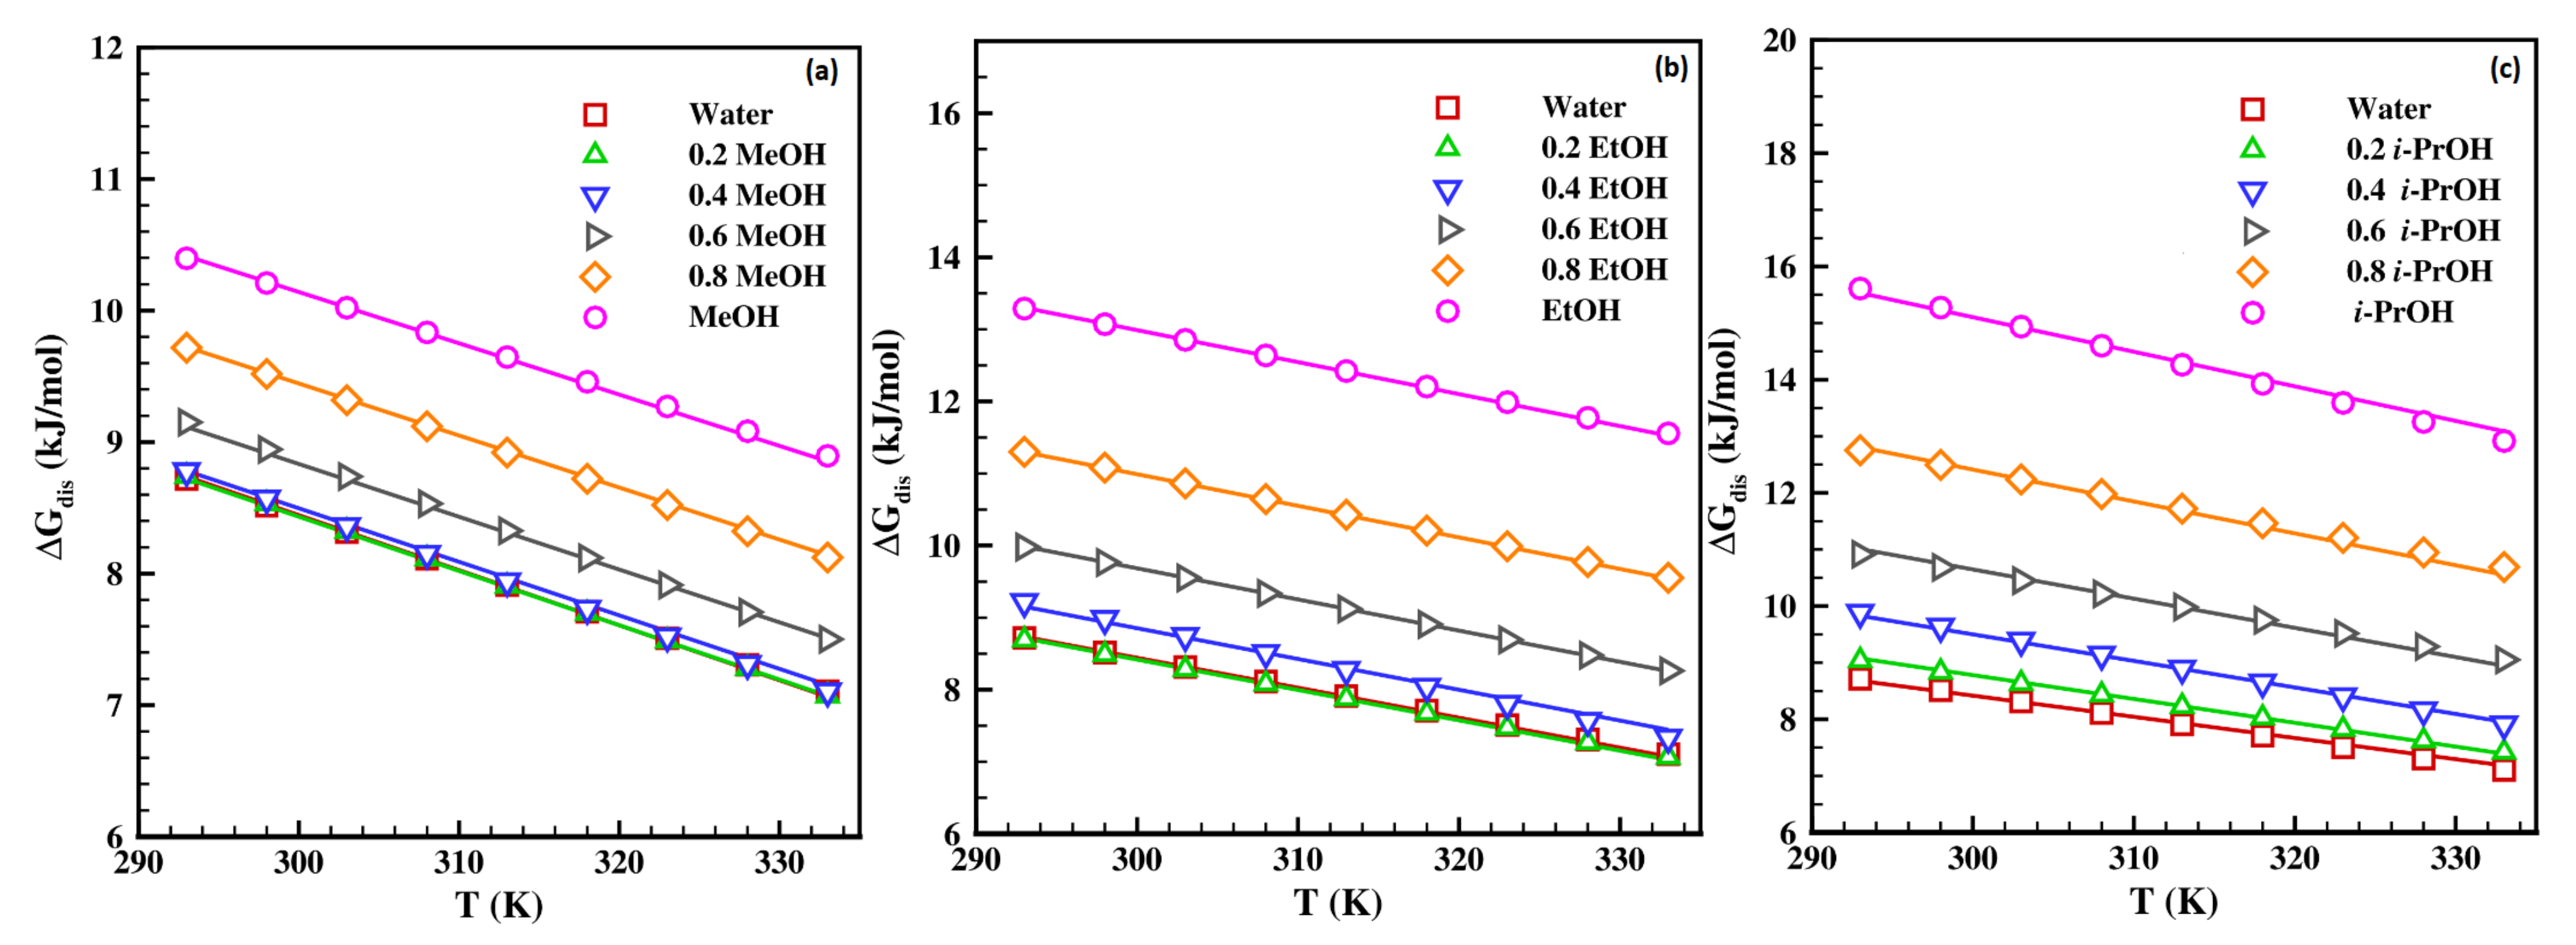
Gibbs free energy calculated by two methods is plotted in Figure 9. At constant temperature, as the composition of alcohol increases in a binary solvent system, Gibbs free energy increases. It is linearly dependent on l n x A A , with a negative slope, indicating low solubility of ascorbic acid in alcohols because of the high energy barrier. Gibbs free energy is a function of both enthalpy and entropy; nevertheless, the results plotted in Figure 9 show good agreement between the two methods, despite the variation in enthalpy and entropy values estimated by the two methods. In general, the dissolution enthalpy, entropy, and Gibbs energy increase with an increase in alcohol composition in binary solvent systems.

4.4. Effect of Solvent Composition on MSZW

The measurement of MSZW is essential as it reflects the nucleation kinetics of the system and defines the optimum supersaturation level required for the crystallization process [41]. To investigate the effect of solvent composition on MSZW, the MSZ limit was measured for all 16 solvent systems, represented by Van’t Hoff Equation (2). The equation coefficients and R 2 value for respective solvents are given in Table 1. The MSZW has been determined as the difference between the solubility curve and MSZ limit measure at 60 °C. The cooling rate and stirring speed were kept constant at 0.3 °C/min and 600 RPM, respectively, for all the experiments. To our knowledge, none of the studies on ascorbic acid has been reported for MSZW analysis of ascorbic acid in the binary solvent systems.
From Figure 10, the MSZW can be seen increasing with an increase in the alcohol composition for all three solvent systems. An increase in the MSZW indicates that higher supersaturation is required to initiate the primary nucleation. With the addition of alcohol the energy barrier for nucleation, determined by critical Gibbs free energy, increases [41]. The narrowest and widest MSZW were obtained for water and isopropanol, respectively, from all the solvent systems employed for crystallization, justifying the lowest and higher Gibbs free energy required to overcome the energy barrier to form nuclei.

4.5. Effect of Solvent Composition on Crystal Habit

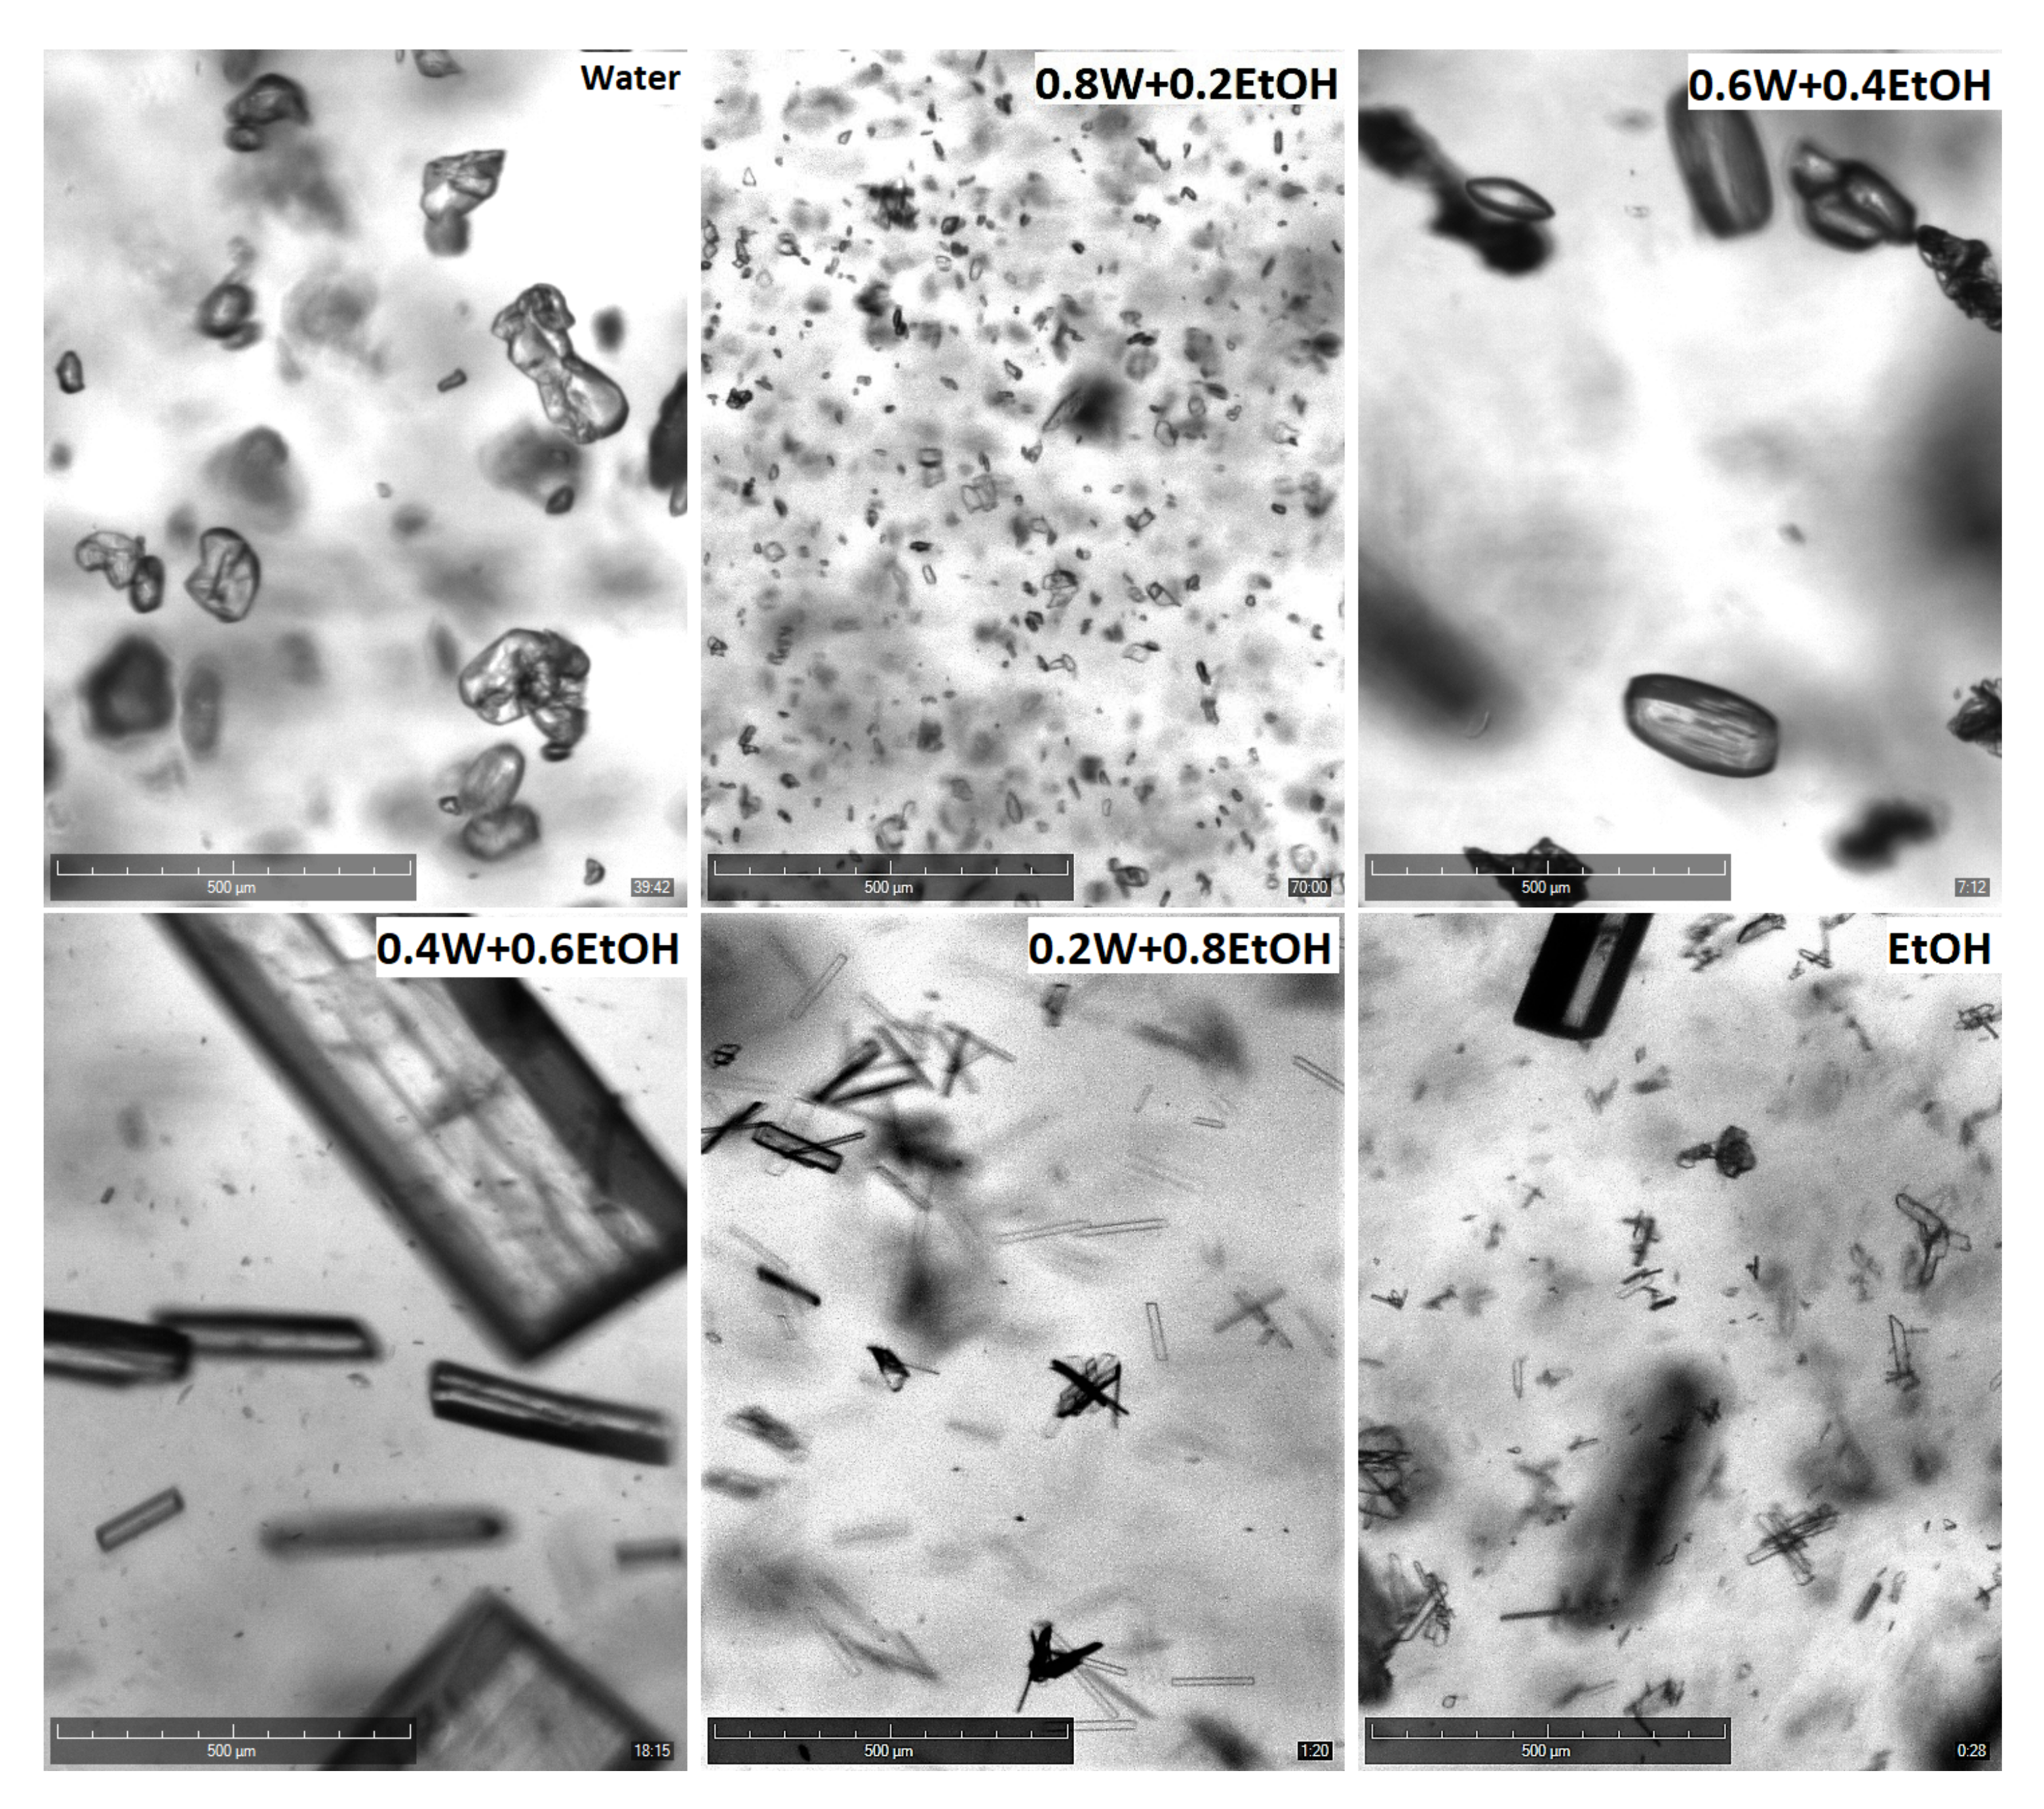
The crystal images captured during cooling crystallization at 20 °C are shown in Figure 11, Figure 12 and Figure 13 on a scale of 500 μ m in water-methanol, water-ethanol, and water-iso-propanol, respectively. The crystal habits can be noticed to be modified with the addition of alcohol in the aqueous solution. The formation of cubical or prism shaped crystals has been witnessed in water, whereas, the shapes of the crystals with prominent growth along one crystallographic axis resulting in lengthened prism-shaped crystals has been observed as the alcohol composition increases in the binary solvent system. The shape of ascorbic acid changed to an elongated prism shape in pure methanol and ethanol, and a needle shape in isopropanol.
The crystal habit is determined by the internal crystal structure and the growth rate mechanism of the crystal faces [11]. The distance between the polar solute molecules in a polar solvent such as water is smaller and regular, resulting in a compact structure with high inter-molecular forces when supersaturation is created by cooling. The formation of different shapes of crystals in alcohols can be further attributed to the change in the crystal growth mechanism. The addition of alcohols reduces the mass transfer rate and accelerates the surface integration step for crystal growth resulting in preferential growth along a crystallographic axis [16]. Ascorbic acid crystals formed in different solvents have the same polymorph regardless of the change in crystal habit. The XRD study conducted by Hassan et al. [11] and PXRD study conducted by Srinivasan and Devi [18] showed that ascorbic acid crystal is from a monoclinic system. Furthermore, Arslantas et al. studied the polymorph structure of L-ascorbic acid and could not discover different polymorphs of L-ascorbic acid and concluded to look for other factors affecting the kinetics of crystal growth [42]. The crystal habit observed for the pure solvents is in line with the previous studies [11,17,18]. To our knowledge, no data is available in the literature for crystal habit from binary solvents.

5. Conclusions

The solubility and MSZ limit of ascorbic acid were determined using the polythermal method in binary mixtures of water and alcohols (methanol/ethanol/ isopropanol). The solubility of ascorbic acid increases with temperature and decreases with increasing alcohol composition in all solvent systems. The surface plot of the predicted solubilities using the Jouyban–Acree model shows good agreement with the experimental values. The positive values of enthalpy and entropy indicate the dissolution of ascorbic acid is an endothermic and entropy-driven process, respectively. The enthalpy and entropy values increase with alcohol composition in binary solvent systems. The Gibbs free energy also shows an increasing trend with alcohol composition and a linear dependence on l n x A A with a negative slope. The higher Gibbs energy obtained at higher alcohol compositions signifies a high energy barrier for the dissolution of ascorbic acid in alcohols. MSZW became wider with an increase in alcohol composition, indicating high supersaturation required for nucleation of ascorbic acid in alcohols. From cooling crystallization experiments, the images depict a change in crystal habit, from cubic to elongated prism and needle shape, as the composition of alcohol increased in the solvent mixtures. The present study helps better understand the role of solvent composition in the crystallization of ascorbic acid for easier scale-up of ascorbic acid at the plant scale.

Author Contributions

Conceptualization, J.Y.; methodology, J.Y., D.G.D. and C.G.; software, J.Y. and D.G.D.; validation, D.G.D. and T.K.; investigation, D.G.D. and T.K.; resources, C.G.; writing—original draft preparation, J.Y.; writing—review and editing, J.Y., D.G.D., T.K. and S.A.P.; visualization, C.G. and S.A.P.; project administration, C.G. and S.A.P.; funding acquisition, C.G. All authors have read and agreed to the published version of the manuscript.

Funding

This research received no external funding.

Institutional Review Board Statement

Not applicable.

Informed Consent Statement

Not applicable.

Data Availability Statement

Not applicable.

Conflicts of Interest

The authors declare no conflict of interest.

Abbreviations

The following abbreviations are used in this manuscript:
EtOH Ethanol
Exp. Experimental
i-PrOH Iso-propanol
MeOH Methanol
MPD Mean percentage deviation
MSZW Metastable zone width
RMSE Root mean square error
W Water

References

  1. Grosso, G.; Bei, R.; Mistretta, A.; Marventano, S.; Calabrese, G.; Masuelli, L.; Giganti, M.G.; Modesti, A.; Galvano, F.; Gazzolo, D.; et al. Effects of vitamin C on health: A review of evidence. Front. Biosci. (Landmark Ed.) 2013, 18, 1017–1029. [Google Scholar] [PubMed]
  2. Sorice, A.; Guerriero, E.; Capone, F.; Colonna, G.; Castello, G.; Costantini, S. Ascorbic acid: Its role in immune system and chronic inflammation diseases. Mini Rev. Med. Chem. 2014, 14, 444–452. [Google Scholar] [CrossRef] [PubMed]
  3. Reichstein, T.; Grussner, A. Productive synthesis of l-ascorbic acid, vitamin C. Helv. Chim. Acta 1934, 17, 311–328. [Google Scholar] [CrossRef]
  4. Rucker, R.B.; Zempleni, J.; Suttie, J.W.; McCormick, D.B. Handbook of Vitamins; CRC Press: Boca Raton, FL, USA, 2007. [Google Scholar]
  5. Karunanithi, A.T.; Achenie, L.E. Solvent design for crystallization of pharmaceutical products. In Computer Aided Chemical Engineering; Elsevier: Amsterdam, The Netherlands, 2007; Volume 23, pp. 115–147. [Google Scholar]
  6. Sheraz, M.; Khan, M.F.; Ahmed, S.; Kazi, S.H.; Ahmad, I. Stability and stabilization of ascorbic acid. Househ. Pers. Care Today 2015, 10, 22–25. [Google Scholar]
  7. Yuan, J.P.; Chen, F. Degradation of ascorbic acid in aqueous solution. J. Agric. Food Chem. 1998, 46, 5078–5082. [Google Scholar] [CrossRef]
  8. Ribeiro Neto, A.C.; Pires, R.F.; Malagoni, R.A.; Franco Jr, M.R. Solubility of vitamin C in water, ethanol, propan-1-ol, water+ ethanol, and water+ propan-1-ol at (298.15 and 308.15) K. J. Chem. Eng. Data 2010, 55, 1718–1721. [Google Scholar] [CrossRef]
  9. Li, Y.; Farajtabar, A.; Hongkun, Z. Preferential solvation of vitamin C in binary solvent mixtures formed by methanol, ethanol, n-propanol, isopropanol and water. J. Solut. Chem. 2019, 48, 200–211. [Google Scholar] [CrossRef]
  10. Galvão, A.C.; Robazza, W.S.; Bianchi, A.D.; Matiello, J.A.; Paludo, A.R.; Thomas, R. Solubility and thermodynamics of vitamin C in binary liquid mixtures involving water, methanol, ethanol and isopropanol at different temperatures. J. Chem. Thermodyn. 2018, 121, 8–16. [Google Scholar] [CrossRef]
  11. Hassan, S.; Adam, F.; Bakar, M.A.; Mudalip, S.A. Evaluation of solvents’ effect on solubility, intermolecular interaction energies and habit of ascorbic acid crystals. J. Saudi Chem. Soc. 2019, 23, 239–248. [Google Scholar] [CrossRef]
  12. Wierzbowska, B.; Matynia, A.; Piotrowski, K.; Koralewska, J. Solubility and nucleation in l (+)-ascorbic acid–methanol–ethanol–water system. Chem. Eng. Process. Process. Intensif. 2007, 46, 351–359. [Google Scholar] [CrossRef]
  13. Nemdili, L.; Guedjali, R.; Habchi, S.; Mameri, F.; Koutchoukali, O.; Dehane, A.; Merouani, S. Ascorbic Acid Solubility and Thermodynamic Characteristics in Several Neat Solvents with Temperatures Ranging from 293 to 313 K. Int. J. Thermophys. 2022, 43, 1–19. [Google Scholar] [CrossRef]
  14. Omar, W.; Ulrich, J. Effect of the addition of alcoholic miscible co-solvents on the properties of ascorbic acid in its supersaturated aqueous solution. Cryst. Res. Technol. J. Exp. Ind. Crystallogr. 2006, 41, 431–436. [Google Scholar] [CrossRef]
  15. Omar, W. Effect of solvent composition on crystallization process of ascorbic acid. Chem. Eng. Technol. Ind. Chem. Plant Equip. Process. Eng. Biotechnol. 2006, 29, 119–123. [Google Scholar] [CrossRef]
  16. Wierzbowska, B.; Piotrowski, K.; Koralewska, J.; Matynia, A. Growth Kinetics of Vitamin C Crystals in a Batch L (+)-Ascorbic Acid–Methanol–Ethanol–Water System: Size Independent Growth Model Approach. Chem. Biochem. Eng. Q. 2008, 22, 327–337. [Google Scholar]
  17. Arslantaş, A.; Ermler, W.C.; Yazici, R.; Kalyon, D.M. Crystal habit modification of vitamin C (L-ascorbic acid) due to solvent effects. Turk. J. Chem. 2004, 28, 255–270. [Google Scholar]
  18. Srinivasan, K.; Vanitha Devi, K. Characterization of L-ascorbic acid single crystals grown from solution with different solvents. Cryst. Res. Technol. 2010, 45, 946–952. [Google Scholar] [CrossRef]
  19. Hassan, S.; Adam, F.; Bakar, M.A. Thermal Characteristic Evaluation of Different Ascorbic Acid Crystal Habits. J. Chem. Eng. Ind. Biotechnol. 2018, 3, 50–59. [Google Scholar] [CrossRef]
  20. Hiatt, A.N.; Taylor, L.S.; Mauer, L.J. Influence of simultaneous variations in temperature and relative humidity on chemical stability of two vitamin C forms and implications for shelf life models. J. Agric. Food Chem. 2010, 58, 3532–3540. [Google Scholar] [CrossRef]
  21. Crystal16, Operating Parameters. Available online: https://www.crystallizationsystems.com/crystal16/operating-parameters-crystal16/winnt/kernel.htm (accessed on 7 October 2022).
  22. Turner, T.; Corzo, D.; Toroz, D.; Curtis, A.; Dos Santos, M.; Hammond, R.; Lai, X.; Roberts, K. The influence of solution environment on the nucleation kinetics and crystallisability of para-aminobenzoic acid. Phys. Chem. Chem. Phys. 2016, 18, 27507–27520. [Google Scholar] [CrossRef] [Green Version]
  23. Maosoongnern, S.; Flood, A.E. Validation of models predicting nucleation rates from induction times and metastable zone widths. Chem. Eng. Technol. 2018, 41, 2066–2076. [Google Scholar] [CrossRef]
  24. Li, W.W.; Spix, L.; De Reus, S.C.; Meekes, H.; Kramer, H.J.; Vlieg, E.; Ter Horst, J.H. Deracemization of a racemic compound via its conglomerate-forming salt using temperature cycling. Cryst. Growth Des. 2016, 16, 5563–5570. [Google Scholar] [CrossRef] [Green Version]
  25. Braun, D.E.; Oberacher, H.; Arnhard, K.; Orlova, M.; Griesser, U.J. 4-Aminoquinaldine monohydrate polymorphism: Prediction and impurity aided discovery of a difficult to access stable form. CrystEngComm 2016, 18, 4053–4067. [Google Scholar] [CrossRef] [PubMed] [Green Version]
  26. Black, S.; Dang, L.; Liu, C.; Wei, H. On the measurement of solubility. Org. Process. Res. Dev. 2013, 17, 486–492. [Google Scholar] [CrossRef]
  27. Moreno-Leon, C.; Mack, C.; Roy, S.; ter Horst, J.H. Solubility Analysis of 18 Active Pharmaceutical Ingredients and Intermediates in the non–Polar Solvents Dioxane, Toluene and Cyclopentyl Methyl Ether. J. Mol. Liq. 2022, 367, 120365. [Google Scholar] [CrossRef]
  28. Crystalline, Operating Parameters. Available online: https://www.crystallizationsystems.com/crystalline/operating-parameters-crystalline/winnt/kernel.htm (accessed on 7 October 2022).
  29. Klapwijk, A.R.; Simone, E.; Nagy, Z.K.; Wilson, C.C. Tuning crystal morphology of succinic acid using a polymer additive. Cryst. Growth Des. 2016, 16, 4349–4359. [Google Scholar] [CrossRef] [Green Version]
  30. Kort, A.K.; Lorenz, H.; Seidel-Morgenstern, A. Physical–Chemical Properties of the Chiral Fungicide Fenamidone and Strategies for Enantioselective Crystallization. Chirality 2016, 28, 514–520. [Google Scholar] [CrossRef]
  31. Poornachary, S.K.; Han, G.; Kwek, J.W.; Chow, P.S.; Tan, R.B. Crystallizing micronized particles of a poorly water-soluble active pharmaceutical ingredient: Nucleation enhancement by polymeric additives. Cryst. Growth Des. 2016, 16, 749–758. [Google Scholar] [CrossRef]
  32. Jouyban, A.; Chan, H.K.; Chew, N.Y.K.; Khoubnasabjafari, M.; Acree Jr, W.E. Solubility prediction of paracetamol in binary and ternary solvent mixtures using Jouyban–Acree model. Chem. Pharm. Bull. 2006, 54, 428–431. [Google Scholar] [CrossRef] [Green Version]
  33. Jouyban, A.; Nozohouri, S.; Martinez, F. Solubility of celecoxib in {2-propanol (1)+ water (2)} mixtures at various temperatures: Experimental data and thermodynamic analysis. J. Mol. Liq. 2018, 254, 1–7. [Google Scholar] [CrossRef]
  34. Zhang, J.; Yang, X.; Han, Y.; Li, W.; Wang, J. Measurement and correlation for solubility of levofloxacin in six solvents at temperatures from 288.15 to 328.15 K. Fluid Phase Equilibria 2012, 335, 1–7. [Google Scholar] [CrossRef]
  35. Song, L.; Wei, L.; Si, T.; Guo, H.; Yang, C. Solution thermodynamics of creatine monohydrate in binary (water+ ethanol) solvent systems at T=(278.15 to 328.15) K. J. Chem. Thermodyn. 2016, 92, 139–145. [Google Scholar] [CrossRef]
  36. Luo, M.; Liu, C.; Xue, J.; Li, P.; Yu, J. Determination of metastable zone width of potassium sulfate in aqueous solution by ultrasonic sensor and FBRM. J. Cryst. Growth 2017, 469, 144–153. [Google Scholar] [CrossRef]
  37. Apelblat, A.; Manzurola, E. Solubility of ascorbic, 2-furancarboxylic, glutaric, pimelic, salicylic, and o-phthalic acids in water from 279.15 to 342.15 K, and apparent molar volumes of ascorbic, glutaric, and pimelic acids in water at 298.15 K. J. Chem. Thermodyn. 1989, 21, 1005–1008. [Google Scholar] [CrossRef]
  38. Shalmashi, A.; Eliassi, A. Solubility of L-(+)-ascorbic acid in water, ethanol, methanol, propan-2-ol, acetone, acetonitrile, ethyl acetate, and tetrahydrofuran from (293 to 323) K. J. Chem. Eng. Data 2008, 53, 1332–1334. [Google Scholar] [CrossRef]
  39. Fathi-Azarbayjani, A.; Abbasi, M.; Vaez-Gharamaleki, J.; Jouyban, A. Measurement and correlation of deferiprone solubility: Investigation of solubility parameter and application of van’t Hoff equation and Jouyban–Acree model. J. Mol. Liq. 2016, 215, 339–344. [Google Scholar] [CrossRef]
  40. Ángeles Peña, M.; Sánchez, A.B.; Escalera, B.; Jouyban, A.; Martinez, F. Thermodynamic Analysis for the Solubility of Allopurinol in Aqueous and Non-aqueous Mixtures at Various Temperatures. Int. J. Thermophys. 2022, 43, 1–21. [Google Scholar] [CrossRef]
  41. Kashchiev, D.; Verdoes, D.D.; van Rosmalen, G.M. Review: Nucleation in solutions revisited. Cryst. 2003, 38, 7–8. [Google Scholar] [CrossRef]
  42. Arslantas, A.; Ermler, W.C.; Yazici, R.; Kalyon, D.M. Study of polymorph prediction for L-ascorbic acid. Int. J. Mol. Sci. 2005, 6, 291–302. [Google Scholar] [CrossRef]
Figure 1. Structure of ascorbic acid.
Crystals 12 01798 g001
Figure 2. (a) Detection of clear and cloud points, (b) Solubility curve and MSZ limit.
Crystals 12 01798 g002
Figure 3. Experimentally measured solubility of ascorbic acid in different solvents comparison with published work [37,38]. Solid lines represents fitted solubility curves using Equation (8) in respective solvents.
Crystals 12 01798 g003
Figure 4. Solubility of ascorbic acid in binary solvent systems (a) Water-Methanol, (b) Water-Ethanol and (c) Water-Isopropanol. Symbols represent the clear points and solid line represents the Van’t Hoff equation (Equation (2)).
Crystals 12 01798 g004
Figure 5. Surface plot of solubility versus solvent composition and temperature using the Jouyban-Acree model for three water-alcohol systems. The symbols represent the experimental solubility.
Crystals 12 01798 g005
Figure 6. Van’t Hoff plot for (a) Water-Methanol, (b) Water-Ethanol and (c) Water-Isopropanol.
Crystals 12 01798 g006
Figure 7. Change in dissolution enthalpy with alcohol composition in binary solvent systems. Symbols: Enthalpy using Van’t Hoff (Equation (11)); Dotted lined: Enthalpy using Jouyban-Acree model (Equation (13)).
Crystals 12 01798 g007
Figure 8. Change in dissolution entropy with alcohol composition in binary solvent systems. Symbols: Enthalpy using Van’t Hoff (Equation (11)); Dotted lined: Entropy using Jouyban-Acree model (Equation (14)).
Crystals 12 01798 g008
Figure 9. Plot of change in Gibbs free energy with alcohol composition in: (a) Water-Methanol, (b) Water-Ethanol and (c) Water-Isopropanol binary solvent system. Symbols: Enthalpy using Van’t Hoff (Equation (12)); Solid lined: Enthalpy using Jouyban-Acree model parameters (Equation (15)).
Crystals 12 01798 g009
Figure 10. Plot of MSZW with alcohol composition in three binary solvent systems.
Crystals 12 01798 g010
Figure 11. Images of ascorbic acid crystals in water-methanol solvent systems (scale: 500 μ m).
Crystals 12 01798 g011
Figure 12. Images of ascorbic acid crystals in water-ethanol solvent systems (scale: 500 μ m).
Crystals 12 01798 g012
Figure 13. Images of ascorbic acid crystals in water-iso-propanol solvent systems (scale: 500 μ m).
Crystals 12 01798 g013
Table 1. Coefficients of Equation (8) representing solubility curve and MSZ limit.
x 2 Solubility CurveMSZ Limit
AB R 2 AB R 2
Water/Methanol
014.44−2577.800.9629.42−864.550.919
0.214.38−2631.410.98710.10−1115.910.948
0.414.21−2643.190.9799.69−1058.670.975
0.613.92−2649.260.9939.74−1149.050.904
0.813.55−2649.660.9959.04−1041.110.904
113.09−2630.460.9995.76−168.970.883
Water/Ethanol
014.44−2577.800.9629.42−864.550.919
0.214.12−2590.050.99510.45−1244.190.982
0.414.59−2871.970.99211.62−1691.990.926
0.613.77−2787.060.9959.81−1315.760.998
0.813.58−2944.810.9868.28−1042.090.950
113.39−3145.990.9627.87−1113.310.865
Water/Isopropanol
014.44−2577.800.9629.42−864.550.919
0.213.92−2610.610.9737.94−558.750.955
0.414.59−3009.050.98410.23−1396.320.967
0.613.92−3012.340.9958.65−1112.250.915
0.814.23−3384.240.9777.68−4265.160.922
115.90−4265.160.9526.77−1032.280.833
Table 2. Jouyban-Acree model parameters (Equation (8)).
ParametersWater-MeOHWater-EtOHWater-i-PrOH
A 1 4.6915.3397.348
A 2 −2627−3164−4021
A 3 0.342−0.338-2.850
A 4 272.515782833
A 5 433.4−1570−2027
A 6 −121510851229
A 7 610.6−444.8−375.9
R 2 0.990.990.99
MPD0.2160.2460.503
RMSE0.00910.01280.0264
Table 3. Thermodynamic properties of ascorbic acid in three water-alcohol systems using Van’t Hoff plot.
x 2 Δ H diss Δ S diss Δ G diss
(kJ mol 1 ) (J mol 1 K 1 ) (kJ mol 1 )
293298303308313318323328333
Water/Methanol
020.5240.308.7278.5268.3148.1137.9127.7107.5097.3077.106
0.220.9541.688.7398.5318.3238.1147.9067.6977.4897.2817.072
0.421.0640.348.7808.5718.3618.1527.9427.7337.5237.3147.104
0.621.2341.249.1508.9448.7388.5328.3268.1197.9137.7077.501
0.821.4039.879.7179.5189.3199.1198.9208.7218.5218.3228.122
121.4037.5410.4010.2110.029.8349.6469.4589.2719.0838.895
Water/Ethanol
020.5240.308.7178.5168.3148.1137.9127.7107.5097.3077.106
0.220.6140.688.6928.4898.2858.0827.8797.6757.4727.2687.065
0.423.0147.069.2178.9818.7498.5118.2768.0407.8057.5707.334
0.622.5642.949.9809.7659.5509.3369.1218.9068.6928.4778.262
0.824.0943.6711.3011.0810.8610.6410.4310.219.9909.7719.553
125.9643.2613.2913.0712.8512.6412.4212.2111.9911.7711.56
Water/Isopropanol
020.5240.308.7178.5168.3148.1137.9127.7107.5097.3077.106
0.220.8940.469.0398.8378.6358.4338.2308.0287.8267.6247.421
0.424.3049.219.2178.9818.7468.5118.2768.0407.8057.5707.334
0.624.5746.6110.9210.6810.4510.229.9849.7519.5189.2859.052
0.827.8751.5812.7512.4912.2411.9811.7211.4611.2110.9510.69
135.3367.3215.6115.2714.9414.6014.2613.9313.5913.2512.92
Publisher’s Note: MDPI stays neutral with regard to jurisdictional claims in published maps and institutional affiliations.