1. Introduction
Broadband dielectric spectroscopy (BDS) allows one to study the dielectric relaxation of any disordered system, comprising polar molecules with some degree of orientational freedom, i.e., a gradual return of a system to its equilibrium state after removal of the external disturbance, such as the electric field. Then, one registers a complex dielectric permittivity as a function of the frequency of the electric field
f and, for example, temperature
T, i.e.,
, where the real part of the complex dielectric permittivity describes the transport of energy and the imaginary part of the complex dielectric permittivity–dissipation of energy. In general, at a selected temperature, dielectric spectra are complex in thermodynamic phases, and one obtains information about contributions to the complex dielectric permittivity from: the relaxation process (or processes)
, electric conductivity
and, in some cases, electrode polarization of electrodes
. Then, the general formula is used [
1,
2]
where
is the dielectric permittivity at the high-frequency limit,
is the permittivity of the vacuum. The electric conductivity
is a complex quantity, i.e.,
. For the ohmic conductivity, the real part of the conductivity does not depend on the frequency (is constant), and the imaginary part of the electric conductivity equals zero. For non-ohmic conductivity (dependent on frequency), the imaginary part of the electric conductivity takes values much lower than the real part and, concomitantly, the contribution to the real part of the permittivity, which means the quantity
is much smaller than contributions from the relaxation process (or processes) and electrode polarization of the electrodes; thus, this term is omitted in analyses.
The relaxation process (or processes) can be described by several models, such as in Debye [
1,
2,
3], Cole–Cole [
1,
2,
4], Cole–Davidson [
1,
2,
5,
6], Havriliak–Negami [
1,
2,
7], Dissado–Hill [
2,
8,
9], etc. Regarding the description of electric conductivity
, two models are used, mainly, i.e., phenomenological Jonscher model [
10], later modified [
11], or Dyre model [
12,
13]. The former model gives the dependence of the real part of the electric conductivity on the frequency, i.e.,
where
is the electric conductivity independent of frequency (called DC conductivity),
is a cross-over frequency between a constant part (a low-frequency part) of the electric conductivity and the conductivity dependent on frequency (a high-frequency part), and
s is an exponent taking values
. The higher the value of the exponent
s, the stronger the interactions between charge carriers. Equation (2) fits the electric conductivity data reasonably well (for example, see [
2] and references cited therein), but it lacks a theoretical foundation.
The random free energy barrier model proposed by Dyre is more general and takes the following form [
12,
13]
where
is a constant factor (for frequency tending to zero, it is a DC conductivity), and
is an average time connected with the attempt frequency to overcome the largest barrier determining the DC conductivity. Dyre assumed that electric conductivity takes place by the hopping of charge carriers in a spatially randomly varying energy landscape. Equation (3) can be easily split into the real part
and the imaginary part
The electrode polarization is an unwanted effect during dielectric experiments. At low frequencies, the real part of the dielectric permittivity increases with decreasing frequencies. The molecular origin of the electric polarization of electrodes is a partial or a whole blocking of charge carriers at the interface between the sample and electrode areas. As a consequence, it leads to a separation of positive and negative charges, giving rise to an additional polarization, and at the same time, it lowers the conductivity in the low-frequency region. Thus, the real part of the electric conductivity given by Equations (2) or (4) should be diminished by some term
[
14] that, in general, can be approximated by a power law. In the same way, the quantity proportional to the electric capacity
is described by a power law [
2,
15,
16,
17].
The dielectric response of various molecular systems, i.e., (i) liquid crystal compounds as 4′-butyl-4-(2-methylbutoxy) azoxybenzene (4ABO5*) [
16,
18,
19,
20,
21], 4-ethyl-4′-octylazoxybenzene (4EOB) [
20,
21,
22], 4-bromobenzylidene-4′-pentyloxyaniline (5BBAA) [
20,
21,
23], 4-bromobenzylidene-4′-hexyloxyaniline (6BBAA) [
20,
21,
23]; (ii) pharmacological compound 3-ethyl-3-methylperrolidine-2,5-dione, known as ethosuximide (ETX) [
17,
24]; (iii) dimethylbutanol (DMB) isomers [
25,
26,
27,
28,
29,
30,
31,
32,
33] such as 2,2-dimethylbutan-1-ol (22DM1B) [
25,
26,
27,
28,
29,
30,
31,
32], 3,3-dimethylbutan-1-ol (33DM1B) [
25,
26,
27,
31,
32,
33], 3,3-dimethylbutan-2-ol (33DM2B) [
25,
26,
27,
30,
31,
33]; (iv) cyclohexanediol (CH-diol) isomers [
34,
35,
36,
37,
38,
39,
40,
41,
42] such as
trans-1,2-cyclohexanediol (T12C) [
34,
35,
36,
37,
38,
39,
40,
42],
cis-1,2-cyclohexanediol (C12C) [
34,
35,
36,
38,
39,
40,
41,
42],
cis-1,3-cyclohexanediol (C13C) [
40,
42],
trans-1,2-cyclohexanediol (T13C) [
40,
42], is studied in different thermodynamic phases. Behavior of the dielectric conductivity and the electrode depolarization phenomena are studied in detail for the mentioned compounds, whereas the relaxation processes for some selected materials are described elsewhere [
16,
17,
22,
23,
29,
42]. It will be shown that the temperature dependencies of the electric conductivity and/or the quantity describing the electrode polarization effect can be treated as the markers of phase transitions. The values of the exponents
n and
m not only describe the mechanism of the electric conductivity or the blocking of electrodes by ions, respectively, but they also allow one for an “identification” of thermodynamic phases.
2. Theoretical Background
Jonscher proposed the equation describing the real part of the electric conductivity being the sum of DC and AC conductivity, which is Equation (2). The DC and AC conductions are based on the same mechanism of charge transport; for example, see [
2] and references cited therein. In general, we use the nomenclatures “the DC conductivity” and “the AC conductivity” in the meaning of “(a part of) the electric conductivity independent of frequency” and “(a part of) the electric conductivity depending on frequency”, respectively. The DC conductivity, in the Jonscher model, Equation (2), is obtained for frequency tending to zero, and it is
The frequency-dependent electric conductivity in the Jonscher model [
11] is
The DC conductivity in the Dyre model, Equation (4), is
while the AC conductivity, for frequency
, is given by the following equation
The real part of the electric conductivity, given by Equation (9), can be described by the power law of the angular frequency with exponents depending on frequency,
, in the form
with
One can easily find that for frequency tending to infinity, the exponent
s, Equation (11), tends to one. For frequencies from the range
, for
N = 3 or 4, i.e., it is the range of frequencies achieved in most BDS experiments, and one can fit the power law to the real part of the electric conductivity, i.e.,
with the experimentally obtained exponent
within the range
.
Comparing Equation (6) with Equation (8), and Equation (7) with Equation (12), one obtains that the DC conductivity for these two models is described by a constant value and the AC conductivity, by the power law of the angular frequency with the exponent taking a value between zero and one.
Occurrence of the electrode polarization phenomenon (mainly for frequencies lower than 10
3 Hz, but it depends on thermodynamic phase types) leads to the formation of three layers in the measured volumes of all samples, i.e., two at the interfaces between the sample and the electrode areas (blocking charge carriers) and a much thicker bulk-free sample between them. The layers close to the electrodes have the same properties, and they are treated as one layer; thus, such a model is named “a double layer” model. The summed thicknesses of the layers close to the electrodes are much smaller than the thickness of the layer between them, for example see [
2,
43]. The contribution of the electrode polarization to the real part of the dielectric permittivity
is modeled within the fractal model (for example see [
2] and references cited therein), but most of these models lead to the power law in the following form
with the exponent
m1 lower than one and
being the constant factor (depending on external parameters such as temperature, pressure, etc.). Then, the contribution of the electrode polarization to the real part of the dielectric permittivity
, the fourth term on the right-hand side of Equation (1), takes the following form
where
[
1,
2,
15,
16,
17,
44,
45]. The exponent
m is about 1.5–1.7 in the isotropic liquid (IL) phase for ionic liquid compounds [
46,
47,
48], and it can depend on the material the electrodes are made from [
49]. From the theoretical point of view, for the case of the wholly blocked electrodes, one can expect
in the IL phase [
46,
47,
50,
51]. However, when the electrodes are partially blocked, the exponent
m (in the IL phase) should fulfil the inequality
[
52], or when one observes only a “high”-frequency contribution from this process (a part of this process), then the exponent
m should be less than two [
46,
47]. Values of the exponent
m obtained from experimental data are for the ionic liquid compounds in the IL phase mostly. In the literature, there are only a few results for weakly or moderately conducting materials showing the electric polarization of the electrode effect [
2,
16,
17,
42,
53]. The exponent
m is higher than the one for the IL phase (about 1.4–1.7) [
2,
16,
17,
22,
42,
53], being in accordance with previously cited results, and it is close to one for the nematic (N) or cholesteric (chiral nematic, Ch or N*) phases [
15,
16,
17,
22,
53]. It is lower than one for crystal-like phases in which interactions between charge carriers exist [
2,
16,
17,
22,
42,
53], and it is close to one for crystal-like phases with no (or weak) interaction between charge carriers.
The presence of the electrode polarization phenomena leads to a lowering of the electric conductivity values [
2]. Then, the electric conductivity is
where
i =
J (for Jonscher model),
D (for Dyre model) or any equivalent model of electric conductivity, and
can be, in general, fitted by the power law
The wholly blocked surface area shows that Equation (15) is rewritten in the following form [
46,
50]
where
h is a half distance between the electrode areas,
D is the mean ion diffusion coefficient, and
is the Debye length. Equation (17) is proportional to the imaginary part of the dielectric permittivity in the Debye model multiplied by angular frequency. Using binomial expansion for low angular frequencies and a wide gap, i.e.,
, one obtains the power law given by Equation (16), for
, with exponent
[
46,
50]. For the partially blocked surface areas [
46,
47,
48] or for the case where only the high-frequency part of the contribution from the electrode polarization effect is observed, the exponent
is much lower than 1.5. Thus, one can assume that it can take values from the range
.
In general, the conductivity is independent of frequency, mostly for liquid-like phases (IL, N, Ch), i.e., the cross-over angular frequency
in the Jonscher model, Equation (2), is about 10
7–10
9 Hz, and then, one deals with the DC conductivity only, Equations (6) or (8), but the factor
can be nonnegligible with a comparison with DC conductivity. Putting Equations (15) and (16) into Equation (1), the third term on the right-hand side of Equation (1), being the contribution to the imaginary part of the complex dielectric permittivity from the electric conductivity, takes the form
Then, the contribution from the electric conductivity to
is fitted with the two-term Equation (18), or one can use an “effective” power law for the electric conductivity [
1,
2,
15,
16,
22,
44]
where
aσ is an “effective” AC conductivity with the unit [(S/m) s
1−n], and the exponents
n take various values for low- (the region with the contribution from the electrode polarization effect) and high-frequency regions. In the former region, the exponent
n will be lower than one. The higher the value of the exponent
, the lower the value of the exponent
n, whereas in the latter region, the exponent
n will be close to one. The electric polarization of electrodes, contributing to the real part of the complex dielectric permittivity, is given by Equation (14). Comparing Equations (13), (14), (18) and (19), the exponents
s1 and
m1 should be similar, i.e.,
. Therefore, the exponent
m is greater than or equal to one for liquid-like phases.
For the electric conductivity strongly dependent on frequency (the AC conductivity), given by Equations (7) or (9), and for the case of a negligible contribution of
, as is the case of crystal-like phases, the contribution to the imaginary part of the complex dielectric permittivity from the electric conductivity is given by
where the factor
depends on the model coefficients (compare with Equations (7) or (9) and (10)), and the exponent
s strictly follows from the Jonscher model, Equation (7), or is obtained from the experimental data, Equation (12). Comparing Equations (14) and (20), one obtains that the exponents
s and
m1 should fulfil the approximate equality
. The exponent
s is greater than zero and lower than one for crystal-like phases; thus, the exponent
m should be lower than one.
3. Materials and Methods
The liquid crystal compounds 4EOB and 4ABO5* were synthesized by the group of Prof. R. Dąbrowski form the Military University of Technology, Warsaw, Poland; the compounds 5BBAA and 6BBAA were synthesized by Prof. Z. Galewski from Wrocław University; and 22DM1B was synthesized in the Jerzy Haber Institute of Catalysis and Surface Chemistry Polish Academy of Sciences, Cracow, Poland. The materials ETX, C12C, 33DM2B and 33DM1B were purchased from Aldrich Company, Darmstadt, Germany; C13C and T13C were purchased from TCI Europe, Zwijndrecht, Belgium; and T12C was purchased from Fluka, Darmstadt, Germany. The purities of all materials were higher than 99%.
The dielectric permittivity of selected compounds were recorded using: (i) a high-precision Novocontrol ALPHA analyzer, Montabaur, Germany (the gold planar cell with a diameter of 20 mm and a thickness of samples of 50 μm) [
17,
23] for 6BBAA and ETX; (ii) a high-resolution Novocontrol ALPHA analyzer (in parallel plate geometry between two gold-plated electrodes with a diameter of 20 mm and a spacing of 100 μm) [
16,
23] for 4EOB, 4ABO5*, 5BBAA, 33DM2B and 33DM1B; (iii) a Solarton–Schlumberger frequency response analyzer FR 1260, Houston, TX, USA, with the Novocontrol Spectrometer, Montabaur Germany (in parallel plate geometry between two brass disc-shaped electrodes with a diameter of 30 mm and a spacing of 100 μm) [
29] for 22DM1B; and (iv) a high-precision Novocontrol ALPHA analyzer (in parallel plate geometry between two gold-plated electrodes with a diameter of 10 mm and a spacing of 70 μm) [
54] for all cyclohexanediol isomers. The accuracy of temperature measurements is 0.1 K for all cases. Measurements were performed in cooling and heating runs. The errors of the values reordered are not higher than 3%. More experimental details are given elsewhere [
16,
17,
23,
29,
42,
54].
All selected compounds show rich polymorphisms. The phase sequence for the liquid crystal 4EOB is as follows: four crystal phases Cr–N–IL for cooling and four crystal phases Cr–SmX–N–IL for heating [
22], and for 4ABO5*–Cr–Ch–IL for cooling and heating regimes [
16,
19]. The Cr phases are probably of CONDIS type (conformationally disordered crystal phase) for 4EOB and 4ABO5* [
16,
22]. The 5BBAA shows IL–SmB–SmE – CrI CrII–CrI and glass of CrII (gCrII) phase sequence, where SmB and SmE mean smectic B and smectic E phases, for cooling, and CrI and gCrII–CrI and CrII–SmB–IL phase sequence for heating [
23]. The phase sequence is IL–SmA–SmB–Cr for 6BBAA for cooling [
23]. For 5BBAA and 6BBAA, the SmB phase is of crystalline type (sometimes denoted as CrB or SmB
cr). The pharmacological compound ETX has IL–CrI–gCrI for cooling and gCrI–CrI–CrII–IL phase sequence for heating [
24]. The CrII phase was noticed in polarizing light microscopy only [
24], and two sub-phases of CrI phase, called CrI
l and CrI
h, low temperature and a high temperature, respectively, were seen by BDS measurements [
17]. The 22DM1B showed a rich solid-state polymorphism, composed of a (highly) ordered crystal phase Cr3 and two ODIC type phases Cr1 and Cr2 (orientational disorder in (plastic) crystal) [
25,
28,
29,
30], whereas for the 33DM2B compound, four ODIC phases [
25,
30,
33]. The 33DM1B compound, similarly as 23DM2B [
25,
27,
28,
55], had a (highly) ordered crystal phase Cr [
25,
27,
33], except from the IL phase. Close to the Cr–IL phase transition, one can notice a small anomaly on the DSC thermogram ([
25] and references cited therein) for 33DM1B. Thus, between the Cr phase and IL phase, there can be a less ordered crystal phase, but this phenomenon is not solved yet. The cyclohexanediol isomers C13C and T12C show IL ↔ Cr phase sequence for heating and cooling regimes [
34,
35,
36,
37,
38,
39,
40,
42], and the Cr phase is an ordered crystal phase. The T13C compound shows IL ↔ ODIC ↔ gODIC phase sequence for cooling and heating [
40,
42]. The phase sequence is IL–Cr1–Cr2–Cr3 for cooling and Cr3–Cr1–IL for heating for C12C [
34,
35,
36,
38,
39,
41,
42]; Cr1 and Cr2 phases are of ODIC type; and the Cr3 phase is an ordered crystal phase.
4. Results and Discussion
Temperature dependencies of the exponents
n and
m were published for 4ABO5* [
16]. Dependencies of the electric conductivity
and quantity proportional to the permittivity being the contribution from the electrode polarization effect
on temperature
T were published for 4ABO5* [
16], 4EOB [
22] and ETX [
17].
The complex electric conductivity
can be obtained from the dielectric response, i.e.,
, where
is given by Equation (1). One can find that the real part of the complex electric conductivity
is
where the first term on the right-hand side of the equality is a contribution from a relaxation process (or processes), the second is the electric conductivity given by Equation (2) (for Jonscher model,
i =
J) or Equation (4) (for Dyre model,
i =
D) or any equivalent model of the electric conductivity, and the third term describes a lowering of the electric conductivity, Equation (16), as a result of an appearance of the electric polarization of electrodes effect.
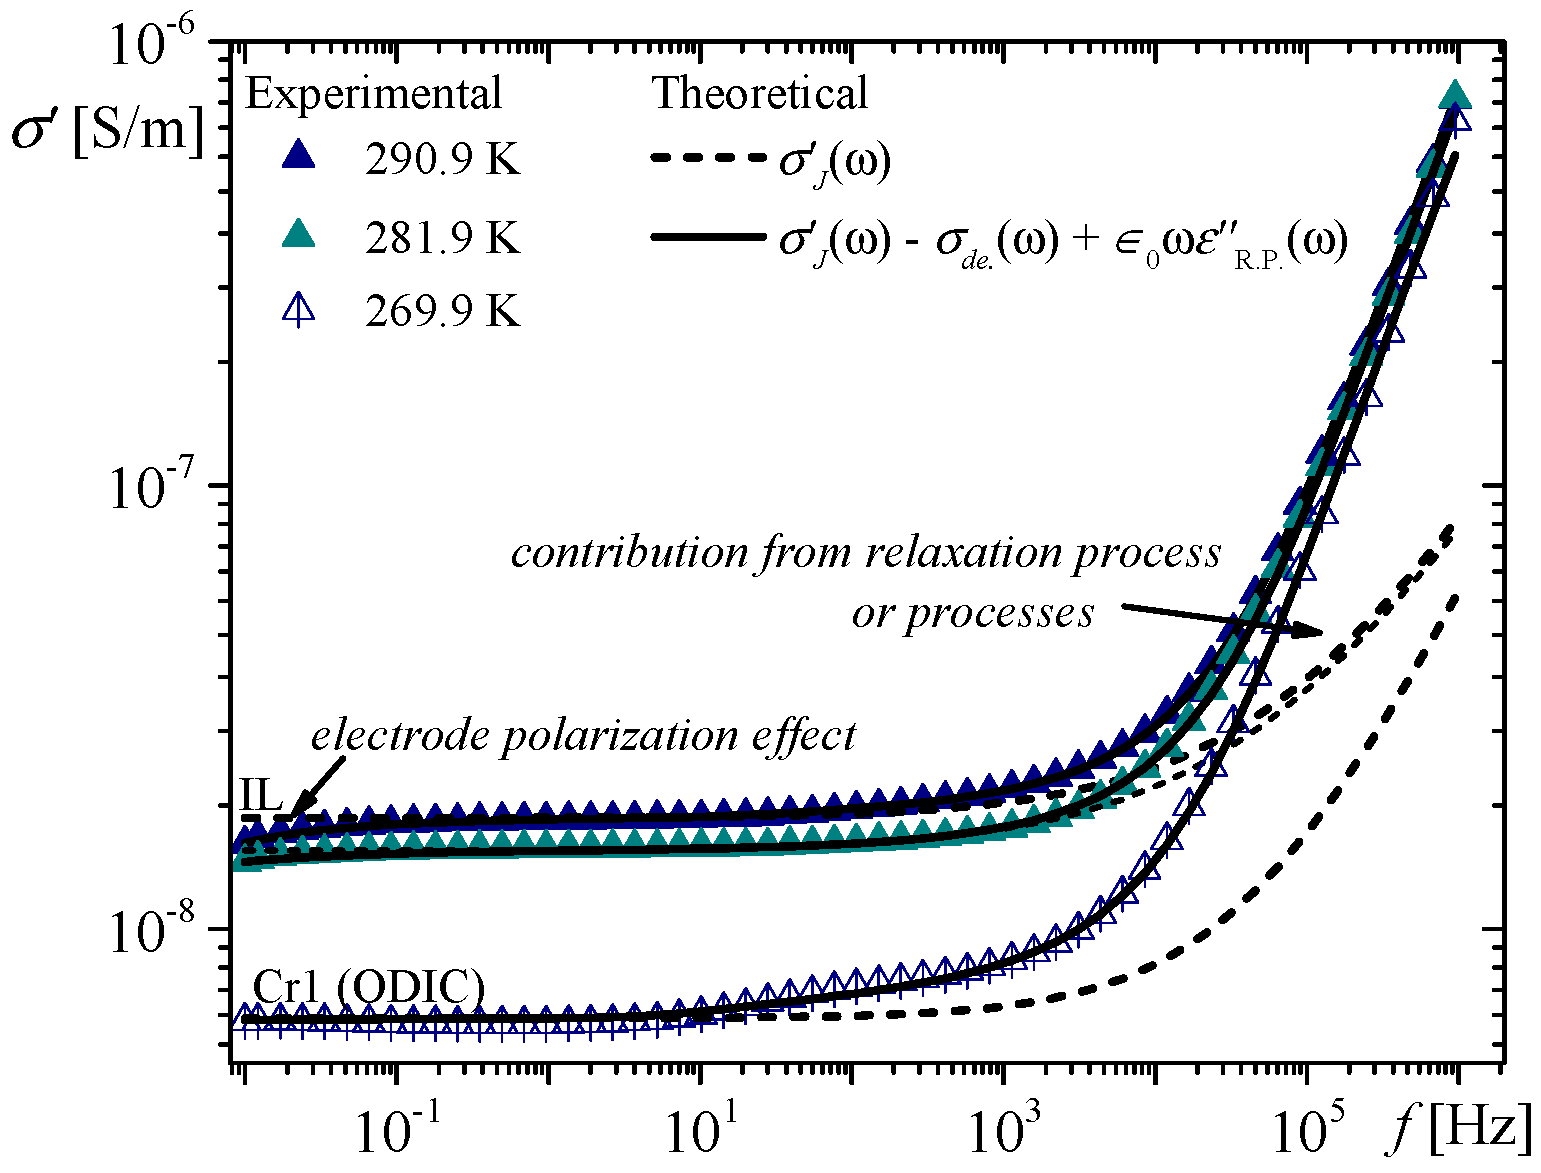
Figure 1 shows the frequency dependence of the real part of the electric conductivity for 33DM2B for selected temperatures, i.e., 290.9 K (the full navy up-triangles) and 281.9 K (the full sea up-triangles) in the IL phase, and 269.9 K (the open up-triangle with vertical bar) in the Cr1 phase (ODIC type). The presented curves are not shifted vertically.
The impact of the electrode polarization effect on the electric conductivity (for frequencies lower than 1 Hz) is not negligible in the IL phase (about ten times smaller than ), whereas it is negligible in the Cr1 phase (more than one hundred times smaller than ). The exponents are about in the IL phase and about 0.55 in the Cr1 phase. With a lower temperature, the impact of the electrode polarization effect on the electric conductivity is less visible. The electric polarization was not found in the rest ODIC phases (i.e., Cr2, Cr3, Cr4) of the 33DM2B compound. The quantity is much smaller than for 22DM1B (IL and ODIC phase) and for 33DM1B (IL phase), whereas the exponents take values of about 0.5 in the IL phase and 0.3 in the ODIC phase.
Regarding the data of
, obtained from measured values of
, Equations (2) and (15) have been fitted in various phases, i.e., in the IL phase (4EOB, 4ABO5*, CH-diol isomers, DMB isomers, ETX), SmA phase (6BBAA), SmX phase (4EOB), and ODIC phase (33DM2B, 22DM1B, C12C, T13C). The values of the cross-over frequency
were close to the limit of experimental frequencies (for example, see dashed curves in
Figure 1 and
Figure 2); thus, in the first approximation, one can conclude that the main contribution of
to
can be fitted by Equation (18). On the other hand, one can use Equation (19) with “effective” values of the exponent
n, as is proposed in [
2]. Then, the exponent
n is a little lower than one for the low-frequency limit and close to one for medium frequencies. The values of the exponent
n for the low-frequency region are smaller than the values of the exponent
n for the medium-frequency region, not more than 7% for CH-diol isomers (in the IL phase) or 3% for 4EOB, 4ABO5*, ETX, about 1% for 33DM2B (in the IL phase), about 2% in the ODIC phases and much lower than 1% for 22DM1B and 33DM1B. Equation (7), or (12), was used in the crystal-like phases, i.e., Cr phases (4EOB, 4ABO5*, 5BBAA, ETX, 33DM1B) and SmB phase (5BBAA, 6BBAA), because
is the power law function of
ω on the whole (or almost whole) available frequency window. The values of the exponents
n obtained are presented in
Figure 3a.
The exponent
n is close to one in the IL phase for all selected compounds (except for ETX, for which it is about 0.95) and in the Ch phase (for 4EOB), whereas it is
for the N phase (4EOB5*). Thus, one can conclude that in liquid-like phases, the exponent
n is close to one. In other liquid-like phases, such as SmA or SmX phases for 6BBAA or 4EOB, respectively, the exponent
n takes values from the ranges
(SmA) or
(SmX) and strongly depends on
T. In addition, the exponent
n is close to one for the ODIC phase (33DM2B, T13C, C12C) and crystal phases (C13C, T12C). This means that in the mentioned phases, there are no interactions, or they are very weak, between charge carriers (ions) and charge carriers moving similarly such as in the IL phase. The values of the exponent
n are smaller than one for the SmB phase (5BBAA, 6BBAA), crystal phases (4EOB, 4ABO5*, ETX, 33DM1B, C12C, 5BBAA) and in the ODIC phase (22DM1B). Furthermore, one can find some discontinuities of the exponents
n on
T for transitions between the crystal-like phase and liquid-like phase, i.e., for 33DM1B (Cr-IL phase transition, stars on
Figure 3a), for 4EOB (Cr1-SmX phase transition, squares on
Figure 3a), for 4ABO5* (Cr1–Ch phase transition, circles on
Figure 3a), 22DM1B (ODIC-IL phase transition, right-triangles on
Figure 3a), between two crystal phases for 4EOB (Cr3–Cr2 phase transition around 240 K), or between two liquid-like phases for 4EOB (SmX–N phase transition, squares on
Figure 3a) and for 6BBAA (SmA–IL phase transition, diamonds on
Figure 3a). SmA and SmX (probably SmA phase [
22]) are phases showing properties of a liquid phase (there is no translational ordering of molecules) and of a solid phase (molecules are orientationally ordered within layers, and the mass centers of molecules are placed on the same plane within each layer). The IL and N phases are characterized by a viscosity parameter lower than in the SmA phase. Thus, in general, one can conclude that the exponent
n shows discontinuity between an (almost) solid state-like phase and a liquid-like phase. On the other hand, one could note a continuous behavior of
but with a change of monotonicity, as for the ODIC-Cr transition (Cr2-Cr3 phase transition) for C12C or CrI
l–CrI
h phase transition for ETX (around 275 K) or a vitrification temperature in ETX (below 250 K).
Figure 3b presents values of the exponent
m obtained from fitting Equation (14) to the experimental values of
. One can find that the exponent
m is higher than one for liquid-like phases such as: (i) IL phase, i.e., about 1.5 (4EOB, 33DM2B, 33DM1B, C12C), about 1.65 (4ABO5*),
(22DM1B) or between 1 and 1.4 (ETX, C13C, T12C); (ii) N phase—about 1.5 (4ABO5*); (iii) Ch phase—between 1 and 1.2 (4EOB). For the other liquid-like phases—SmA (6BBAA) and SmX (4EOB)—the exponent
m is lower than one. The exponent
m is close to 1.6 in the ODIC phase (Cr1) for 33DM2B. The NMR measurements show that the dynamics in the IL and Cr1 phases (in 33DM2B) are very similar [
31]. The trend of the dependence of
T1 on 1/
T in the Cr1 and IL phases is typical of motions in the fast regime, and the discontinuity of
was found in the Cr2–Cr1 phase transition. In addition, no large effects on the trend of the self-diffusion coefficient were reported in the Cr1 and IL phases, whereas large reductions in the self-diffusion coefficient and in the reorientational correlation time were found at the Cr2–Cr1 phase transition [
31]. Furthermore, the melting of the Cr1 phase was described as a weak first-order phase transition [
30], which means the Cr1 phase (of ODIC type) has some properties of a liquid phase (some DMB molecules can move freely). The crystal-like phases show a very weak electrode polarization effect, and the values of the exponent
m are (much) lower than one, i.e., lower than 0.5 for 4EOB in the Cr phases, about 0.8 in 5BBAA (Cr and SmB phases), from 0.8 down to 0.5 for 22DM1B in the ODIC phase,
for 33DM1B in the Cr phase,
for 6BBAA in SmB phase, from 1 down to 0.7 for 4ABO5* in the Cr phase, and from 1.2 to 0.4 for 33DM2B in the ODIC phases. The isomers of CH-diol are characterized by electric conductivity values similar to semi-conducting materials, especially in the IL, ODIC phases and in the Cr phase close to the Cr–IL phase transition [
42]. The exponents
m are the decreasing function of decreasing temperature and take values: from 1.2 down to 0.7 (Cr phase for C13C), from 1.4 down to 1 (Cr phase for T12C), about 1.5 (ODIC and/or sODIC for T13C, ODIC phases for C12C), and from 1.5 down to 1 (Cr phase for C12C). Similarly for the exponent
n, the exponent
m shows a discontinuity for phase transitions between crystal-like phases and liquid-like phases, i.e., Cr1–SmX phase transition for 4EOB, Cr–Ch phase transition for 4ABO5*, ODIC–IL phase transition for 22DM1B, Cr–IL phase transition for 33DM1B, and between some liquid-like phases (Ch–IL phase transition for 4ABO5*, SmA–IL phase transition for 6BBAA). In addition, there is a discontinuity in
m values for the Cr2–Cr1 phase transition for 33DM2B. Both phases are of the ODIC type.
Dependencies of the “effective” electric conductivity on temperature,
, and quantity proportional to capacity connected with the electrode polarization,
, were reported for 4ABO5* [
16], 4EOB [
22], and ETX [
17]. The “effective” electric conductivity
shows the discontinuity for phase transitions between a crystal-like and liquid-like phase, i.e., Cr–Ch (4ABO5*) [
16], for the SmX–N phase transition (4EOB] [
22], and for the Cr3–Cr2 phase transition (4EOB] [
22]. The quantity
presents the discontinuities for the Ch–IL phase transition (4ABO5*) [
16], the Cr3–Cr2 phase transition (4EOB) [
22] and a very weak discontinuity for the SmX-N phase transition (4EOB) [
22].
Figure 4a shows a dependence of
on
T for 6BBAA. The inserted figure presents
for the liquid crystal mentioned. There are discontinuities for the SmA–IL phase transition for both quantities
and
. Moreover, both dependencies change the slope in the SmB–SmA phase transition.
Figure 4b presents
and
(inserted figures) for selected DMB isomers, i.e., 33DM1B (stars), 22DM1B (right-triangles) and 33DM2B (up-triangles). The huge discontinuity of
, about four decades of magnitude, characterizes the Cr–IL phase transition for 33DM1B. A weak discontinuity of
can be found in the ODIC–IL phase transition for 22DM1B. In that case, one can say about the pre-transitional effect, i.e., the “effective” electric conductivity increases rapidly, about two decades of magnitude on the 5 K temperature range. A discontinuity is found for the Cr2–Cr1 phase transition, around 270 K, for 33DM2B. Both phases are of the ODIC type. However, as it was mentioned above, the Cr1 phase shows dynamics similar to the IL phase [
31], and the Cr1–IL phase transition is a weak first order [
30]; thus, in some sense, one can treat the Cr2–Cr1 phase transition as a transition between crystal-like and liquid-like phases.
Figure 5a,b show the dependencies of
and
, respectively, on
T for CH-diol isomers. Regarding the experimentally obtained data of
, Equation (2), reduced by
, Equation (16), for cases where the effect of the electrode polarization occurs, and Equation (19) multiplied by
, with the exponent
, were fitted. The results obtained from the former fit are depicted as the dashed curve, and more specifically, the values of
are presented in
Figure 5a as dashed curves in the IL phase (C13C, T12C, C12C), in the ODIC phases (T13C, C12C) and in the Cr phase (T12C) or the values of
(instead of
in Equation (7) as both quantities cannot be determined separately—the plateau region of the electric conductivity and the cross-over angular frequency are out of the experimental window), which are presented as dashed curves in the Cr phase (C13C, C12C). There are some differences between the “real” values of the electric conductivity (circles) and the “theoretical ones” (dashed curves). These differences are the result of the electrode polarization effect, which lowers the electric conductivity at low frequencies; they are denoted as
and shown in the inserted figure in
Figure 5a. The discontinuities are found for the Cr–IL phase transition (C13C) and Cr3 (crystal type)–Cr2 (ODIC type) phase transition (C12C) for the electric conductivity (
Figure 5a) and for the quantity proportional to the capacity
(
Figure 5b).
5. Conclusions
Values of the exponent n and m, describing the frequency dependencies of the real part of the electric capacity and the quantity proportional to capacity connected with the electrode polarization effect , respectively, their behavior (monotonicity, changing of slopes at phase transition temperatures, discontinuity or continuity at phase transitions, etc.) and, at the same time, dependencies of and on temperature T are excellent markers of phase transitions, not only between the crystal-like and liquid-like phases but also within various crystal-like or liquid-like phases. The selected compounds, having a wealth of different thermodynamic phases, showed that in similar phases various substances exhibit the same values of the exponents n and m. As was shown, the exponents n and m show the discontinuity for the phase transitions between crystal-like and liquid-like phases. In addition, the quantities (or ) and show discontinuous behavior, as functions of T, for crystal-like and liquid-like phase transitions. The exponents n and/or m and quantities and/or change monotonicity at phase transition points, such as, for example, SmB–SmA phase transition (6BBAA), Cr3 (crystal type)–Cr2 (ODIC type) transition (C12C), CrIl–CrIh and CrIh–gCrIh transitions (ETX), Cr4–Cr3 and Cr2–Cr1 (4EOB), etc.
There can be a metastable phase, probably of the ODIC type, in 33DM1B just below the crystallization temperature (or above the melting temperature). The electric conductivity shows a very steep behavior (above 1.5 decades of magnitude on a 6K temperature range) and takes value as in the IL phase (see full stars in
Figure 4b). In addition, the exponent
n takes values close to one (
) (see full stars in
Figure 3a) in the range of 180–188 K, and the exponent
m is about 1.5 (
Figure 3b) in the mentioned temperature region. Summing up, all this suggests that between the Cr and IL phases for 33DM1B, there is a very narrow (metastable) phase, most likely of the ODIC type.
The phase denoted as SmX for 4EOB has been ascribed as an unidentified smectic phase based on values of dielectric increment and
and on the behavior of relaxation time [
22]. However, the values of the exponents
n and
m as well as the quantities
and
and their behavior in the mentioned phase as well as in the phases surrounding the discussed phase (Cr and N) enforce the naming of this phase rather as a smectic than as the crystalline one. This is most likely the SmA phase.

