Article

Wet Synthesis of Graphene-Polypyrrole Nanocomposites via Graphite Intercalation Compounds

by
Gintarė Rimkutė
1,
Gediminas Niaura
2,
Rasa Pauliukaitė
3,
Justina Gaidukevič
1 and
Jurgis Barkauskas
1,*
1
Institute of Chemistry, Faculty of Chemistry and Geosciences, Vilnius University, Naugarduko Str. 24, LT-03225 Vilnius, Lithuania
2
Department of Organic Chemistry, Center for Physical Sciences and Technology (FTMC), Sauletekio Ave. 3, LT-10257 Vilnius, Lithuania
3
Department of Nanoengineering, Center for Physical Sciences and Technology, Savanoriu Ave. 231, LT-02300 Vilnius, Lithuania
*
Author to whom correspondence should be addressed.
Crystals 2022, 12(12), 1793; https://doi.org/10.3390/cryst12121793
Submission received: 15 November 2022 / Revised: 24 November 2022 / Accepted: 7 December 2022 / Published: 9 December 2022

Abstract

:
Graphene-polypyrrole (GP) nanocomposites were synthesized by a wet-way protocol using a graphite bisulfate (GBS) precursor. Consequently, GBS, a type of graphite intercalation compound, was prepared in the presence of concentrated sulfuric acid in the presence of a potassium periodate oxidizer. Three different types of graphite precursor with particle sizes of <50 μm, ≥150, ≤830 μm, and ≤2000 μm were used for this purpose. It was found that in the Raman spectra of GBS samples, the characteristic D band, which is caused by defects in the graphene layer, disappears. Therefore, the proposed synthesis protocol of GBS could be considered as a prospective intermediate stage in the preparation of graphene with low defect concentration. In contrast to alkali metal intercalation, the intercalation process involving anions with a relatively complex structure (e.g., HSO4), which has been much less studied and requires further research. On the basis of the results obtained, structural models of graphite intercalation compounds as well as GP nanocomposites were discussed. The most relevant areas of application for GP nanocomposites, including energy storage and (bio)sensing, were considered. This work contributes to the development of cost-effective, scalable, and highly efficient intercalation methods, which still remain a significant challenge.

1. Introduction

Graphene-based materials comprise a wide and diverse class. They originates from graphite, including graphene itself, graphene oxide, reduced graphene oxide, exfoliated graphene flakes, graphene nanoplatelets, and chemically functionalized versions of all these. In graphene technology, the preparation of graphene with low/controllable defect concentration is among the most important trends today. However, the production of graphene is primarily facilitated by high temperature processes [1,2,3]. The high temperature process is prone to defect formation. The solution to the problem could be the use of wet synthesis methods, though wet-chemical preparation of graphene of the same quality has been challenging up until now. In principle, if using a wet synthesis protocol, one could not only reduce the defect concentration but also introduce preferred functional groups at the same time. With chemical modification, graphene can become more functional, enabling more scalable applications in medicine, energy storage, nanotechnology, electronics, and other fields [4,5,6,7,8,9]. The conventional wet synthesis protocol of graphene includes intercalation, oxidation into graphene oxide, delamination, and subsequent reduction. A ruptured carbon lattice is usually the result of these consecutive operations [10]. Graphene quality can be improved by both reducing the number of sequential steps and understanding the underlying mechanisms. By eliminating oxidation and subsequent reduction from the preparation protocol of graphene, the number of sequential steps can be reduced. It has been reported that single-layer graphene flakes can be obtained from graphene intercalation compounds directly by spontaneous, mechanical, electrochemical, microwave, or liquid phase exfoliation [11,12,13,14,15]. The prevailing opinion is that graphene prepared in this way has the best ratio of quality, purity, production costs, scalability, and yield [16].
The graphite intercalation compound with sulfuric acid—graphite bisulfate—was one of the first graphite intercalation compounds synthesized by C. B. Brodie in 1855 [17]. Its formula is written as C24+ · HSO4 · 2 H2SO4; nevertheless, it represents the phase of maximal saturation, where a single layer of graphene is regularly altered with H2SO4 molecules and HSO4 ions (also known as the phase of stage 1). In the general case, the number of graphene layers, n, sandwiched between the two layers of intercalant is referred to as the stage number, and the corresponding GBS phase is called stage n GBS. Despite the fact that GBS was discovered long ago, it remains one of the least studied and poorly understood among graphite intercalation compounds. This is determined in large part by the fact that sulfuric acid does not spontaneously intercalate into graphite, as the reaction has a positive Gibbs free energy [18]. The Daumas–Herold model can be used to understand phase coexistence and stage transition in GBS [19]. Although the model explains the coexistence of GBS stages with n > 1, it does not always fit well with the experimental data [20]. The process of GBS formation is initiated by oxidation of graphite and leads to charge redistribution in the system. A surface charge transfer effect can control the redistribution of charges. Among low-dimensional materials, because of their high fraction of surface atoms, this phenomenon was originally demonstrated for conductive polymers [21]. Since graphene (as well as graphene intercalation compounds) is a representative 2D material, it interacts strongly with different dopants (halogens, alkali metals, oxygen-containing anions) [22]. A substantial change in its Fermi level and charge density is observed as a result. Surface charge transfer enables graphene and graphene intercalation compounds to be exploited for semiconducting 2D materials [23,24]. However, doping remains unclear in its mechanistic details despite its broad functional tunability and application possibilities. Due to the intertwined roles of oxygen, water, and substrates, this is particularly relevant for oxygen-mediated hole doping [25,26,27,28]. It should be noted that the formation of GBS is strongly dependent on the surface charge transfer effect; therefore, the role of the oxidant in the intercalation reaction is significant [29].
In this work, structural models of GBS compounds and carbon nanostructures derived from them were discussed. For this purpose, the GBS compounds were chemically synthesized using a KIO4 oxidizer and three different graphite precursors with grain sizes of <50 μm, ≥150, ≤830 μm, and ≤2000 μm. The effect of precursor grain size and chemical constitution on defect concentration and phase constitution in prepared samples was evaluated. All samples obtained were annealed at 800 °C or microwave treated to obtain exfoliated graphite (EG), which was further modified with conductive polymer polypyrrole (PPy). The Raman spectra of GBS, EG, and composite samples with PPy were analysed to reveal the defect concentration. A relatively low defect concentration was found for EG samples, whereas the defect band completely disappeared in GBS samples. Thus, the proposed synthesis protocol could be considered as a prospective intermediate stage in the preparation of graphene with a low defect concentration. The applications of prepared samples in energy storage and biosensing devices were also considered.

2. Materials and Methods

2.1. Materials

All reagents were used without further purification. Extra pure fine graphite powder (<50 μm, ≥99.5%) was purchased from Merck KGaA (Darmstadt, Germany), synthetic graphite powder (≥150, ≤830 μm, 99.9%), natural graphite flakes (≤2000 μm, 99.9%), and Nafion (5%) were purchased from Alfa Aesar (Kandel, Germany), Na2SO4 (≥99%) was obtained from Eurochemicals, KIO4 (99.8%), H2SO4 (98%) and pyrrole (≥98%) were purchased from Sigma-Aldrich (Darmstadt, Germany), (NH4)2S2O8 (98%) from Lach-Ner (Neratovice, Czech Republic), and HCl (37%) and KBr (≥99.5%) from Carl Roth (Karlsruhe, Germany).

2.2. Synthesis of GBS Products

For GBS synthesis, three different graphite precursors with different particle sizes (<50 μm, ≥150, ≤830 μm and ≤2000 μm) denoted as Gr_1, Gr_2 and Gr_3, respectively, were used. In this work, the oxidizing mixture was prepared in a 50 mL Erlenmeyer flask with a ground glass joint by adding 0.1 g of a KIO4 oxidizer to 15 mL of conc. H2SO4 at constant swirling. When the oxidizer dissolved, 0.25 g of graphite was slowly added to the mixture. The swirling procedure was continued for 1.5 h. Three synthesized samples were denoted as GBS_1, GBS_2, and GBS_3.
To achieve liquid phase exfoliation, the GBS_1, GBS_2, and GBS_3 samples were mixed with anhydrous Na2SO4. For this purpose, 2 mL of the GBS reaction mixture was added to 8 mL of H2SO4 and 5 g of Na2SO4. The mixture was left to stir for 3 days.

2.3. Thermal Treatment of GBS Samples

In order to obtain thermally exfoliated graphite (EG), 6 GBS samples (without and with liquid phase exfoliation) were annealed under thermal shock conditions. Samples were placed into ceramic combustion boats, which were inserted into a quartz glass tube. The tube was sealed and placed in a tubular furnace (SNOL 0.4/1250, Utena, Lithuania) preheated to 800 °C. The samples were heat treated under argon flow (80 mL·min−1) until the sulfuric acid had stopped evaporating. Then, the tube was taken out of the furnace and cooled up to room temperature. The annealed products were washed with deionized water and dried at room temperature. The obtained EG products were denoted as EG_1, EG_2, EG_3, and EG_1_Na, EG_2_Na, EG_3_Na.

2.4. Microwave Treatment of GBS Samples

Furthermore, the GBS_1, GBS_2, and GBS_3 samples were subjected to direct microwave irradiation using a domestic microwave oven (Electrolux, 800 W EMS20405X, Stockholm, Sweden) for 1 min. During the treatment, the samples were placed in a capped weighting bottle with a ground glass joint. The obtained EG products were denoted as EG_1_MW, EG_2_MW, and EG_3_MW.

2.5. Synthesis of Graphene-Polypyrrole (GP) Nanocomposites

For the synthesis of GP nanocomposites by a wet-way protocol, EG_1, EG_2, and EG_3 samples were used. For this purpose, a 10% pyrrole solution in 1.0 M HCl, an EG sample, and (NH4)2S2O8 were mixed and ground in an agate mortar for 30 min. The ratio of pyrrole, EG, and (NH4)2S2O8 used was 1:2:20 by weight, respectively. The samples obtained were purified by dialysis in a tube and kept in a drying oven at a temperature of 40 °C until the water evaporated. Resultant samples were denoted as GP_1, GP_2, and GP_3.

2.6. Characterization

Optical microscopy images were acquired using an optical microscope (BX51 Olympus, Tokyo, Japan) at a magnification of 50x. Raman spectroscopy was performed using a Renishaw inVia spectrometer (Wotton-under-Edge, UK) equipped with an optical microscope at a magnification of 20×, a CCD camera, an objective numerical aperture of 0.40, and 1800 grooves mm−1 grating. The laser excitation wavelength was 532 nm, the beam was focussed to an area of 2 μm2, and the integration time was 100 s. To analyse the changes in characteristic peaks, the Raman bands were fitted with a pseudo-Voigt function (a linear combination of Gaussian and Lorentzian functions) [30]. XRD measurements were performed in the 2θ range 10–45° with a Rigaku diffractometer (Miniflex II, Neu-Isenburg, Germany) (Cu Kα radiation with a graphite monochromator). The interplanar spacing d of the samples was calculated using Bragg’s equation [31]. The crystallite size L was calculated by the Debye–Scherrer equation [32]. XPS analysis was performed using a Kratos analytical spectrometer (Axis Supra, Manchester, UK) equipped with a monochromatized Al Kα X-ray source (hν = 1486.69 eV, 15 kV, 25 mA). The spectra were acquired with an electron analyzer pass energy of 20 eV and calibrated using the C 1s peak at 284.6 eV. Core-level peaks were analysed using a nonlinear Shirley-type background subtraction, and the calculation of the elemental composition was performed on the basis of Scofield’s relative sensitivity factors. SEM micrographs were obtained with the scanning electron microscope (Hitachi SU-70, Tokyo, Japan) at an accelerating voltage of 10.0 kV and magnification of 50,000×.

2.7. Electrochemical Measurements

Electrochemical analysis of the synthesized materials was performed using a glassy carbon electrode (GCE) (PalmSens BV, Houten, Netherlands) modified with EG and GP samples. For this purpose, GCE was first polished with alumina powder (0.05 μm, Kemet, Kent, UK), rinsed with deionized water, ultrasonicated with deionized water, and then with ethanol. For the construction of the modified electrodes EG/GCE and GP/GCE, 1.0 mg of synthesized carbon material was dispersed in 1.0 mL of 0.05% Nafion (Alfa Aesar, Kandel, Germany) solution by sonicating the mixture in an ultrasonic bath for 30 min. In total, 10 µL of the suspension obtained was drop cast onto the polished surface of the GCE. The prepared electrodes were dried in air at room temperature.
Characterization of the electrodes was performed using cyclic voltammetry (CV). CV measurements were performed at room temperature using a CompactStat potentiostat/galvanostat (Ivium Technologies, Eindhoven, Netherlands). All electrochemical measurements were run in the three-electrode system. A platinum wire, Ag/AgCl bare or EG/GCE, and GP/GCE (diameter of 3.0 mm) were used as the counter, reference, and working electrodes, respectively. CV curves were recorded in the potential range of −1.0 to +1.0 V (vs Ag/AgCl) and at a scan rate of 100 mV·s−1 in 0.1 M phosphate buffer solution (PBS) at a pH of 7.0.

3. Results

Precursors, or synthesized and heat-treated GBS products, were characterized using optical and SEM microscopy, Raman spectroscopy, and XPS and XRD analysis. GBS itself is not stable in air, therefore, SEM, XPS, and XRD measurements were only applied to those GBS products that were either subjected to the MW treatment or annealed at higher temperatures, i.e., samples in which H2SO4 was removed.

3.1. Optical Spectroscopy and SEM Characterization

The optical micrographs of the GBS samples are presented in Figure 1.
It is known that stage 1 and stage 2 GBS phases are coloured. Stage 1 GBS is characterized by a deep blue colour, and stage 2 GBS particles are white, whereas mixed stage zones (they are also called intermediate phases) can be identified by their iridescent colours [33]. Optical microscopy pictures of GBS confirmed successful intercalation using all three graphite precursors (Figure 1). Both blue and white particles of various sizes as well as blurred iridescent areas (Figure 1b,c) can be observed. In GBS_1 (Figure 1a), the proportion of bluish particles is the highest. Optical micrographs of the GBS_2 and GBS_3 compounds (Figure 1b,c) show the presence of larger grains of both white and blue colours, as well as iridescent zones in smaller particles. The obtained results are in good agreement with those published by Dimiev et al. [33]. Thus, we can assume that the use of graphite precursor composed of smaller particles is preferable for obtaining a stage 1 GBS, where the intercalant is interposed between each graphene layer and can be represented by the formula C24+·HSO4·2H2SO4 [34].
SEM micrographs were used to assess the structure of the EG and GP samples and compare it with that of pristine graphite (Figure 2). The graphite precursors (Figure 2a–c) can be characterized by the lamellar structure and flat surfaces with regular edges. The EG samples after heating also retain their likewise lamellar structure; however, the edges of the layers are less regular and more jagged (Figure 2d–i). When analysing the SEM micrographs, one can see an increase in morphological changes along the direction (Gr_1, Gr_2, Gr_3) < (EG_1, EG_2, EG_3) ≤ (EG_1_MW, EG_2_MW, EG_3_MW) < (EG_1_Na, EG_2_Na, EG_3_Na) < (GP_1, GP_2, GP_3), which also depend on the particle size. The phenomenon of partial delamination is typical for the EG and EG_MW samples (Figure 2d–i), whereas the splitting of the basal graphene planes can be seen in the micrographs of the EG_Na samples (Figure 2j–l). During the procedures of thermal shock and microwave treatment, the molecules of H2SO4 evaporate and expand the graphite structure. In the case of microwave treatment, the edges of the basal planes are more jagged, presumably due to the presence of oxygen in the reaction zone. The EG_Na samples are obtained using the liquid phase exfoliation protocol (see Section 2.2), when Na2SO4 is added to the reaction mixture. NaHSO4 formed in the solution of H2SO4 is eutectic at room temperature and is suitable as an ionic liquid for exfoliation [35]. Yao et al. found NaHSO4 as an efficient exfoliation agent for covalent organic frameworks, which are morphologically similar to graphene [36]. SEM micrographs (Figure 2j–l) show that the procedure of liquid exfoliation in the eutectic of the H2SO4–NaHSO4 matrix is effective to reduce the particle size; however, the process of particle size reduction occurs not by exfoliation, but by splitting of the basal planes. The morphology of GP samples obtained by mechanochemical synthesis of GBS products with pyrrole is significantly different from the other samples of pristine graphite and other EG products (Figure 2m–o). An obvious layered structure is no longer visible. It is replaced by smaller particles of various sizes and individual sheets. Furthermore, in the micrographs of the GP samples round, regular-shaped particles can be seen, indicating the presence of the formed PPy. Similar morphology was reported by Wu and co-authors [37]. Therefore, it can be argued that the core–shell nanocomposite structure, where the EG nanoparticles are covered with a PPy shell, was obtained during the mechanochemical synthesis procedure. In our future research, we are planning to apply the TEM technique for more detailed examination of the composite structure.

3.2. XRD Analysis

More detailed analysis of the structure of pristine graphite, EG, and nanocomposite GP samples was performed using the XRD technique. The obtained XRD patterns are shown in Figure 3. The values of the peak positions, the interplanar spacing d002 and the crystallite size L are presented in Table 1. Both pristine graphite as well as EG and nanocomposite samples exhibit a characteristic diffraction peak for the (002) plane. Therefore, we can conclude that original graphitic structure was maintained during the procedure of exfoliation or nanocomposite formation [38]. More precisely, the shift of the XRD peak and d002 values determined using Bragg’s equation is presented in Table 1. The interplanar distance of all pristine graphite samples equals 0.336 nm; meanwhile, the crystallite size varies from 31 to 68 nm. The pristine graphite sample Gr_3 with the largest particle size (≤2000 μm) is characterized by larger crystallites, whereas the other two samples with smaller particle sizes (150–800 μm and <50 μm) are characterized by the crystallites of almost the same size. Thermal exfoliation of all GBS samples prepared from three different pristine graphite samples results in a slight increase in interplanar spacing. The most pronounced increase is for EG_1—the sample prepared from the pristine graphite with the smallest particle size. Meantime, for EG_3, the sample obtained from Gr_3 with the largest particle size, this increase is insignificant. This result is comparable to that previously obtained from optical microscopy; the amount of stage 1 GBS is found to be the highest in GBS_1, which is prepared from Gr_1. Therefore, the small particle size of Gr_1 is beneficial for the preparation of GBS stage 1, which in turn is the most suitable for efficient thermal exfoliation. In the case of EG_3, it is possible that part of pristine graphite did not exfoliate and retained the original graphitic structure [38]. Analysis of the XRD data shows a slight increase in d002 spacing equally for all three EG_MW samples. The crystallite size L is significantly reduced after MW exfoliation; it is the most significant in the case of EG_3_MW, which is obtained from Gr_3 with the largest particle size. Presumably, the disintegration of the basal plane of graphene should be more intense in the case of MW exfoliation in comparison with that of thermal exfoliation.
As a conclusion, one can expect that it is better to use thermal shock than MW exfoliation to obtain graphene layers with less defect concentration. The liquid phase exfoliation in the melt of NaHSO4 results in the contraction of the interplanar distance. Some authors (e.g., A.J. Cooper et al.) attribute this phenomenon to planes narrowing as a result of neighbouring planes separating [39]. Together with the results of the SEM micrographs (Figure 2j–l), one could suggest that the number of defects after liquid exfoliation in the melt of NaHSO4 should be higher in comparison with that obtained after thermal exfoliation. For this reason, thermally exfoliated samples were further used for the preparation of nanocomposites with PPy. The procedure of mechanochemical synthesis affects the structure of GP samples. The interplanar distance d002 of all three GP samples converges to the value of 0.337 nm; this may be the effect of the PPy coverage on the EG particles. The crystallite size L either remains the same or is slightly reduced after the procedure of mechanochemical synthesis.

3.3. Raman Spectroscopy Analysis
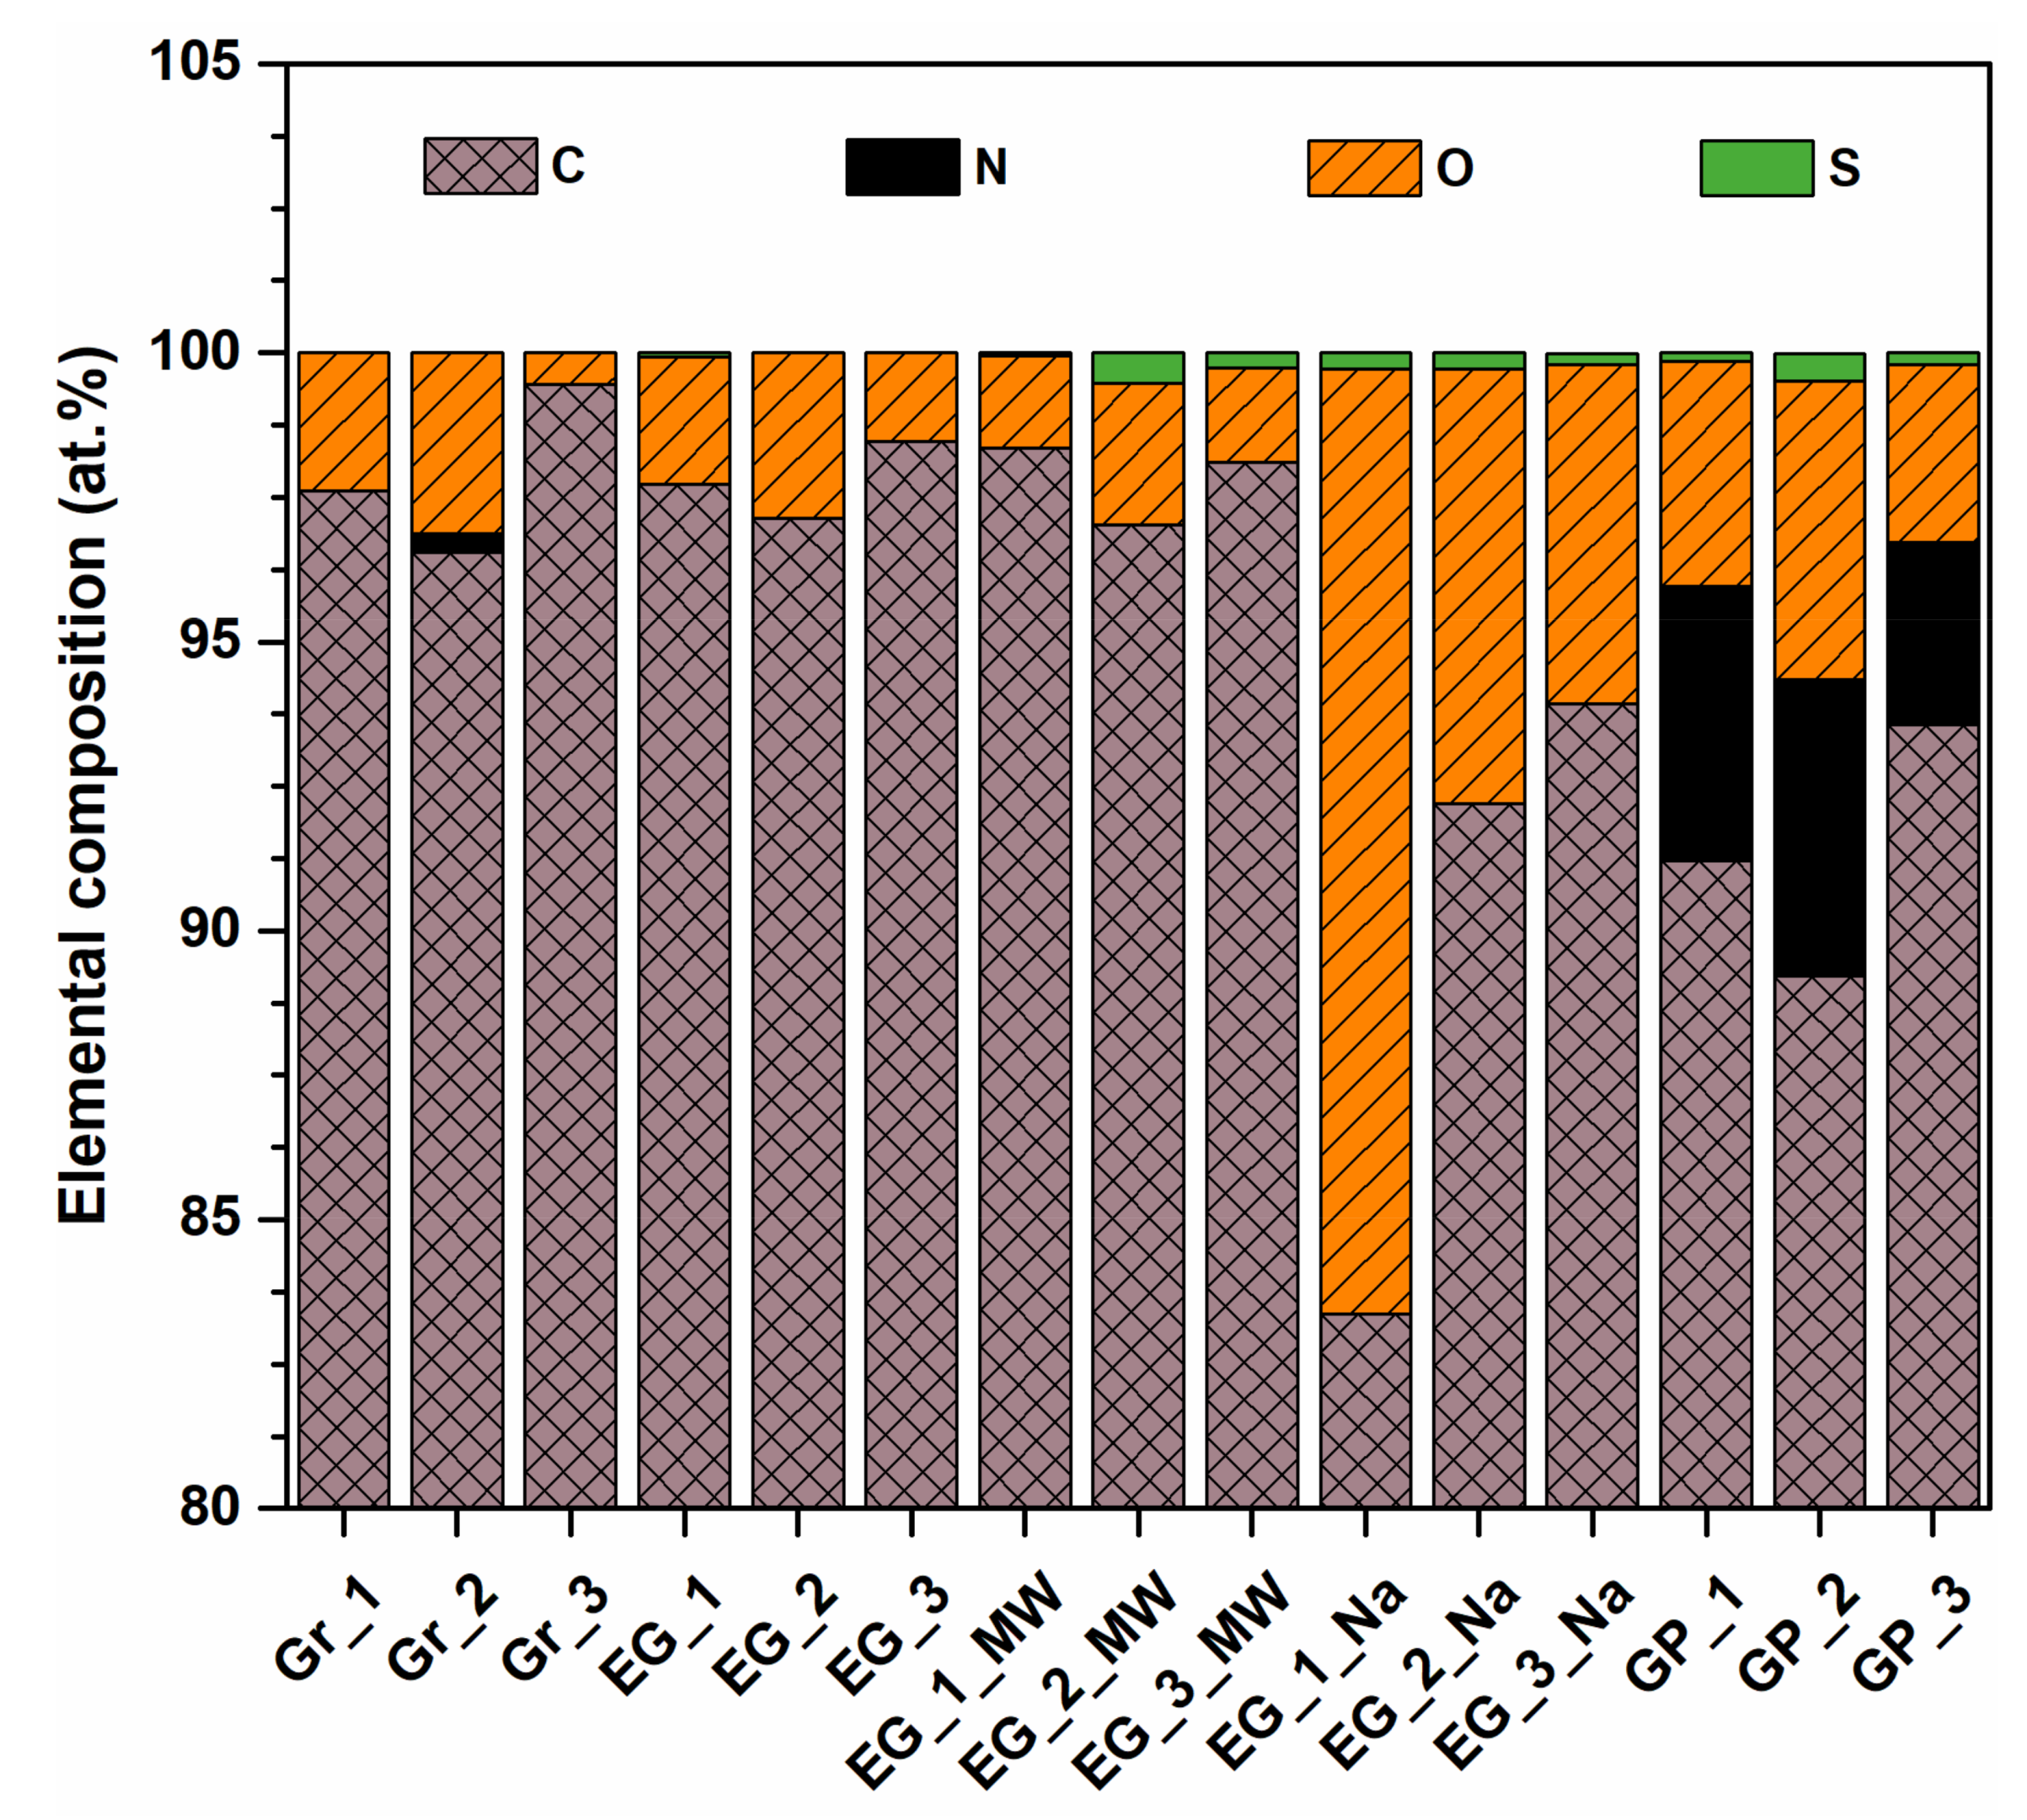
Raman spectroscopy was used to assess the amount of stacked graphene layers, defectiveness of precursors and GBS products, and the precise staging indices of intercalated products [40,41,42,43]. Raman spectra in G (1500–1700 cm−1) and 2D (2500–2900 cm−1) band frequencies are provided in Figure 4. Continuous Raman spectra running from 1200 cm−1 to 3200 cm−1 are shown in the Supplementary Information file (Figure S1).
One can notice the presence of three characteristic bands in almost all pristine and synthesized samples: D, G and 2D (Figure S1). The D band at about 1350 cm−1 is caused by defects in the graphene layer (A1g symmetry mode), the G band at about 1581 cm−1 is designated to the first order scattering of the E2g mode that arises from the sp2 bonded carbon, and the 2D mode at approximately 2709 cm−1 is an overtone of the D band. The 2D band is Raman-allowed and defects or disorders are not required to activate this mode [40,42,43,44,45,46,47,48]. In addition to the already mentioned bands, at 1620 cm−1, a low intensity mode D′ can be seen as a shoulder at the high-frequency side of the G peak in the Raman spectra of some samples (Gr_1, EG_1, EG_MW_1, EG_1_Na, and EG_2_Na; see Figure 4a,c,d,e). This band can appear when accidentally spread impurities interact with extended graphene phonon modes [49]. Therefore, one can suggest that impurities present in the pristine graphite with the smallest particle size Gr_1 have a significant impact on defect formation and remain noticeable in exfoliated GBS products.
The Raman spectra of the synthesized GBS samples are shown in Figure 4b and Figure S1b. Compared with graphite, the shift of the G peak towards the higher wavenumbers can be seen. This shift, which indicates the process of graphite intercalation, occurs when the graphene layers are charged with intercalant molecules [33,50]. Another attribute observed in the Raman spectra of the GBS samples is the splitting of the G band. The splitting occurs when the charged graphite layers adjacent to the intercalated layers are differentiated from those uncharged next to the empty galleries [51]. Peaks G1 at about 1630 cm−1 and G2 at about 1619 cm−1 represent stage 1 and stage 2 GBS phases, respectively [20]. A comparison of the intensities of the G1 and G2 peaks, evaluated by the fit procedure, was used to quantify the different intercalation phases in the GBS samples [52]. The GBS_2 sample contains more than half of stage 2 compounds (62.47%), and GBS_3 was composed of the majority of stage 2 phases (84.42%). However, Raman analysis reveals that the GBS_1 sample contains an almost pure GBS phase of stage 1, which is characterized by an apparent peak at 1630 cm−1. From that, one can assume that the particle size of pristine graphite is substantial in determining the constitution of GBS phases of various staging indices.
Heated microwave treated samples (Figure 4c–e and Figure S1c–e) show the only one G peak at approximately 1581 cm−1. Together with the XRD data, this supports the idea that the elements of the graphite structure are restored after the exfoliation procedure [53]. The Raman spectra of nanocomposite GP samples (Figure 4f and Figure S1f) are very different from those previously discussed, yet, they coincide with those reported by the other authors, where composites of graphitic materials with PPy were examined [54]. In the range of 900–1700 cm−1, new appeared peaks can be seen. Although some peaks overlap, the existence of D, G, and 2D bands in the GP spectrum is observed at approximately 1352 cm−1, 1585 cm−1, and 2705 cm−1, respectively. Furthermore, some broad peaks at approximately 1410 cm−1 (C–N stretching), 1056 cm−1, and 987 cm−1 (C–H ring deformation vibration) are associated with the characteristics of PPy [55].
The ID/IG ratio (ratio of the intensity of the D peak and the G peak) is an important Raman spectra parameter, which is used as an indicator of the defect concentration in graphene-like materials. The values of ID/IG determined for pristine graphite, EG, and nanocomposite samples are presented in Table 1. Comparing the obtained results with the data of other authors, it can be concluded that the EG samples are characterized by a low concentration of defects [56]. Comparing pristine graphite samples, the lowest concentration of defects is found in Gr_3 with the largest particle and crystallite size. In general, a pronounced inverse correlation can be observed between the ID/IG ratio and crystallite size in each group of thermally exfoliated samples, whereas MW exfoliated and GP nanocomposite samples show no correlation between these two parameters. The MW exfoliated samples can be characterized by a lower crystallite size, whereas the GP samples—by a higher ID/IG ratio. Therefore, the MW exfoliation and mechanochemical synthesis can be considered as the procedures affecting the structure of the GBS products in the most significant results.
A characteristic feature emerges in the Raman spectra of the GBS samples—the absence of the D band (Figure S1b). However, the low-intensity 2D band, which is an overtone of the D band, remains in the Raman spectra of the GBS_2 and GBS_3 samples. Apparently, the use of KIO4 oxidizer during the preparation of GBS reduces the defect concentration in a graphene layer. Therefore, the proposed synthesis protocol could be considered as a prospective intermediate stage in the preparation of graphene with a low defect concentration. The disappearance of the D band in graphite intercalation compounds is rather rarely mentioned by the other authors. Hardwick and co-authors observed this phenomenon during formation of the Li intercalation compound [57], and they attributed it either to the change in stacking order (from ABAB to AAAA) during the intercalant formation, or to solid interphase formation on the surface of crystallites. Dimiev et al. [20] also reported the phenomenon of D band disappearance during the synthesis of GBS. The main conclusion of their work was that the D band disappears in the Raman spectra of GBS consisting of pure stage 1 or stage 2, whereas in the transition stages this band appears. Considering our results (see Figure 4b), we can suggest that using a KIO4 oxidizer, the pure GBS of stage 1 was synthesized from the Gr_1 precursor with the smallest particle size. Precursors Gr_2 and Gr_3, composed of larger graphite particles, yield the mixture of stage 1 and stage 2. Furthermore, we plan for a more detailed investigation of GBS samples and their Raman spectra, which would allow for a more detailed explanation of the phenomenon of disappearance of the D band.
The values of FWHM(2D) (full width at half maximum of the 2D band) can be used to identify the number of layers in graphene-like material [26,46]. It was determined that the FWHM(2D) value of a single layer graphene is approximately 30 cm−1. When the number of stacked graphene layers increases, the values of FWHM(2D) also increases [20]. In addition, the shape of the 2D band can help to distinguish few-layer graphene from multilayer. Monolayer graphene has a single 2D component, bilayer graphene can be fitted into four components, and the 2D band of the multilayer graphene can be decomposed into two components. The calculated FWHM(2D) values of the synthesized samples (Figure 4) exceed 60 cm−1 and can be best fitted with two components, indicating that the materials obtained in this work have a multilayer structure. Different from the other samples, the 2D band is not visible in the Raman spectra of GBS_1. The other Raman data show that GBS_1 consists of a rather pure stage 1 phase. As the 2D peak is very sensitive to the stacking order of the graphite material along the c-axis, the decrease in the 2D band may occur due to the breaking of the mentioned stacking order [58]. The disappearance of the 2D band is an additional argument for the existing of AAAA stacking order in the GBS stage 1 phase.

3.4. XPS Analysis

Pristine graphite and EG and nanocomposite GP samples were analysed using XPS. Data about surface elemental composition of all analysed samples are summarised in Figure 5.
It should be noted that the difference in elemental composition is evident beginning from the pristine graphite samples although they are composed mostly of carbon but also contain traces of oxygen and nitrogen. The relatively high nitrogen content in the Gr_2 sample (0.33%) could be attributed to its synthetic nature. This precursor sample also contains the highest amount of oxygen. High resolution spectra in the C 1s region show that the oxygen is present in both graphite precursor samples as well as in GBS products in the form of functional groups attached to the edges of the graphene basal planes (see Figure S2). The signals of the C–O, C–O–C, C=O, and COOR groups are found in different proportions in all samples analysed. The intercalation procedure with subsequent both thermal and MW exfoliation, in principle, does not change the oxygen content in the analysed samples. On the contrary, the procedure of liquid phase exfoliation in the melt of NaHSO4 results in a significant increase in the oxygen content. This increase is inversely proportional to the particle size. Presumably, it occurs due to the reaction between graphite particles and the remains of the KIO4 oxidizer in GBS samples during the exfoliation procedure. Another result to be noted is the increase in the oxygen content in the nanocomposite GP samples. One can suggest that the reason for this increase is the presence of the (NH4)2S2O8 oxidizer during the mechanochemical reaction.
Some samples (EG_MW, EG_Na and GP) contain traces of sulfur. MW-treated samples can contain traces of H2SO4 not removed, whereas NaHSO4-treated samples can contain traces of Na2SO4. The source of sulfur in nanocomposite GP samples should be the (NH4)2S2O8 oxidizer present in the mechanochemical reaction.
The nitrogen content is significantly increased in the EG nanocomposite samples, which is a consequence of PPy shell formation on the surface of the EG core. The highest concentration of N is found in GP_2 (5.12%), whereas the lowest—in GP_3 (3.15%). The most probable explanation of this should be the highest concentration of oxygen and nitrogen in the pristine Gr_2, which is beneficial for the formation of PPy.
The high-resolution spectra in the N 1s region of the nanocomposite GP samples are presented in Figure 6.
Deconvolution of N 1s shows two nitrogen functional groups in the GP samples. The peak at around 400.0 eV is assigned to pyrrolic-N and the peak at around 402.0 eV belongs to graphitic-N. Pyrrolic-N refers to nitrogen atoms that are bonded to two carbon atoms and contribute to the π-system with two p-electrons. Graphitic-N refers to nitrogen atoms incorporated into graphene [59,60,61]. In this study, the pyrrolic-N has the most intense peak for all GP samples. It is evident that the main part of nitrogen in nanocomposite GP samples should be derived from PPy. Graphitic-N either may be found in pristine graphite samples (Gr_2) or can be formed near the graphitic core in the PPy shell. Huang et al. reported that graphitic-N contributes more effectively to catalytic activity [62]. Taking into account the data in Figure 6d, one can suggest that the GP_2 sample should provide the best electrocatalytic performance.

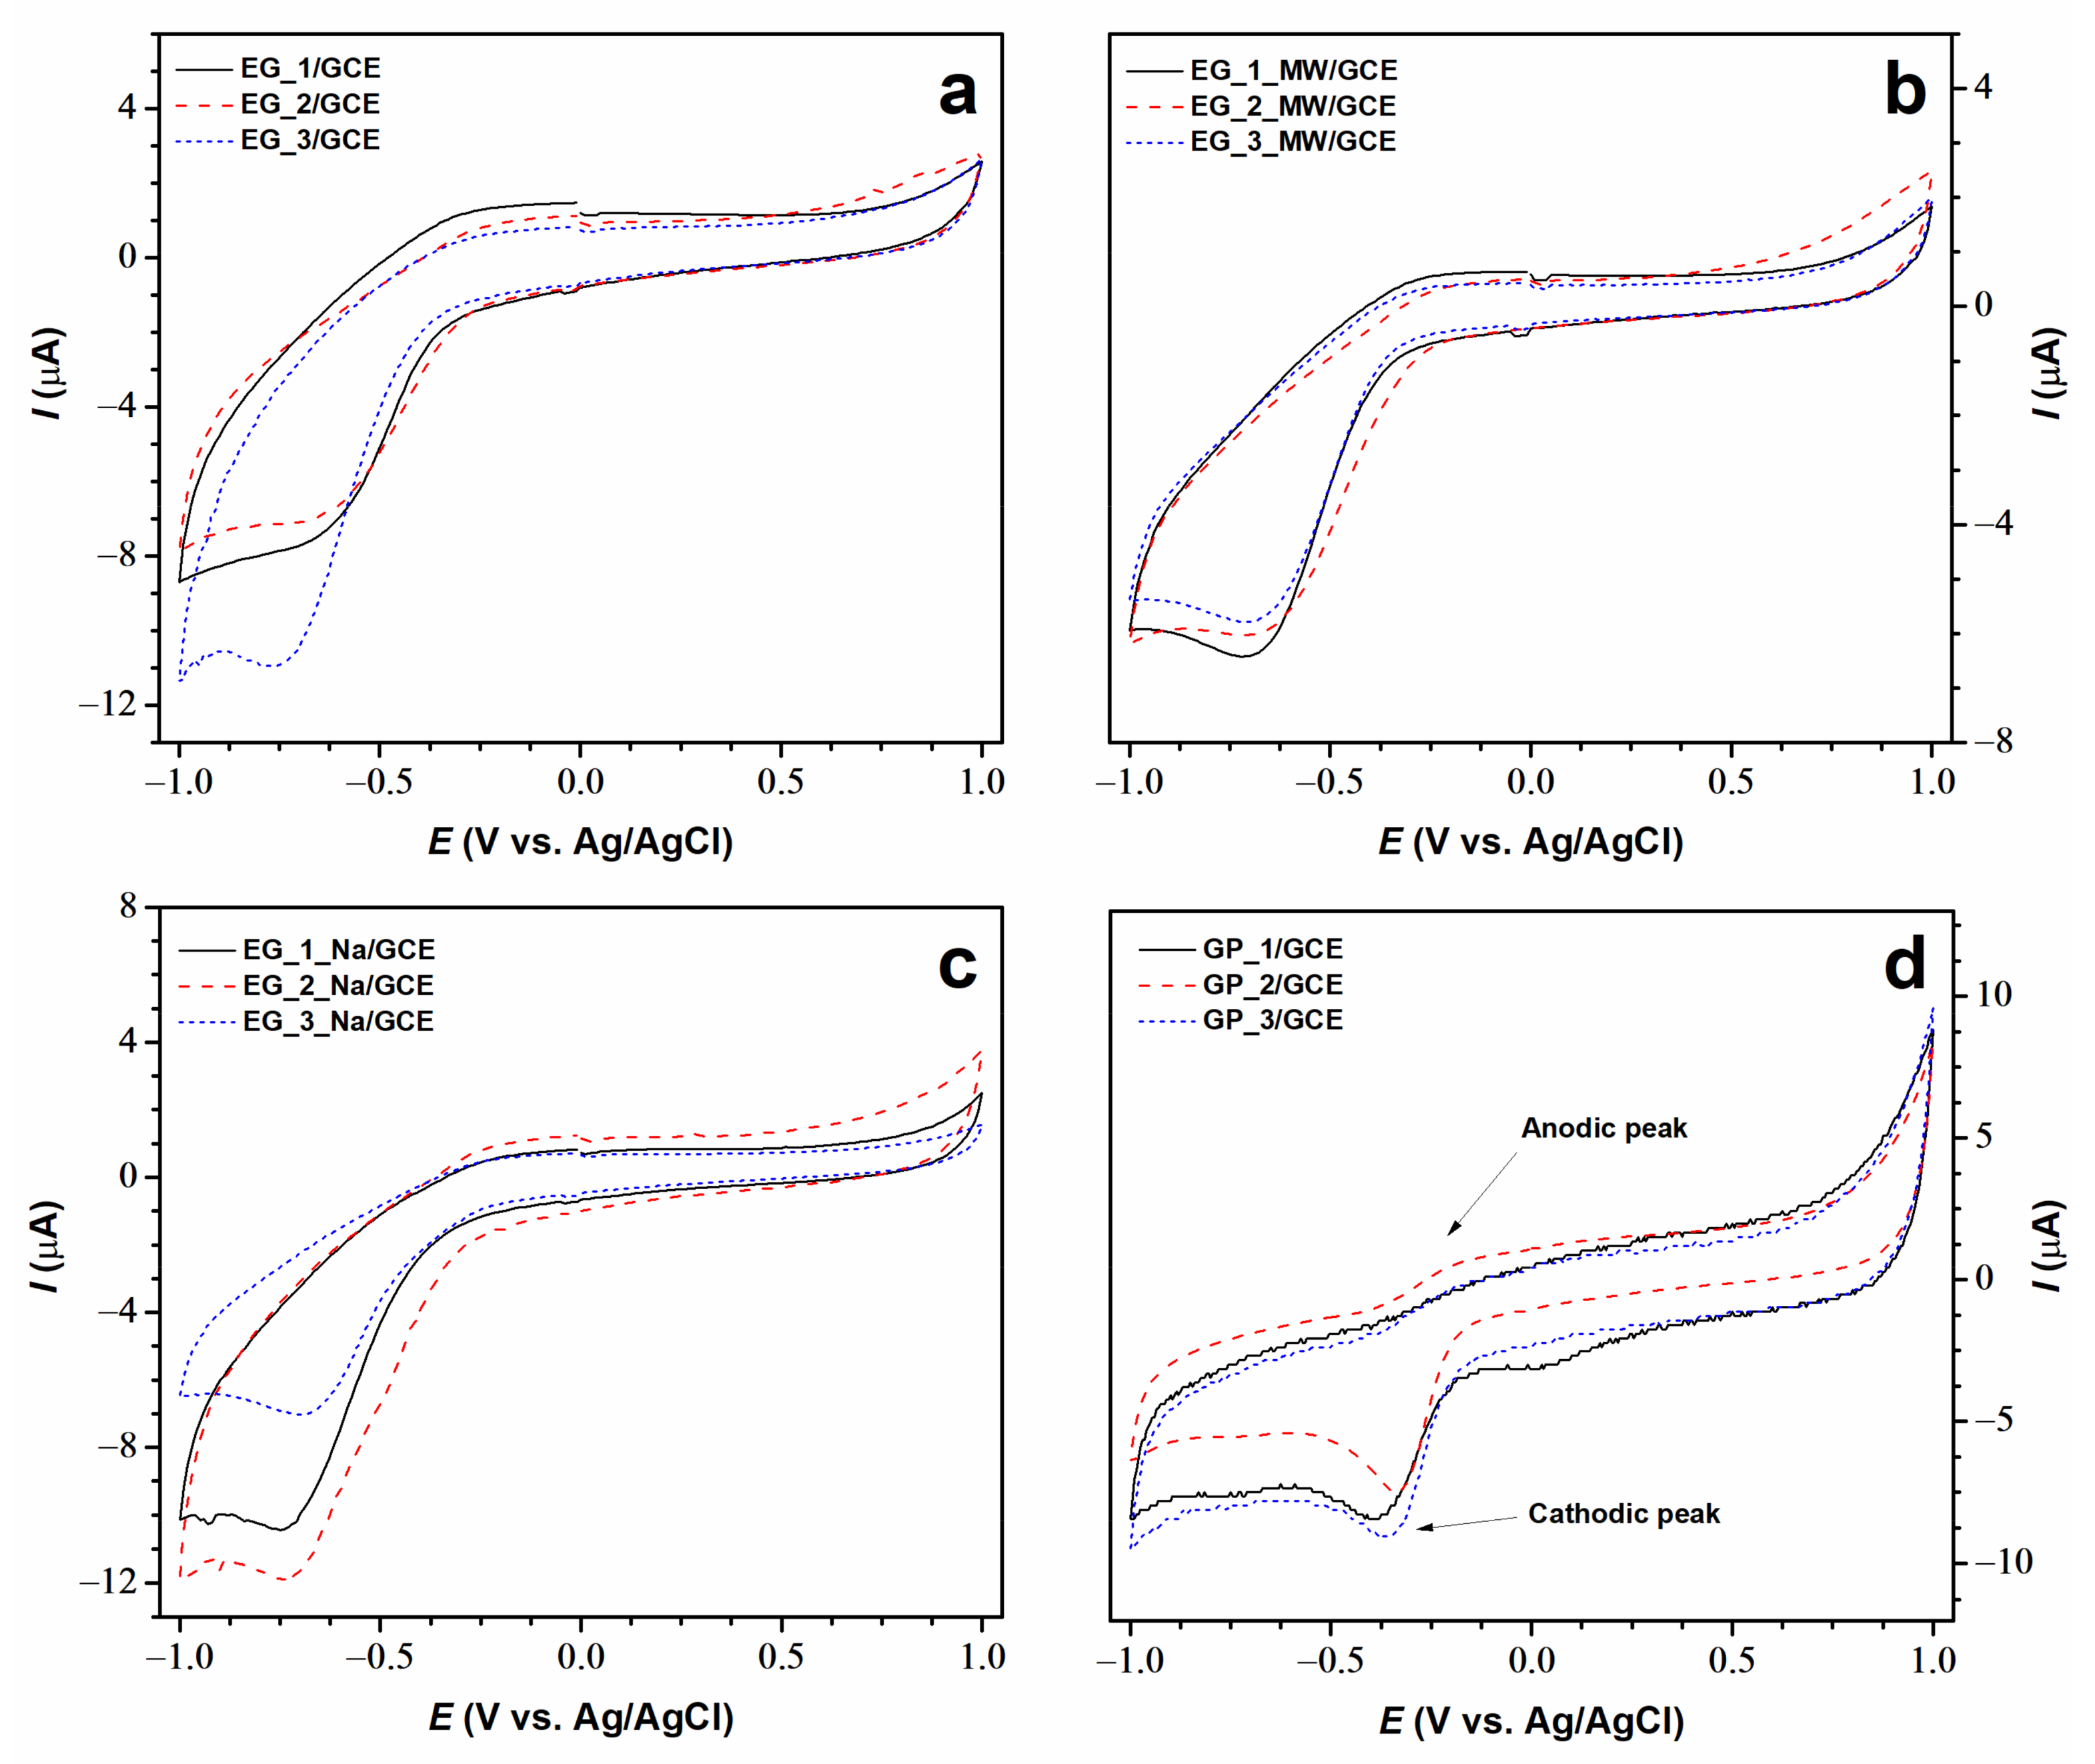
3.5. Electrochemical Study

The electrochemical study of synthesized EG, EG_MW, EG_Na, and nanocomposite GP samples was performed using CV. It is a standard technique for the characterization of the capacitive behaviour of cathode or anode materials [63]. CV at bare GCE is presented in Figure S3, whereas CVs obtained using modified GCEs are shown in Figure 7. A reduction of the oxy-species is observed at −0.8 V at bare GCE. GCEs modified with EG, EG_MW, and EG_Na samples showed a weak electrocatalytic response (Figure 7a–c), i.e., peak potential is observed at almost the same position as an unmodified electrode. Thereby, they are unsuitable as effective electrode materials. In Figure 7d, representing the CVs at nanocomposite GP samples, a cathodic peak at around –0.36 V and a new anodic peak at ca. –0.18 V are observed.
Therefore, the nanocomposite GP samples with a core–shell structure have much better electrocatalytic activity in comparison with those without a PPy shell. As seen, the most pronounced cathodic and anodic peaks are obtained using the GP_2 sample. As mentioned, this sample contains the highest amount of graphitic-N. The cathodic and anodic peaks appear due to the electron transfer associated with functional groups present on the surface and the incorporation of N atoms into graphene layers, since it could have provided the formation of active sites suitable for electrochemical events [64,65]. In addition, an increase in the electrochemical performance of GCE after modification with GP_1, GP_2, and GP_3 samples could be caused by good electrical conductivity acquired after the wet synthesis with the conducting polymer PPy. Thus, electrochemical investigations demonstrated that GP nanocomposites could be prospective for energy storage and/or biosensing.

4. Conclusions

The graphite bisulfate intercalation compound was prepared from three graphite precursors with different grain sizes using the KIO4 oxidising agent to assist the intercalation. The intercalation compounds obtained were further annealed, subjected to microwave irradiation, or stirred in the NaHSO4 melt to achieve the delamination/exfoliation effect. The heat-treated samples were used for the preparation of nanocomposites with polypyrrole by a wet synthesis protocol via a mechanochemical reaction. It was found that the particle size of the graphite precursor is substantial in determining the constitution of GBS phases of various staging indices; the smaller particles are beneficial for the formation of the stage 1 phase, whereas the larger particles result in the formation of the mixture of stage 1 and stage 2. The characteristic D band, which is caused by defects in the graphene layer, disappears in all Raman spectra of the GBS samples. Apparently, the use of the KIO4 oxidizer during the preparation of GBS reduces the defect concentration in a graphene layer. Thus, the proposed synthesis protocol could be considered as a prospective intermediate stage in the preparation of graphene with a low defect concentration. Therefore, this work contributes to the development of cost-effective, scalable, and highly efficient intercalation methods, which remain a significant challenge. Furthermore, the obtained results suggest that there was a structural change during the GBS formation reaction; the stacking order should change from ABAB to AAAA. In addition to Raman spectroscopy, SEM, XRD, and XPS data demonstrate that the exfoliation of GBS using thermal shock, microwave irradiation, or liquid phase delamination leads to a more defective structure than that of pristine graphite. It was established that the nanocomposites prepared from exfoliated graphene and polypyrrole have a core–shell structure, where the particle core is composed of exfoliated graphene covered by a polypyrrole shell. The electrochemical investigation of exfoliated samples and nanocomposites showed that the nanocomposite samples exhibit cathodic and anodic peaks and electrocatalytic properties. Among the samples of pristine graphite, the graphite containing the highest amount of graphitic-N has the highest electrocatalytic efficiency. Therefore, synthesized nanocomposites could be prospective materials for energy storage and/or biosensing.

Supplementary Materials

The following supporting information can be downloaded at: https://www.mdpi.com/article/10.3390/cryst12121793/s1, Figure S1. Raman spectra of graphite (a), GBS products (b), EG products (c), EG_MW products (d), EG_Na products (e), and EG samples modified with PPy (f). Figure S2. C 1s XPS spectra of pristine graphite, EG, and nanocomposite GP samples. Figure S3. CV at bare GCE.

Author Contributions

Conceptualization, J.G. and J.B.; methodology, J.G., R.P. and J.B.; software, G.R. and J.G.; validation, J.G., G.N. and R.P.; formal analysis, G.R. and G.N.; investigation, G.R. and J.G.; data curation, J.G. and J.B.; writing—original draft preparation, G.R.; writing—review and editing, J.G. and J.B.; visualization, G.R. and J.G.; supervision, J.G. and J.B. All authors have read and agreed to the published version of the manuscript.

Funding

This research received no external funding.

Data Availability Statement

Data are contained within the article.

Conflicts of Interest

The authors declare no conflict of interest.

References

  1. Garcia-Hernandez, M.; Coleman, J. Materials science of graphene: A flagship perspective. 2D Mater. 2016, 3, 010401. [Google Scholar] [CrossRef]
  2. Lee, J.H.; Lee, E.K.; Joo, W.J.; Jang, Y.; Kim, B.S.; Lim, J.Y.; Choi, S.H.; Ahn, S.J.; Ahn, J.R.; Park, M.H.; et al. Wafer-scale growth of single-crystal monolayer graphene on reusable hydrogen-terminated germanium. Science 2014, 344, 286–289. [Google Scholar] [CrossRef] [PubMed]
  3. Hao, Y.; Bharathi, M.S.; Wang, L.; Liu, Y.; Chen, H.; Nie, S.; Wang, X.; Chou, H.; Tan, C.; Fallahazad, B.; et al. The role of surface oxygen in the growth of large single-crystal graphene on copper. Science 2013, 342, 720–723. [Google Scholar] [CrossRef] [PubMed] [Green Version]
  4. Eigler, S.; Hirsch, A. Chemistry with graphene and graphene oxide challenges for synthetic chemists. Angew. Chem. Int. Ed. 2014, 53, 7720–7738. [Google Scholar] [CrossRef] [PubMed] [Green Version]
  5. Georgakilas, V.; Otyepka, M.; Bourlinos, A.B.; Chandra, V.; Kim, N.; Kemp, K.C.; Hobza, P.; Zboril, R.; Kim, K.S. Functionalization of graphene: Covalent and non-covalent approaches, derivatives and applications. Chem. Rev. 2012, 112, 6156–6214. [Google Scholar] [CrossRef]
  6. Mao, H.Y.; Laurent, S.; Chen, W.; Akhavan, O.; Imani, M.; Ashkarran, A.A.; Mahmoudi, M. Graphene: Promises, facts, opportunities, and challenges in nanomedicine. Chem. Rev. 2013, 113, 3407–3424. [Google Scholar] [CrossRef]
  7. Dreyer, D.R.; Todd, A.D.; Bielawski, C.W. Harnessing the chemistry of graphene oxide. Chem. Soc. Rev. 2014, 43, 5288–5301. [Google Scholar] [CrossRef]
  8. Dreyer, D.R.; Park, S.; Bielawski, C.W.; Ruoff, R.S. The chemistry of graphene oxide. Chem. Soc. Rev. 2010, 39, 228–240. [Google Scholar] [CrossRef]
  9. Criado, A.; Melchionna, M.; Marchesan, S.; Prato, M. The covalent functionalization of graphene on substrates. Angew. Chem. Int. Ed. 2015, 54, 0734–10750. [Google Scholar] [CrossRef]
  10. Eigler, S.; Dotzer, C.; Hirsch, A. Visualization of defect densities in reduced graphene oxide. Carbon 2012, 50, 3666–3673. [Google Scholar] [CrossRef]
  11. Du, W.; Geng, H.; Yang, Y.; Zhang, Y.; Rui, X.; Li, C.C. Pristine graphene for advanced electrochemical energy applications. J. Power Sources 2019, 437, 226899. [Google Scholar] [CrossRef]
  12. Kovtyukhova, N.I.; Wang, Y.; Berkdemir, A.; Cruz-Silva, R.; Terrones, M.; Crespi, V.H.; Mallouk, T.E. Non-oxidative intercalation and exfoliation of graphite by Brønsted acids. Nat. Chem. 2014, 6, 957–963. [Google Scholar] [CrossRef]
  13. Aghamohammadi, H.; Eslami-Farsani, R.; Torabian, M.; Amousa, N. Recent advances in one-pot functionalization of graphene using electrochemical exfoliation of graphite: A review study. Synth. Met. 2020, 269, 116549. [Google Scholar] [CrossRef]
  14. Ruse, E.; Larboni, M.; Lavi, A.; Pyrikov, M.; Leibovitch, Y.; Ohayon-Lavi, A.; Vradman, L.; Regev, O. Molten salt in-situ exfoliation of graphite to graphene nanoplatelets applied for energy storage. Carbon 2021, 176, 168–177. [Google Scholar] [CrossRef]
  15. Du, W.; Jiang, X.; Zhu, L. From graphite to graphene: Direct liquid-phase exfoliation of graphite to produce single- and few-layered pristine graphene. J. Mater. Chem. A 2013, 1, 10592. [Google Scholar] [CrossRef]
  16. Xu, Y.; Cao, H.; Xue, Y.; Li, B.; Cai, W. Liquid-phase exfoliation of graphene: An overview on exfoliation media, techniques, and challenges. Nanomaterials 2018, 8, 942. [Google Scholar] [CrossRef] [Green Version]
  17. Brodie, B. Note sur un nouveau procédé pour la purification et la désagrégation du graphite. Ann. Chim. Phys. 1855, 45, 351–448. [Google Scholar]
  18. Aronson, S.; Frishberg, C.; Frankl, G. Thermodynamic properties of the graphite-bisulfate lamellar compounds. Carbon 1971, 9, 715–723. [Google Scholar] [CrossRef]
  19. Daumas, N.; Herold, A. Notes des membres et correspontants et notes présentées ou transmises par leurs soins. C. R. Acad. Sci. Ser. C 1969, 268, 373–375. [Google Scholar]
  20. Dimiev, A.M.; Ceriotti, G.; Behabtu, N.; Zakhidov, D.; Pasquali, M.; Saito, R.; Tour, J.M. Direct real-time monitoring of stage transitions in graphite intercalation compounds. ACS Nano 2013, 7, 2773–2780. [Google Scholar] [CrossRef]
  21. Chiang, C.K.; Fincher, C., Jr.; Park, Y.W.; Heeger, A.J.; Shirakawa, H.; Louis, E.J.; Gau, S.C.; MacDiarmid, A.G. Electrical conductivity in doped polyacetylene. Phys. Rev. Lett. 1977, 39, 1098. [Google Scholar] [CrossRef]
  22. Ohta, T.; Bostwick, A.; Seyller, T.; Horn, K.; Rotenberg, E. Controlling the electronic structure of bilayer graphene. Science 2006, 313, 951–954. [Google Scholar] [CrossRef] [PubMed]
  23. Mouri, S.; Miyauchi, Y.; Matsuda, K. Tunable photoluminescence of monolayer MoS2 via chemical doping. Nano Lett. 2013, 13, 5944–5948. [Google Scholar] [CrossRef] [PubMed] [Green Version]
  24. Tongay, S.; Zhou, J.; Ataca, C.; Liu, J.; Kang, J.S.; Matthews, T.S.; You, L.; Li, J.; Grossman, J.C.; Wu, J. Broad-range modulation of light emission in two-dimensional semiconductors by molecular physisorption gating. Nano Lett. 2013, 13, 2831–2836. [Google Scholar] [CrossRef]
  25. Novoselov, K.S.; Geim, A.K.; Morozov, S.V.; Jiang, D.; Zhang, Y.; Dubonos, S.V.; Grigorieva, I.V.; Firsov, A.A. Electric field effect in atomically thin carbon films. Science 2004, 306, 666–669. [Google Scholar] [CrossRef] [Green Version]
  26. Ryu, S.; Liu, L.; Berciaud, S.; Yu, Y.-J.; Liu, H.; Kim, P.; Flynn, G.W.; Brus, L.E. Atmospheric oxygen binding and hole doping in deformed graphene on a SiO2 substrate. Nano Lett. 2010, 10, 4944–4951. [Google Scholar] [CrossRef] [Green Version]
  27. Park, K.; Kang, H.; Koo, S.; Lee, D.; Ryu, S. Redox-governed charge doping dictated by interfacial diffusion in two-dimensional materials. Nat. Commun. 2019, 10, 4931. [Google Scholar] [CrossRef] [Green Version]
  28. Kang, H.; Ryu, S. Optical imaging of chemically and geometrically controlled interfacial diffusion and redox in 2D van der Waals space. J. Phys. Chem. C 2021, 125, 16819–16826. [Google Scholar] [CrossRef]
  29. Puech, P.; Hu, T.; Sapelkin, A.; Gerber, I.; Tishkova, V.; Pavlenko, E.; Levine, B.; Flahaut, E.; Bacsa, W. Charge transfer between carbon nanotubes and sulfuric acid as determined by Raman spectroscopy. Phys. Rev. B 2012, 85, 205412. [Google Scholar] [CrossRef] [Green Version]
  30. Lünsdorf, N.K. Raman spectroscopy of dispersed vitrinite—Methodical aspects and correlation with reflectance. Int. J. Coal Geol. 2016, 153, 75–86. [Google Scholar] [CrossRef]
  31. Zaaba, N.I.; Foo, K.L.; Hashim, U.; Tan, S.J.; Liu, W.W.; Voon, C.H. Synthesis of graphene oxide using modified hummers method: Solvent influence. Procedia Eng. 2017, 184, 469–477. [Google Scholar] [CrossRef]
  32. Ivanov, A.V.; Maksimova, N.V.; Kamaev, A.O.; Malakho, A.P.; Avdeev, V.V. Influence of intercalation and exfoliation conditions on macrostructure and microstructure of exfoliated graphite. Mater. Lett. 2018, 8, 403–406. [Google Scholar] [CrossRef]
  33. Dimiev, A.M.; Shukhina, K.; Behabtu, N.; Pasquali, M.; Tour, J.M. Stage transitions in graphite intercalation compounds: Role of the graphite structure. J. Phys. Chem. C 2019, 123, 19246–19253. [Google Scholar] [CrossRef]
  34. Bonaccorso, F.; Lombardo, A.; Hasan, T.; Sun, Z.; Colombo, L.; Ferrari, A.C. Production and processing of graphene and 2D crystals. Mater. Today 2012, 15, 564–589. [Google Scholar] [CrossRef]
  35. Freire, M.G.; Cláudio, A.F.M.; Araújo, J.M.M.; Coutinho, J.A.P.; Marrucho, I.M.; Canongia Lopes, J.N.; Rebelo, L.P.N. Aqueous biphasic systems: A boost brought about by using ionic liquids. Chem. Soc. Rev. 2012, 41, 4966–4995. [Google Scholar] [CrossRef]
  36. Yao, J.; Liu, C.; Liu, X.; Guo, J.; Zhang, S.; Zheng, J.; Li, S. Azobenzene-assisted exfoliation of 2D covalent organic frameworks into large-area, few-layer nanosheets for high flux and selective molecular separation membrane. J. Membr. Sci. 2020, 601, 117864. [Google Scholar] [CrossRef]
  37. Wu, W.; Yang, L.; Chen, S.; Shao, Y.; Jing, L.; Zhao, G.; Wei, H. Core–shell nanospherical polypyrrole/graphene oxide composites for high performance supercapacitors. RSC Adv. 2015, 5, 91645–91653. [Google Scholar] [CrossRef]
  38. Hou, B.; Sun, H.J.; Peng, T.J.; Zhang, X.Y.; Ren, Y.Z. Rapid preparation of expanded graphite at low temperature. New Carbon Mater. 2020, 35, 262–268. [Google Scholar] [CrossRef]
  39. Cooper, A.J.; Wilson, N.R.; Kinloch, I.A.; Dryfe, R.A.W. Single stage electrochemical exfoliation method for the production of few-layer graphene via intercalation of tetraalkylammonium cations. Carbon 2014, 66, 340–350. [Google Scholar] [CrossRef]
  40. Trusovas, R.; Ratautas, K.; Račiukaitis, G.; Niaura, G. Graphene layer formation in pinewood by nanosecond and picosecond laser irradiation. Appl. Surf. Sci. 2019, 471, 154–161. [Google Scholar] [CrossRef]
  41. Seiler, S.; Halbig, C.E.; Grote, F.; Rietsch, P.; Börrnert, F.; Kaiser, U.; Meyer, B.; Eigler, S. Effect of friction on oxidative graphite intercalation and high-quality graphene formation. Nat. Commun. 2018, 9, 836. [Google Scholar] [CrossRef] [PubMed] [Green Version]
  42. Ferrari, A.C.; Robertson, J. Raman spectroscopy of amorphous, nanostructured, diamond-like carbon, and nanodiamond. Philos. Trans. R. Soc. 2004, 362, 2477–2512. [Google Scholar] [CrossRef] [PubMed]
  43. ChacónChac, J.C.; Wirtz, L.; Pichler, T. Raman spectroscopy of graphite intercalation compounds: Charge transfer, strain, and electron-phonon coupling in graphene layers. Phys. Status Solidi B 2014, 251, 2337–2355. [Google Scholar] [CrossRef] [Green Version]
  44. Gurzęda, B.; Buchwald, T.; Krawczyk, P. Thermal exfoliation of electrochemically synthesized graphite intercalation compound with perrhenic acid. J. Solid State Electrochem. 2020, 24, 1363–1370. [Google Scholar] [CrossRef]
  45. Eigler, S. Graphite sulphate—A precursor to graphene. Chem. Commun. 2015, 51, 3162–3165. [Google Scholar] [CrossRef] [Green Version]
  46. Pei, S.; Wei, Q.; Huang, K.; Cheng, H.M.; Ren, W. Green synthesis of graphene oxide by seconds timescale water electrolytic oxidation. Nat. Commun. 2018, 9, 145. [Google Scholar] [CrossRef] [Green Version]
  47. Trusovas, R.; Račiukaitis, G.; Niaura, G.; Barkauskas, J.; Valušis, G.; Pauliukaite, R. Recent advances in laser utilization in the chemical modification of graphene oxide and its applications. Adv. Opt. Mater. 2016, 4, 37–65. [Google Scholar] [CrossRef]
  48. Ferrari, A.C. Raman spectroscopy of graphene and graphite: Disorder, electron-phonon coupling, doping and nonadiabatic effects. Solid State Commun. 2007, 143, 47–57. [Google Scholar] [CrossRef]
  49. Douda, J.; González Vargas, C.R.; Basiuk, E.V.; Díaz Cano, A.I.; Fuentes García, J.A.; Hernández Contreras, X.A. Optical properties of amine-functionalized graphene oxide. Appl. Nanosci. 2019, 9, 567–578. [Google Scholar] [CrossRef]
  50. Zhou, X.; Liu, Q.; Jiang, C.; Ji, B.; Ji, X.; Tang, Y.; Cheng, H.-M. Strategies towards low-cost dual-ion batteries with high performance. Angew. Chem. Int. Ed. 2020, 59, 3802–3832. [Google Scholar] [CrossRef]
  51. Zou, J.; Sole, C.; Drewett, N.E.; Velický, M.; Hardwick, L.J. In situ study of li intercalation into highly crystalline graphitic flakes of varying thicknesses. J. Phys. Chem. Lett. 2016, 7, 4291–4296. [Google Scholar] [CrossRef] [Green Version]
  52. Salvatore, M.; Carotenuto, G.; de Nicola, S.; Camerlingo, C.; Ambrogi, V.; Carfagna, C. Synthesis and characterization of highly intercalated graphite bisulfate. Nanoscale Res. Lett. 2017, 12, 167. [Google Scholar] [CrossRef]
  53. Chung, D.D.L. A review of exfoliated graphite. J. Mater. Sci. 2015, 51, 554–568. [Google Scholar] [CrossRef]
  54. Okan, B.S.; Yürüm, A.; Gorgülü, N.; Gürsel, S.A.; Yürüm, Y. Polypyrrole coated thermally exfoliated graphite nanoplatelets and the effect of oxygen surface groups on the interaction of platinum catalysts with graphene-based nanocomposites. Ind. Eng. Chem. Res. 2011, 50, 12562–12571. [Google Scholar] [CrossRef]
  55. Kulandaivalu, S.; Suhaimi, N.; Sulaiman, Y. Unveiling high specific energy supercapacitor from layer-by-layer assembled polypyrrole/graphene oxide|polypyrrole/manganese oxide electrode material. Sci. Rep. 2019, 9, 4884. [Google Scholar] [CrossRef] [Green Version]
  56. Shams, S.S.; Zhang, R.; Zhu, J. Graphene synthesis: A Review. Mater. Sci. Pol. 2015, 33, 566–578. [Google Scholar] [CrossRef] [Green Version]
  57. Hardwick, L.J.; Buqa, H.; Novák, P. Graphite surface disorder detection using in situ Raman microscopy. Solid State Ion. 2006, 177, 2801–2806. [Google Scholar] [CrossRef]
  58. Krishnamoorthy, K.; Veerapandian, M.; Yun, K.; Kim, S.J. The chemical and structural analysis of graphene oxide with different degrees of oxidation. Carbon 2013, 53, 38–49. [Google Scholar] [CrossRef]
  59. Shao, Y.; Zhang, S.; Engelhard, M.H.; Li, G.; Shao, G.; Wang, Y.; Liu, J.; Aksay, I.A.; Lin, Y. Nitrogen-doped graphene and its electrochemical applications. J. Mater. Chem. 2010, 20, 7491–7496. [Google Scholar] [CrossRef]
  60. Lai, L.; Potts, J.R.; Zhan, D.; Wang, L.; Poh, C.K.; Tang, C.; Gong, H.; Shen, Z.; Lin, J.; Ruoff, R.S. Exploration of the active center structure of nitrogen-doped graphene-based catalysts for oxygen reduction reaction. Energy Environ. Sci. 2012, 5, 7936–7942. [Google Scholar] [CrossRef]
  61. Lee, Y.H.; Chang, K.H.; Hu, C.C. Differentiate the pseudocapacitance and double-layer capacitance contributions for nitrogen-doped reduced graphene oxide in acidic and alkaline electrolytes. J. Power Sources 2013, 227, 300–308. [Google Scholar] [CrossRef]
  62. Huang, Z.; Zhou, H.; Yang, W.; Fu, C.; Chen, L.; Kuang, Y. Three-dimensional hierarchical porous nitrogen and sulfur-codoped graphene nanosheets for oxygen reduction in both alkaline and acidic media. ChemCatChem 2017, 9, 987–996. [Google Scholar] [CrossRef]
  63. Zhang, Y.; Ma, M.; Yang, J.; Huang, W.; Dong, X. Graphene-based three-dimensional hierarchical sandwich-type architecture for high performance supercapacitors. RSC Adv. 2014, 4, 8466–8471. [Google Scholar] [CrossRef]
  64. Gaidukevic, J.; Aukstakojyte, R.; Barkauskas, J.; Niaura, G.; Murauskas, T.; Pauliukaite, R. A novel electrochemical sensor based on thermally reduced graphene oxide for the sensitive determination of dopamine. Appl. Surf. Sci. 2022, 592, 153257. [Google Scholar] [CrossRef]
  65. Oliveira, L.S.; Alba, J.F.G.; Silva, V.L.; Ribeiro, R.T.; Falcão, E.H.L.; Navarro, M. The effect of surface functional groups on the performance of graphite powders used as electrodes. J. Electroanal. Chem. 2018, 818, 106–113. [Google Scholar] [CrossRef]
Figure 1. Optical micrographs of GBS_1 (a), GBS_2 (b), and GBS_3 (c).
Crystals 12 01793 g001
Figure 2. SEM micrographs of precursor graphite of different grain sizes, EG and GP products: Gr_1 (a), Gr_2 (b), Gr_3 (c), EG_1 (d), EG_2 (e), EG_3 (f), EG_1_MW (g), EG_2_MW (h), EG_3_MW (i), EG_1_Na (j), EG_1_Na (k), EG_1_Na (l), GP_1 (m), GP_2 (n), and GP_3 (o).
Crystals 12 01793 g002
Figure 3. XRD patterns of pristine graphite (a), EG (b), and EG samples modified with PPy (c).
Crystals 12 01793 g003
Figure 4. Raman spectra of precursors and GBS products in G (1500–1700 cm−1) and 2D (2500–2900 cm−1) band frequencies: pristine graphite of different grain sizes (a), GBS samples (b), EG samples (c), EG_MW samples (d), EG_Na samples (e), and EG samples modified with PPy (f).
Crystals 12 01793 g004
Figure 5. Surface elemental composition of pristine graphite and EG and nanocomposite samples determined by XPS analysis.
Crystals 12 01793 g005
Figure 6. N 1s XPS spectra of nanocomposite GP samples: GP_1 (a), GP_2 (b), and GP_3 (c). Distribution of nitrogen bonds in GP samples (d).
Crystals 12 01793 g006
Figure 7. CVs of EG/GCE (a), EG_MW/GCE (b), EG_Na/GCE (c) and GP/GCE (d) samples.
Crystals 12 01793 g007
Table 1. Data obtained from XRD analysis (positions, interplanar spacing d002, and crystallite size), and Raman spectra (ID/IG ratio).
Sample (deg)d002 (nm)L (nm)ID/IG
Gr_126.540.33631.290.297
Gr_226.520.33633.800.104
Gr_326.500.33662.870.028
EG_126.380.33820.540.185
EG_226.450.33740.210.114
EG_326.520.33639.090.093
EG_1_MW26.430.33723.680.259
EG_2_MW26.460.33724.100.114
EG_3_MW26.420.33716.970.118
EG_1_Na26.810.33224.030.196
EG_2_Na26.740.33336.920.100
EG_3_Na26.760.33344.180.065
GP_126.410.33726.350.580
GP_226.460.33736.420.483
GP_326.450.33732.320.504
Publisher’s Note: MDPI stays neutral with regard to jurisdictional claims in published maps and institutional affiliations.

