Article

Rapid Growth of High-Quality Rutile TiO2 Single Crystals through a Laser Floating Zone Method

1
Tianjin Key Laboratory of Functional Crystal Materials, Institute of Functional Crystals, Tianjin University of Technology, Tianjin 300384, China
2
School of Materials Science and Engineering, Linyi University, Linyi 276000, China
3
State Key Laboratory of Crystal Materials, Shandong University, Jinan 250100, China
*
Authors to whom correspondence should be addressed.
Crystals 2022, 12(12), 1789; https://doi.org/10.3390/cryst12121789
Submission received: 22 November 2022 / Revised: 4 December 2022 / Accepted: 5 December 2022 / Published: 9 December 2022

Abstract

:
The rapid growth of rutile TiO2 single crystals through a laser floating zone (LFZ) method was demonstrated. LFZ has a higher power density, which is suitable for the growth of TiO2 crystals with a high melting point. By optimizing the crystal growth parameters, including the growth rate, gas atmosphere, and rotation rate, the crystals could achieve their largest size of φ 9 mm × 25 mm, with a growth cycle of 12 h, and no cracks appeared. The properties of the obtained crystals were close to those of the crystals grown using other schemes, with a whole transmission range of 0.41–6.56 μm, thermal expansion coefficient of 9.92 × 10⁻⁶/K, and laser damage threshold of 1.44 GW/cm2. The achieved results indicated that the crystals have high quality and good integrity when grown using LFZ and also imply a new choice for the rapid growth of rutile TiO2 single crystals.

1. Introduction

TiO2 crystals have widespread applications in optical telecommunications, photocatalysis, photoelectric detection, optical polarizers, and so on [1,2,3]. For example, rutile TiO2 single crystals can be made into polarizing devices from visible to mid-infrared, owing to their large birefringence (Δ𝑛 = 0.26) [4], fine chemical resistance [3], and high transmittance in the wide band (0.4–4.5 μm) [1]. Therefore, many types of polarizers made of rutile single crystals are now available in various optical devices [5]. Rutile crystals can be easily reduced to a non-stoichiometric Magnél phase (TinO2n−1) at a high temperature [2,6] and appear dark yellow or blue, while intrinsic defects, such as dislocations, low-angle grain boundaries, and oxygen vacancies, will inevitably occur in large-size crystals [7]. Rutile crystals are usually grown using a hydrothermal method [8,9], cosolvent method [10], Czochralski method [11,12], Verneuil method [13,14], and floating zone method [6,7]. Among them, the size of TiO2 crystals grown using a hydrothermal method and cosolvent method is limited to a one-dimensional nanometer scale [9]. The Czochralski method is the most suitable method for growing large crystals with uniform melting. However, the critical length of the crystal that can be pulled is limited due to the melt properties in the rutile single crystal grown using this method. A slightly faster pulling rate will cause the crystal to solidify laterally, and the size of the melting zone is affected by the crucible size [5,12]. At present, the most commonly used methods for rutile crystal growth are the Verneuil method and floating zone method. The growth rate is not easy to control in the conventional Verneuil method [13]. In the latest research, an intelligent control system was introduced and a numerical simulation was used to optimize the growth parameters, to improve crystal quality [1]. However, the etching pit density (EPD) is slightly higher than that of crystals grown using the floating zone method, which is still a problem to be overcome.
With the development of light heating (laser, xenon, or halogen lamps, etc.), the optical floating zone method was proposed as a relatively easy approach for the preparation of centimeter-diameter single crystals [15]. This method does not need a crucible and has a short growth cycle, and the growth process can be monitored in real time [16]. Nevertheless, the radial temperature distribution of the interface is not uniform, and the growth interface is in an unstable state. After the evolution from a single ellipsoid to a double ellipsoid and then to a quadruple-ellipsoid Xenon lamp mirror furnace, a new anisotropic heating floating zone (AHFZ) method and asymmetric focusing tilted mirror floating zone (TMFZ) method were proposed based on a quadruple-ellipsoid-mirror-type image furnace to improve the heating density of the light source and the stability of the melting zone by changing the furnace structure [17]. As a kind of optical heating, the laser floating zone method has absolute superiority in its light source. It has also been associated with the early simple-laser-heated pedestal growth method (LHPG) and then the improved four-beam CO2 laser (1.5 kW) heated floating zone (LHFZ) method [15,18]. In this paper, a five-laser-focused 945 nm laser (2 kW) was used for the heating source. A more uniform heating field, more symmetrical arrangement, and higher energy density help to reduce thermal stress during the crystal growth process, thereby reducing the cracks and ensuring the quality of the crystals.
In this work, the high-quality and larger-sized rutile TiO2 crystals were examined using the improved laser floating zone method. By optimizing the process parameters, such as atmosphere, growth rate, and rotation rate, a rutile single crystal with a maximum size of φ9 mm × 25 mm and with no crack and inclusion was obtained. A wide transmission range of 0.41–6.56 μm is beneficial for optical applications. The optical and thermal properties of crystals were similar to those of crystals grown using other methods, indicating a new approach for the rapid growth of high-quality centimeter-scale rutile single crystals.

2. Materials and Methods

A new type of floating zone furnace (Quantum Design, Japan, the L-FZ-2000 (Laser FZ)) was used by our research group for crystal growth experiments. It is a heating furnace focused using five laser sources with a rated total power of 2 kW and a maximum temperature of 3000 °C. The principle of the growth device is shown in Figure 1. Among them, five laser heads are placed circumferentially, and each laser is equipped with a damper at 180° opposite to capture the stray laser power.
The raw material was nano-anatase TiO2 powder with a purity of 99.999% (Shanghai Zhongye New Material Co., Ltd., Shanghai, China). At first, the polycrystalline material was put into a rubber band using a long glass bar and shaped like a cylindrical rod of φ7 mm × 80 mm. A vacuum pump (Value vacuum VRD-8, Taizhou, China) was used to remove the air from the well-made rod for 5 min. The bar was then sealed and placed in a cold isostatic press (Riken seiki P-1B, Tokyo, Japan) for extrusion, at 60 MPa for 10 min. After cutting the balloon with a blade, it was punched at about 5 mm from the top of the molded bar, and two vertical slots were made along the hole in the axial direction for securing. Then the molded specimen was placed into a muffle furnace (Kjmti KSL-1700X-A2 (UL), Hefei, China) and heated to 1300 °C for 12 h. When the sintered rod was suspended into the furnace, the eccentricity of the upper and lower rods cannot exceed 2 mm. The sintered and seed rods were rotated at 20 rpm in opposite directions, and the crystal was grown in flowing air at a speed of 6 mm/h. The atmosphere of crystal growth was a mixture of high-purity O2:Ar2 (7:3) for the entire process, and the oxygen partial pressure was 0.1 MPa. Because there was huge thermal stress inside the crystal, it needed to be annealed at 1300 °C for 48 h and then recovered to an inherent pale-yellow color.
The polished crystal was investigated with a field-effect scanning electron microscope (FE SEM) with a model of Quanta FEG 250 using an acceleration voltage of 10 keV, and the distribution of atoms was tested using an Energy Dispersive Spectrometer (EDS). Powder X-ray diffraction patterns were obtained at room temperature over the 2θ range of 20–80° and a step size of 0.01° using a Rigaku SmartLab3kW focus diffractometer. A UV-vis-NIR spectrophotometer (Techcomp UH4150, Shanghai, China) and Fourier-transform infrared spectrophotometer (Thermo Scientific Nicolet iS50 FT-IR, Waltham, MA, USA) were used to record the optical transmission characteristics at 200–2500 nm and 4000–400 cm−1, respectively. The room-temperature excitation and photoluminescence spectra were measured using a fluorescence spectrometer and the model of Techcomp FLS980. Raman scattering signals were captured with a confocal Raman spectrometer (WITec Alpha300RA, Ulm, Germany) with an exciting wavelength at 532 nm at room temperature. Thermal expansion measurements were carried out between 300 K and 1000 K using a thermal mechanical analyzer (Netzsch DIL402SU, Bavaria, Germany) with a step of 5 K.

3. Results and Discussion

3.1. Crystal Growth

Crystal growth comprises necking, shouldering, and equal-diameter processes (Figure S1, Supporting Information). During the crystal growth cycle, the control and optimization of different growth process parameters, such as the shape and temperature of the melting zone (Figure S2), growth rate, atmosphere selection, rotation rate, and so on, all play an important role in the results. The crystals grown using a relatively low-melting-zone temperature had a color consistent with that of stoichiometric rutile, while those grown using a higher-melting-zone temperature tended to be dark, showing that the crystal coloring may be a function of the melting zone temperature. Growth rates more than 6 mm/h tend to produce severe cracks and obvious internal defects, while lower growth rates result in subgrain boundaries [6]. The higher growth rates help to cool the grown crystal faster, reduce the time of dislocation migration, and effectively inhibit the formation of low-angle grain boundaries [3]. Therefore, we determined the growth rate to be 6 mm/h.
By controlling the amount of oxygen in the growing atmosphere, rutile TiO2 single crystals with different colors (Figure 2a–c) were obtained. Crystals appeared blue in anoxic conditions and turned light yellow as the oxygen content increased. Commercial titanium dioxide crystals grow in a CO2 atmosphere flow, in which the partial pressure of O2 plays a vital role in the color of the crystal. It was reported that the color of crystals is a function of the partial pressure of oxygen [2,6]. Rutile crystals grown at a high partial pressure of oxygen (0.5 MPa) were closer to those in Figure 2b, while those grown at low oxygen pressure (1 kPa) were similar to those in Figure 2a. The effect of high oxygen pressure on the growth of crystals would degrade the oxygen coming out of the melting zone and physically compensate for the vacancy points [7], thus, obtaining high-quality rutile single crystals. All the same, pure oxygen flow is not suitable for obtaining high-quality rutile single crystals [3], as the crystals grown in this case usually contain many low-angle grain boundaries. Variation in the oxygen pressure within a range of 0.1–0.5 MPa has no apparent effect on either the quality or color of the crystals [6]. To sum up, a mixed atmosphere with a higher oxygen partial pressure of 0.1 MPa was introduced.
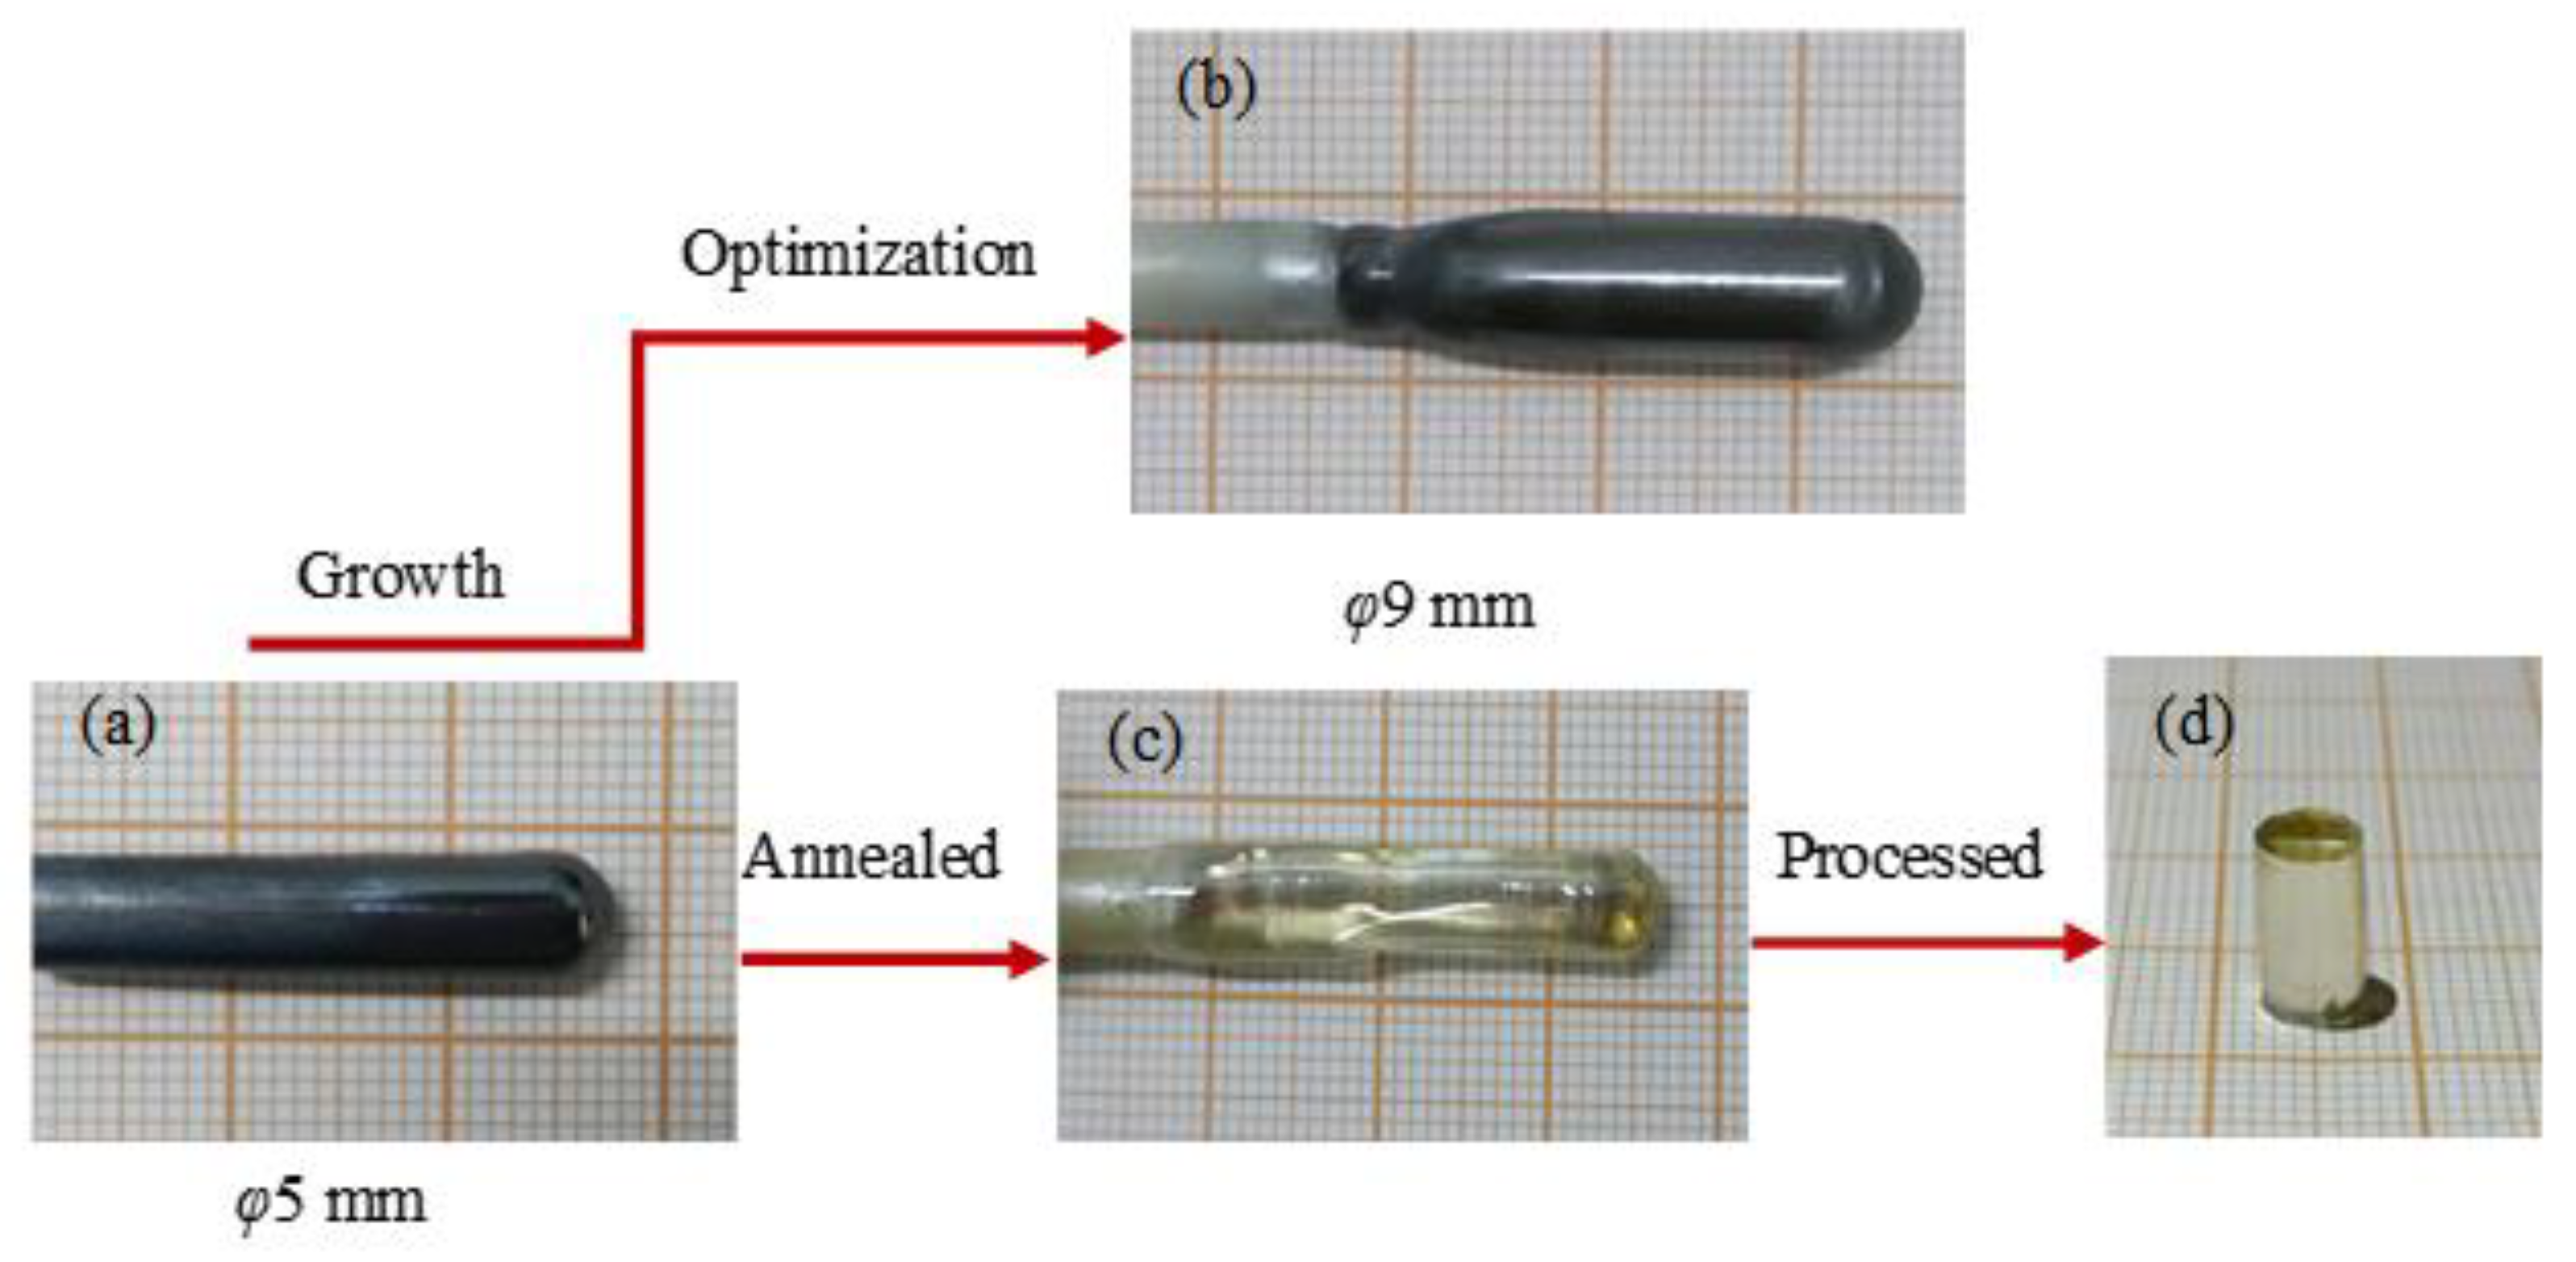
The solid–liquid interface shape has a crucial role in the quality of grown crystals during the growth process. The convexity of the solid–liquid interface is defined as h/d, where h is the height of the interface and d is the diameter of the feed or the grown crystal. As a function of the rotation rate, the feed or crystal side convexity decreased with the increase in the rotation rate, as shown in Figure 3. The forced convection caused by crystal rotation dominates the melt above the core region and flows in a centrifugal direction [17], and the increase in the rotation rate corresponds to the increase in forced convection intensity [19]. The results of Kodaira et al. [20] showed that a high rotation rate has a good effect on the interface for the growth rutile crystals of 10 mm and, thus, a rotation rate of 20 r/min was finally defined. The summarized parameters of grown crystals using LFZ in our work are shown in Table 1. Further, this seemed to indirectly prove that h/d under the same conditions is optimal. The crystal rotation rate affects the solid–liquid interface, crystal shape and crystallinity and, thus, the crystal diameter attainable in this method and is very limited [19]. Finally, we successfully prepared high-quality centimeter-level single crystals by optimizing the parameters of the growth process, as shown in Figure 4.

3.2. Crystal Structure

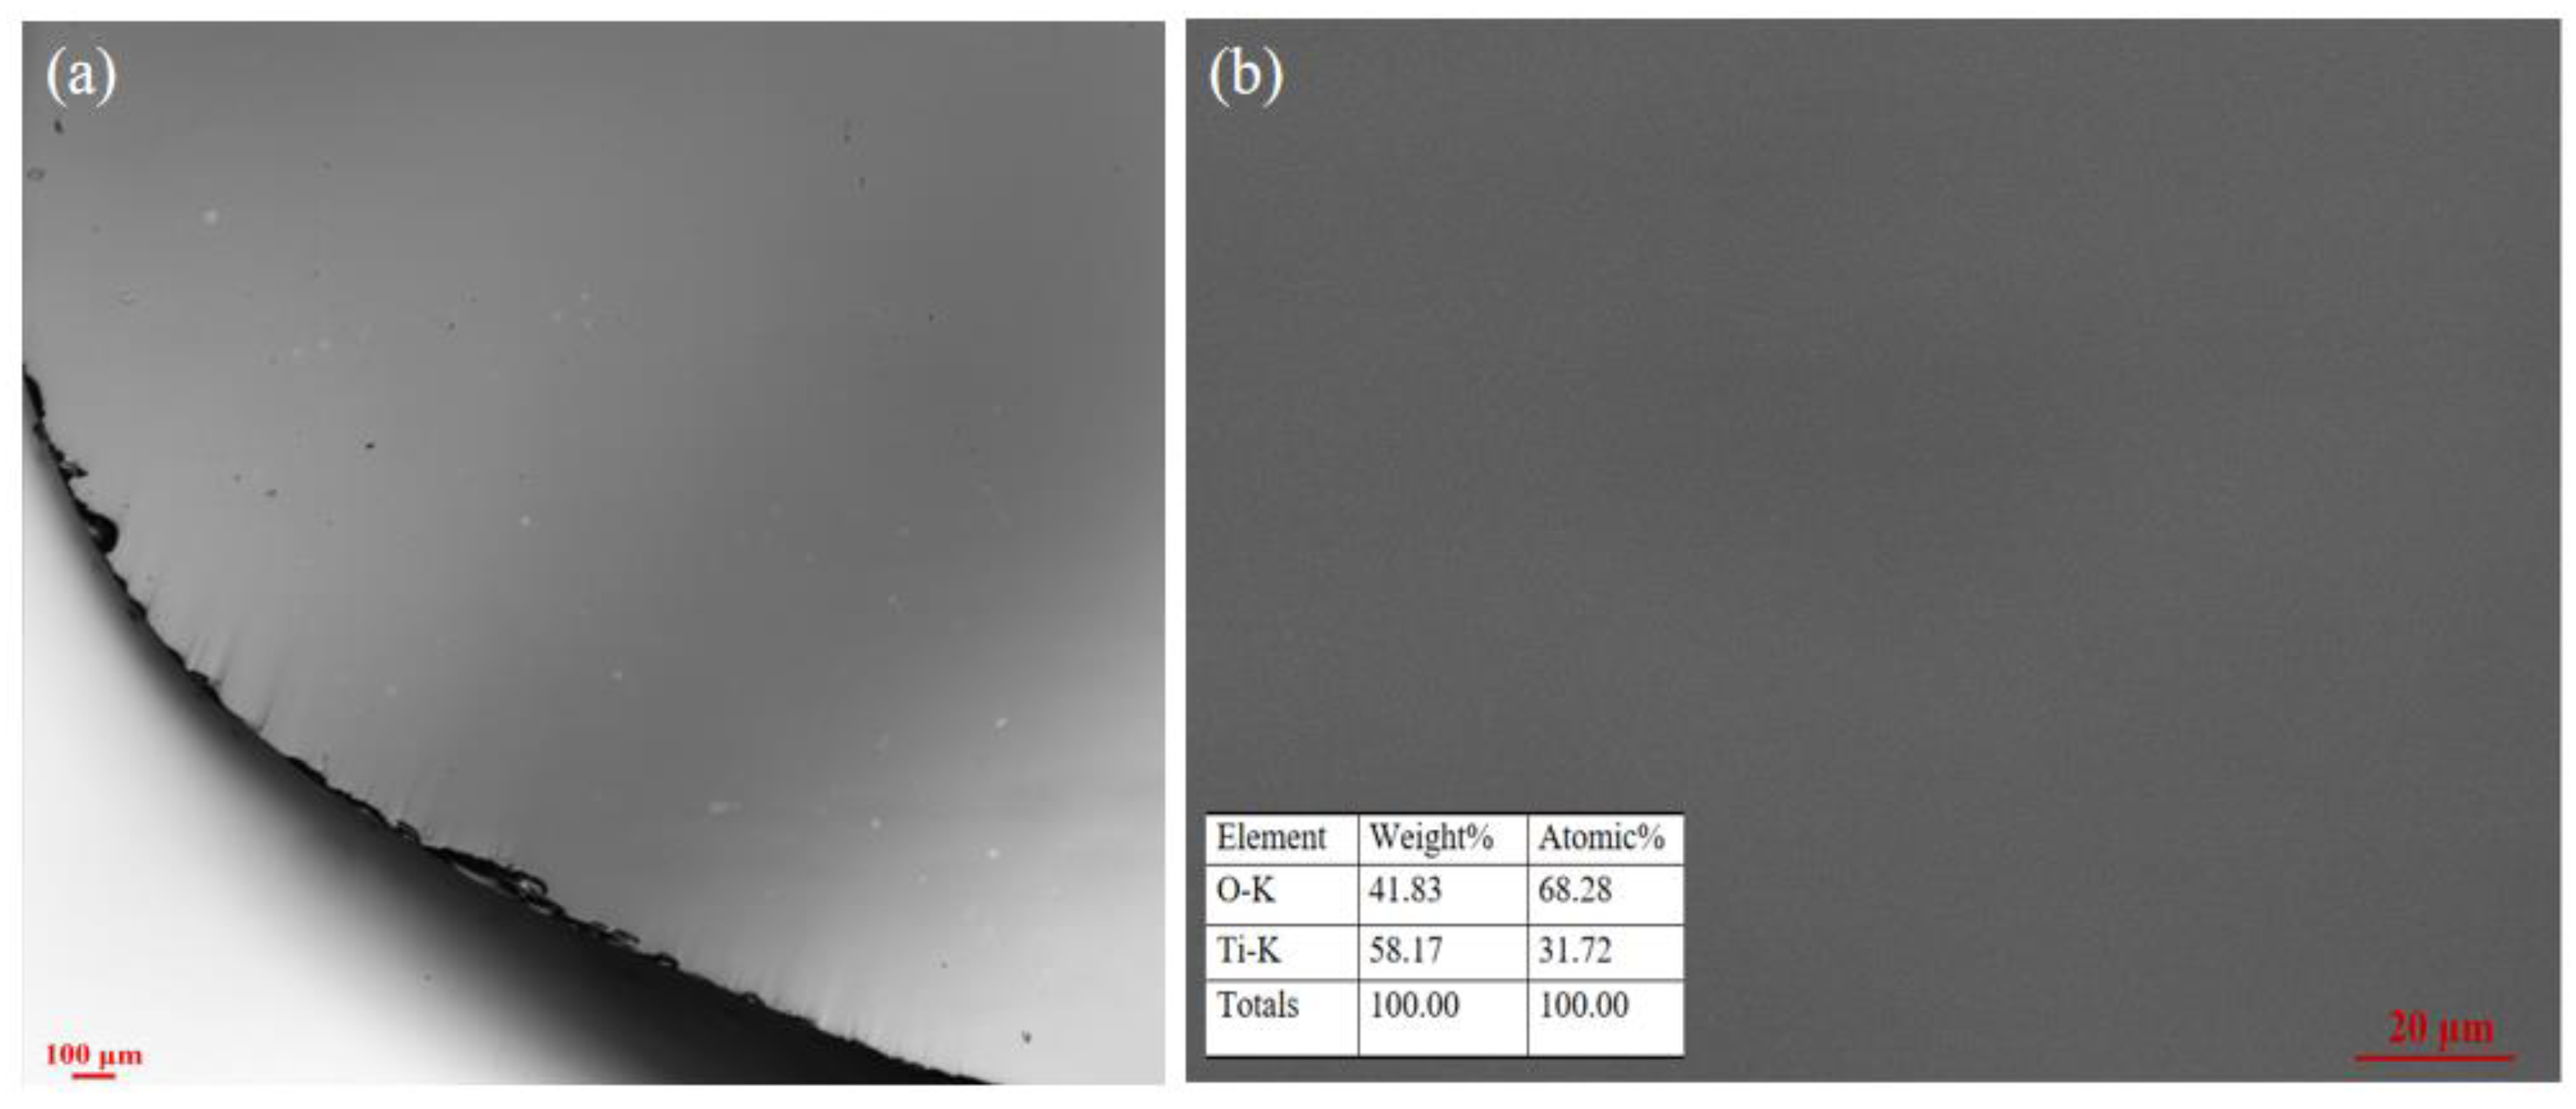
Rutile TiO2 belongs to a tetragonal system with a space group P42/mnm. The structure is composed of layered crystal planes, and the atomic arrangement directions between adjacent crystal planes are perpendicular to each other. Each Ti4+ ion is surrounded by an octahedron composed of O2− ions, with a coordination number of six for Ti4+ and three for O2−. Figure 5a is a polarizing microscope image of the polished sample, showing that crystals grown under optimum conditions did not contain any low-angle grain boundaries. The morphology was observed through SEM, as shown in Figure 5b; a very smooth surface was observed, which further confirmed the absence of microcracks, inclusions, and pores. The components of grown crystal were analyzed through EDS, and the molar ratio of Ti and O was close to 2:1, indicating that the sample can meet the chemical stoichiometry of TiO2 well, within the test range.
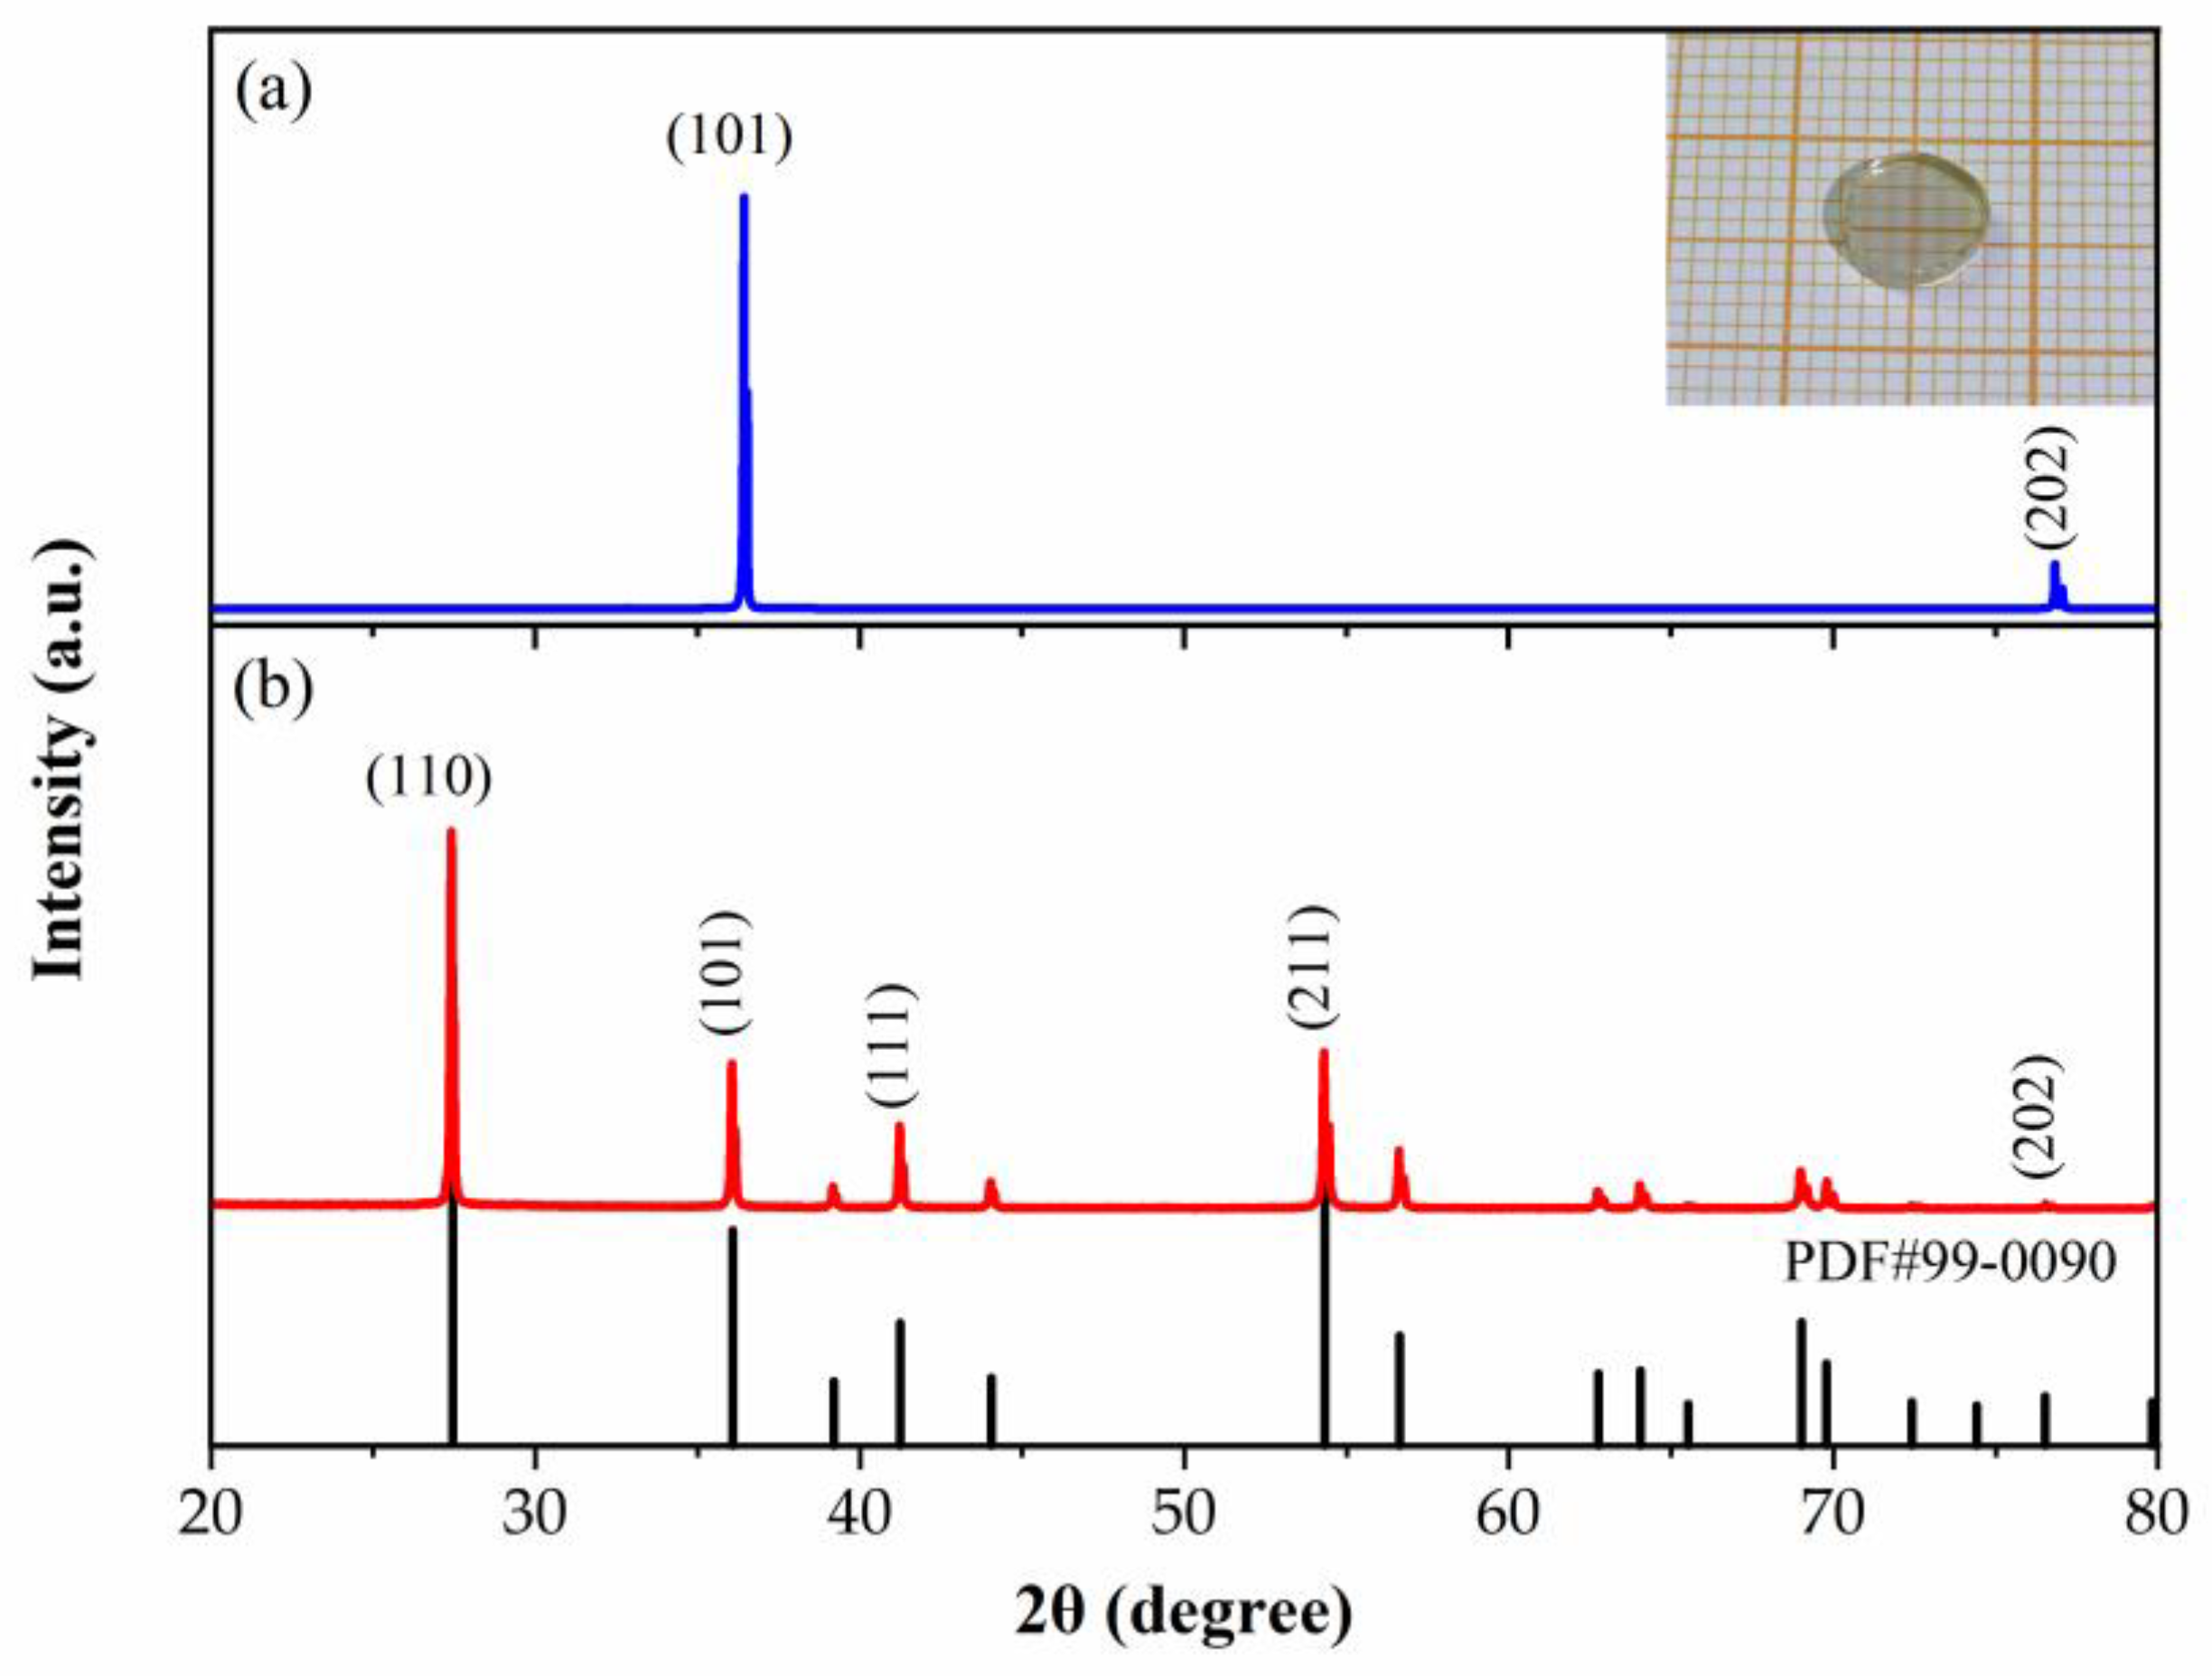
Figure 6 gives the measured XRD pattern of the grown crystal compared with that of rutile TiO2 referring to PDF Number 99-0090. The XRD pattern of the sample cut along the direction perpendicular to growth is shown in Figure 6a; it can be seen that the TiO2 single crystal grew along the (101) orientation. A small piece of single crystal with equal diameters was cut and ground into powder, as shown in Figure 6b, which was completely matched with the standard card of the rutile crystal phase. The illustration is a sample for testing, and no macroscopic defects were found, indicating that the single crystal grown using the process has good integrity.

3.3. Optical Properties

3.3.1. Transmission Spectrum

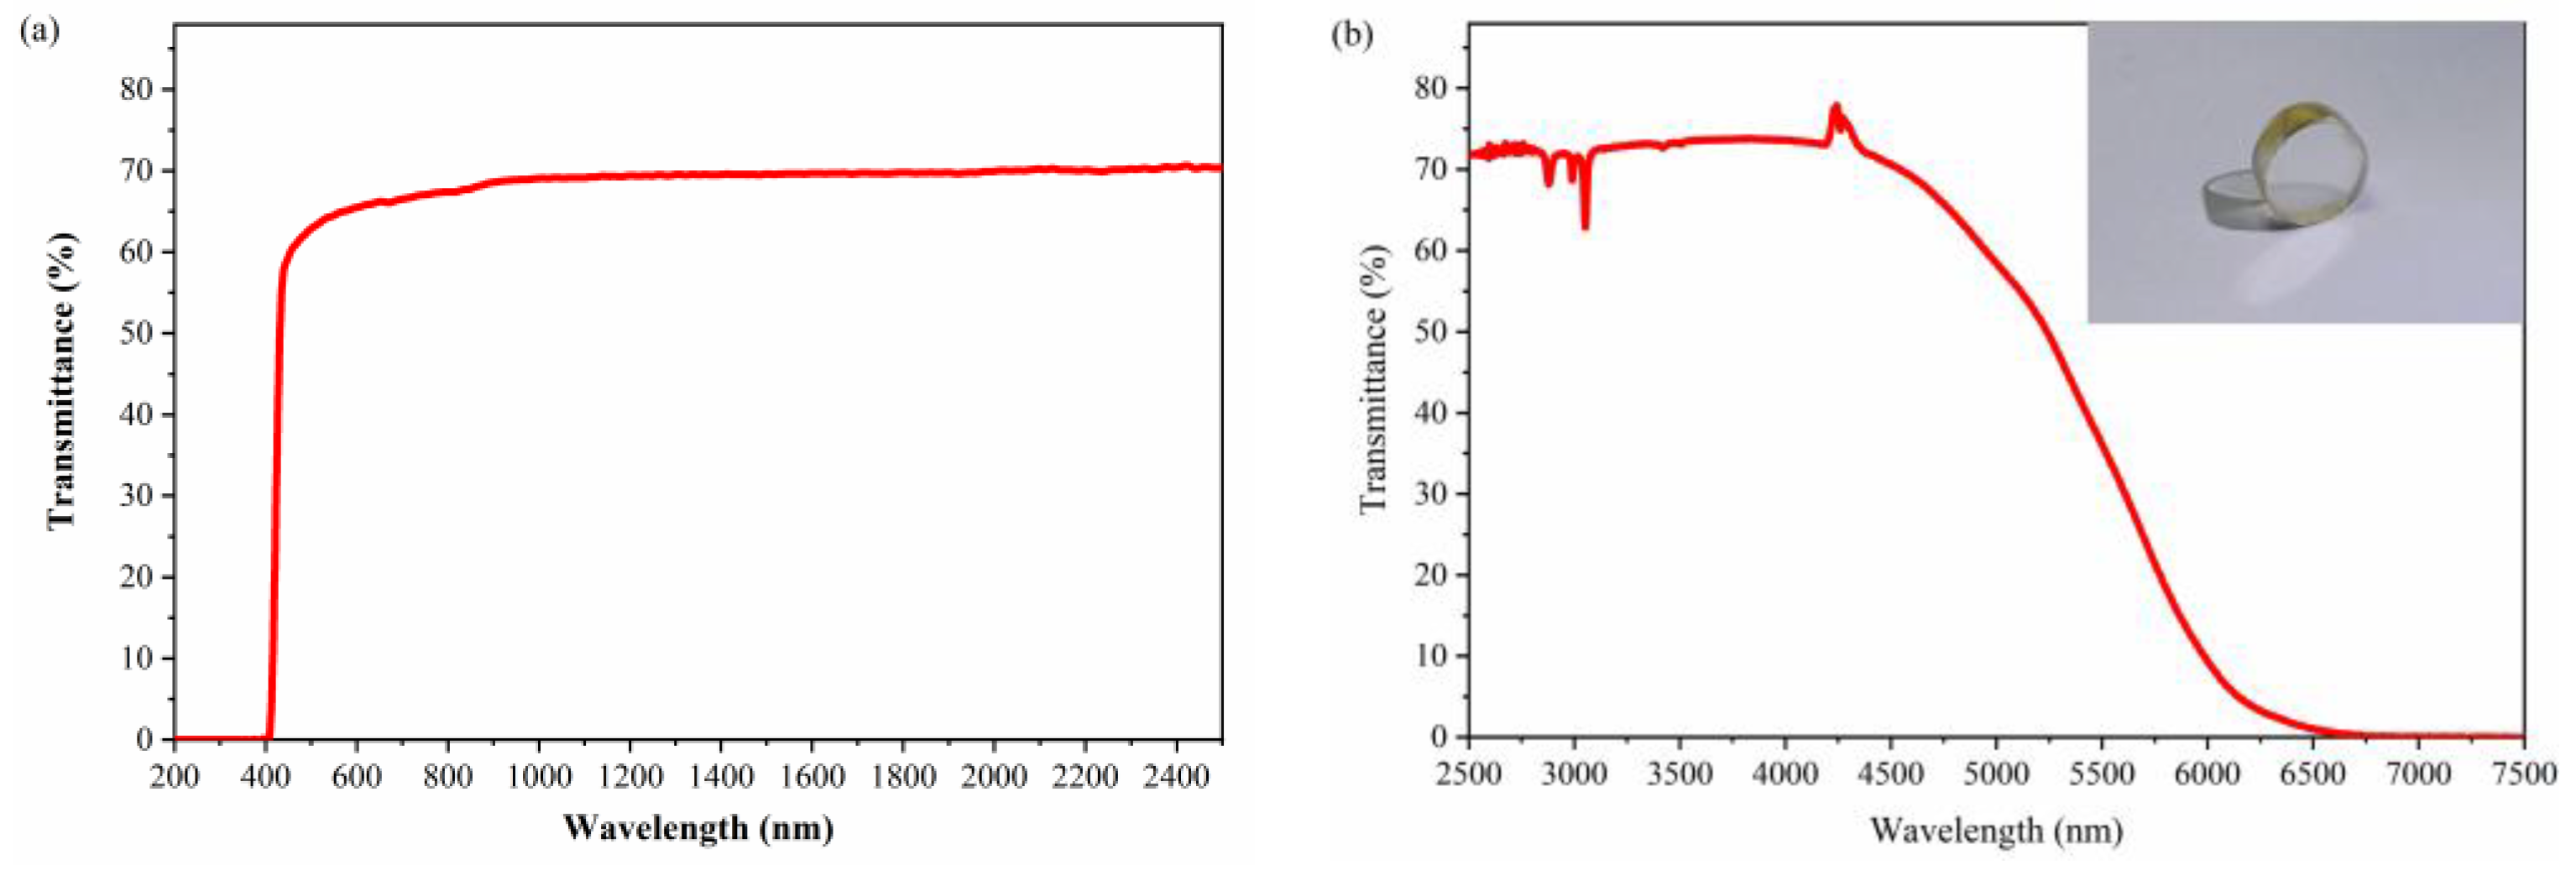
The quality of the grown crystals can be well evaluated by measuring their transmittance. Figure 7 is the transmission spectrum of the crystal grown in this experiment. The results show that the crystal had no transmittance in the ultraviolet band, and the transmittance of the crystal remained at 70% in a transmittance range of 0.41–4.54 μm, which is consistent with the results previously reported [1].

3.3.2. Fluorescence Spectra

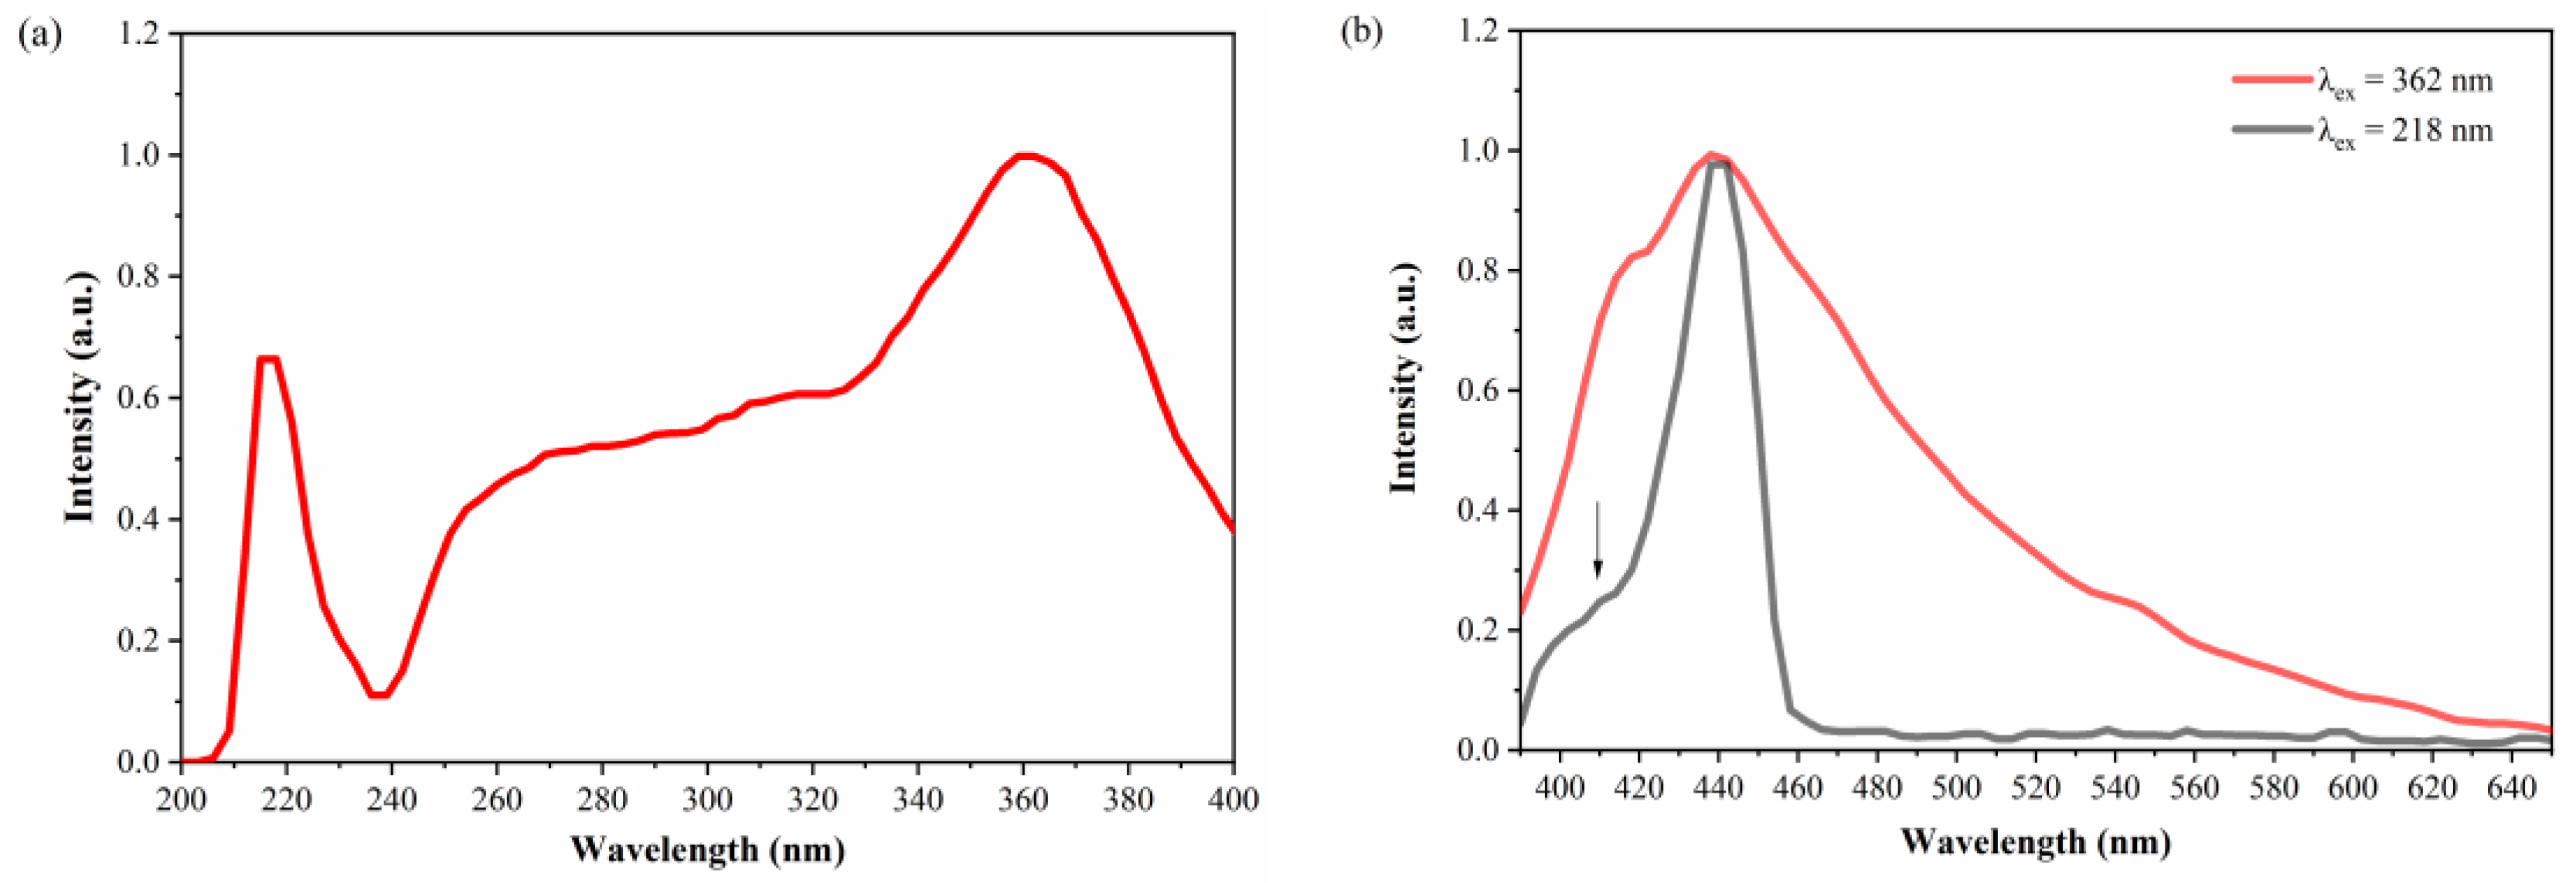
When crystals are used in photochemical fields, such as photochemical cells, water photolysis, and photocatalysis, etc., the light absorption properties in the UV–visible region become meaningful [21]. It is known from the UV–visible absorption spectrum that the TiO2 crystal has strong absorption in the ultraviolet band. This reasonably explains why titanium dioxide is widely used in pigments, optical coatings, and sunscreens [22]. The main characteristic absorption peaks of the crystal were further tested using a steady-state/transient fluorescence spectrometer, and the room-temperature fluorescence excitation spectrum over a spectral range of 200–400 nm is shown in Figure 8a. There were two characteristic absorption peaks among the bands: the maximum absorption peak was located at 362 nm, which is due to the electrons in the sample absorbing the energy of the photons under light irradiation and hopping from the valence band to the conduction band [23], and the rest were at 218 nm. Commercial TiO2 was used as a benchmark and its absorption peaks were located at 210 nm and 350 nm [24].
The absorbance wavelengths were used as the excitation wavelength (λex) for PL measurements to obtain the ultraviolet emission spectrum, as shown in Figure 8b; the excitation wavelengths were 218 nm (E = 5.69 eV) and 362 nm (E = 3.43 eV), respectively. The band gap of rutile TiO2 was about 3.08 eV and the corresponding wavelength was about 403 nm. The emission peak of 438 lies in the spectral region because of the self-activated PL center, which has often been attributed to the crystal vacancies [25]. Munnix et al. demonstrated that the presence of oxygen vacancy will produce a new impurity band below the conduction band, which is 0.15 eV lower than the original conduction band edge [26]. The peak at 438 nm had a photon energy of 2.83 eV, which is approximately equal to the theoretical results. It was simultaneously revealed that although the derived single crystal was nearly transparent, the oxygen vacancy still existed, which could be ameliorated by ulteriorly increasing the oxygen component.

3.3.3. Raman Spectra

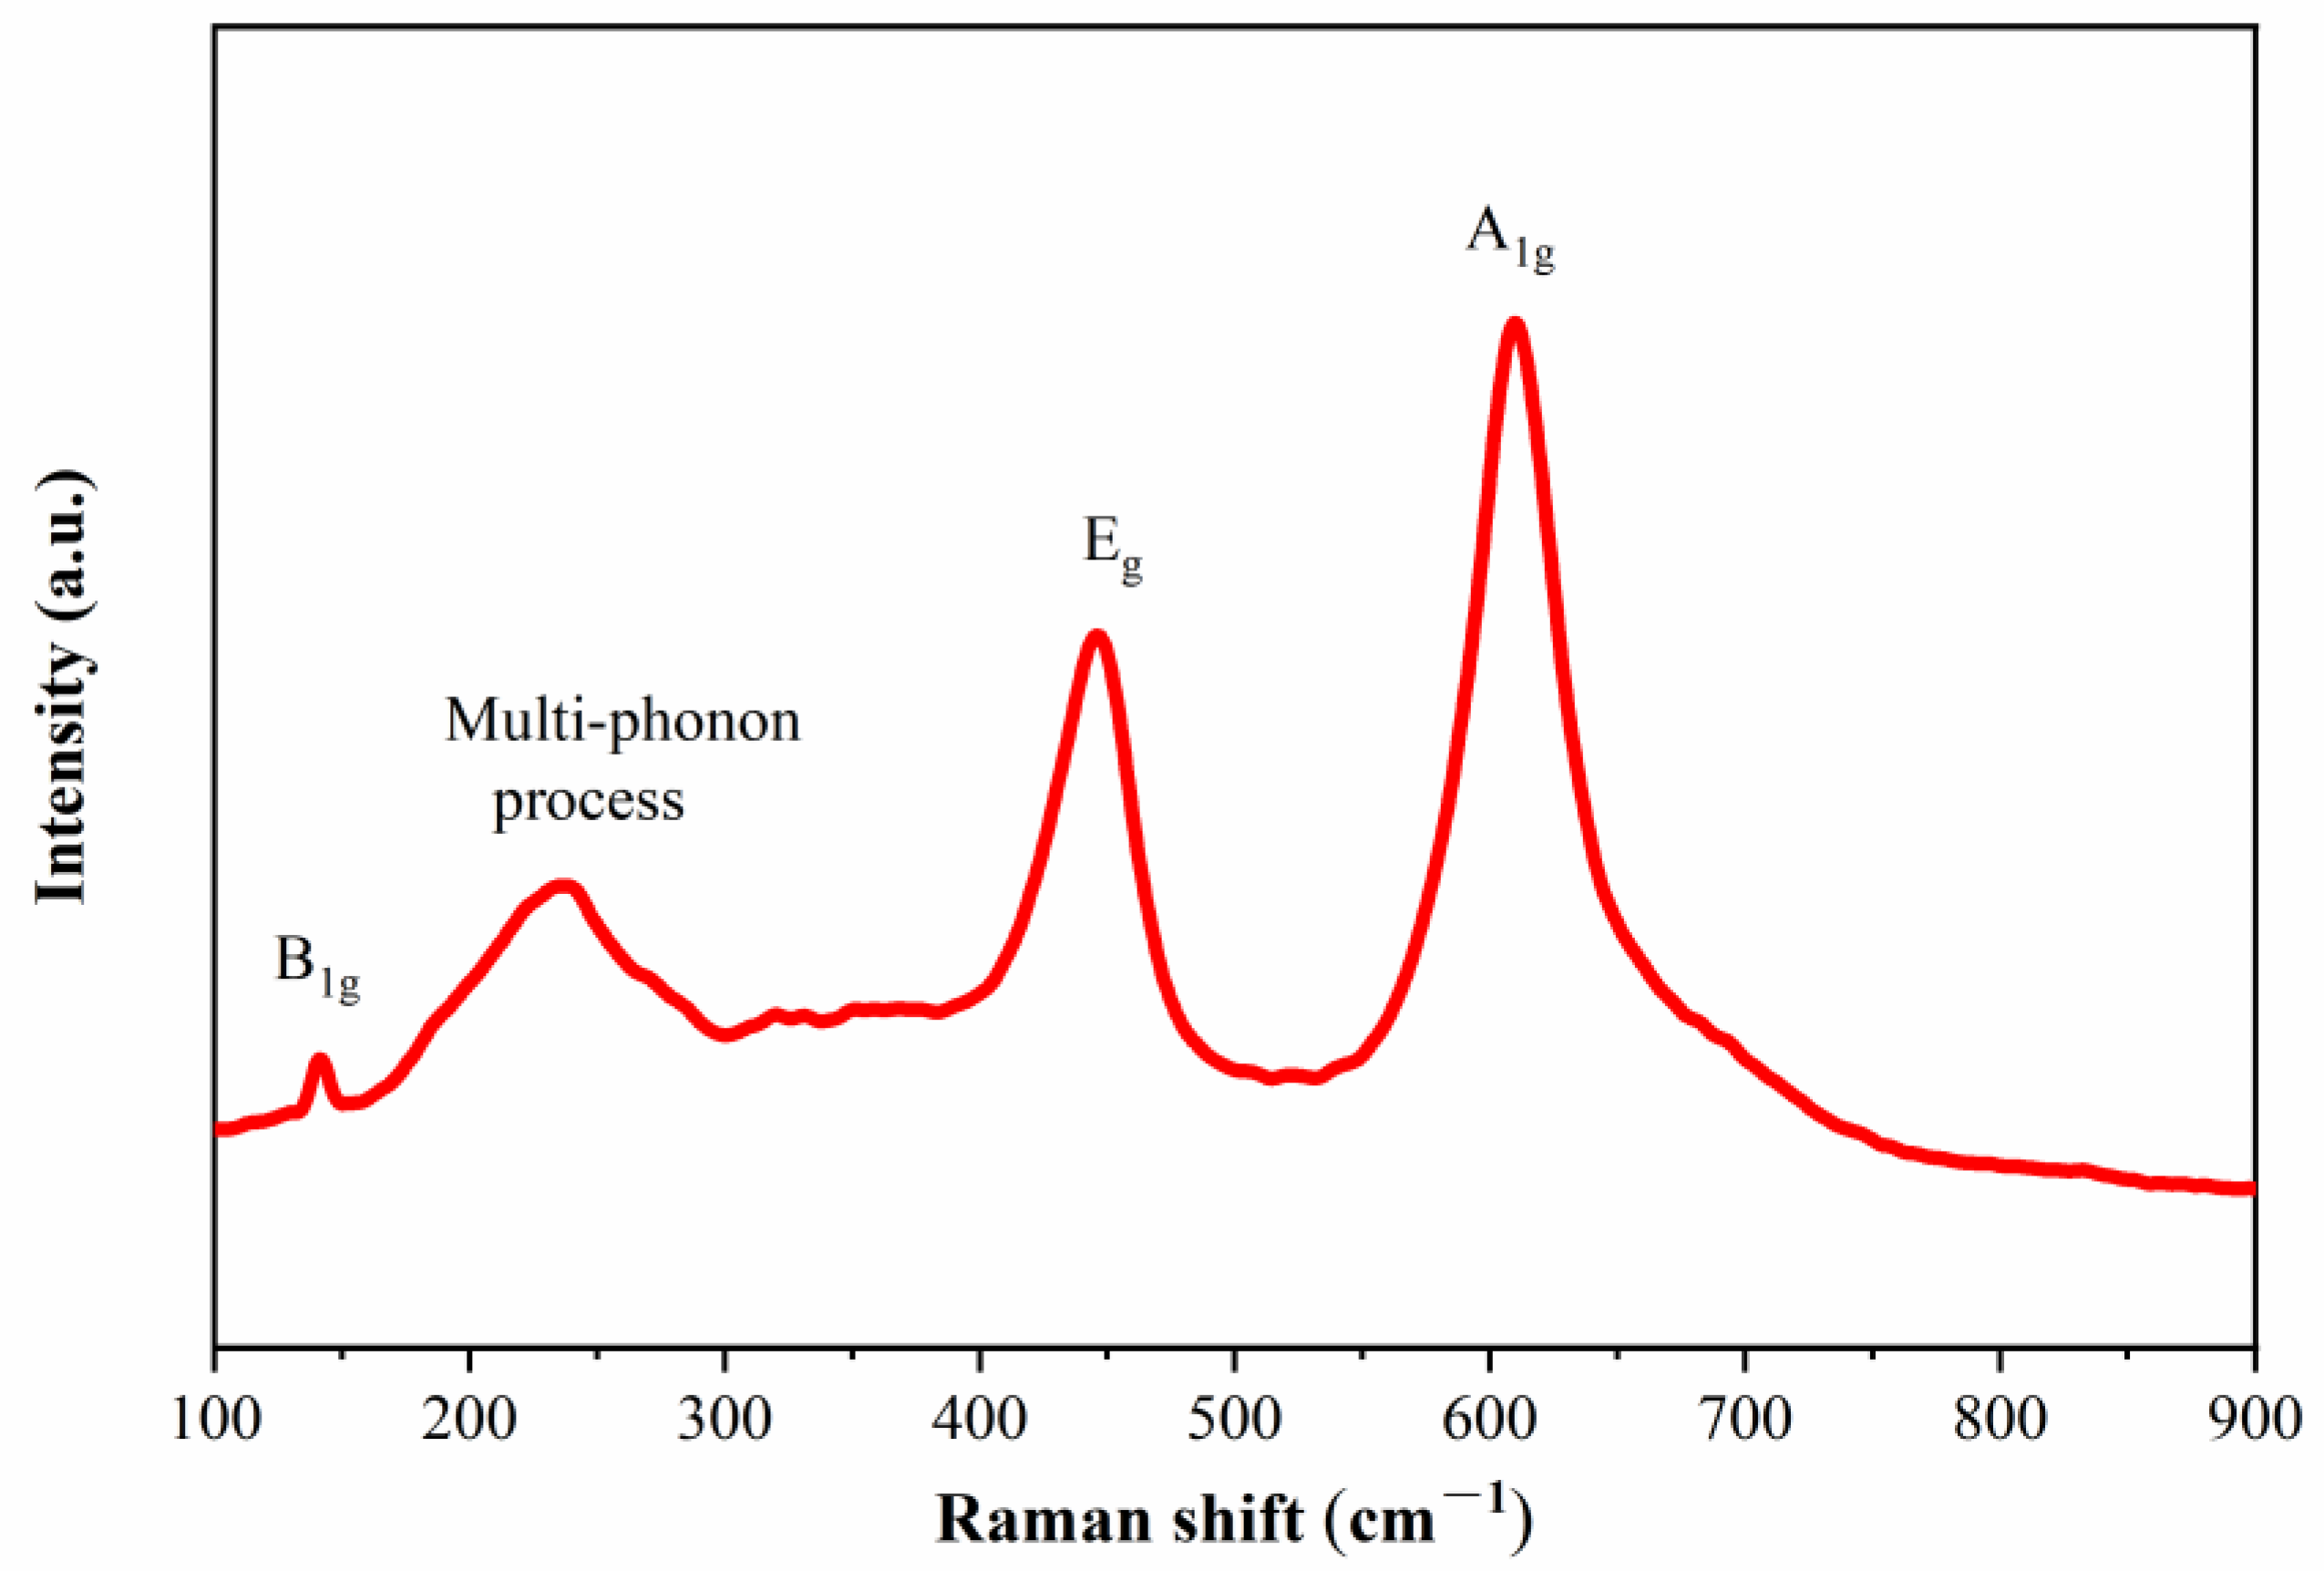
The Raman spectrum was investigated in the 100–900 cm−1 range using a spectrometer with an exciting wavelength at 532 nm at room temperature, as shown in Figure 9. The vibration modes that are Raman active include B1g, the multi-phonon process [27], Eg, A1g, and B2g. Four modes were observed here: B1g (142 cm−1), the multi-phonon peak (236 cm−1), Eg (447 cm−1), and A1g (610 cm−1), and the results were roughly in line with those formerly covered [23,28]. Moreover, B1g (142 cm−1), Eg (447 cm−1), and A1g (610 cm−1) were in accordance with the rocking vibration, twisting vibration, and axial antisymmetric contraction of the O–Ti–O bonds, respectively [1,23]. The remaining B2g mode was confirmed to be at 825 cm−1 by Porto et al., although it was not detected in the present spectra [27]. Raman spectroscopy analysis was consistent with the XRD results, further indicating that the main phase of the crystal is the pure rutile phase.

3.4. Thermal Properties

The crystal perpendicular to the growth direction was used for testing. The size of the test sample was φ5 × 9 mm3 and both ends of the sample were polished. The average thermal expansion coefficient (α) can be calculated using the formula:
α = △l/(l0·△T)
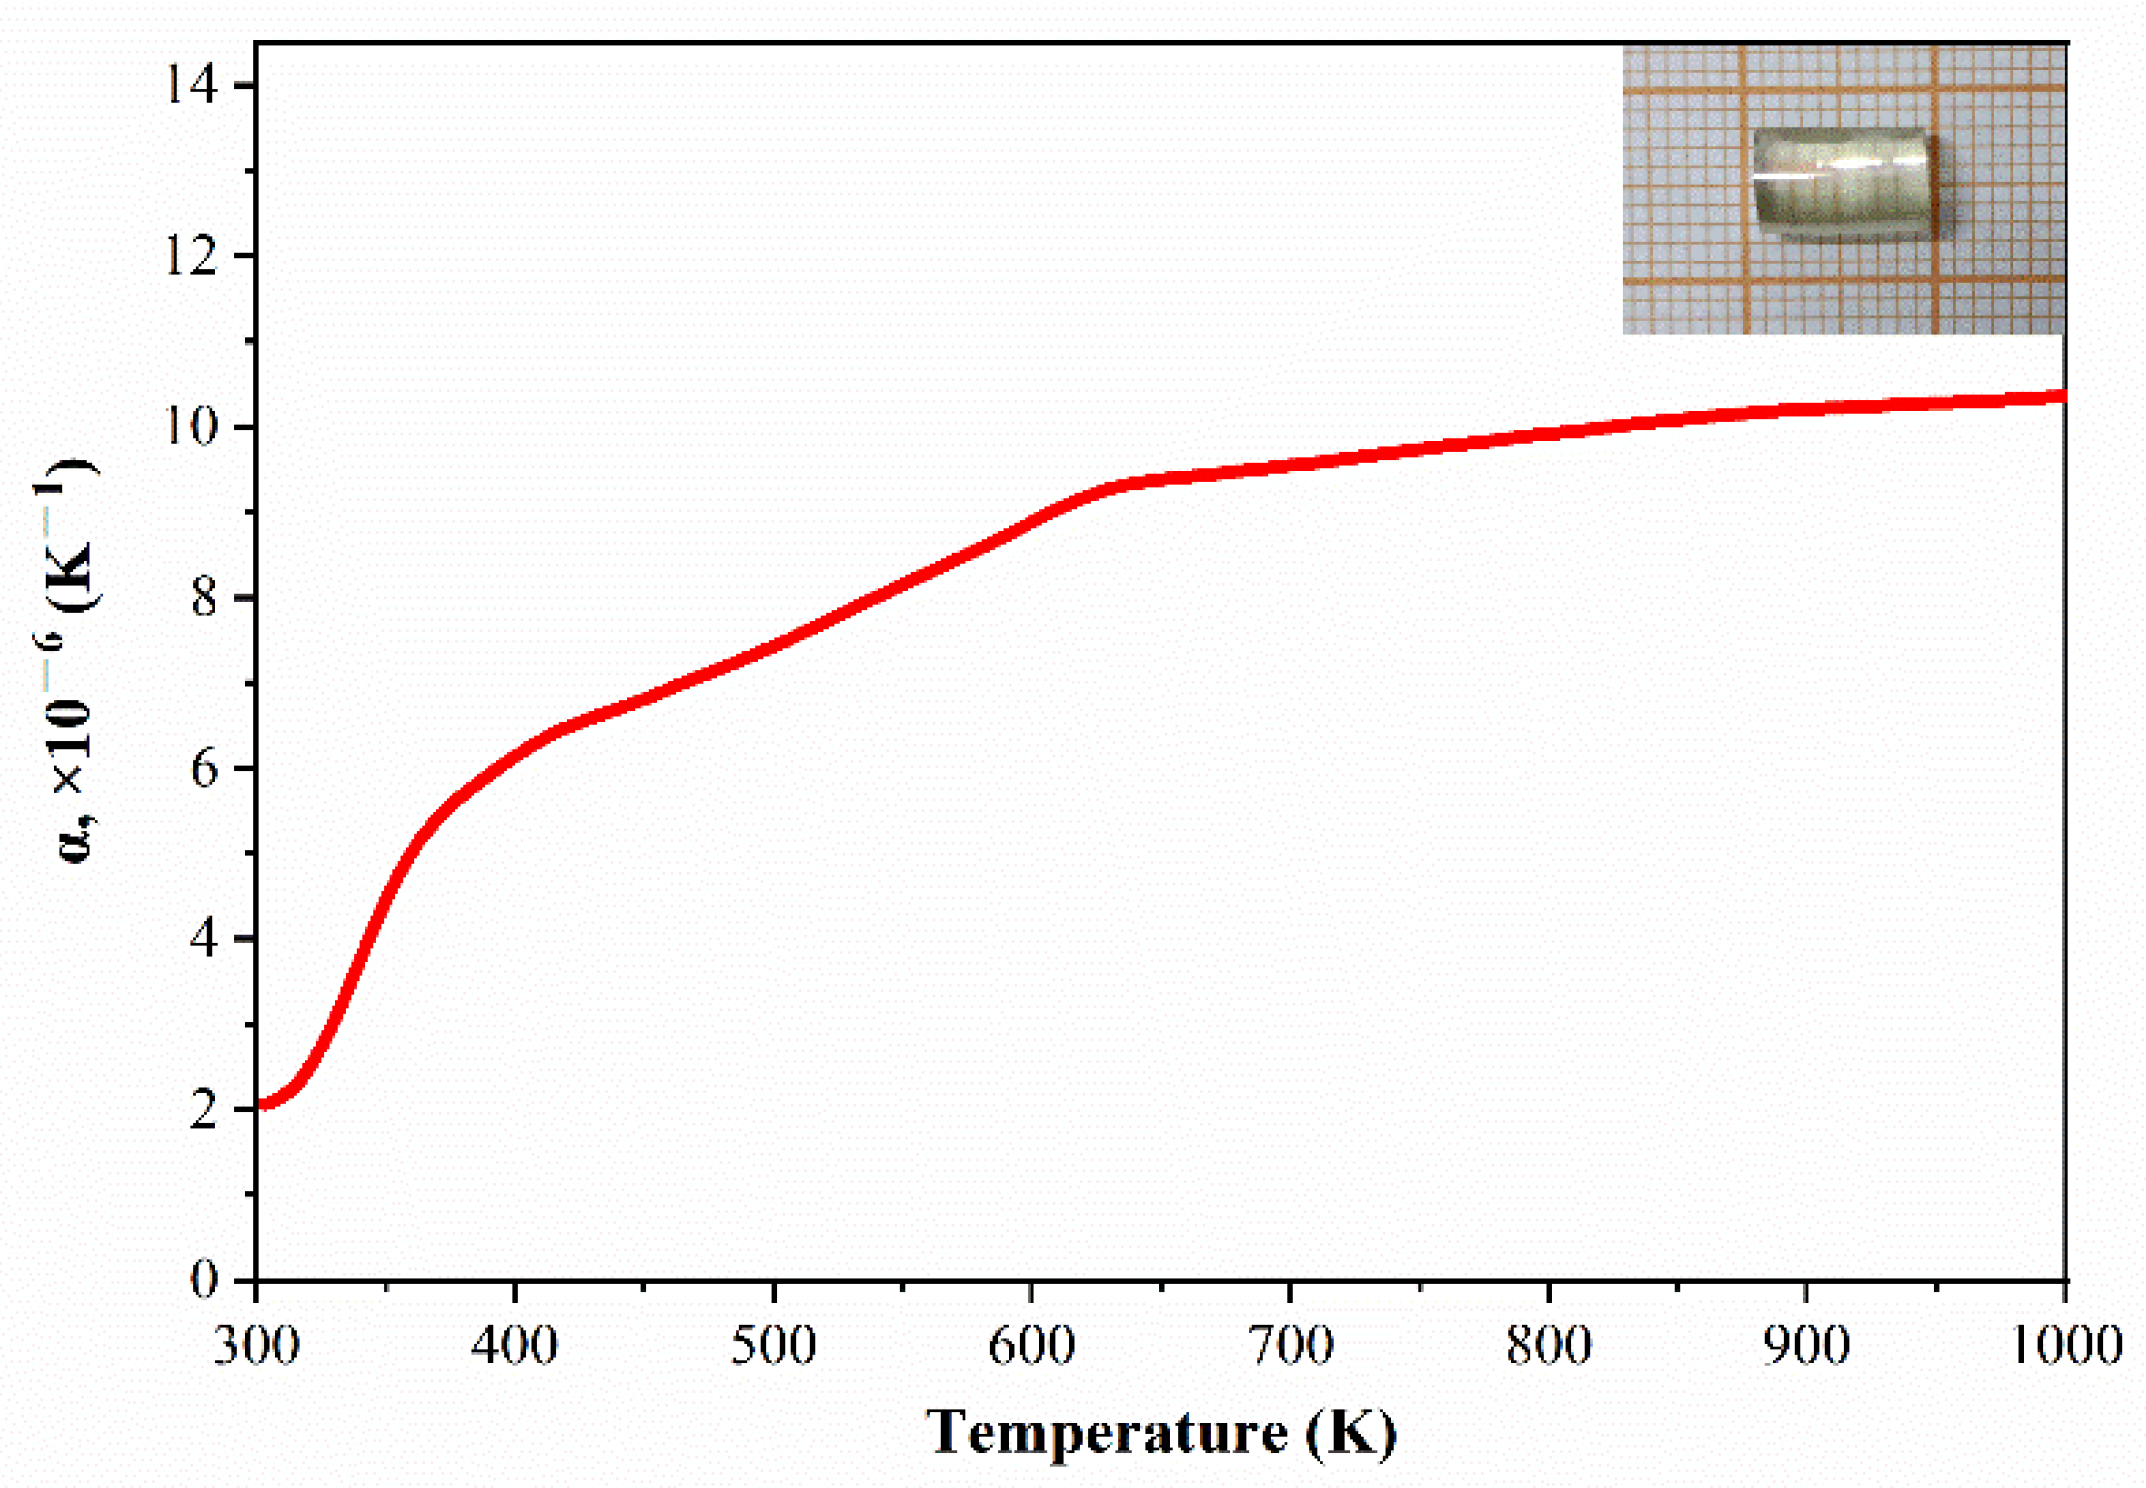
Here, l0 is the initial sample thickness, △l is the variation in the sample thickness, and △T is the temperature variation in the sample. The thermal expansion coefficient of the TiO2 crystal along the b direction was 9.92 × 10⁻⁶/K at 800 K based on the fitting calculation, as shown in Figure 10, and it was similar to the experimental results of first-principles calculations using unit cell parameters, with a closer αa of 9.41× 10⁻⁶/K [29]. In addition, the value was significantly lower than that previously reported by Yu et al., whose result reached 14 × 10−6/K at the same temperature [30]. A large amount of heat is generated during laser operation, and the low thermal expansion coefficient manifests that the crystal has better stability during laser operation.

3.5. Laser Damage Threshold (LDT)

The high laser energy will cause local deformation inside or on the surface of the medium, while the laser damage threshold (LDT) can be used to detect the optical homogeneity of the crystal. The LDT is nonstoichiometric defects in absorption related to the experiment [31]. The damage threshold of the rutile TiO2 single crystal irradiated using 100 pulsed lasers at 800 nm is 240–340 mJ/cm2 [32,33], with a 150 fs pulse width. A high-energy Nd:YAG laser at 1064 nm with a pulse width of 3 ns and a pulse frequency of 10 Hz was used and the pulse energy was maintained at about 8.5 mJ and used as the damage-inducing source in the experiment. The test sample was placed in a four-axis translation stage where the x, y, and z axes were allowed to translate between the test points on a given sample, and the surface of the test sample was always located in the plane of the focused beam waist. The laser damage threshold of the rutile crystal was measured with input energy of 8.5 mJ per pulse and a laser beam diameter of 0.5 mm, and the procurable laser damage threshold was about 4.33 J/cm2, i.e., 1.44 GW/cm2. The LDT of the rutile crystal can be further improved by optimizing the thermal annealing process and has little effect on the uniformity of other properties.

4. Conclusions

High-quality rutile TiO2 single crystals were rapidly grown using a laser floating zone (LFZ) method. By optimizing the crystal growth parameters, including the growth atmosphere, growth rate, and rotation rate, crystals with dimensions of φ 9 mm × 25 mm were routinely obtained for 12 h, and there were no cracks shown in the crystal. With the optical and thermal characterization, the properties of the crystals grown using LFZ were close to those of the crystals grown using other schemes, with a transmission range of 410–6560 nm, a thermal expansion coefficient of 9.92 × 10⁻⁶/K, and a laser damage threshold of 1.44 GW/cm2. The achieved results indicate that the crystals grown using this method are of high quality and good integrity. This signifies that the LFZ method provides a new option for the rapid growth of high-quality rutile single crystals.

Supplementary Materials

The following supporting information can be downloaded at: https://www.mdpi.com/article/10.3390/cryst12121789/s1, Figure S1: (a) Heating, (b) equal diameter, (c) necking, and (d) cooling procedures for crystal growth (image magnification); Figure S2: Melting zone out of balance.

Author Contributions

Conceptualization, Y.W. and J.W. (Jiyang Wang); methodology, Z.H.; software, J.W. (Jiajia Wang); validation, J.W. (Jialing Wu), S.M. and J.W. (Jiajia Wang); formal analysis, J.W. (Jialing Wu); investigation, S.M.; resources, Z.H.; data curation, S.M.; writing—original draft preparation, J.W. (Jialing Wu); writing—review and editing, S.M.; visualization, Z.H.; supervision, S.M.; project administration, Z.H.; funding acquisition, J.W. (Jiajia Wang). All authors have read and agreed to the published version of the manuscript.

Funding

This research was funded by the National Natural Science Foundation of China, grant number 22202097, 52002272, 61835014, 51890860, 51890864, and 51890865, and the Shandong Natural Science Foundation for Youth, grant number ZR2022QB119.

Institutional Review Board Statement

Not applicable.

Informed Consent Statement

Not applicable.

Data Availability Statement

Not applicable.

Acknowledgments

This work was supported by the Tianjin Key Laboratory of Functional Crystal Materials, Institute of Functional Crystals, Tianjin University of Technology.

Conflicts of Interest

The authors declare no conflict of interest.

References

  1. Wang, L.; Liu, X.D.; Bi, X.G.; Ma, Z.X.; Li, J.S.; Sun, X.D. Verneuil growth of TiO2 (rutile) crystals of large size and low dislocation density at low gas flow rate. Ceram. Int. 2022, 48, 30240–30248. [Google Scholar] [CrossRef]
  2. Park, J.K.; Kim, K.H.; Tanaka, I.; Shim, K.B. Characteristics of rutile single crystals grown under two different oxygen partial pressures. J. Cryst. Growth 2004, 268, 103–107. [Google Scholar] [CrossRef]
  3. Higuchi, M.; Hatta, K.; Takahashi, J.; Kodaira, K.; Kaneda, H.; Saito, J. Floating-zone growth of rutile single crystals inclined at 48 degrees to the c-axis. J. Cryst. Growth 2000, 208, 501–507. [Google Scholar] [CrossRef]
  4. Ha, S.; Tang, Y.; van Oene, M.M.; Janissen, R.; Dries, R.M.; Solano, B.; Adam, A.J.L.; Dekker, N.H. Single-Crystal Rutile TiO2 Nanocylinders are Highly Effective Transducers of Optical Force and Torque. ACS Photonics 2019, 6, 1255–1265. [Google Scholar] [CrossRef] [PubMed] [Green Version]
  5. Higuchi, M.; Togi, T.; Kodaira, K. Growth of rutile single crystals by the pulling-down method. J. Cryst. Growth 1999, 203, 450–453. [Google Scholar] [CrossRef]
  6. Koohpayeh, S.M.; Fort, D.; Abell, J.S. Some observations on the growth of rutile single crystals using the optical floating zone method. J. Cryst. Growth 2005, 282, 190–198. [Google Scholar] [CrossRef]
  7. Park, J.K.; Shim, K.B.; Auh, K.H.; Tanaka, I. The growth of TiO2 (rutile) single crystals using the FZ method under high oxygen pressure. J. Cryst. Growth 2002, 237, 730–734. [Google Scholar] [CrossRef]
  8. Kalb, J.; Dorman, J.A.; Siroky, S.; Schmidt-Mende, L. Controlling the Spatial Direction of Hydrothermally Grown Rutile TiO2 Nanocrystals by the Orientation of Seed Crystals. Crystals 2019, 9, 64. [Google Scholar] [CrossRef] [Green Version]
  9. Issar, S.; Mahapatro, A.K. Hydrothermally grown rutile titanium dioxide nanostructures with various morphologies. Mater. Sci. Semicond. Process 2019, 104, 104676. [Google Scholar] [CrossRef]
  10. Feng, Q.G.; Cai, H.D.; Lin, H.Y.; Qin, S.Y.; Liu, Z.; Ma, D.C.; Ye, Y.Y. Synthesis and structural characteristics of high surface area TiO2 aerogels by ultrasonic-assisted sol-gel method. Nanotechnology 2018, 29, 075702. [Google Scholar]
  11. Matrosov, V.N. Conditions for Obtaining High-Quality Crystals by the Czochralski Method. Crystallogr. Rep. 2019, 64, 174–176. [Google Scholar] [CrossRef]
  12. Machida, H.; Fukuda, T. Difficulties encountered during the Czochralski growth of TiO2 single crystals. J. Cryst. Growth 1991, 112, 835–837. [Google Scholar] [CrossRef]
  13. Pastor, A.C.; Pastor, R.C.; Soffer, B.H. Steady state studies in the conventional Verneuil process-the gas-liquid and the liquid-solid interfaces. Mater. Res. Bull. 1966, 1, 205–210. [Google Scholar] [CrossRef]
  14. Grzymkowski, R.; Mochnacki, B.; Suchy, J. Numerical simulation of the process of production of single crystals by the Verneuil method. J. Cryst. Growth 1985, 73, 529–536. [Google Scholar] [CrossRef]
  15. Feigelson, R.S. Crystal growth History: Theory and melt growth processes. J. Cryst. Growth 2022, 594, 126800. [Google Scholar] [CrossRef]
  16. Sarker, M.A.R.; Watauchi, S.; Nagao, M.; Watanabe, T.; Shindo, I.; Tanaka, I. Reduced Etch Pit Density of Rutile (TiO2) Single Crystals by Growth Using a Tilting-Mirror-Type Infrared Heating Image Furnace. Cryst. Growth Des. 2010, 10, 3929–3930. [Google Scholar] [CrossRef]
  17. Watauchi, S.; Sarker, M.A.R.; Nagao, M.; Tanaka, I.; Watanabe, T.; Shindo, I. Crystal growth of rutile by tilting-mirror-type floating zone method. J. Cryst. Growth 2012, 360, 105–110. [Google Scholar] [CrossRef]
  18. Kotani, T.; Tuller, H.L. Growth of TiO2 single crystals and bicrystals by the laser-heated floating-zone method. J. Am. Ceram. Soc. 1998, 81, 592–596. [Google Scholar] [CrossRef]
  19. Hossain, M.M.; Watauchi, S.; Nagao, M.; Tanaka, I. Effects of growth parameters on silicon molten zone formed by infrared convergent-heating floating zone method. J. Cryst. Growth 2017, 459, 105–111. [Google Scholar] [CrossRef] [Green Version]
  20. Sarker, M.A.R.; Watauchi, S.; Nagao, M.; Watanabe, T.; Shindo, I.; Tanaka, I. Effects of the diameter of rutile (TiO2) single crystals grown using tilting-mirror-type infrared heating image furnace on solid-liquid interface and etch pit density. J. Cryst. Growth 2011, 317, 135–138. [Google Scholar] [CrossRef]
  21. Lu, T.C.; Wu, S.Y.; Lin, L.B.; Zheng, W.C. Defects in the reduced rutile single crystal. Physica B 2001, 304, 147–151. [Google Scholar] [CrossRef]
  22. Zhang, Y.L.; Harris, C.X.; Wallenmeyer, P.; Murowchick, J.; Chen, X.B. Asymmetric Lattice Vibrational Characteristics of Rutile TiO2 as Revealed by Laser Power Dependent Raman Spectroscopy. J. Phys. Chem. C 2013, 117, 24015–24022. [Google Scholar] [CrossRef]
  23. Wang, Z.; Li, Y.B.; Chen, H.N.; Fan, J.H.; Wang, X.Y.; Ma, X.P. Correlation between the radius of acceptor ion and the dielectric properties of co-doped TiO2 ceramics. Ceram. Int. 2019, 45, 14625–14633. [Google Scholar] [CrossRef]
  24. Wittawat, R.; Rittipun, R.; Jarasfah, M.; Nattaporn, B. Synthesis of ZnO/TiO2 spherical particles for blue light screening by ultrasonic spray pyrolysis. Mater. Today Commun. 2020, 24, 101126. [Google Scholar] [CrossRef]
  25. Pathak, G.; Pandey, S.; Katiyar, R.; Srivastava, A.; Dabrowski, R.; Garbat, K.; Manohar, R. Analysis of photoluminescence, UV absorbance, optical band gap and threshold voltage of TiO2 nanoparticles dispersed in high birefringence nematic liquid crystal towards its application in display and photovoltaic devices. J. Lumin. 2017, 192, 33–39. [Google Scholar] [CrossRef]
  26. Munnix, S.; Schmeits, M. Electronic structure of ideal TiO2(110), TiO2(001), and TiO2(100) surfaces. Phys. Rev. B 1984, 30, 2202–2211. [Google Scholar] [CrossRef]
  27. Betsch, R.J.; Park, H.L.; White, W.B. Raman spectra of stoichiometric and defect rutile. Mater. Res. Bull. 1991, 26, 613–622. [Google Scholar] [CrossRef]
  28. Ma, H.L.; Yang, J.Y.; Dai, Y.; Zhang, Y.B.; Lu, B.; Ma, G.H. Raman study of phase transformation of TiO2 rutile single crystal irradiated by infrared femtosecond laser. Appl. Surf. Sci. 2007, 253, 7497–7500. [Google Scholar] [CrossRef]
  29. Kangarlou, H.; Abdollahi, A. Thermodynamic Properties of Rutile (TiO2) Within the Phonon Calculations. Int. J. Thermophys. 2016, 37, 110. [Google Scholar] [CrossRef]
  30. Yu, J.X.; Fu, M.; Ji, G.F.; Chen, X.R. Phase transition and thermodynamic properties of TiO2 from first-principles calculations. Chin. Phys. B 2009, 18, 269–274. [Google Scholar]
  31. Yao, J.K.; Xu, C.; Qiang, Z.W.; Ma, J.Y.; Lv, G.N.; Wang, Y.Z.; He, H.B.; Shao, J.D. Effects of deposition temperatures on laser damage threshold of TiO2/SiO2 high reflectors. Surf. Eng. 2008, 24, 63–65. [Google Scholar] [CrossRef]
  32. Das, S.K.; Dufft, D.; Rosenfeld, A.; Bonse, J.; Bock, M.; Grunwald, R. Femtosecond-laser-induced quasiperiodic nanostructures on TiO2 surfaces. J. Appl. Phys. 2009, 105, 084912. [Google Scholar] [CrossRef]
  33. Museur, L.; Tsibidis, G.D.; Manousaki, A.; Anglos, D.; Kanaev, A. Surface structuring of rutile TiO2 (100) and (001) single crystals with femtosecond pulsed laser irradiation. J. Opt. Soc. Am. B-Opt. Phys. 2018, 35, 2600–2607. [Google Scholar] [CrossRef]
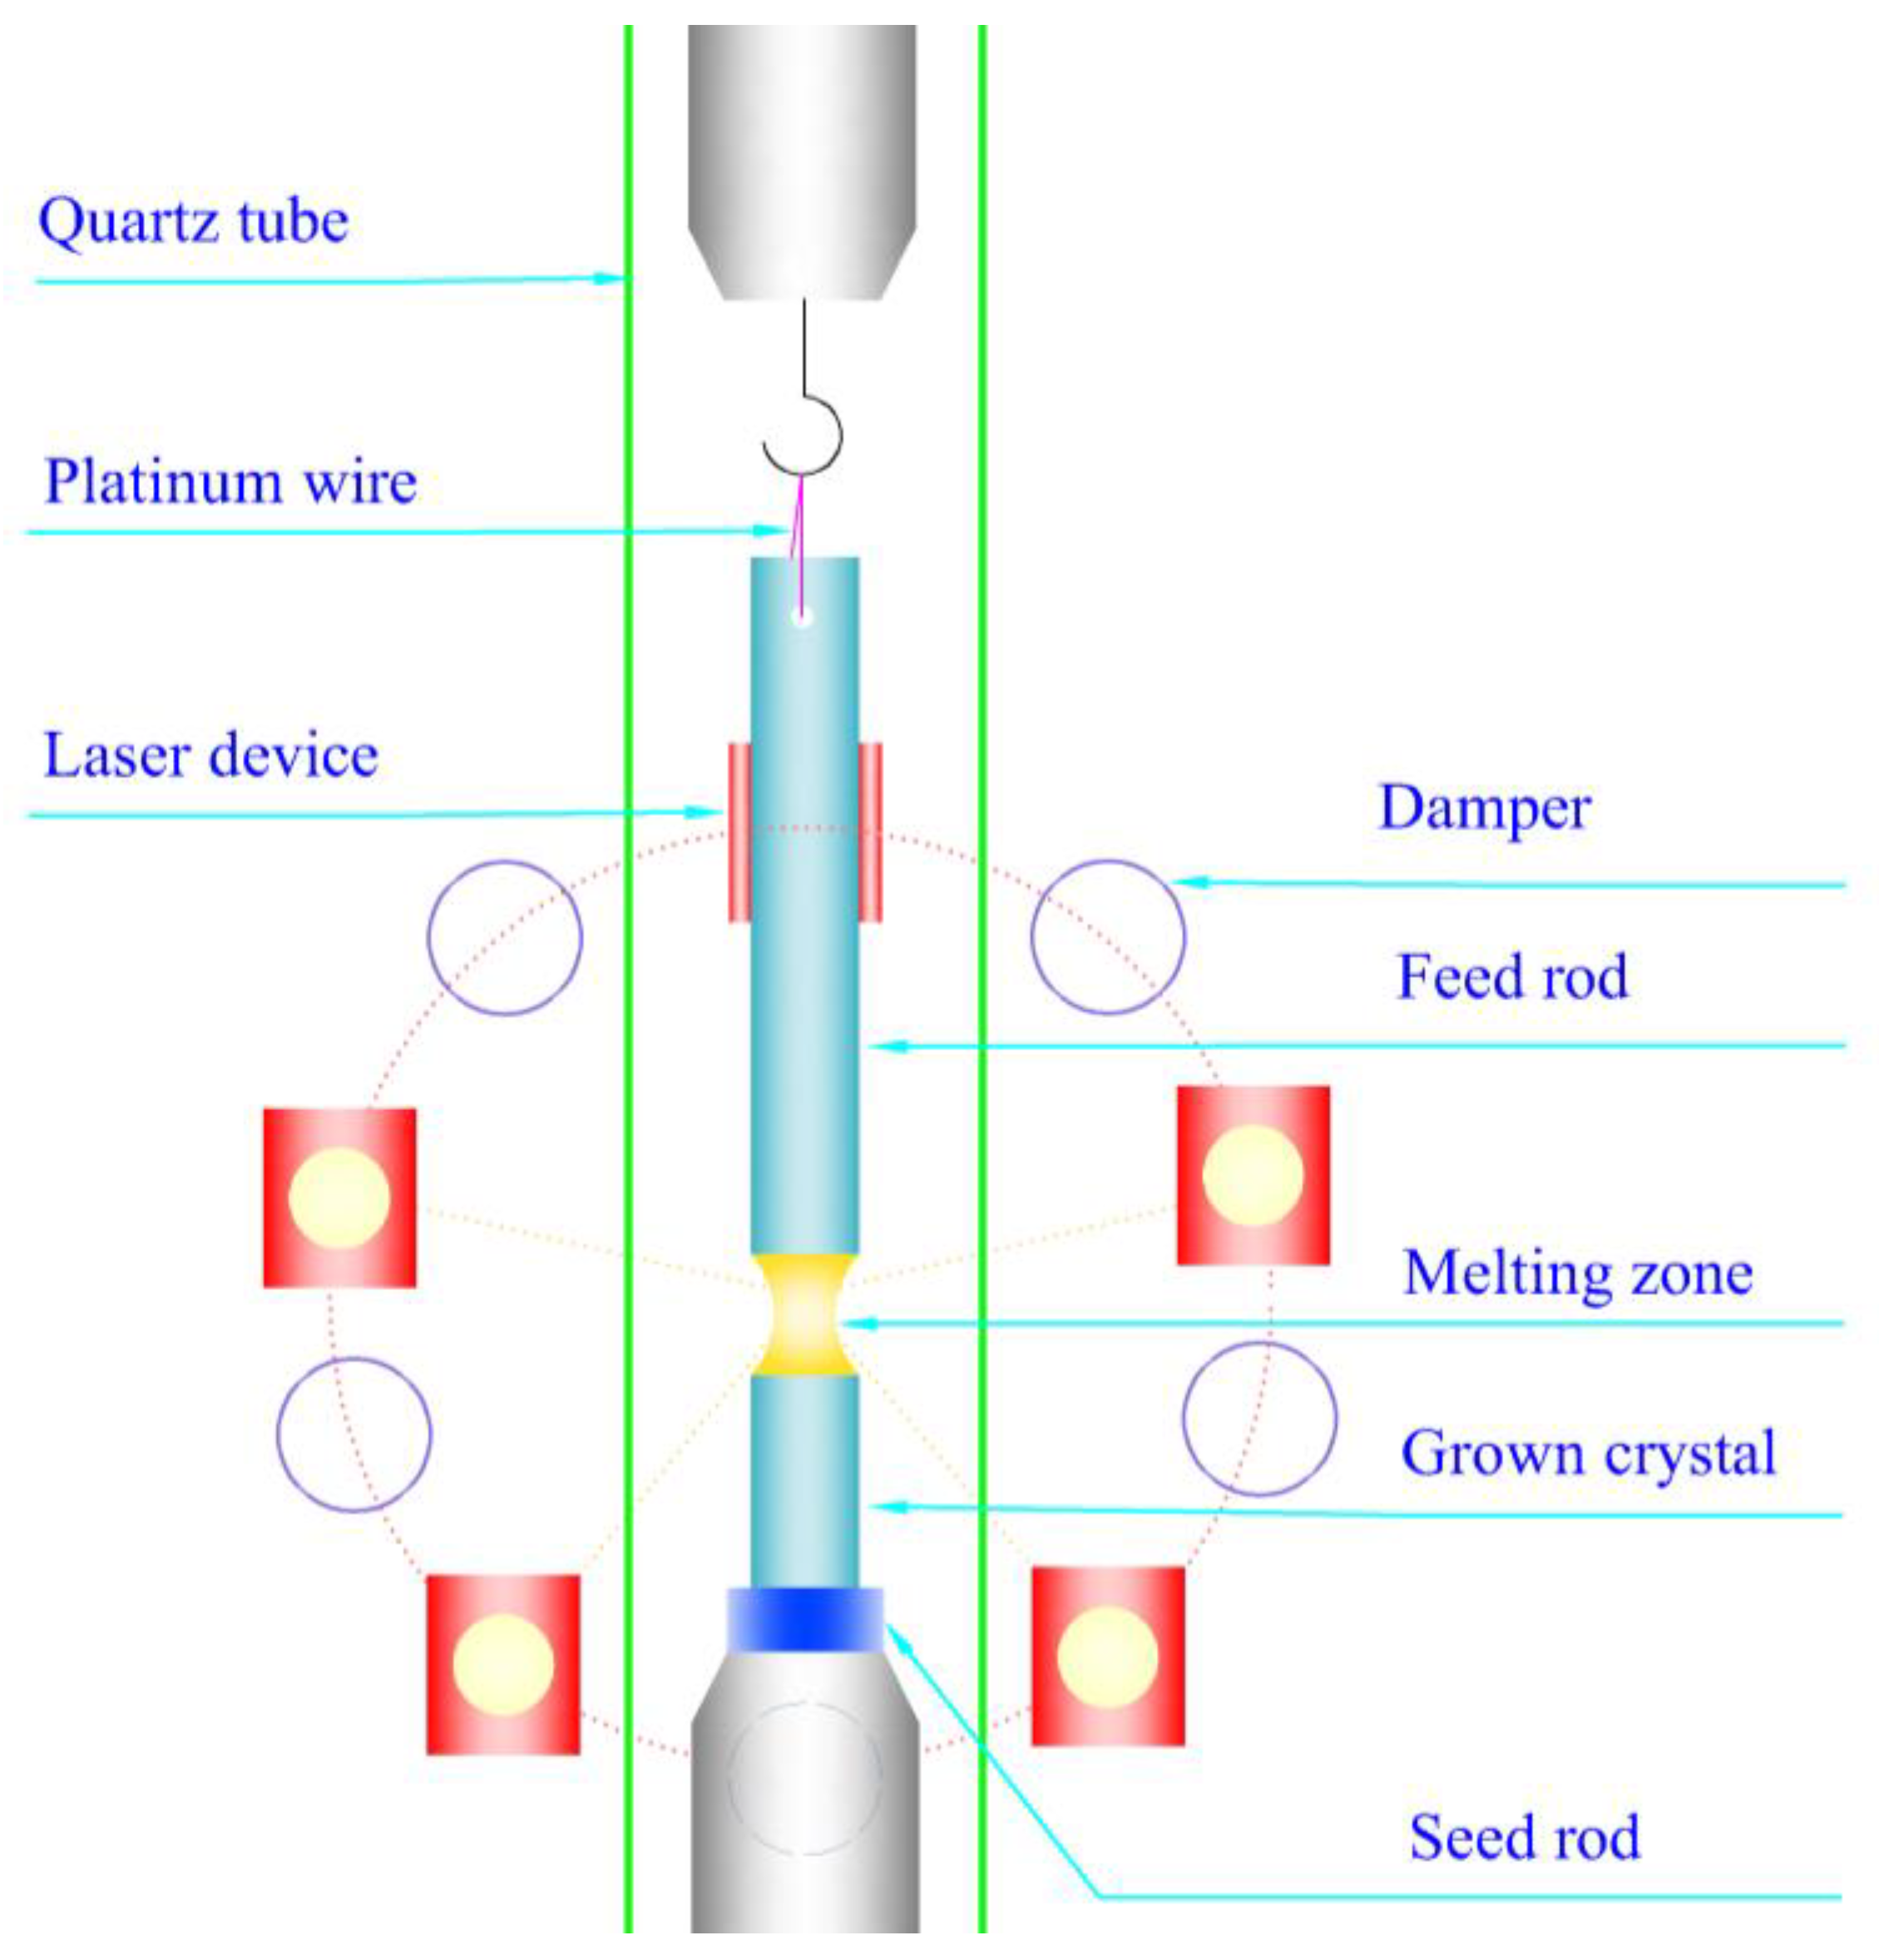
Figure 1. Schematic diagram of the growth principle.
Crystals 12 01789 g001
Figure 2. Crystals obtained under different oxygen content atmospheres: (a) high-purity Ar2, mixed gas (b) Ar2:O2 = 1:1, and (c) Ar2:O2 = 3:7.
Crystals 12 01789 g002
Figure 3. (a) Variation in the convexity (h/d) under different rotation rates and (b) a schematic diagram showing the definition of convexity (h/d).
Crystals 12 01789 g003
Figure 4. TiO2 crystals under different processes. (a) Before optimization, (b) after optimization, (c) annealed, and (d) processed.
Crystals 12 01789 g004
Figure 5. (a) Morphology of the sample after being polished and (b) SEM image.
Crystals 12 01789 g005
Figure 6. Different forms of (a) crystal wafer and (b) single crystal powder of XRD patterns.
Crystals 12 01789 g006
Figure 7. Transmission spectra of crystals in the (a) visible band and (b) infrared band.
Crystals 12 01789 g007
Figure 8. (a) Fluorescence excitation spectra and (b) emission spectra with different pump sources (red, 362 nm pump; and black, 218 nm pump) of the TiO2 crystal.
Crystals 12 01789 g008
Figure 9. Raman spectra of the sample.
Crystals 12 01789 g009
Figure 10. Thermal expansion coefficient of TiO2 single crystal.
Crystals 12 01789 g010
Table 1. Summarized parameters of grown crystals.
MaterialPolycrystalline Material without Seed Crystals
Crystal dimensionΦ 9 × 25 mm3
Growth orientation(101)
Growth rate6 mm/h
Rotation20 rpm
Zone length~7 mm
AtmosphereArgon + 0.1 MPa Oxygen (70%)
Transmission range (transmittance)410–6560 nm
Absorption peak position218, 362 nm
Emission peak position403, 438 nm
Thermal expansion coefficient9.92 × 10−6/K
Laser damage threshold1.44 GW/cm2
Publisher’s Note: MDPI stays neutral with regard to jurisdictional claims in published maps and institutional affiliations.