Article

Effect of the Strength of Initial Aluminium on the Bonding Properties and Deformation Coordination of Ti/Al Composite Sheets by the Cold Roll Bonding Process

1
College of Materials Science and Engineering, Guilin University of Electronic Technology, Guilin 541004, China
2
Zhejiang WLY Precision Manufacturing Co., Ltd., Jinhua 321000, China
3
College of Metallurgy and Energy, North China University of Science and Technology, Tangshan 063210, China
4
School of Materials Science and Engineering, Xi’an Shiyou University, Xi’an 710065, China
*
Authors to whom correspondence should be addressed.
Crystals 2022, 12(11), 1665; https://doi.org/10.3390/cryst12111665
Submission received: 22 October 2022 / Revised: 13 November 2022 / Accepted: 14 November 2022 / Published: 18 November 2022
(This article belongs to the Special Issue Advances in Laminated Metallic Composites)

Abstract

:
Ti/Al composite sheets were prepared using the cold rolling process, and different initial aluminium strengths were considered. The results showed that the peel strength of the Ti/Al composite sheet increased with the increasing initial strength of aluminium under the same reduction. A higher strength of the initial aluminium corresponds to better deformation coordination between titanium and aluminium, where the strain hardening of titanium and aluminium plays an important role. The change degree of the components of twins on the titanium side for the Ti/Al composite sheet with a low aluminium strength is stronger than that for the Ti/Al composite sheet with a high aluminium strength. The strong change in the components of twins may result in the low uniformity of the microstructure on the titanium side. The analysis of the peeling surface shows aluminium residue on the titanium side, while there was almost no titanium residue on the aluminium side. At the same reduction, a higher strength of aluminium corresponds to less aluminium residue on the titanium side. The bonding properties of Ti/Al cold-rolled composite sheets were determined by four strong bonding areas. The strength of the initial aluminium was the main factor, and the residual amount of aluminium on the titanium side of the peeling surfaces was a secondary factor.

1. Introduction

In modern industry, laminated metal composites play a very important role because compared with a single metal, they effectively combine the physical, chemical and mechanical properties of each layer. In addition, laminated metal composites can reduce the cost of the manufacturing process or product application. Ti/Al laminated composites combine the high corrosion resistance and high temperature performance of titanium with the low density, high specific strength, specific stiffness, good electrical conductivity and good thermal conductivity of aluminium. Therefore, they are widely used in aerospace, construction and petrochemical industries, equipment manufacturing and other fields. As the most economical, efficient and widely used method to prepare laminated metal composites, roll bonding has been applied to the preparation of Ti/Al laminated composites by an increasing number of scholars [1,2,3,4].
Deformation coordination and bonding strength are the keys to determining the comprehensive properties of Ti/Al laminated composites. There is a great difference in room temperature deformation between titanium and aluminium. The microscopic reflection of this uncoordinated deformation is that the microstructure of each layer is inhomogeneous along the thickness, and excessive residual deformation accumulates at the interface and inside the matrix, which decreases the overall mechanical properties of the composite sheet. Therefore, improving the uncoordinated deformation between titanium and aluminium is very important for the preparation of high-quality Ti/Al laminated composites. Xiao et al. [5] prepared Ti/Al laminated composites by differential temperature rolling. The results showed that with the increase in the total rolling reduction and heating temperature of the titanium layer, the deformation of titanium and aluminium became more homogeneous and reached an almost identical thickness reduction. Although temperature-controlled rolling technology has a certain application in industry, it must be equipped with a high-temperature heating gas protection device, which has a large investment and some problems in practical operation. Miyajima et al. [6] sought a breakthrough from another angle for this type of laminated composite with large deformation differences among the layers. By changing the strength of the initial aluminium, the deformation coordination of the Cu/Al laminated composites was significantly improved. Inspired by this phenomenon, an aluminium layer with low strength is strengthened in this study to obtain Ti/Al laminated composites with deformation coordination and high bonding strength from strength matching to deformation matching. In our work, the effect of the strength of initial aluminium on the deformation coordination and bonding strength of Ti/Al laminated composites is studied, and the microstructure evolution of the titanium and aluminium layers near the interface along the thickness direction is analysed.
Many scholars have studied the mechanism for the interfacial bonding of bimetal from an experimental viewpoint, combined with film theory, and rarely set up a surface film rupture model to explain the formation of the bonding interface from a theoretical viewpoint [7,8,9]. In the cold roll bonding process, the flow of the bottom fresh metal in the crack is similar to a macro extrusion process. Zhang et al. [10] analysed the pressure distribution of the composite sheet in the roll gap using the slab method. Le et al. [11] mathematically modelled the oxide film rupture on the aluminium surface and the metal extrusion behaviour during roll bonding and found the critical aspect ratio of the oxide film relative to the tensile strength of the oxide film and the shear yield stress of the metal matrix. The quantitative relationship between the extrusion rate of fresh metal and the thickness reduction is also established. Based on the extrusion model proposed by Zhang and the research results of Le, Yang et al. [12] established the extrusion fracture model of an oxide film on the surface of a three-layer symmetrical metal-clad sheet in the rolling deformation zone and provided the aspect ratio of the oxide film. This mathematical model is based on the fracture of the surface oxide film and does not simultaneously consider the hardening layer and oxide film. Therefore, this study extends it to the hardening layer and oxide film and establishes the corresponding fracture model to explain the interfacial bonding mechanism of Ti/Al laminated composites by the cold roll bonding process.

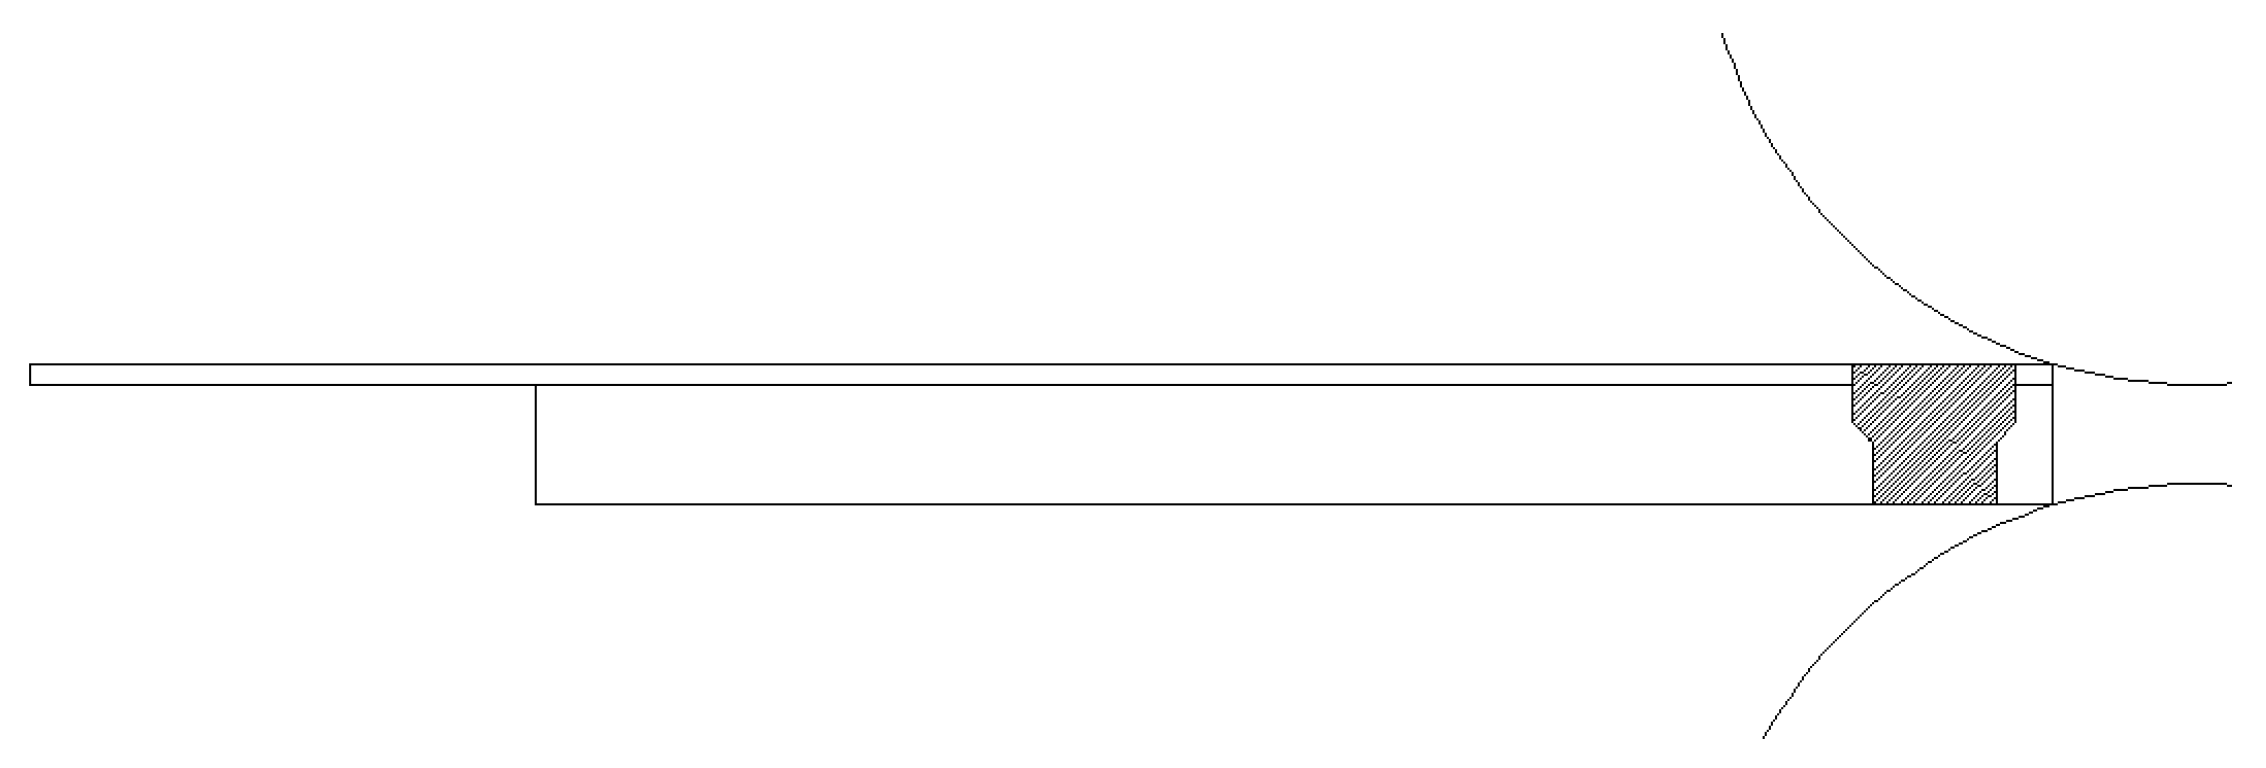
2. Experimental Procedure

The raw materials used in the experiment were commercial pure titanium (TA1) and AA4047 aluminium alloy, and the chemical compositions are shown in Table 1. Three types of AA4047 aluminium alloys with different strengths were obtained by the following treatment: AA4047 aluminium alloy with a thickness of 2.0 mm was rolled to 1.2 mm in two passes (2.0 mm → 1.5 mm → 1.2 mm); part of this rolled alloy was annealed at 300 °C for 1 h; AA4047 aluminium alloy with a thickness of 5.0 mm was rolled to 1.2 mm in four passes (5 mm → 3.5 mm → 2 mm → 1.5 mm → 1.2 mm). The AA4047 aluminium alloys after the annealing treatment, two-pass strengthening treatment and four-pass strengthening treatment are expressed as Al ①, Al ② and Al ③, respectively. The initial sizes of the TA1 and AA4047 aluminium alloys were 0.2 mm × 75 mm × 200 mm and 1.2 mm × 75 mm × 150 mm (thickness × width × length), respectively. The mechanical properties of the AA4047 aluminium alloy and TA1 pure titanium in the experiment are shown in Table 2. Plate-type tensile specimens (gage length: 25 mm, gage width: 6 mm) were prepared in the rolling and transverse directions. They were tested at room temperature at a loading rate of 1 × 10⁻³ m/min by a universal testing machine in accordance with national standard GB/T 228.1-2010. The tensile test was repeated at least three times for each condition to ensure that the results were reliable.
In order to investigate the deformation coordination of each layer in the Ti/Al composite sheet, the TA1 sheets were rolled by rolling reductions of 20%, 30%, 40% and 55%, and the Al ①, Al ② and Al ③ sheets were rolled by rolling reductions of 30%, 45%, 60% and 75%, respectively, to obtain yield strengths in the transverse and rolling directions. Based on the yield strength of a single titanium (or aluminium) sheet under four reductions, the variation rule of yield strength of titanium (or aluminium) in the range of 20% to 55% (30% to 75% for aluminium) was simulated to indirectly reflect the strength properties of each layer in the Ti/Al composite sheet under the corresponding reduction.
Before roll bonding, any oil stain or attachment on the surfaces of the titanium and aluminium sheets were removed as follows: the specimens were added to a beaker containing acetone and placed into an ultrasonic cleaning instrument. The cleaning time was set to 15 min, and cleaning was repeated twice. The cleaned titanium and aluminium sheets were dried with a blower, and then the surfaces were polished with a steel wire brush until they showed fresh metal (i.e., the metal lustre was visible with the naked eye). One end each of the surface-treated TA1 and AA4047 was aligned, and two holes with a diameter of Φ5 mm were drilled and riveted with a pull riveter. The rivet material was aluminium, and the riveted protrusion was hammered flat with a flat-head hammer to facilitate biting during subsequent rolling. Then, one-pass cold rolling was performed (see Figure 1). The stacking sequences of all clad sheets were TA1/AA4047. The rolling reductions were 35%, 42% and 50%. The rolling mill load was 50 t, the roll diameter was 270 mm, and the rolling speed was 100 rpm. The specific rolling process is presented in Table 3.
The interfacial bonding morphology was observed by optical microscopy (MV5000). To investigate the interfacial bonding morphology and peeling surface morphology more carefully, a scanning electron microscope (JSM 7500, JEOL) was used for analysis. An orientation analysis of the interfacial microregion was performed using a TESCAN MAIA3 ultrahigh resolution field emission scanning electron microscope with an EBSD module. For laminated metal composites, it was difficult to prepare specimens by electropolishing and to simultaneously obtain chrysanthemum pool patterns of each layer. Meanwhile, under large reduction, the residual stress was large, and the calibration ratio of the specimens obtained by electropolishing was low. Combined with the above factors, the EBSD specimens were mechanically polished and ion etched in this study; then, the EBSD test was performed. The model of the ion etcher was a Leica RES101 and a NordlysNano (Oxford company) was used for EBSD. The following information was obtained using Channel 5 software: the orientation map, pole figure, inverse pole figure, KAM map, misorientation axis distribution map and ODFs. The corresponding relationship between the sample coordinate system and the crystal coordinate system was as follows: rolling direction (RD) || X, normal direction (ND) || Y, transverse direction (TD) || Z.
The bonding strength of the cold-rolled Ti/Al composite sheet was measured with a 180° peel test. The peel test was performed using a universal tensile testing machine (Figure 2). The size of the peel specimens was 5 mm × 130 mm (width × length), the peeling speed was 20 mm/min, and each peeling experiment was repeated three times.

3. Results and Discussion

3.1. Wire Brushing Surface Morphology

Figure 3 presents the SEM micrograph of the surface morphology of TA1 and AA4047 after wire brushing. Figure 3a shows some block hardeners on the surface of TA1, which are stripped from the surface due to wire brushing. Moreover, as shown in the enlarged figure, a part of the large block hardeners is decomposed into many small pieces due to repeated wire brushing. The surface morphologies of Al ①, Al ② and Al ③ have identical characteristics. Since aluminium is softer than titanium, block hardeners also appear on the surfaces of these three types of aluminium, but they exist in the drag shape, which indicates that the surface of AA4047 has undergone severe plastic deformation and a fresh metal surface is formed. Moreover, some scholars note that there is an ultrafine grain layer from the metal surface treated with wire brushing to the area of approximately tens of microns of the matrix. The grain refinement produced by wire brushing plays an important role in the bonding formation of the two opposite metal surfaces [13].

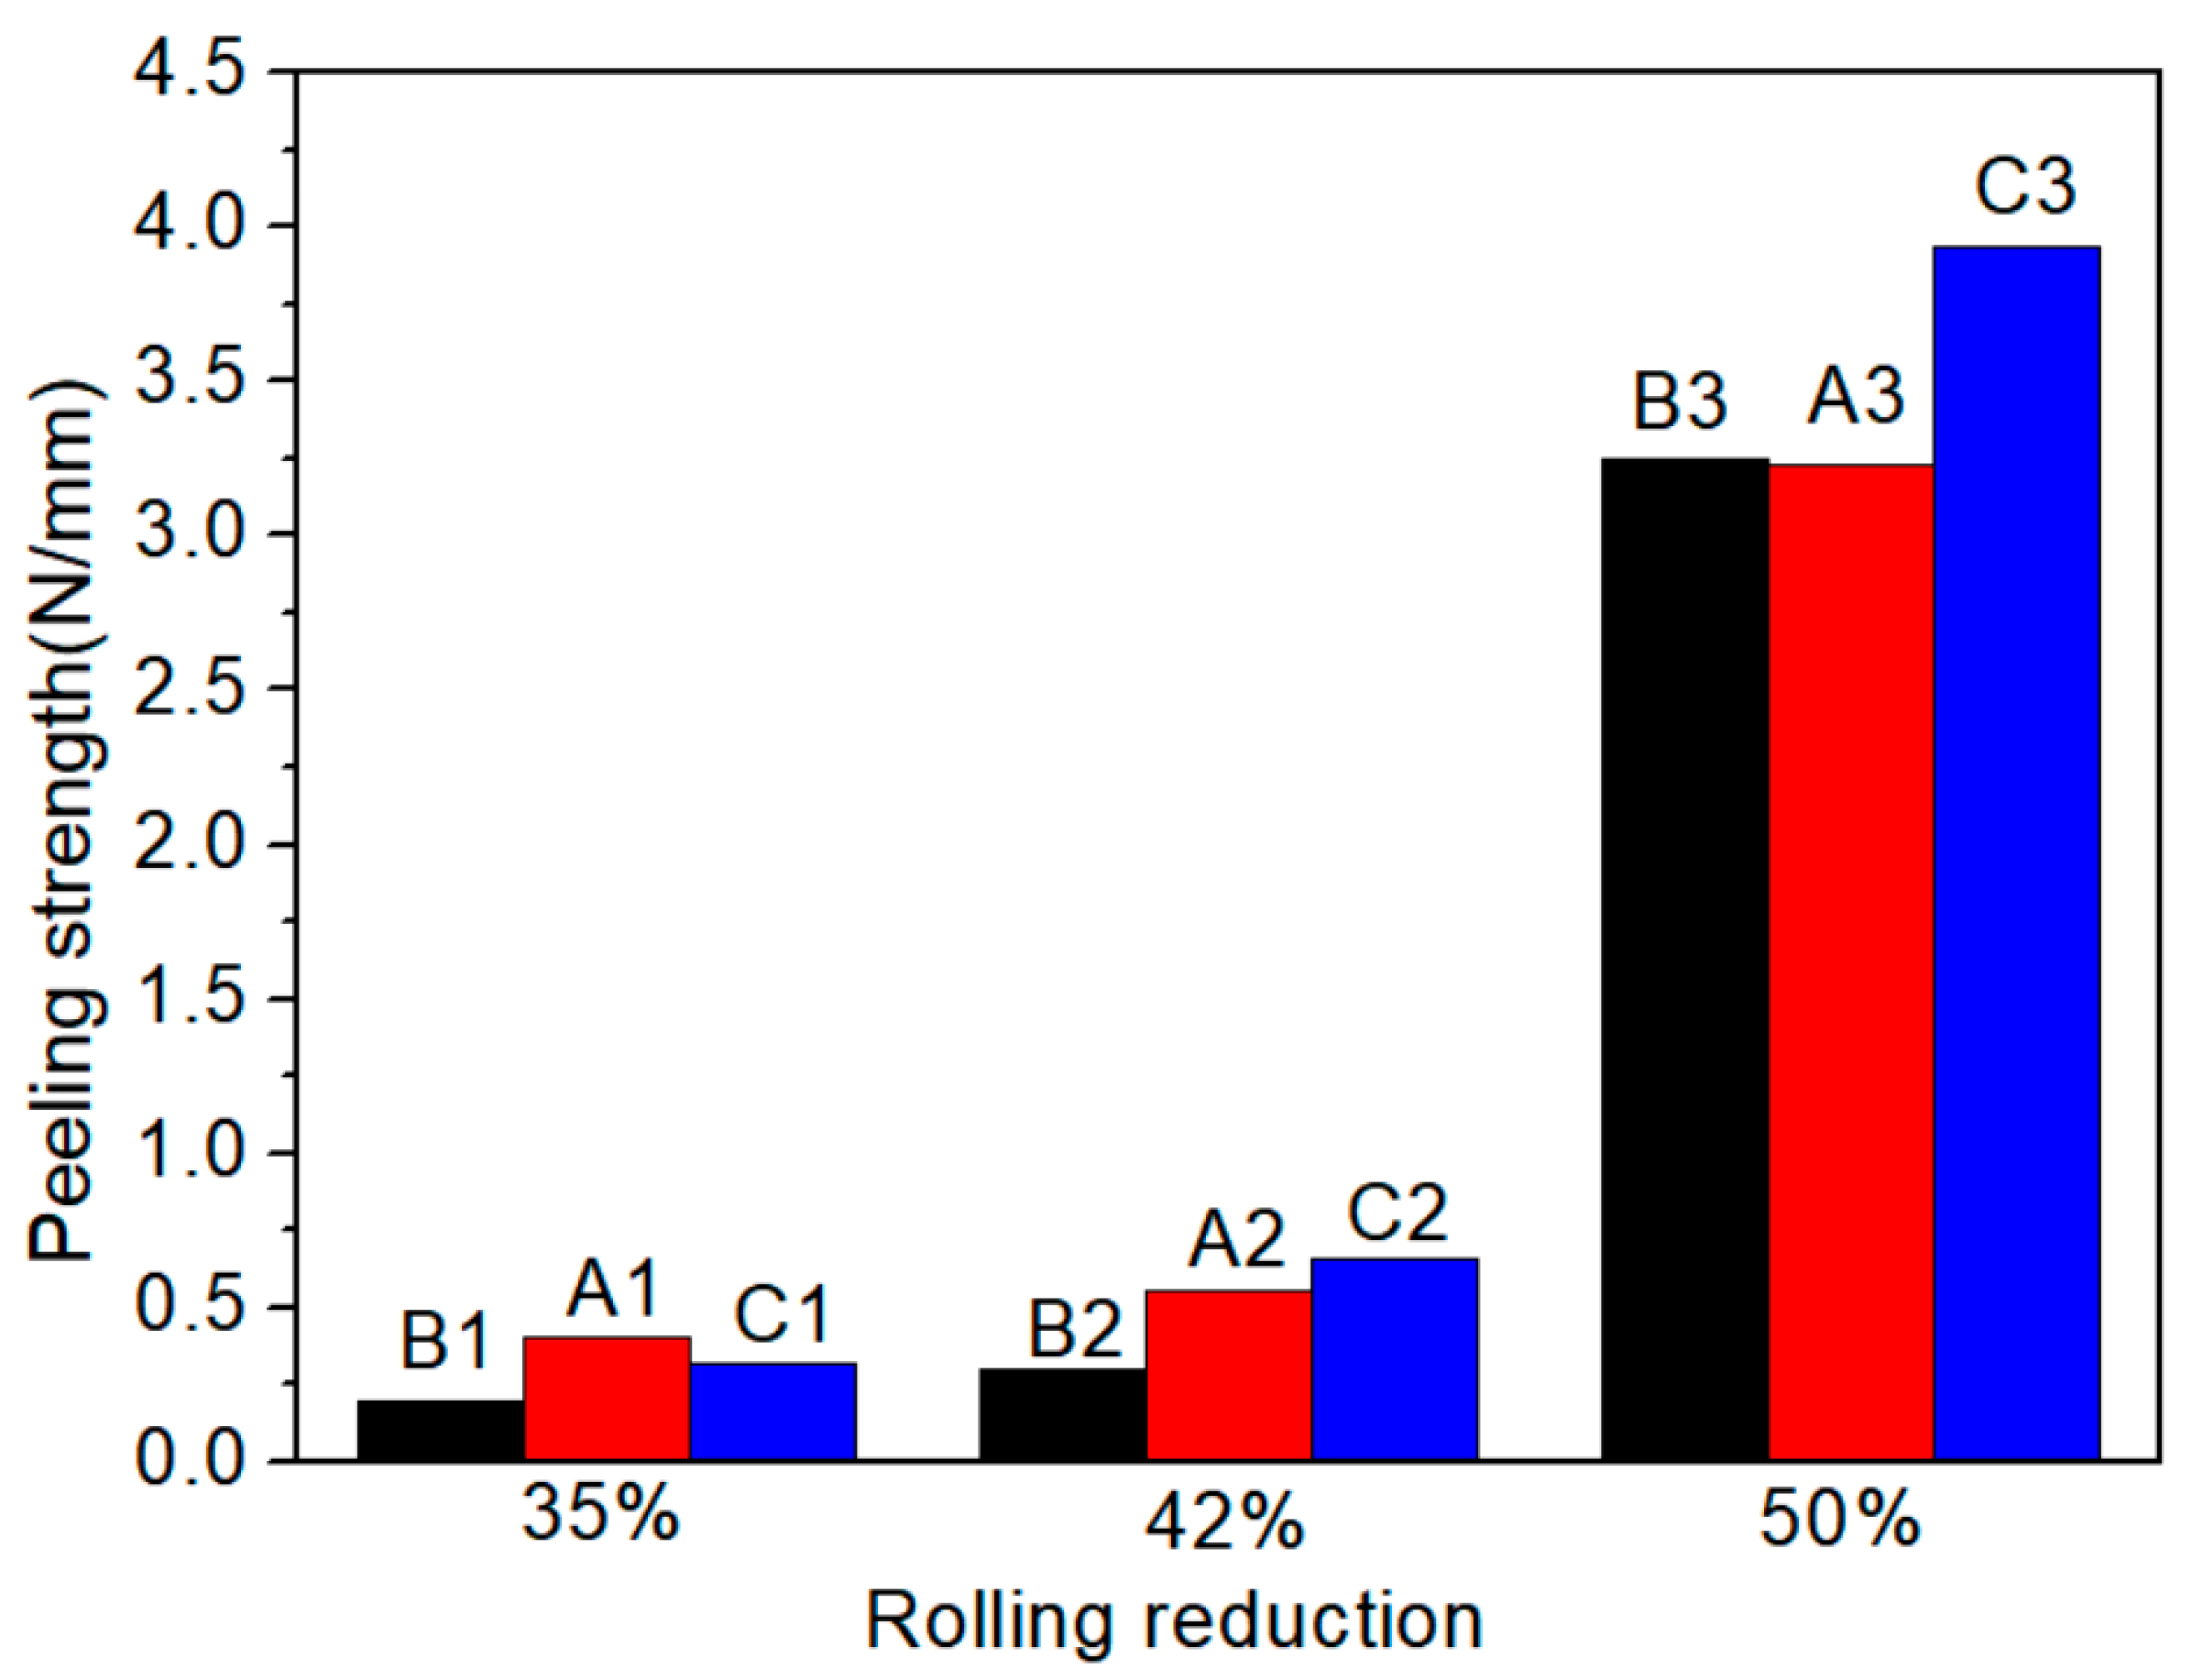
3.2. Interfacial Bonding Strength of the Ti/Al Composite Sheet

Figure 4 shows the effect of reduction on the peel strength of specimens A, B and C. When the reduction is less than 42%, the peel strength of the three types of Ti/Al composite sheets can be divided into two trends: slowly increasing, such as specimens A and C, and almost unchanged, such as specimen B. Moreover, the peel strength of specimen C2 is twice that of specimen B2, which indicates that the critical reductions of specimens B, A and C decrease in turn. At 35% reduction, the three types of Ti/Al composite sheets have small peel strength, which indicates that below a 35% reduction, the expansion of the contact surface between titanium and aluminium is limited, the covering layers are less broken, the atoms do not reach a close bonding state, and the contact surface forms a mechanical bite. When the critical reduction is exceeded, the peel strength significantly increases, which indicates that many covering layers break at this time, and close bonding occurs in the underlying metal extruded through cracks. Moreover, the deformation-induced local adiabatic temperature rise will cause recrystallisation at the interface, which helps improve the interfacial bonding quality. Yang et al. [14] performed cold rolling experiments on multilayer Ti/Al and found that the grain of the aluminium layer at the interface grew significantly and thermal erosion occurred, which indicates that the bonding interface was completely recrystallised and reflects the beneficial effect of the increase in interface adiabatic temperature on the interfacial bonding under high reduction from one side. Moreover, high reduction can form a shear deformation zone at the contact interface, which helps penetrate the covering layers and enhance the interface toughness. Additionally, specimen C has a higher peel strength (3.9 N/mm) than specimens A and B (3.2 N/mm).

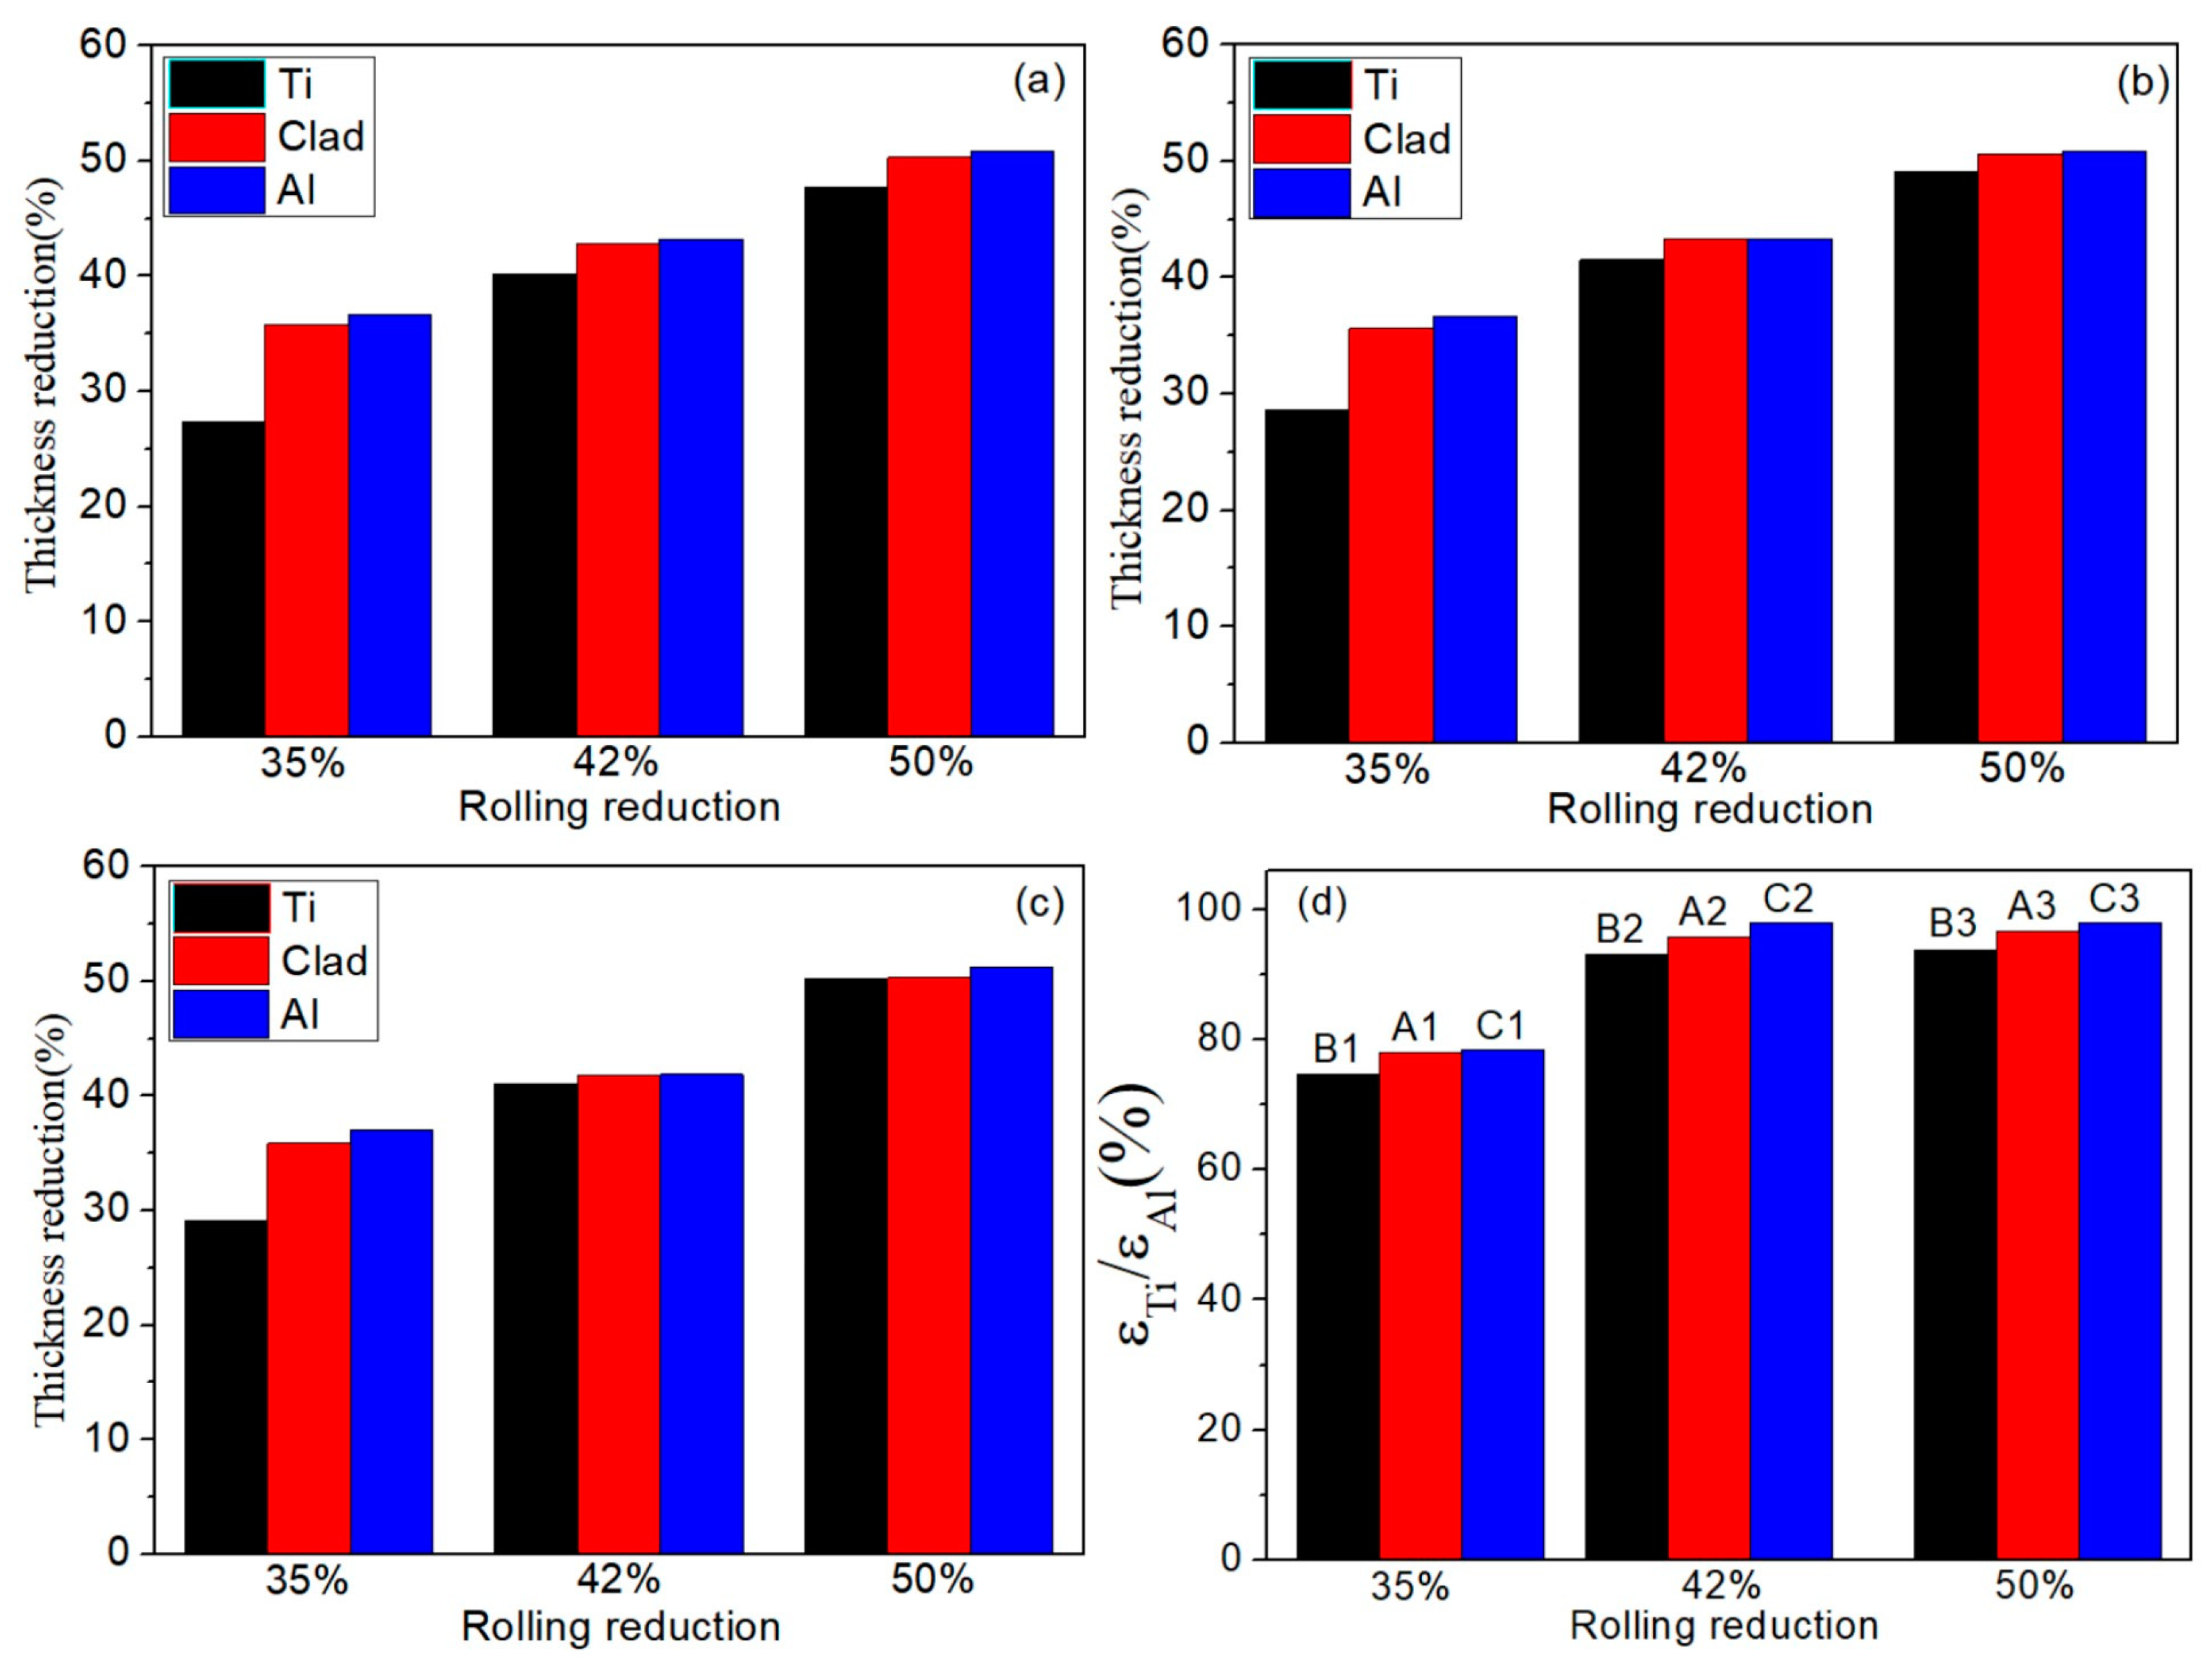
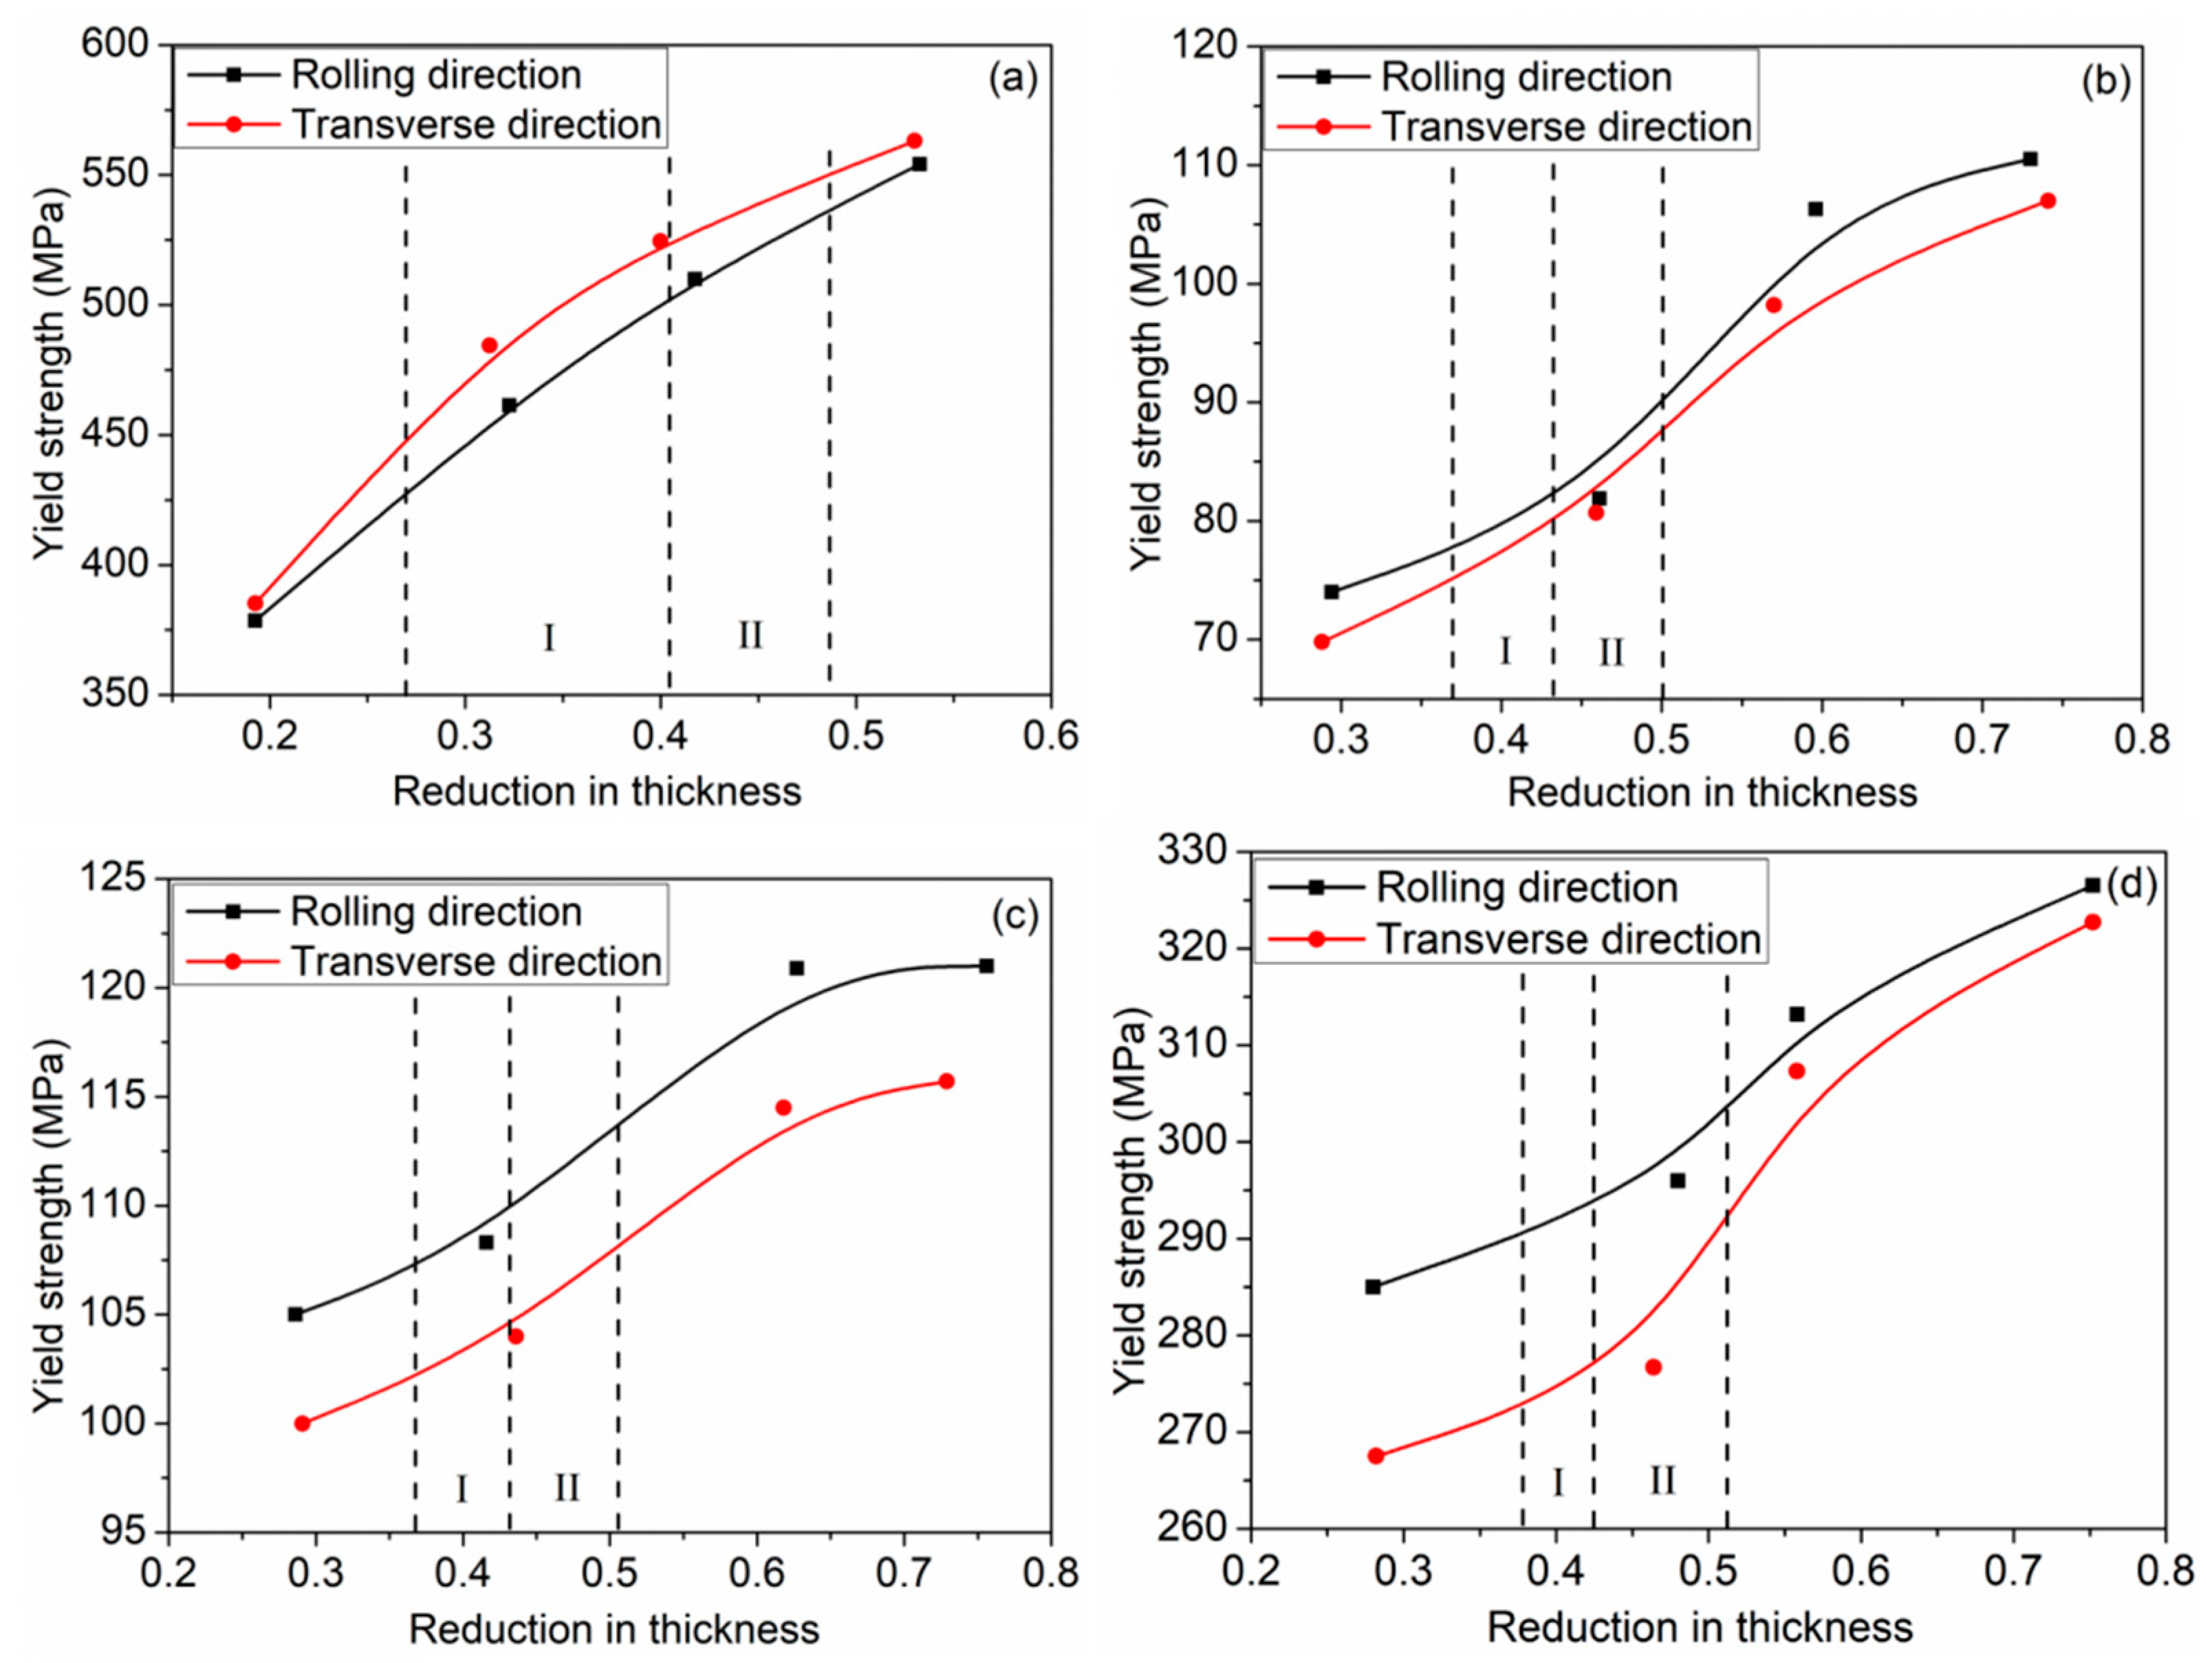
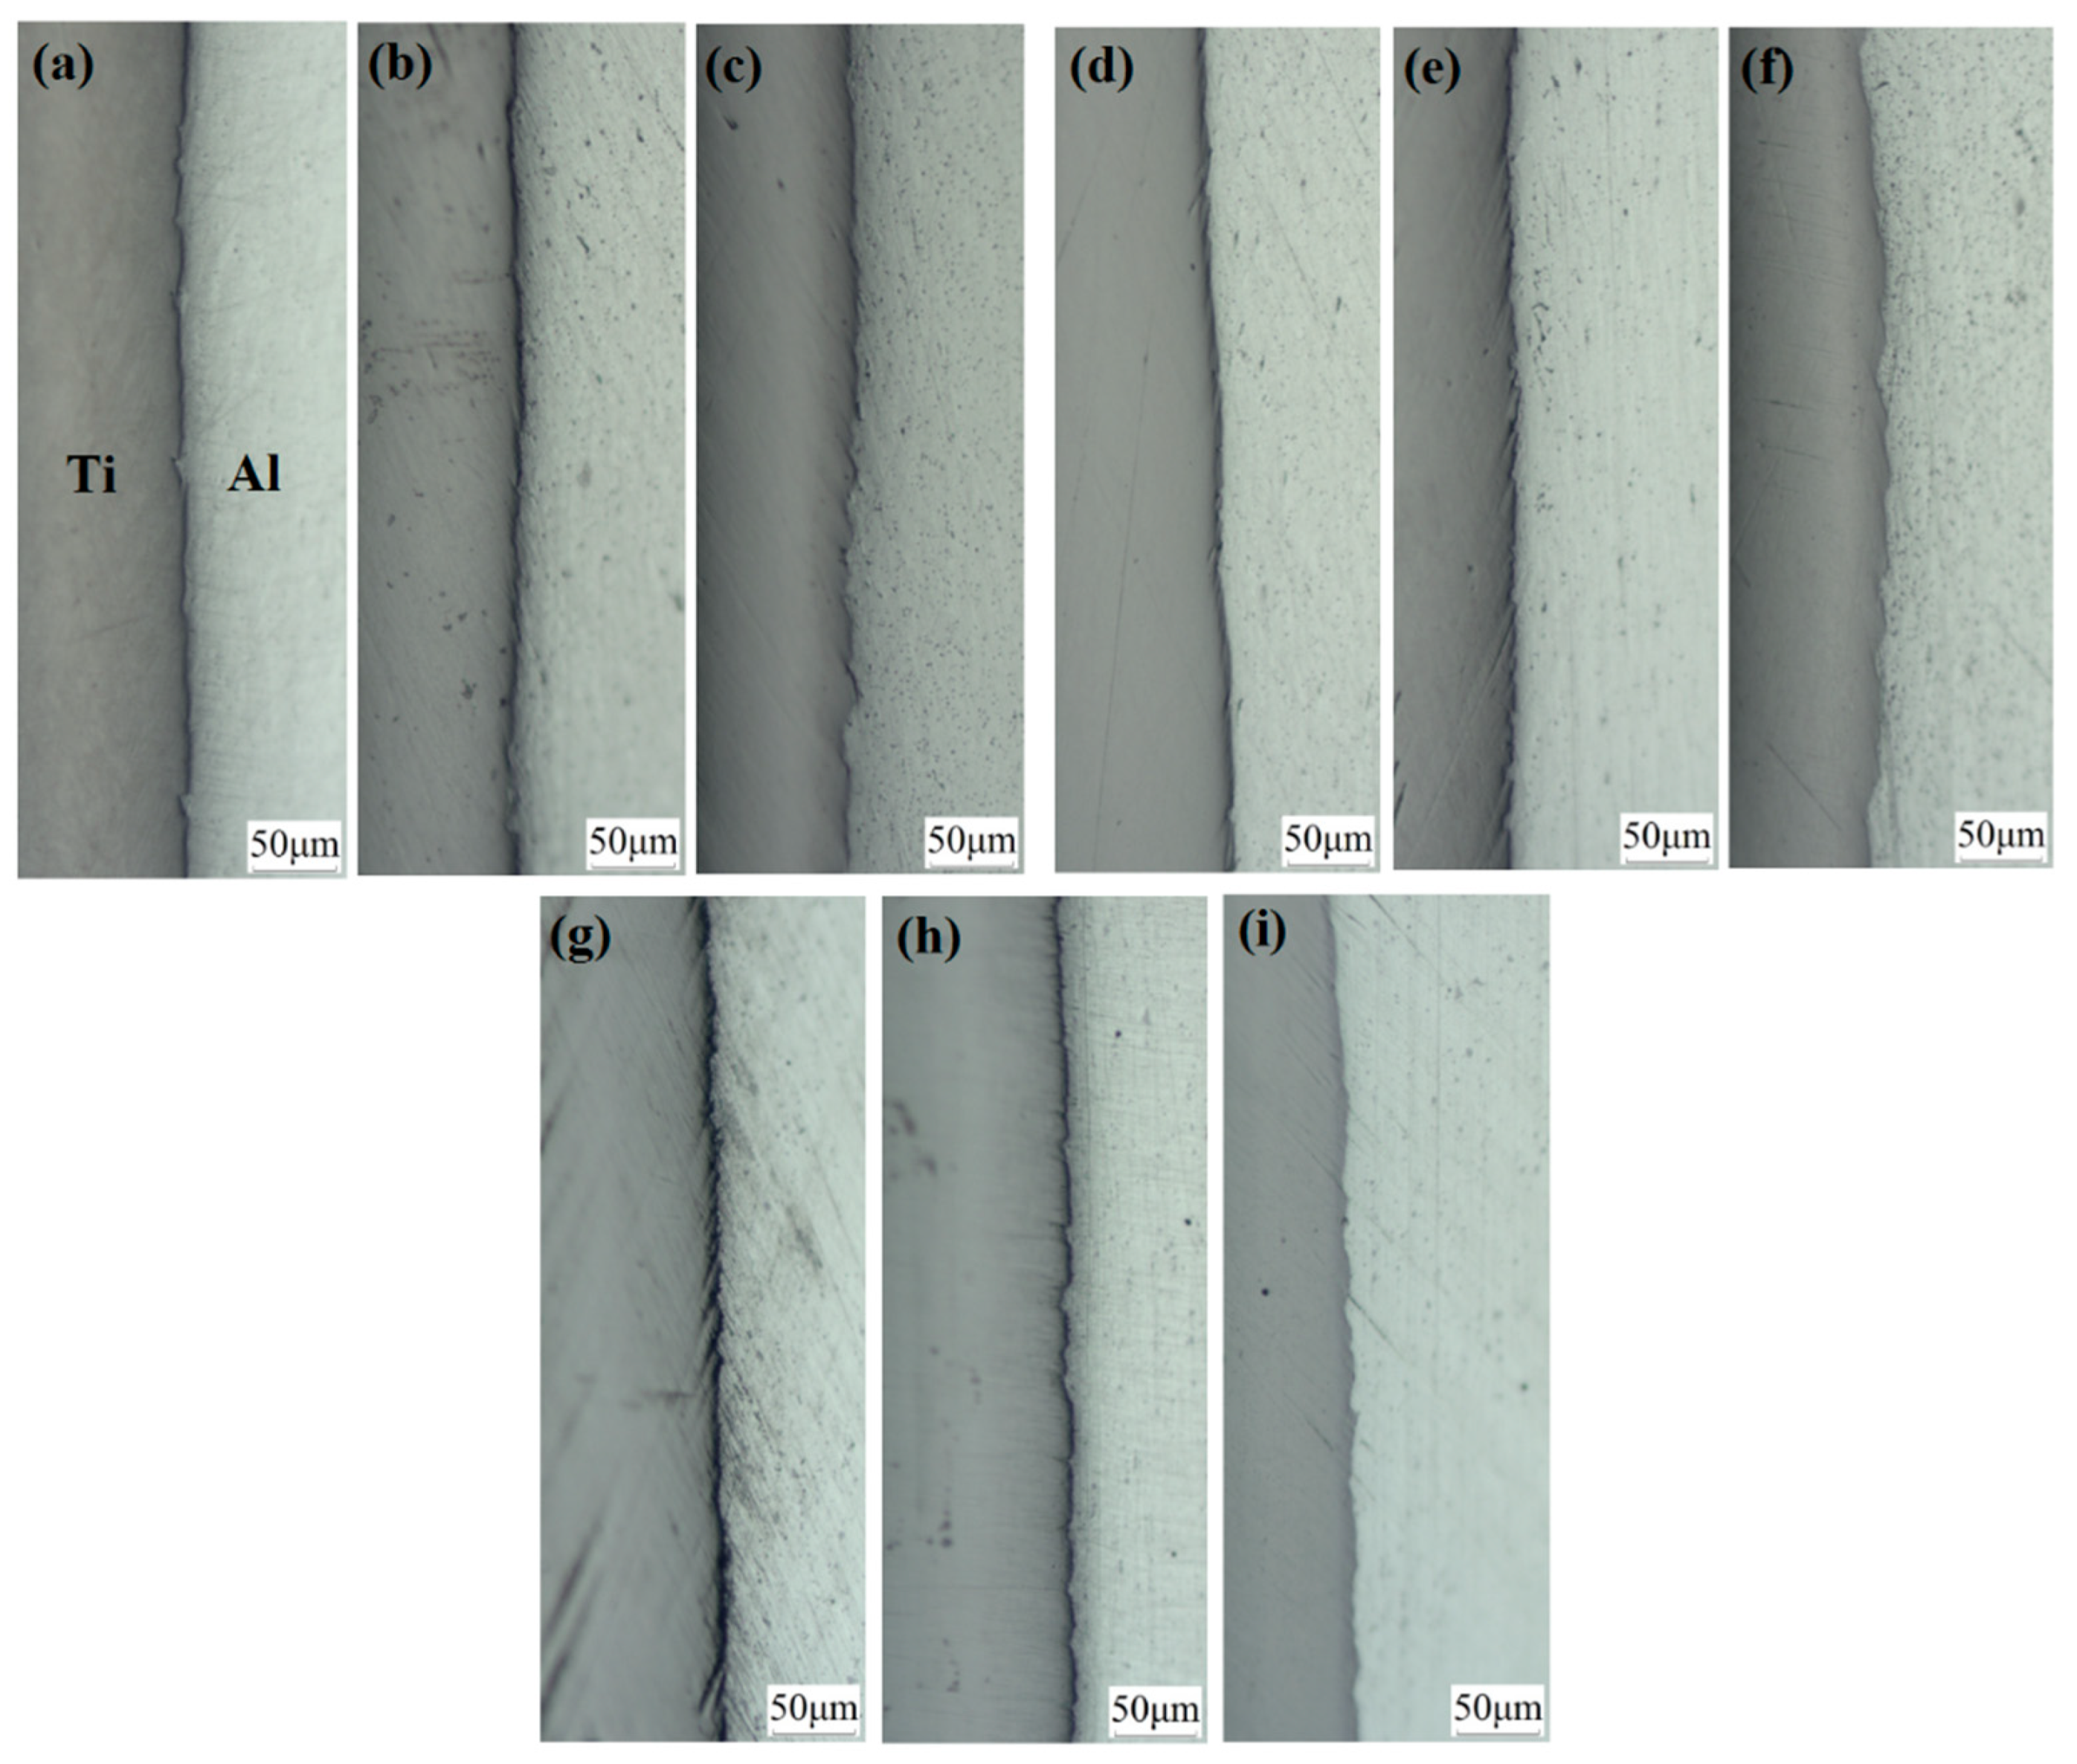
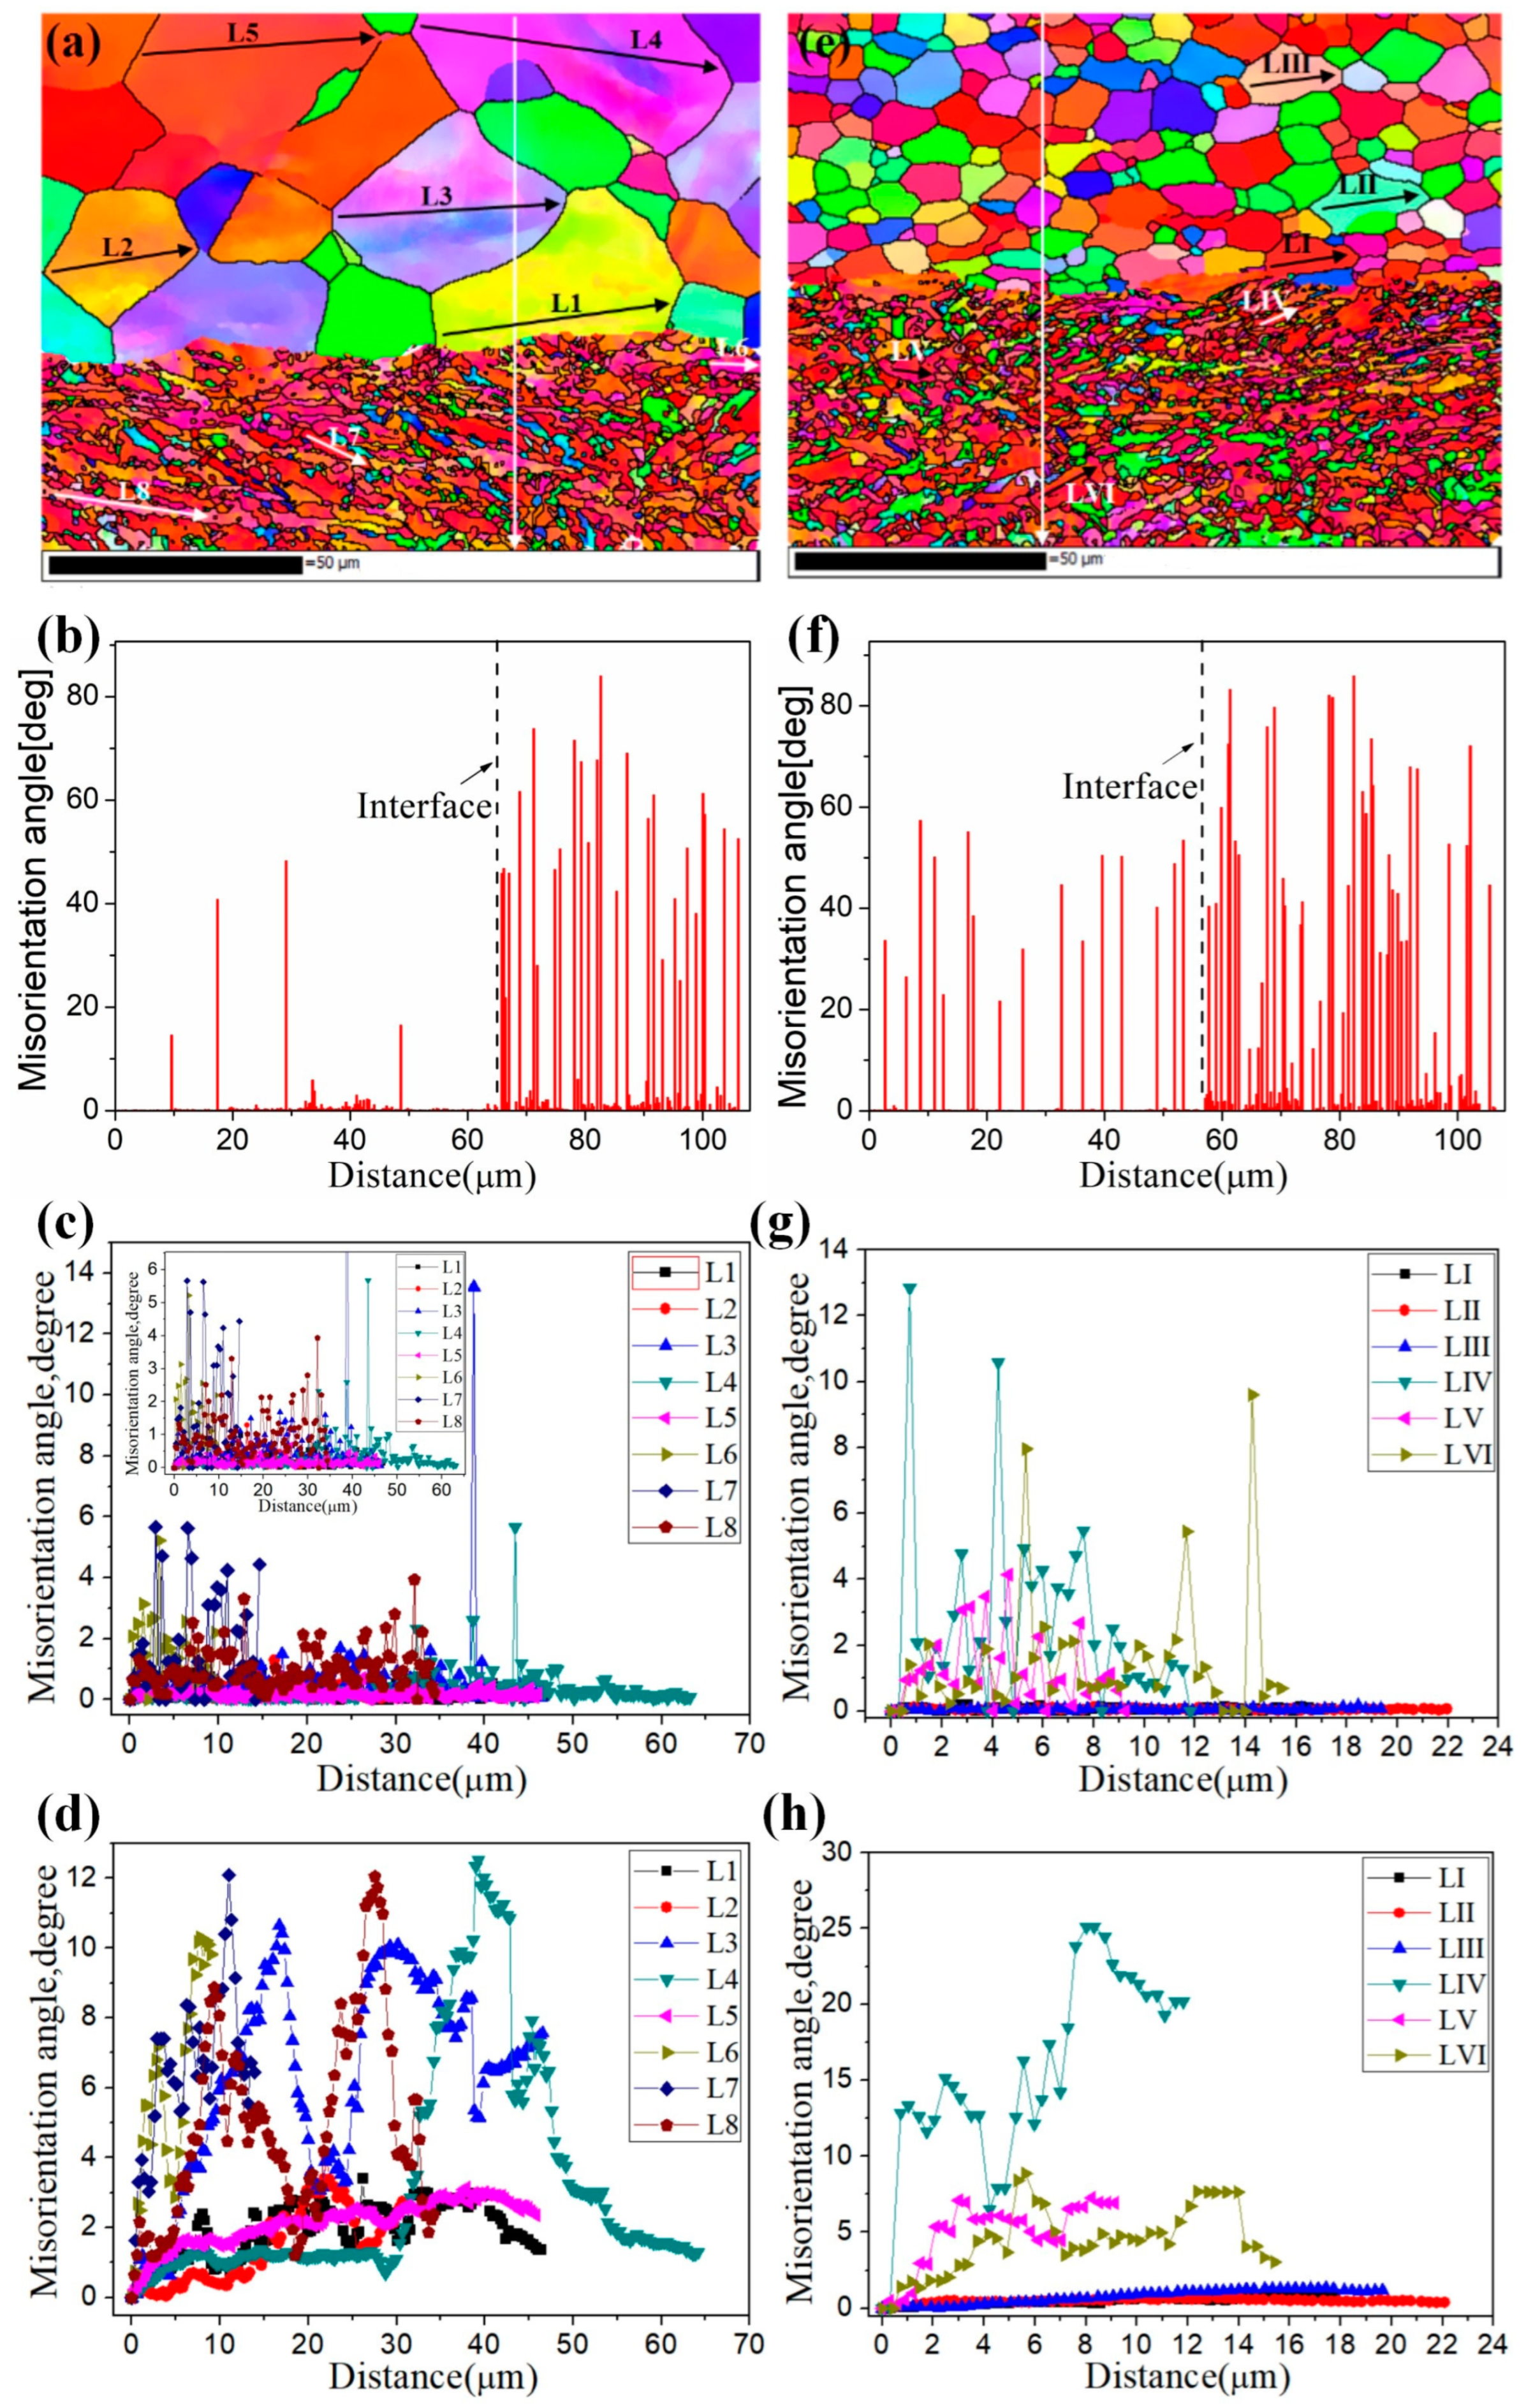
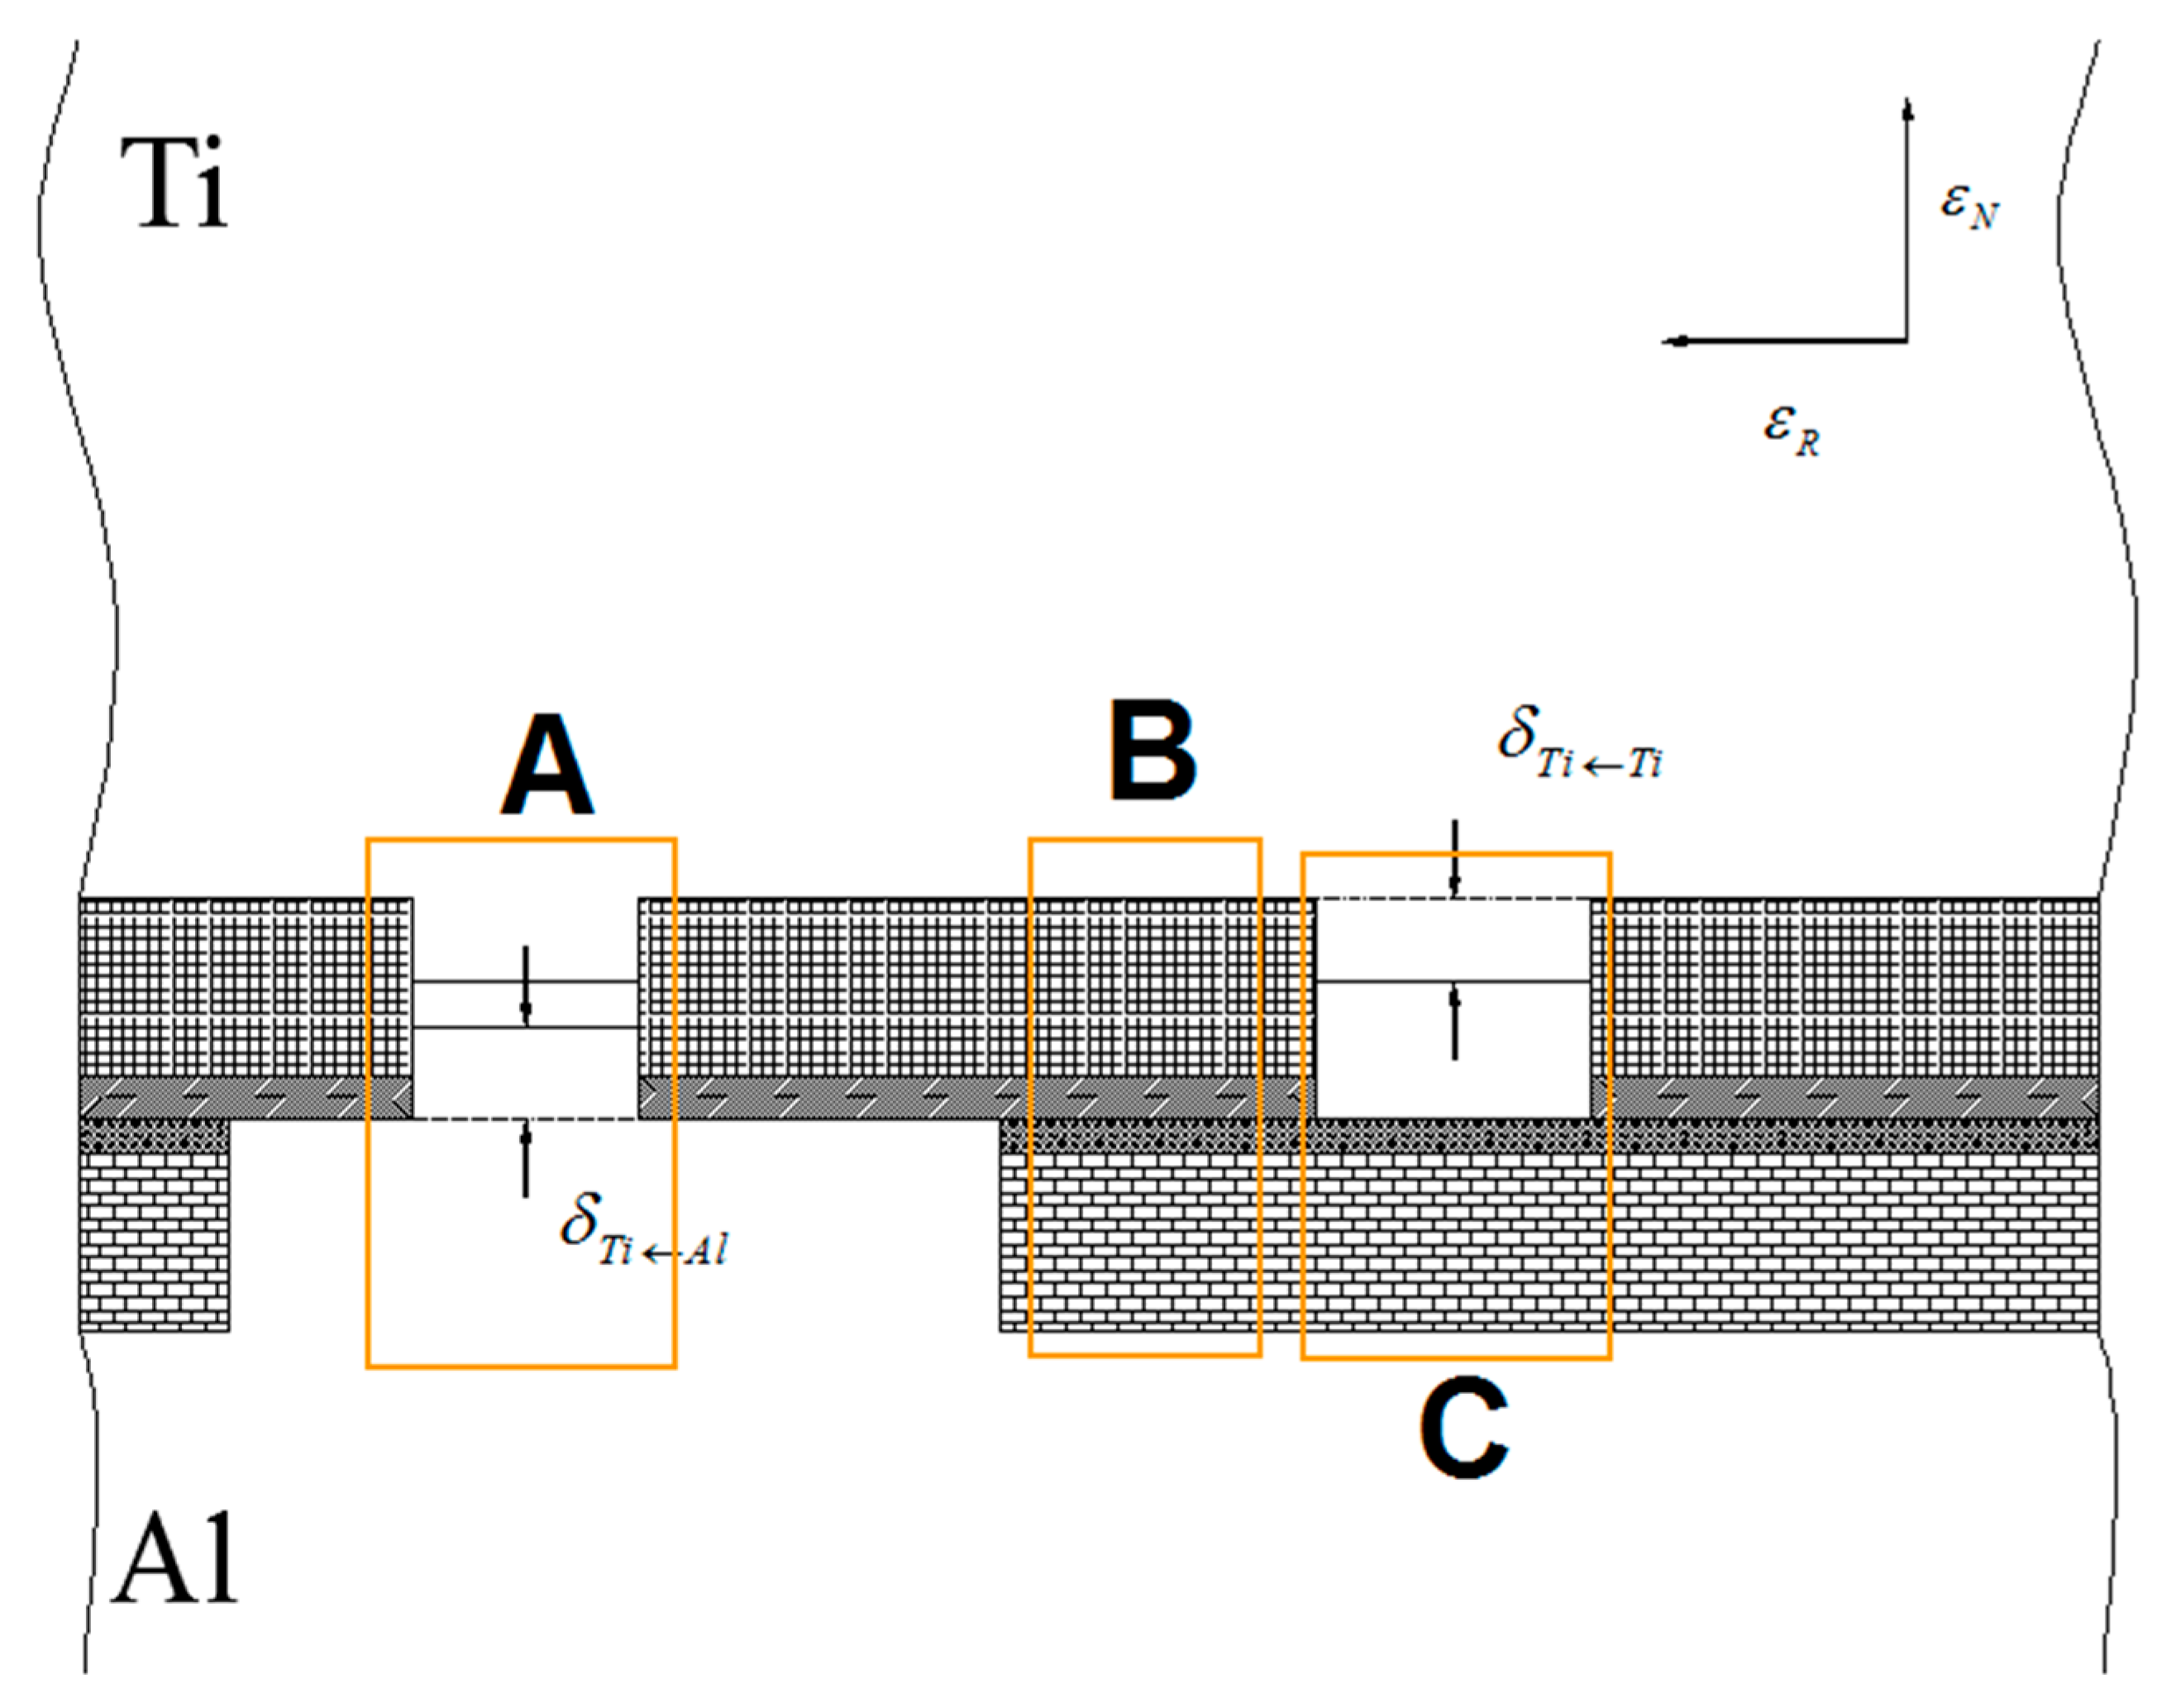
3.3. Change Rule of Each Layer of the Ti/Al Composite Sheet

The important index of deformation coordination of the Ti/Al composite sheet is the deformation of each layer. Due to the differences in mechanical properties and strain-hardening performances, each layer deforms differently. Figure 5 shows the deformation of each layer of the three types of Ti/Al composite sheets under different rolling reductions. As shown in Figure 5a–c, aluminium always deforms more than titanium, especially at a 35% reduction. In Figure 5d, the deformation ratio of titanium to aluminium ε Ti / ε Al increases with the increase in the total reduction, which is divided into two stages: 35–42% reduction and 42–50% reduction. The former stage significantly increases, the second stage tends to be stable, and specimens A and C have higher ε Ti / ε Al than specimen B. The change in ε Ti / ε Al is attributed to the strain hardening of the titanium and aluminium. As shown in Figure 6, when the total reduction is 35–42%, aluminium in the corresponding reduction range has a significantly weaker work-hardening capacity than titanium; when the total reduction is 42–50%, the work-hardening rate of the aluminium rapidly increases, while the work-hardening rate of the corresponding titanium greatly decreases. Therefore, the deformation of titanium is closer to that of aluminium in the second stage. ε Ti / ε Al is 98.1% for specimen C3; simultaneously, a higher initial strength of aluminium corresponds to greater ε Ti / ε Al and better coordination between the titanium and aluminium.

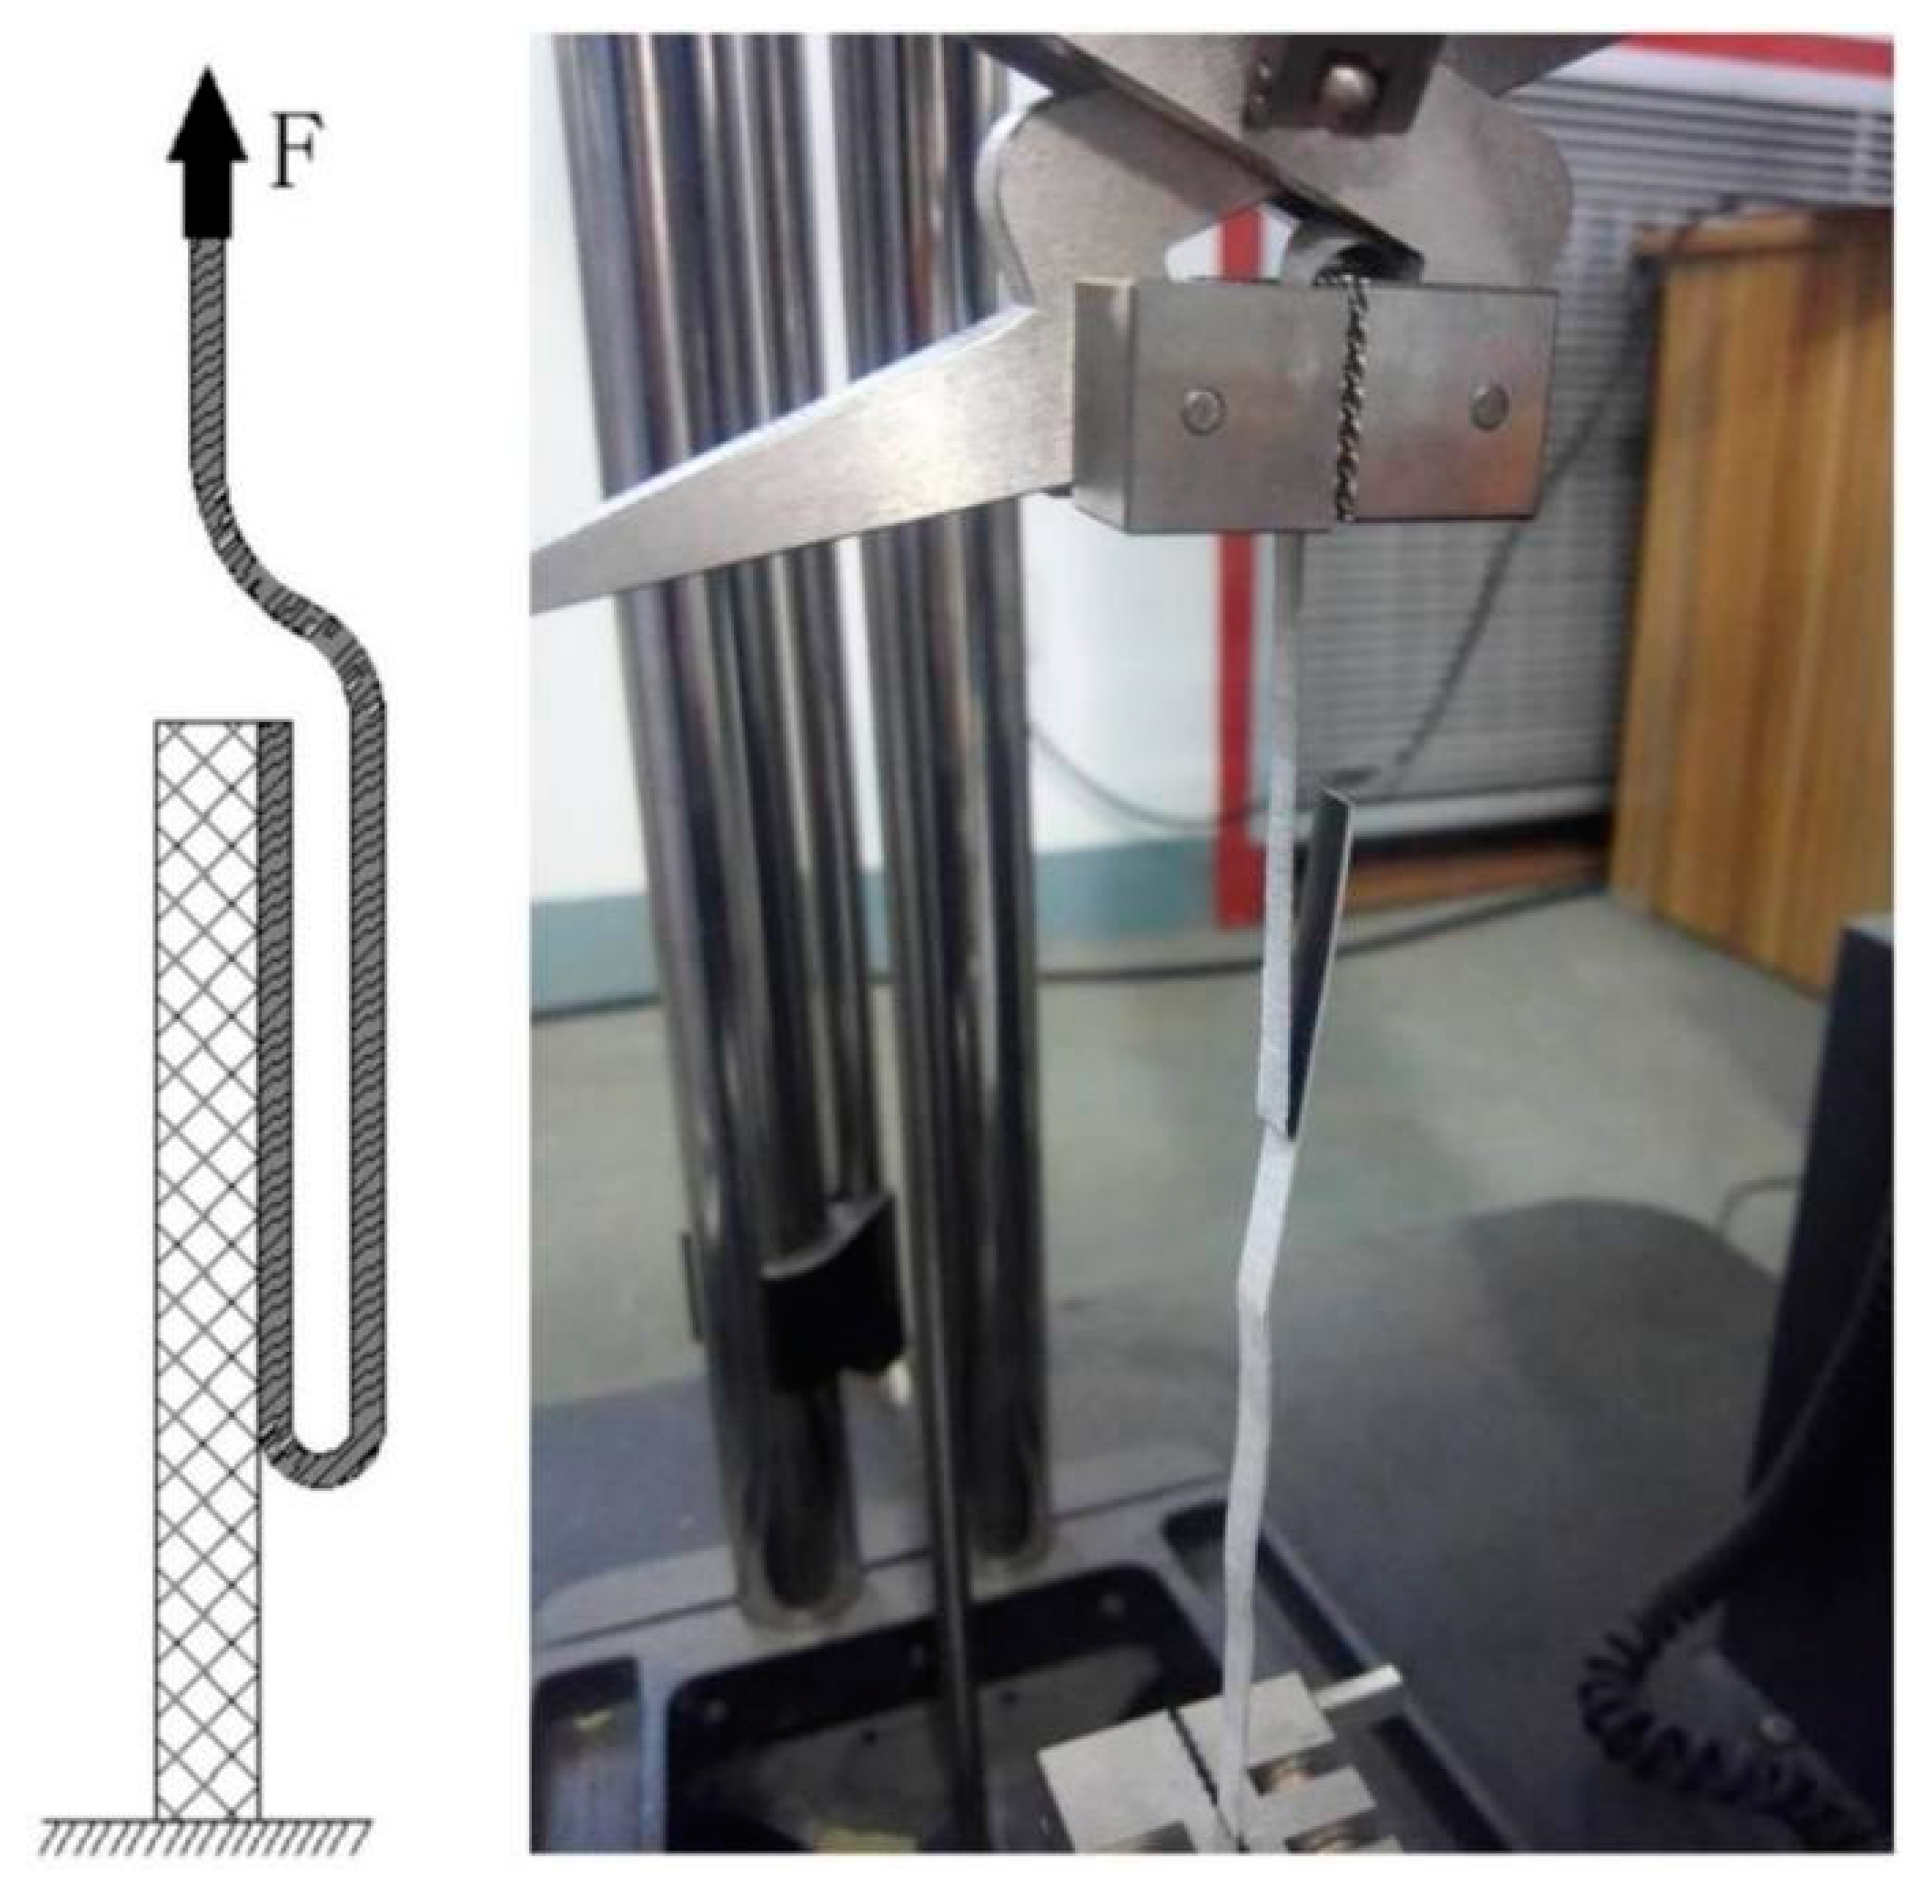
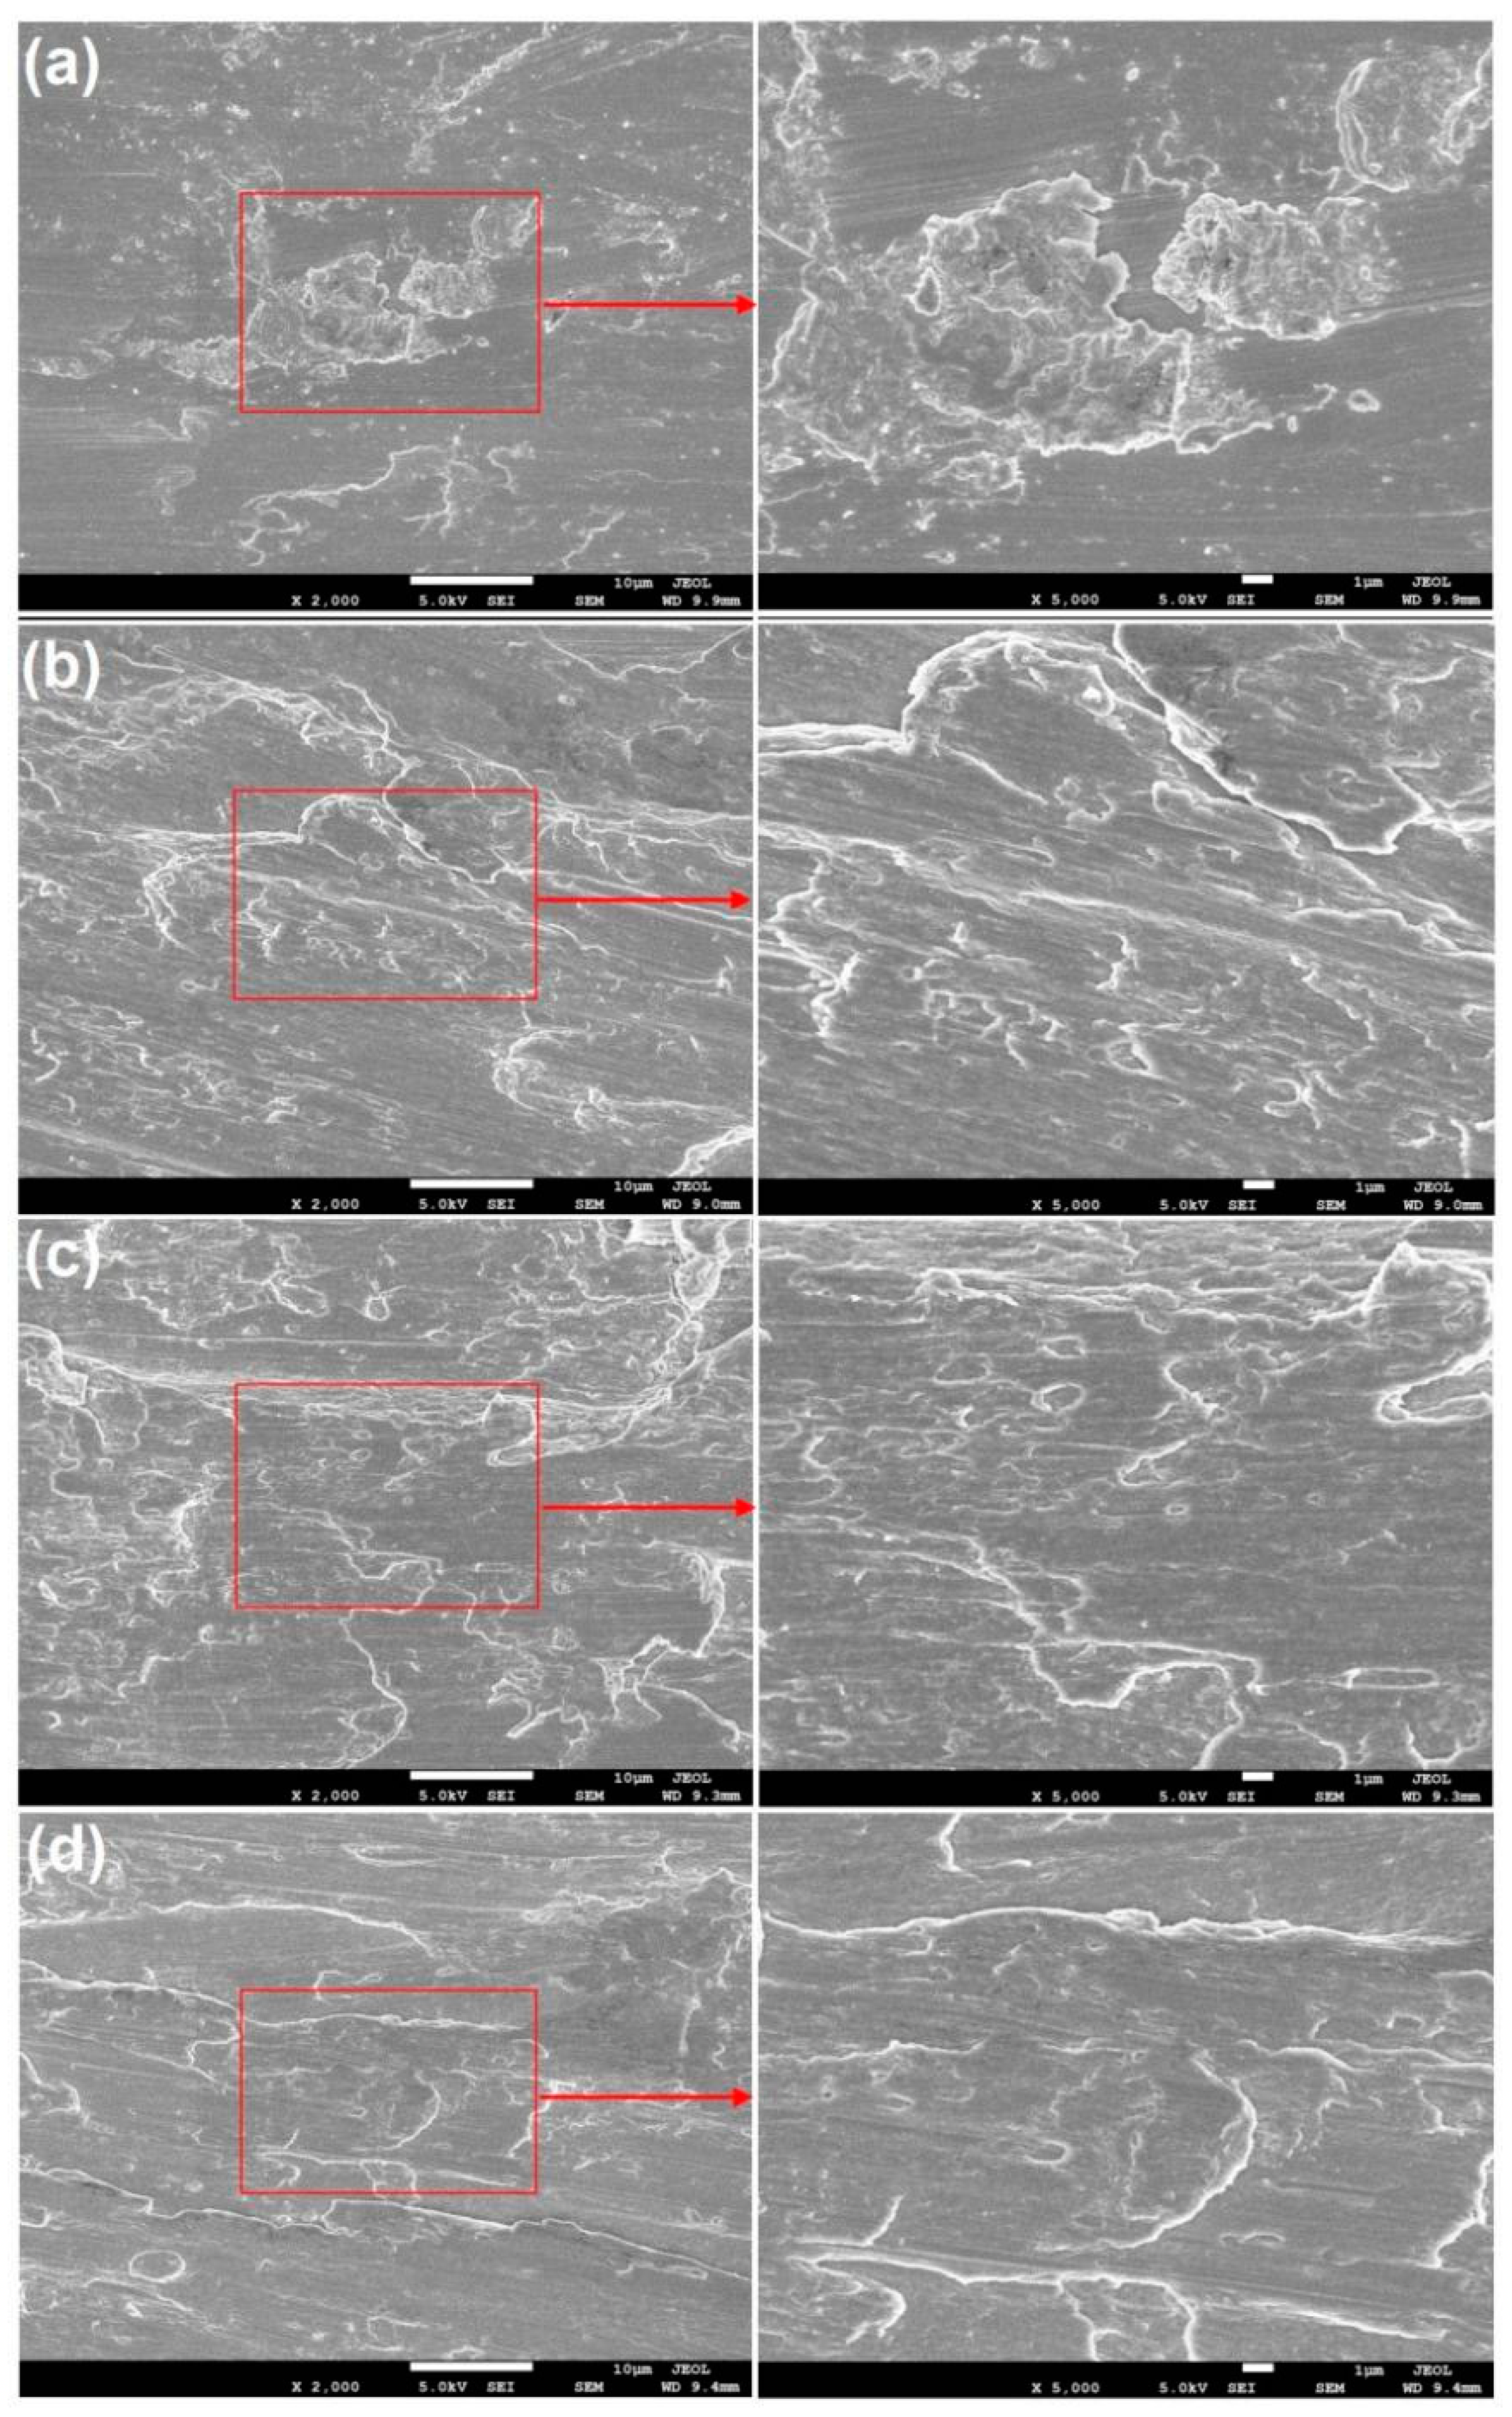
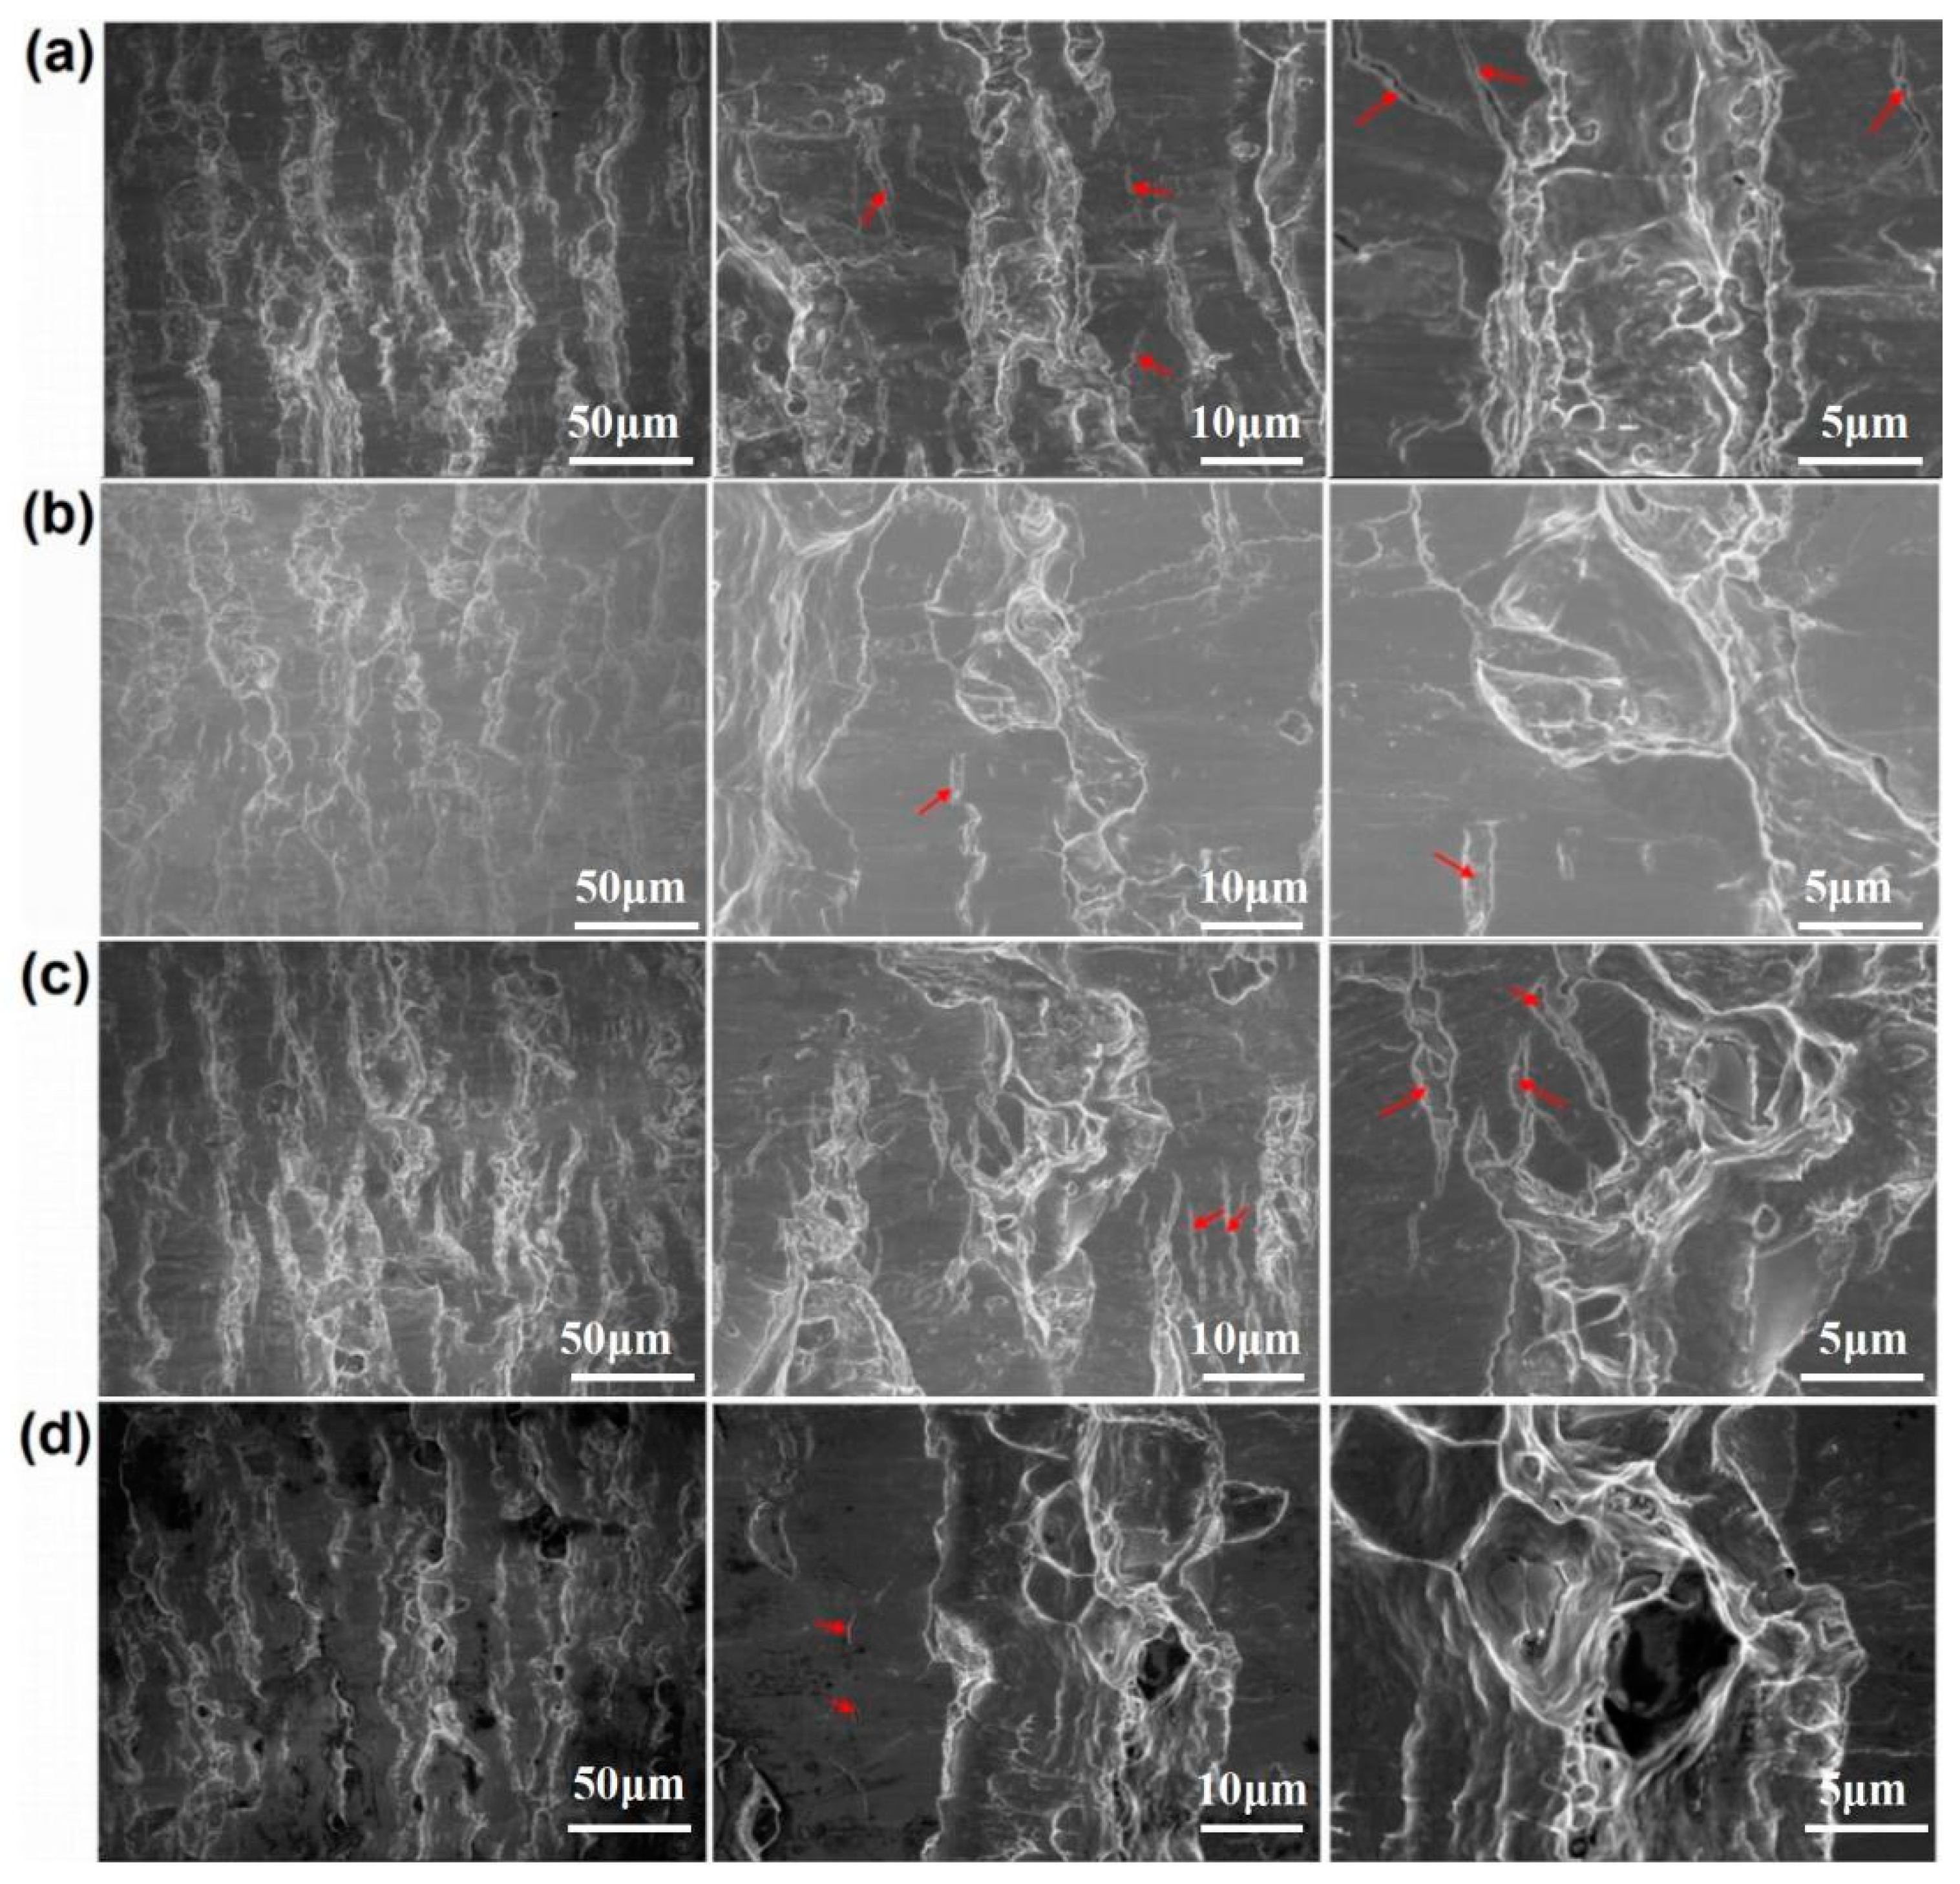
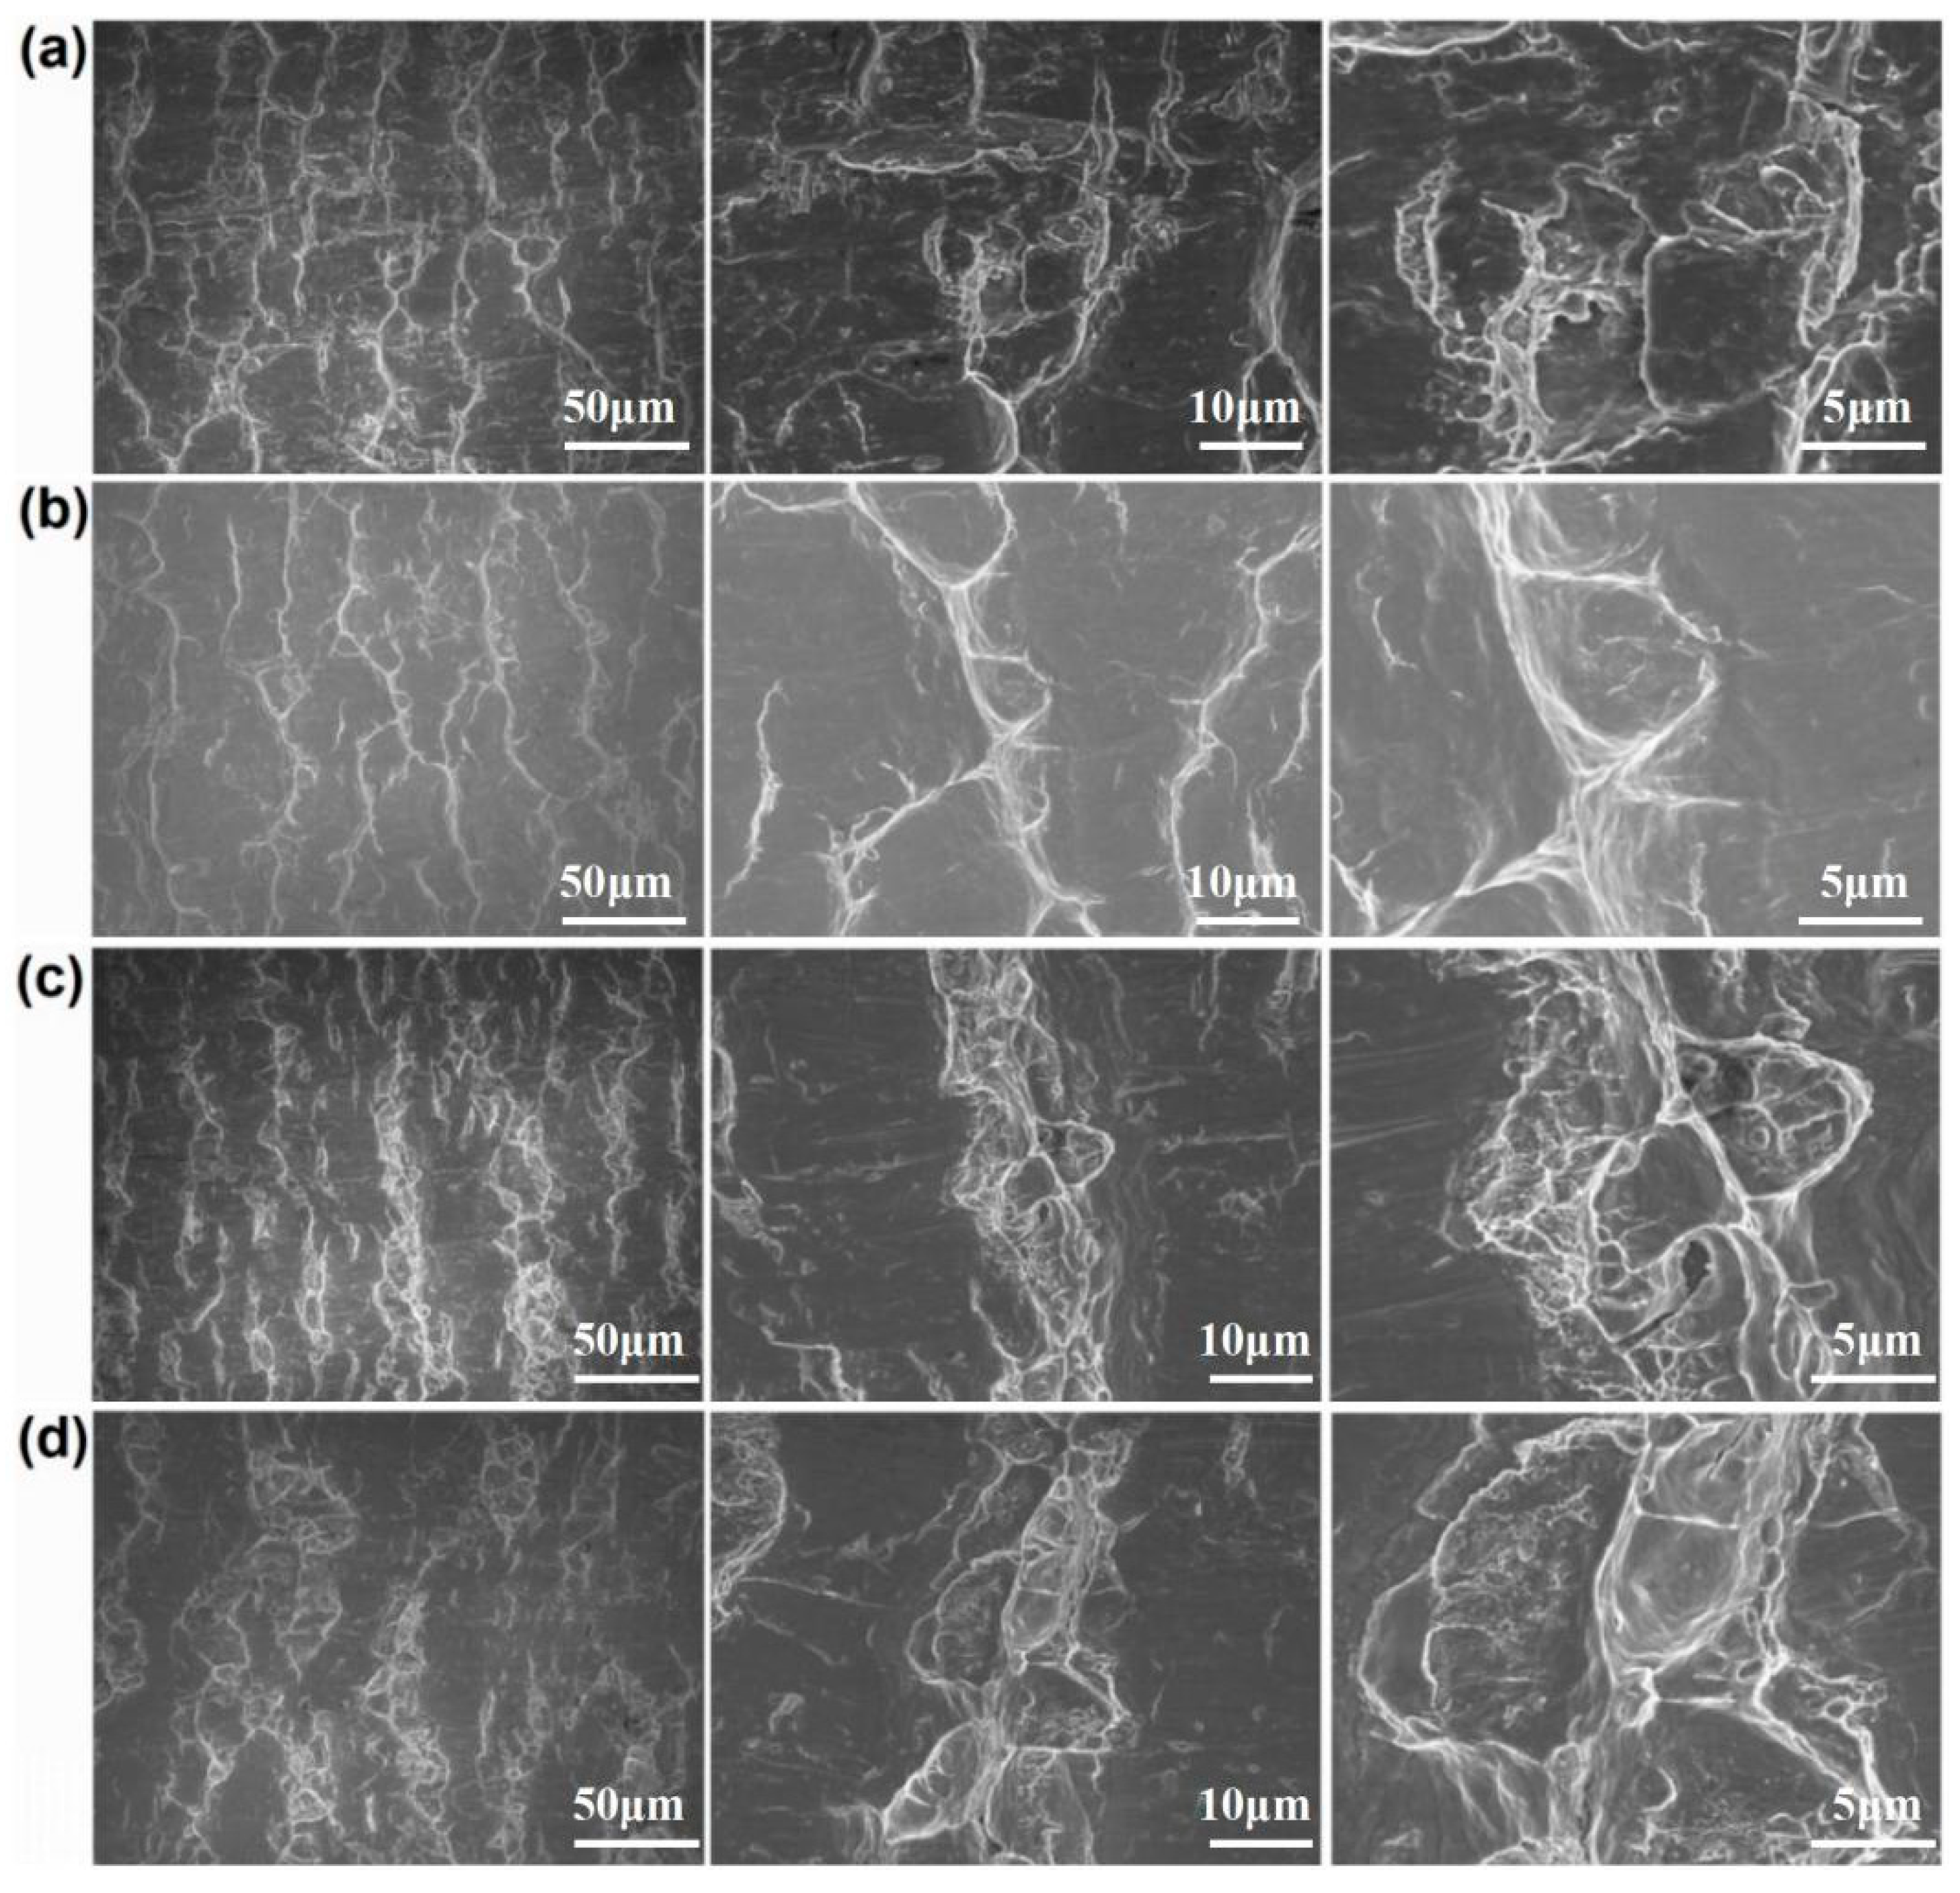
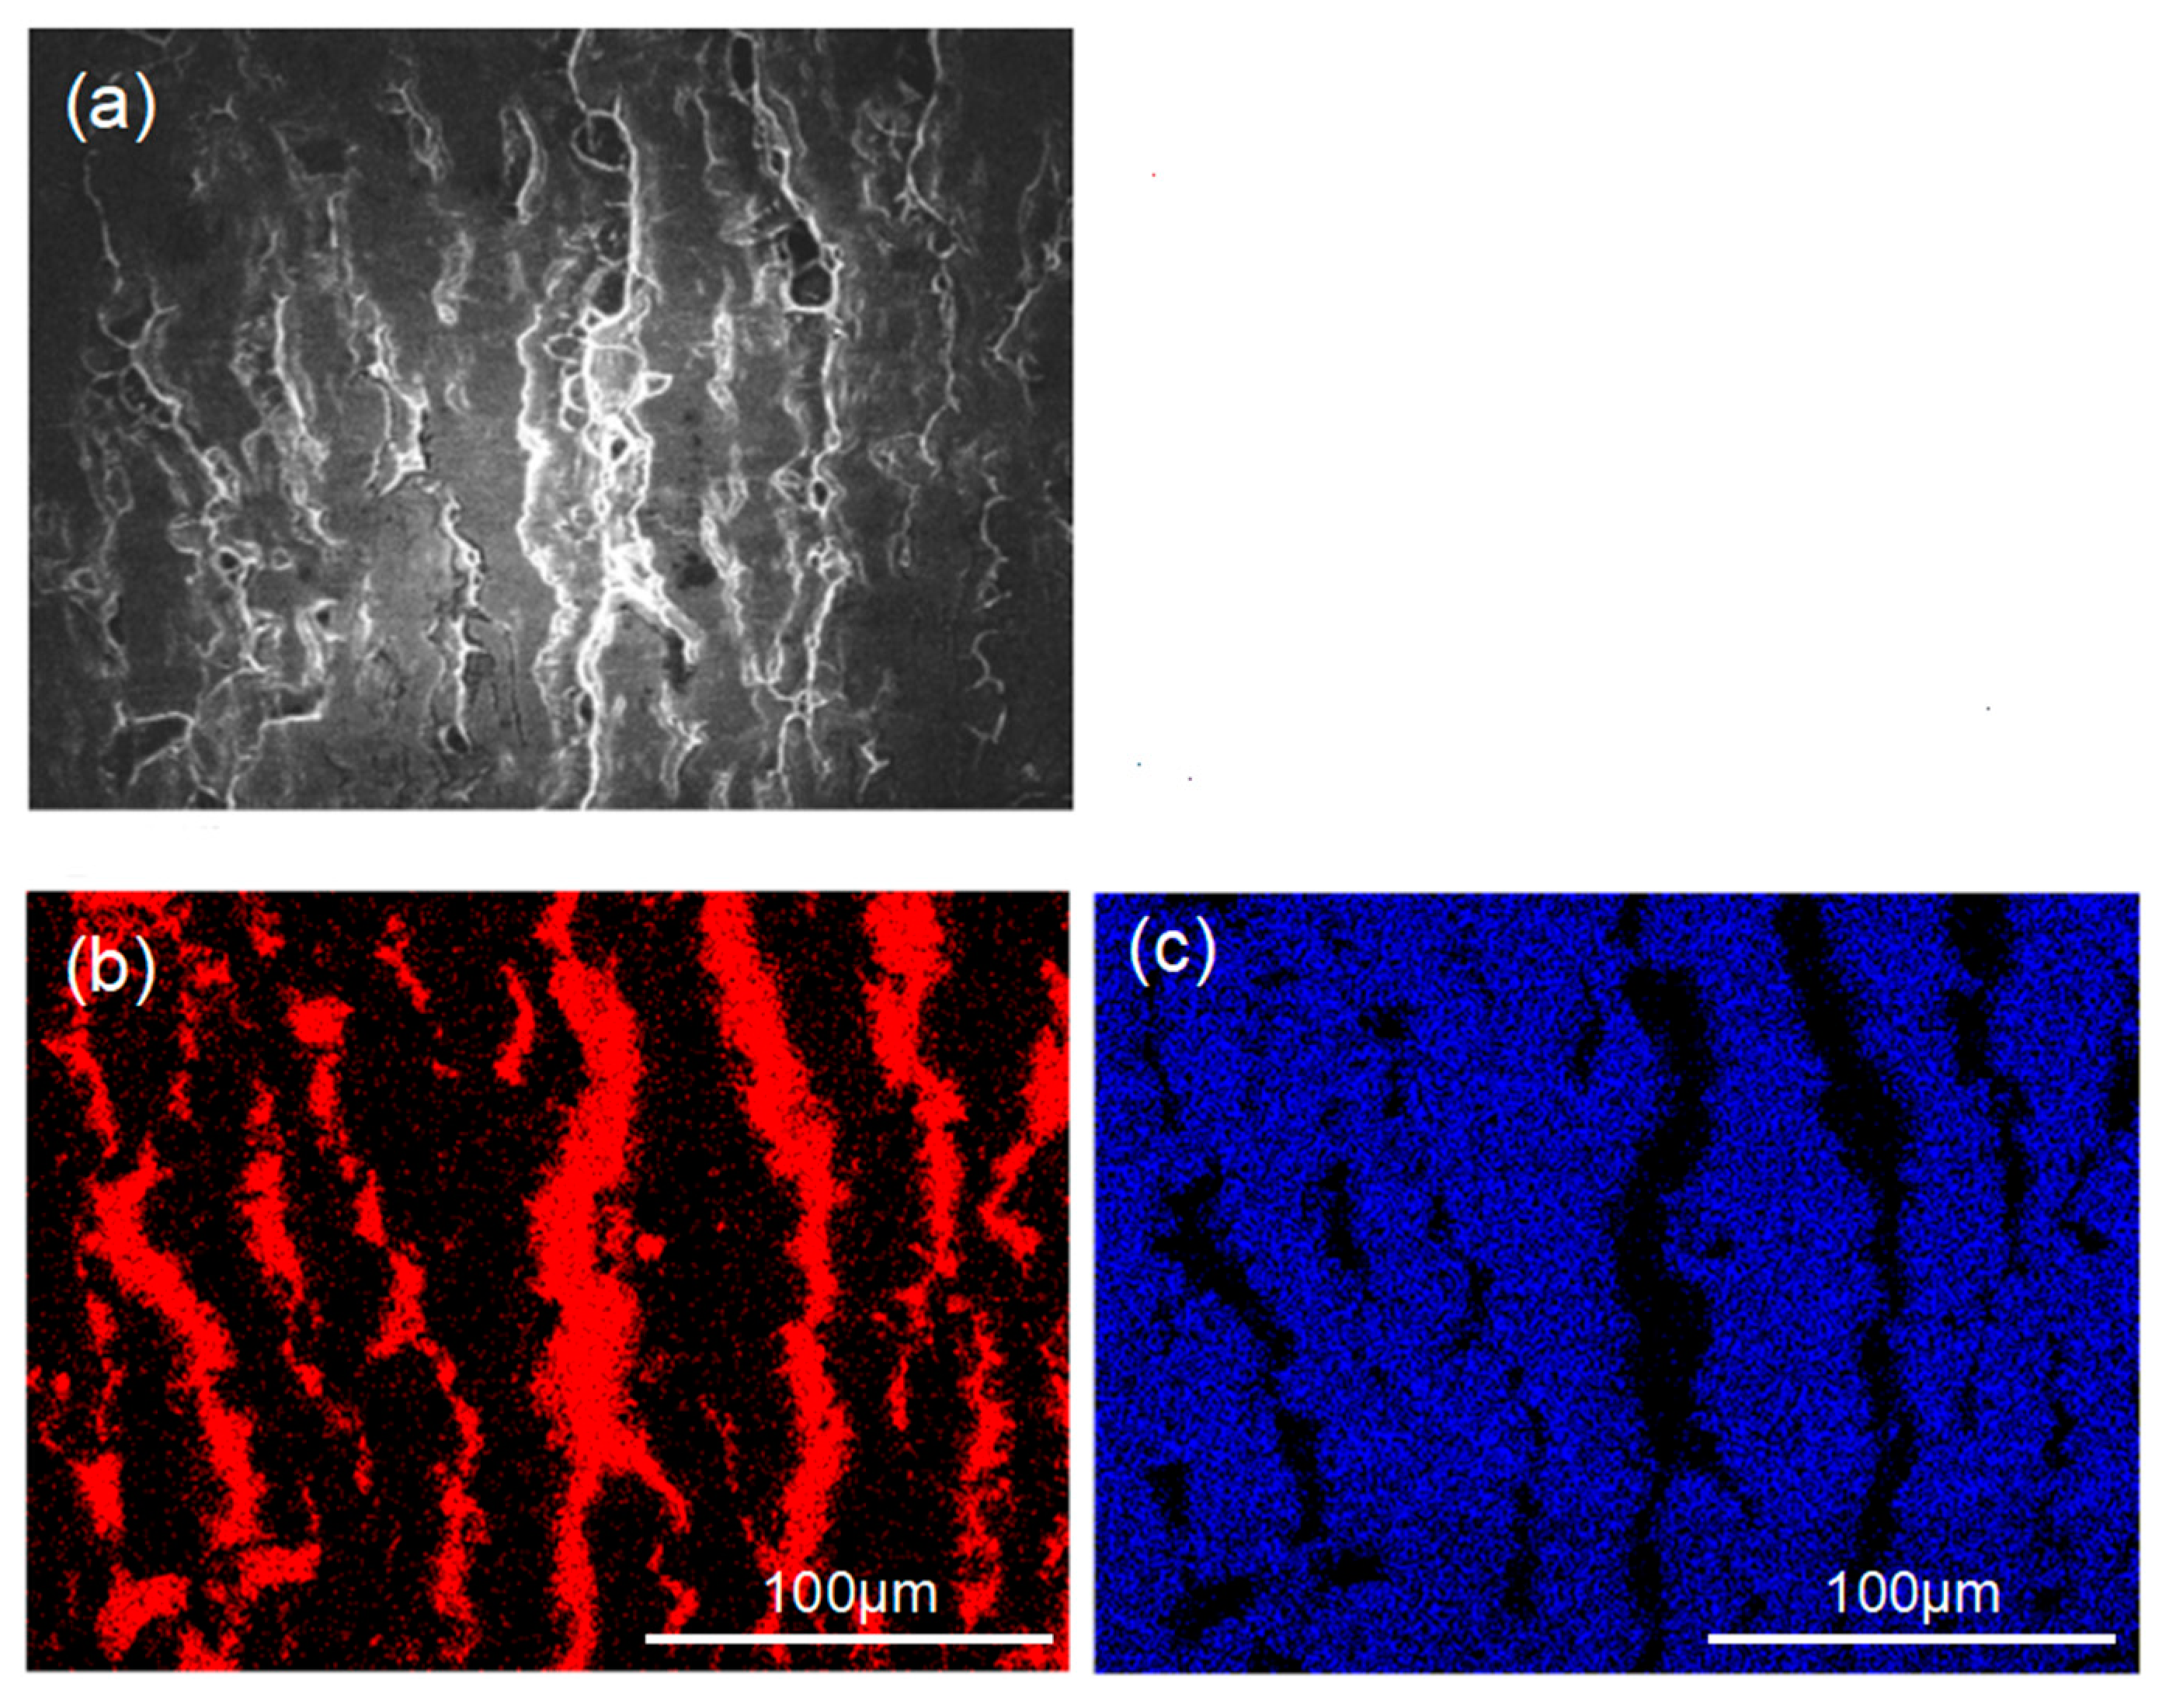
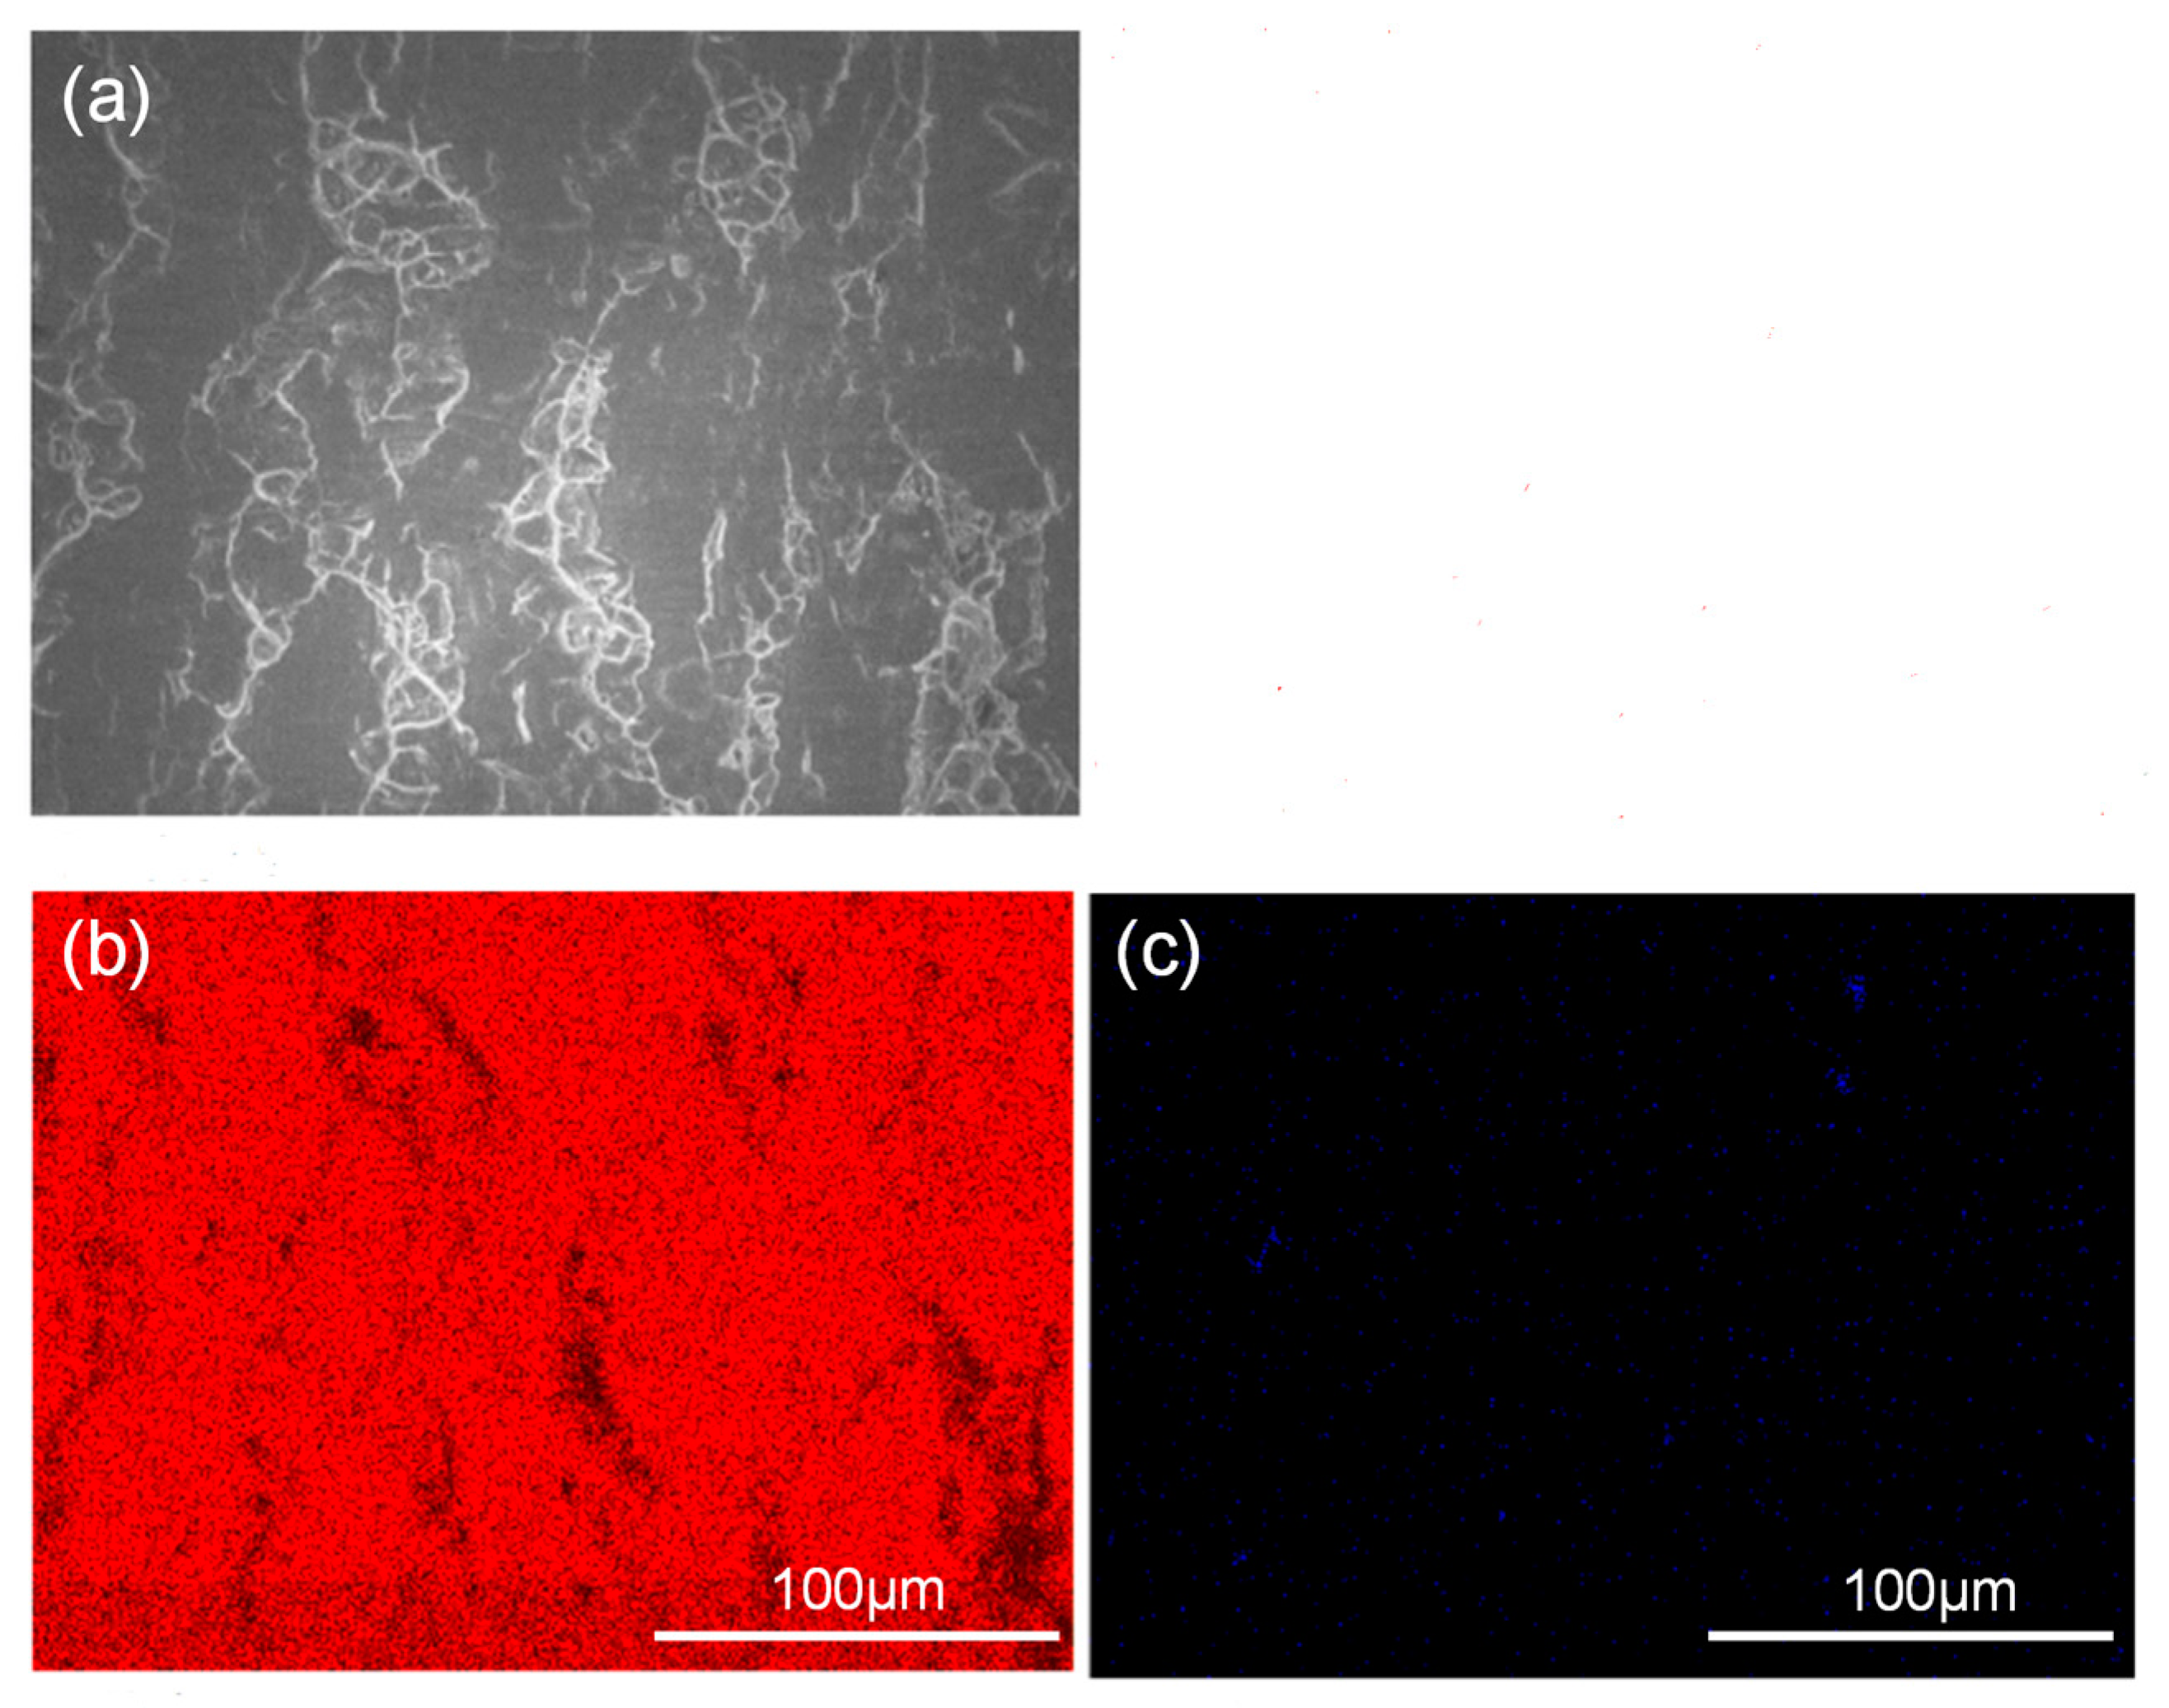
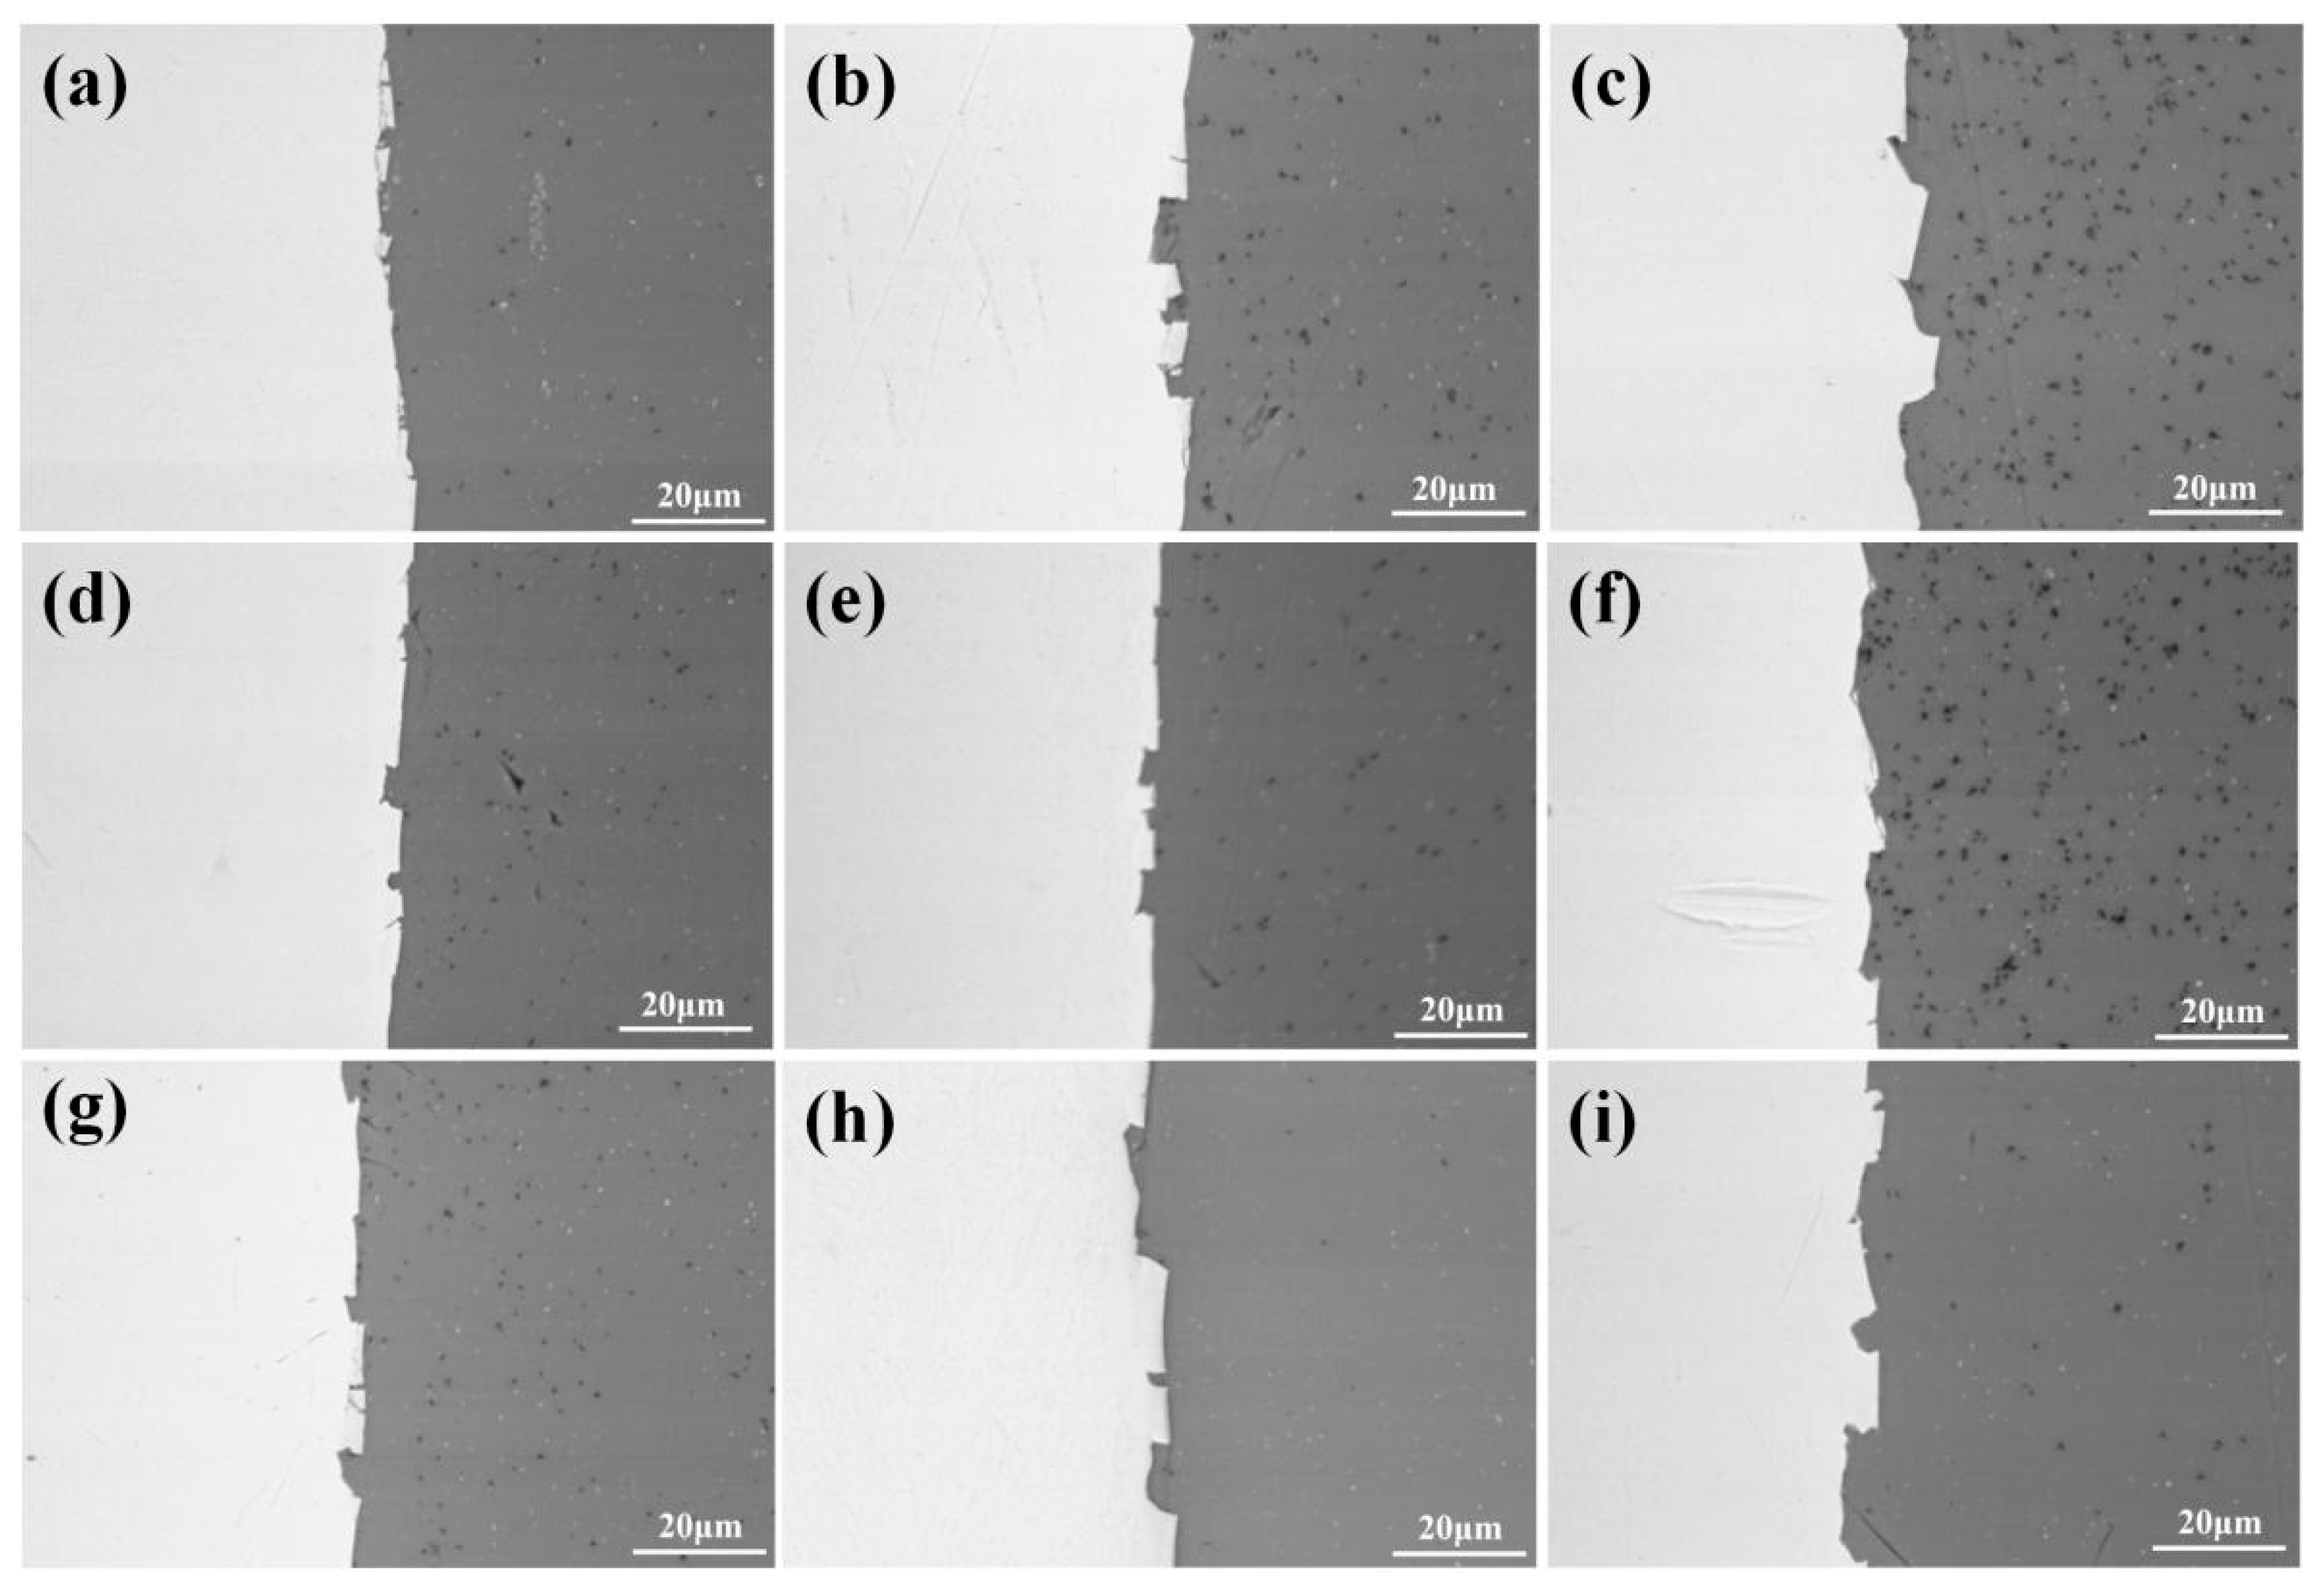
3.4. Peeling Surface Morphology of the Ti/Al Composite Sheet

Figure 7 and Figure 8 show the peeling surface morphology of specimens B2, B3, C2 and C3 on the titanium and aluminium sides, respectively. The peeling surface of both the titanium and aluminium sides is composed of two parts: a fresh metal bonding area and an unbound area. In the bonding area, plastic deformation occurs, which belongs to ductile fracture, while the unbound area is relatively flat without plastic deformation, which belongs to brittle fracture. The bonding area is formed by the fresh metal aluminium extruded from the aluminium side embedded into the crack of the corresponding titanium side. In the peeling process, the aluminium that forms the bonding area in the crack undergoes tensile shear deformation, and fracture occurs in the aluminium. Many cracks are observed on the peeling surface of the titanium side. These cracks are in the unbound area, which indicates that the fresh titanium in these cracks does not form metal bonding with the fresh aluminium extruded from the opposite surface. There is no obvious crack in the unbound area of the peeling surface on the aluminium side, which indicates that the underlying fresh metal aluminium has been extruded through cracks at a greater reduction value than the critical reduction. With the increase in reduction, the bonding area expands. Regardless of the reduction, the peeling surface has a common feature: there is aluminium residue on the titanium side, but there is almost no titanium residue on the aluminium side. Figure 9 and Figure 10 show the SEM peeling surface element distribution on the titanium and aluminium sides of specimen C3, respectively. Almost no titanium is detected on the aluminium side.
Figure 11 shows the area fraction of aluminium on the titanium side of the peeling surface of specimens A1, A2, A3, B1, B2, B3, C1, C2 and C3. For the same strength of aluminium, a greater reduction corresponds to more aluminium remaining on the titanium side; for the same reduction, less strong aluminium remains on the titanium side. Miyajima et al. [6] noted that in the peeling test, the peeling force mainly comes from the tensile shear deformation of the aluminium in the bonding area. Therefore, it is necessary to correct the peel strength and introduce the residual fraction of aluminium on the titanium side ( λ ) to obtain the corrected peel strength, τ x = τ y / λ ( τ y is the peel strength uncorrected), as shown in Figure 12.

3.5. Characteristics of the Bonding Interface

Figure 13 shows the optical micrographs of specimens A1, A2, A3, B1, B2, B3, C1, C2 and C3. At a 35% reduction, we observed that a small amount of fresh aluminium was extruded into the titanium side through cracks under the action of rolling pressure. At this time, the crack gap is approximately several microns, and the interface is flat. With the increase in reduction, cracks gradually increase, so more fresh aluminium flows to the cracks. Below a 42% reduction, the crack gap does not significantly increase, but at a 50% reduction, the crack gap enlarges with an average of 10~40 μm, the interface appears to be a zigzag pattern, and a shear deformation zone at 45° to the interface is formed near the interface on the titanium side. We can more carefully observe the bonding lock with SEM. In Figure 14, the covering layer on the titanium surface at the contact interface of specimen B1 is broken because it cannot bear the positive tension in the roll gap and falls off from the titanium substrate under the action of shear force. The fracture of the covering layer is clearly visible, and the locking structure is observed. The locking at the interface of specimen B3 increases to form a tight mechanical engagement state. The interfaces of specimens A1, A2 and A3 and C1, C2 and C3 have similar characteristics to those of specimens B1, B2 and B3.

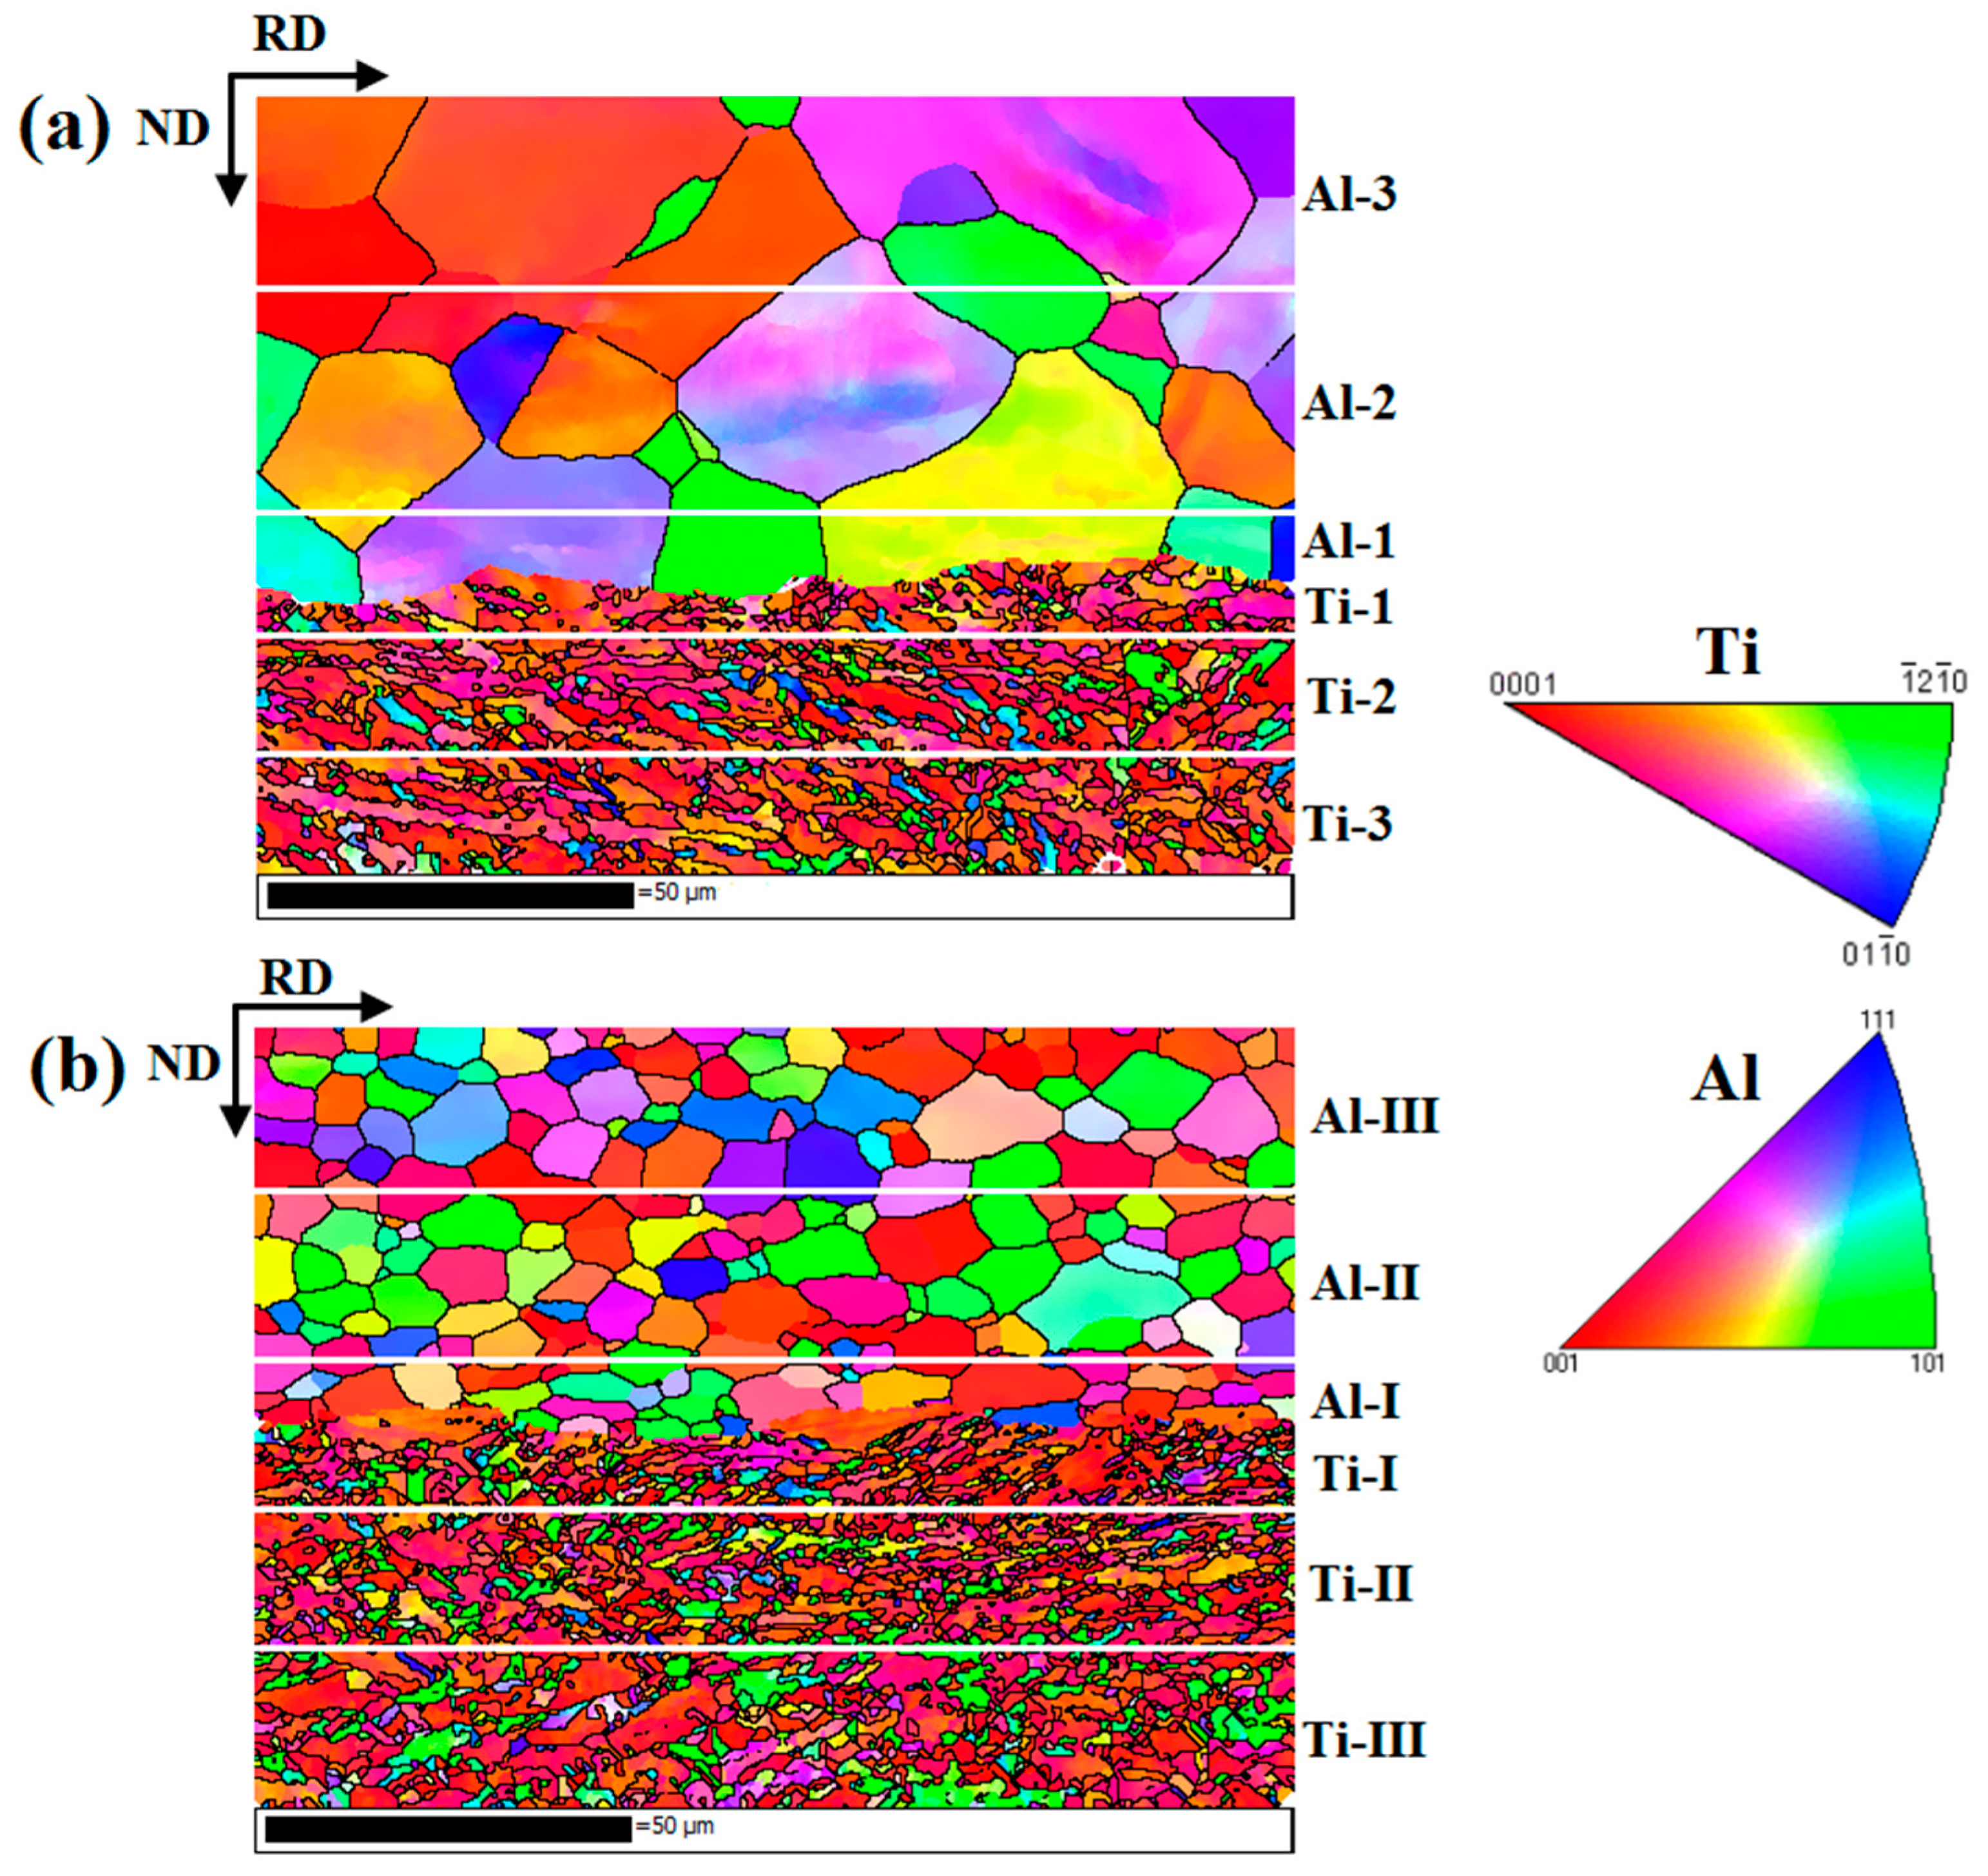
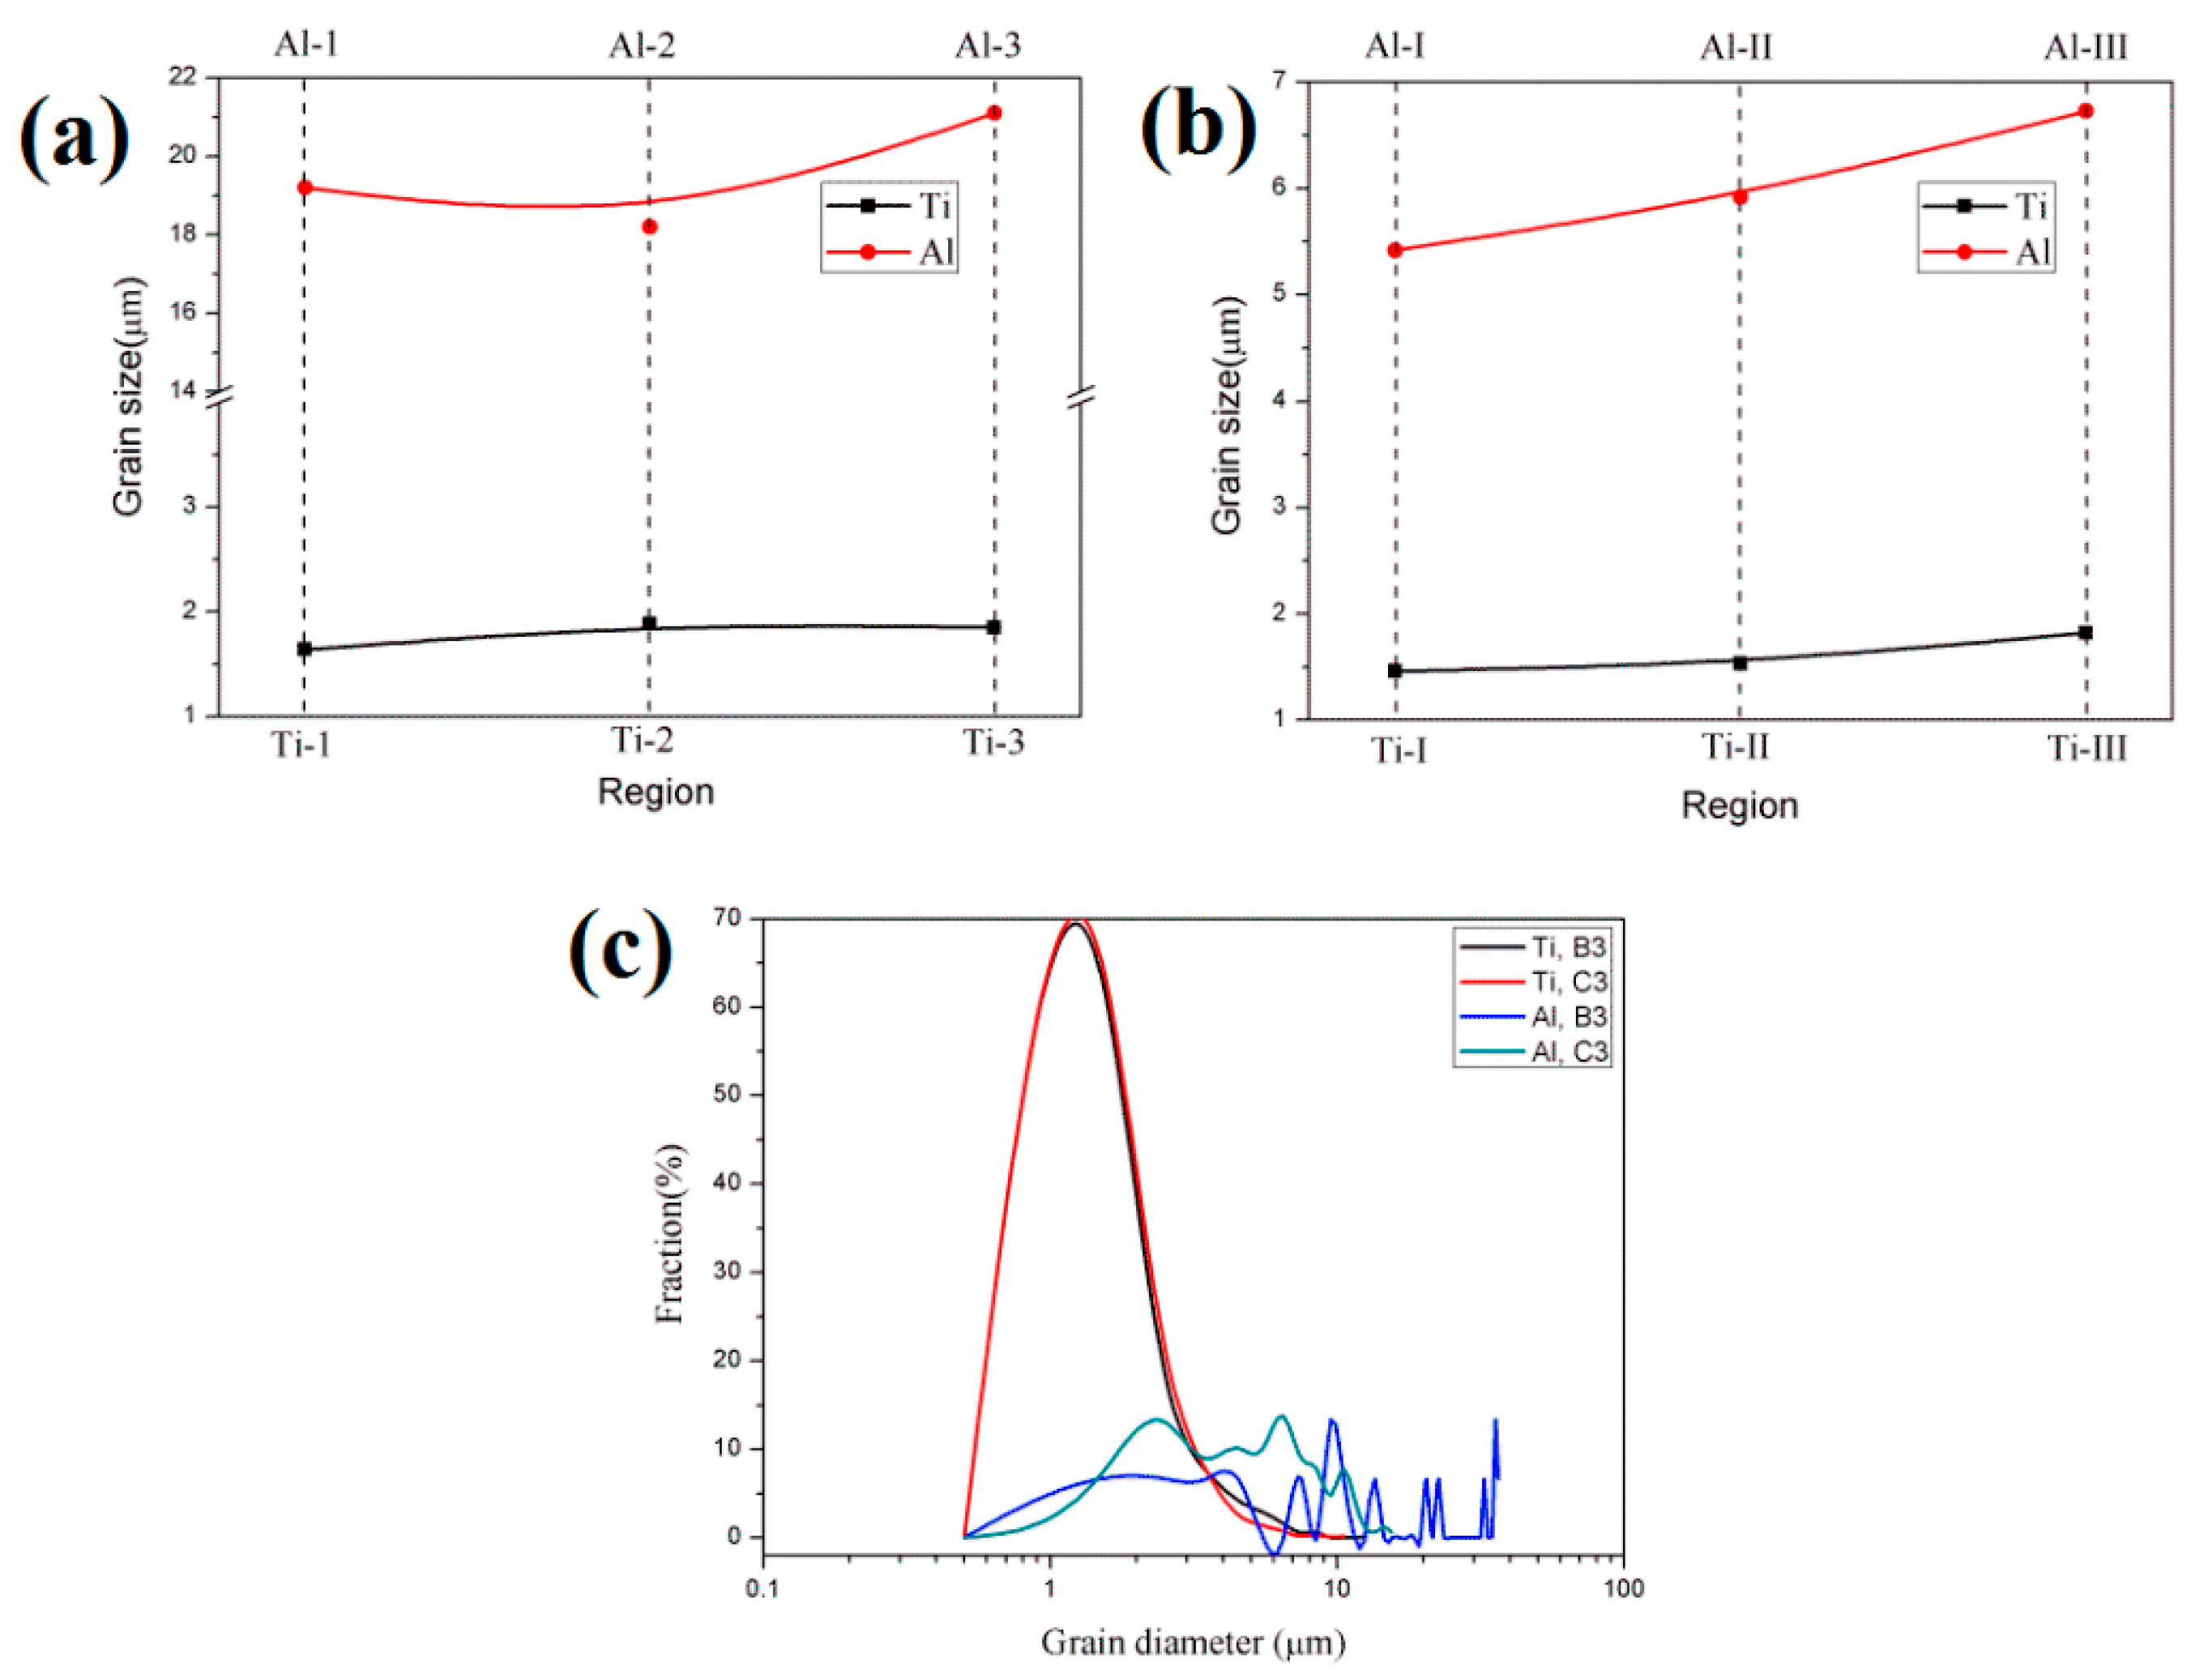
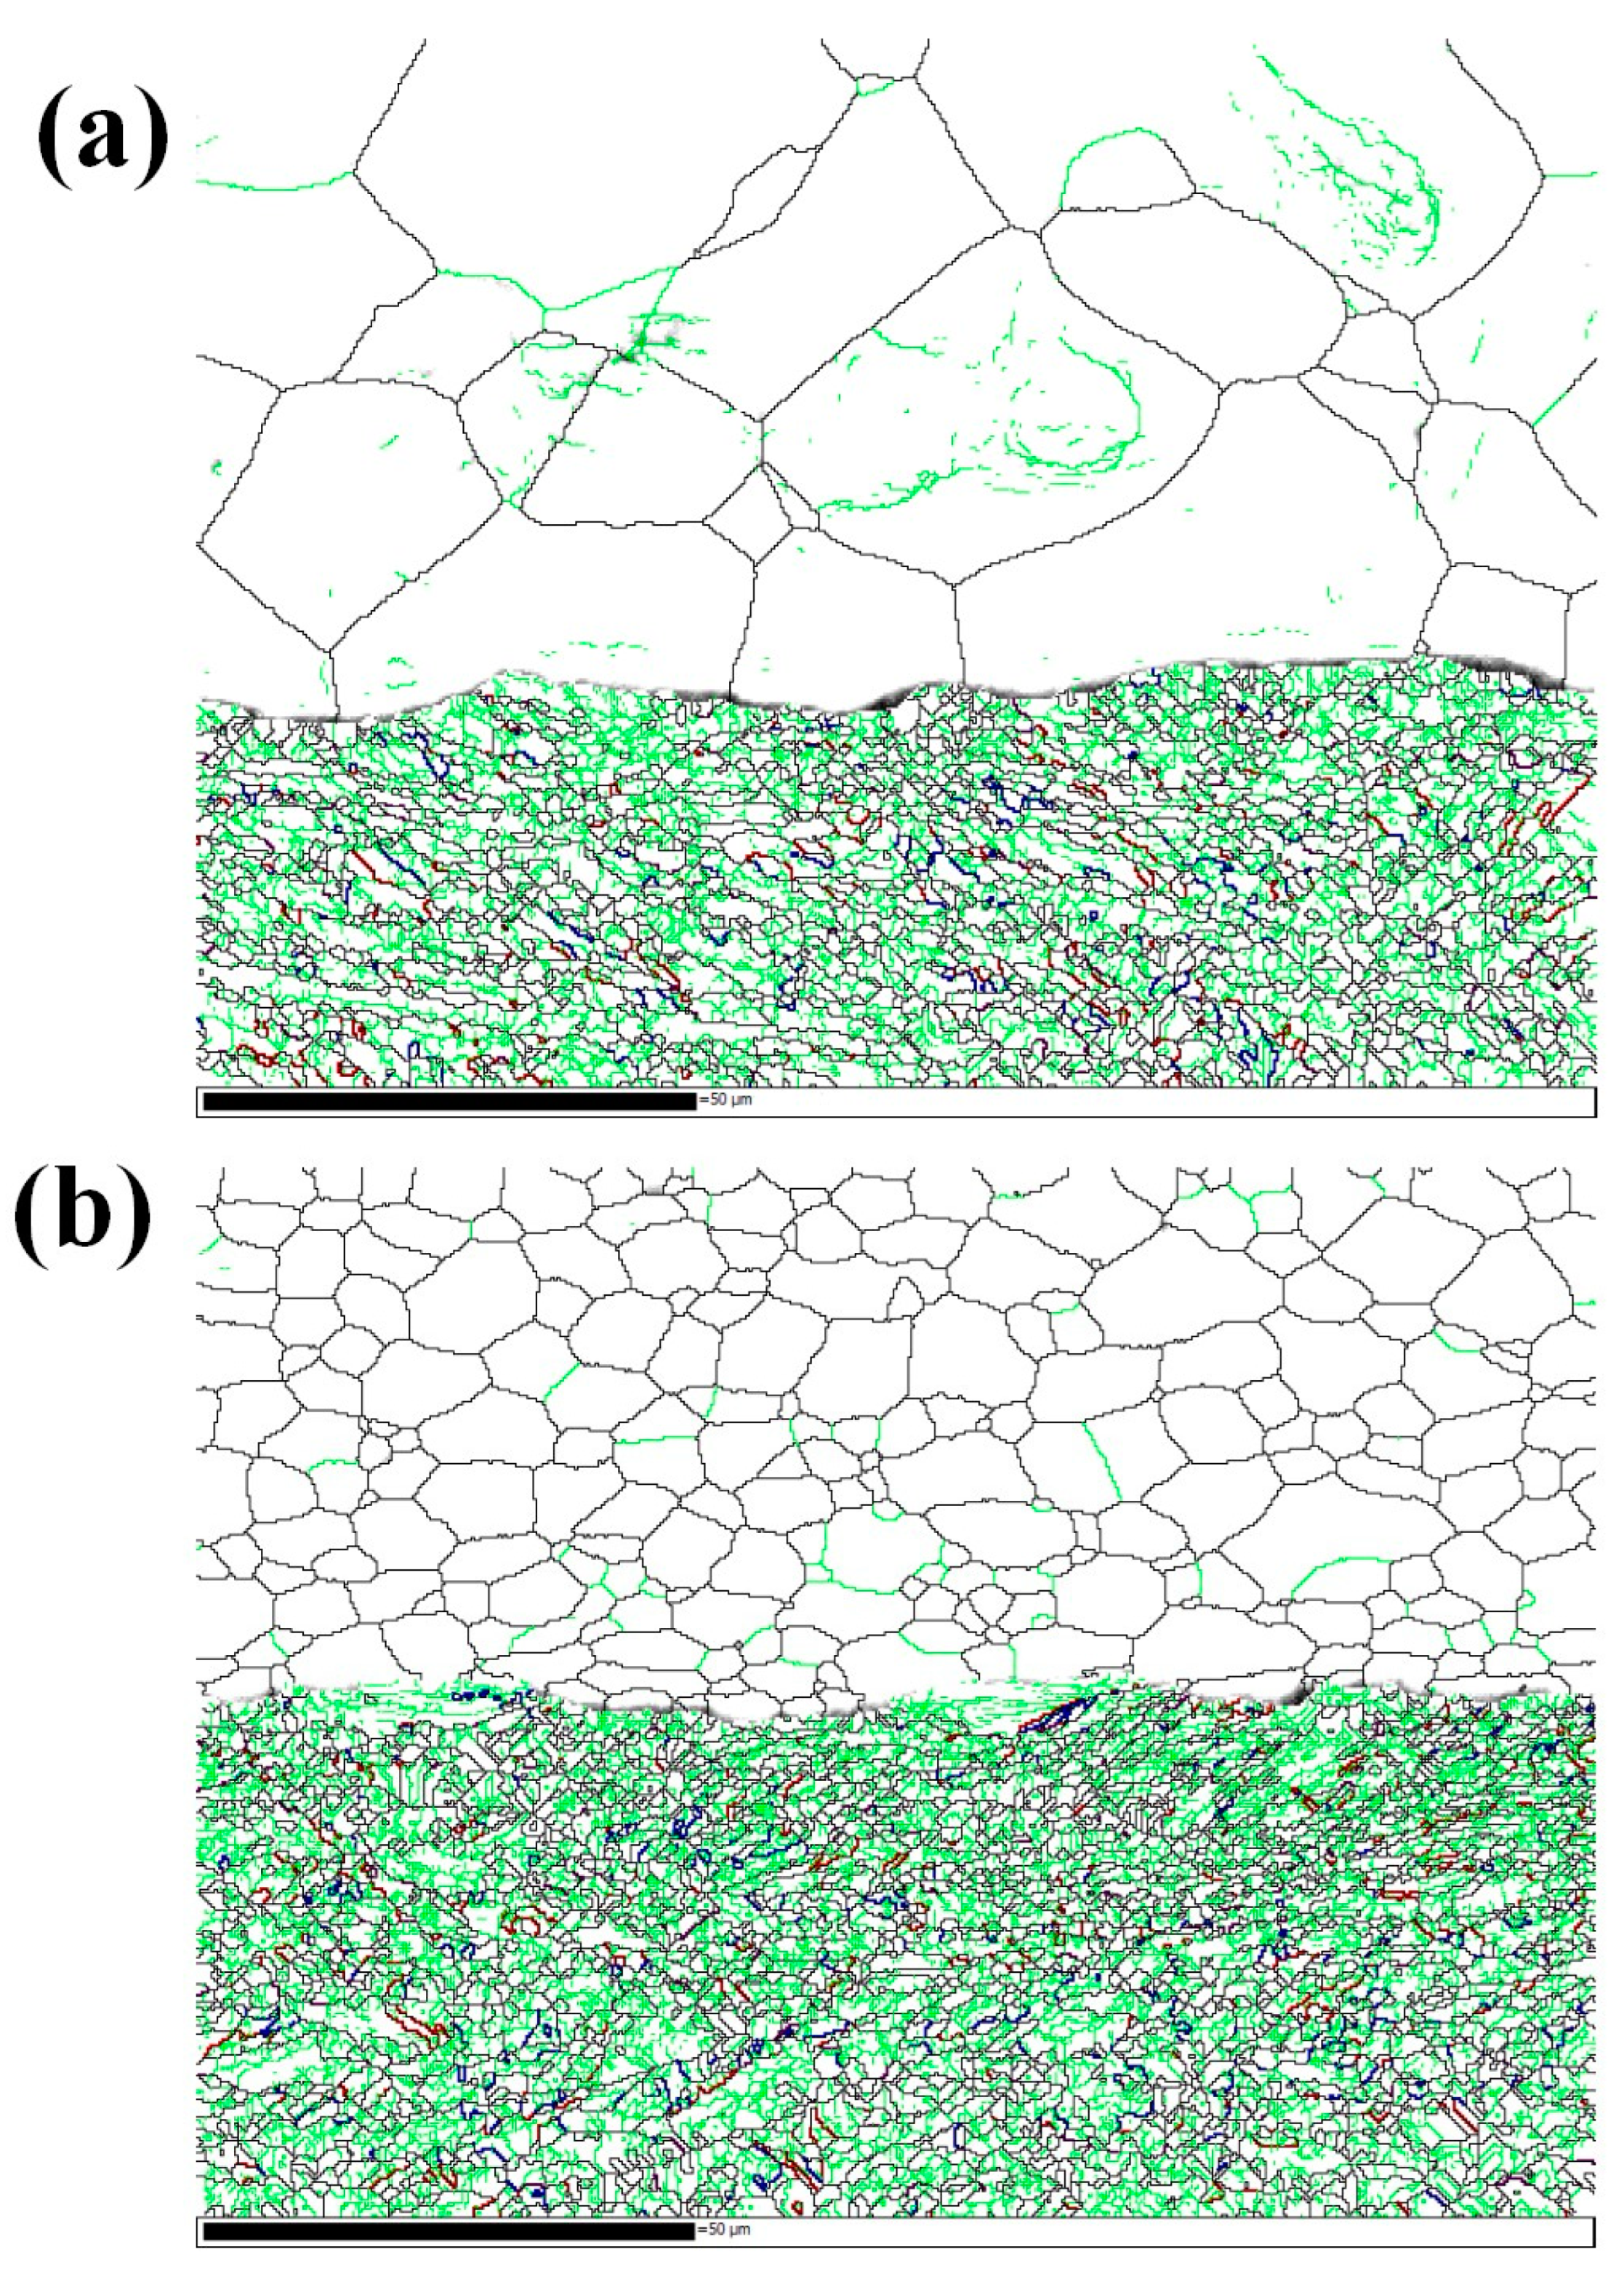
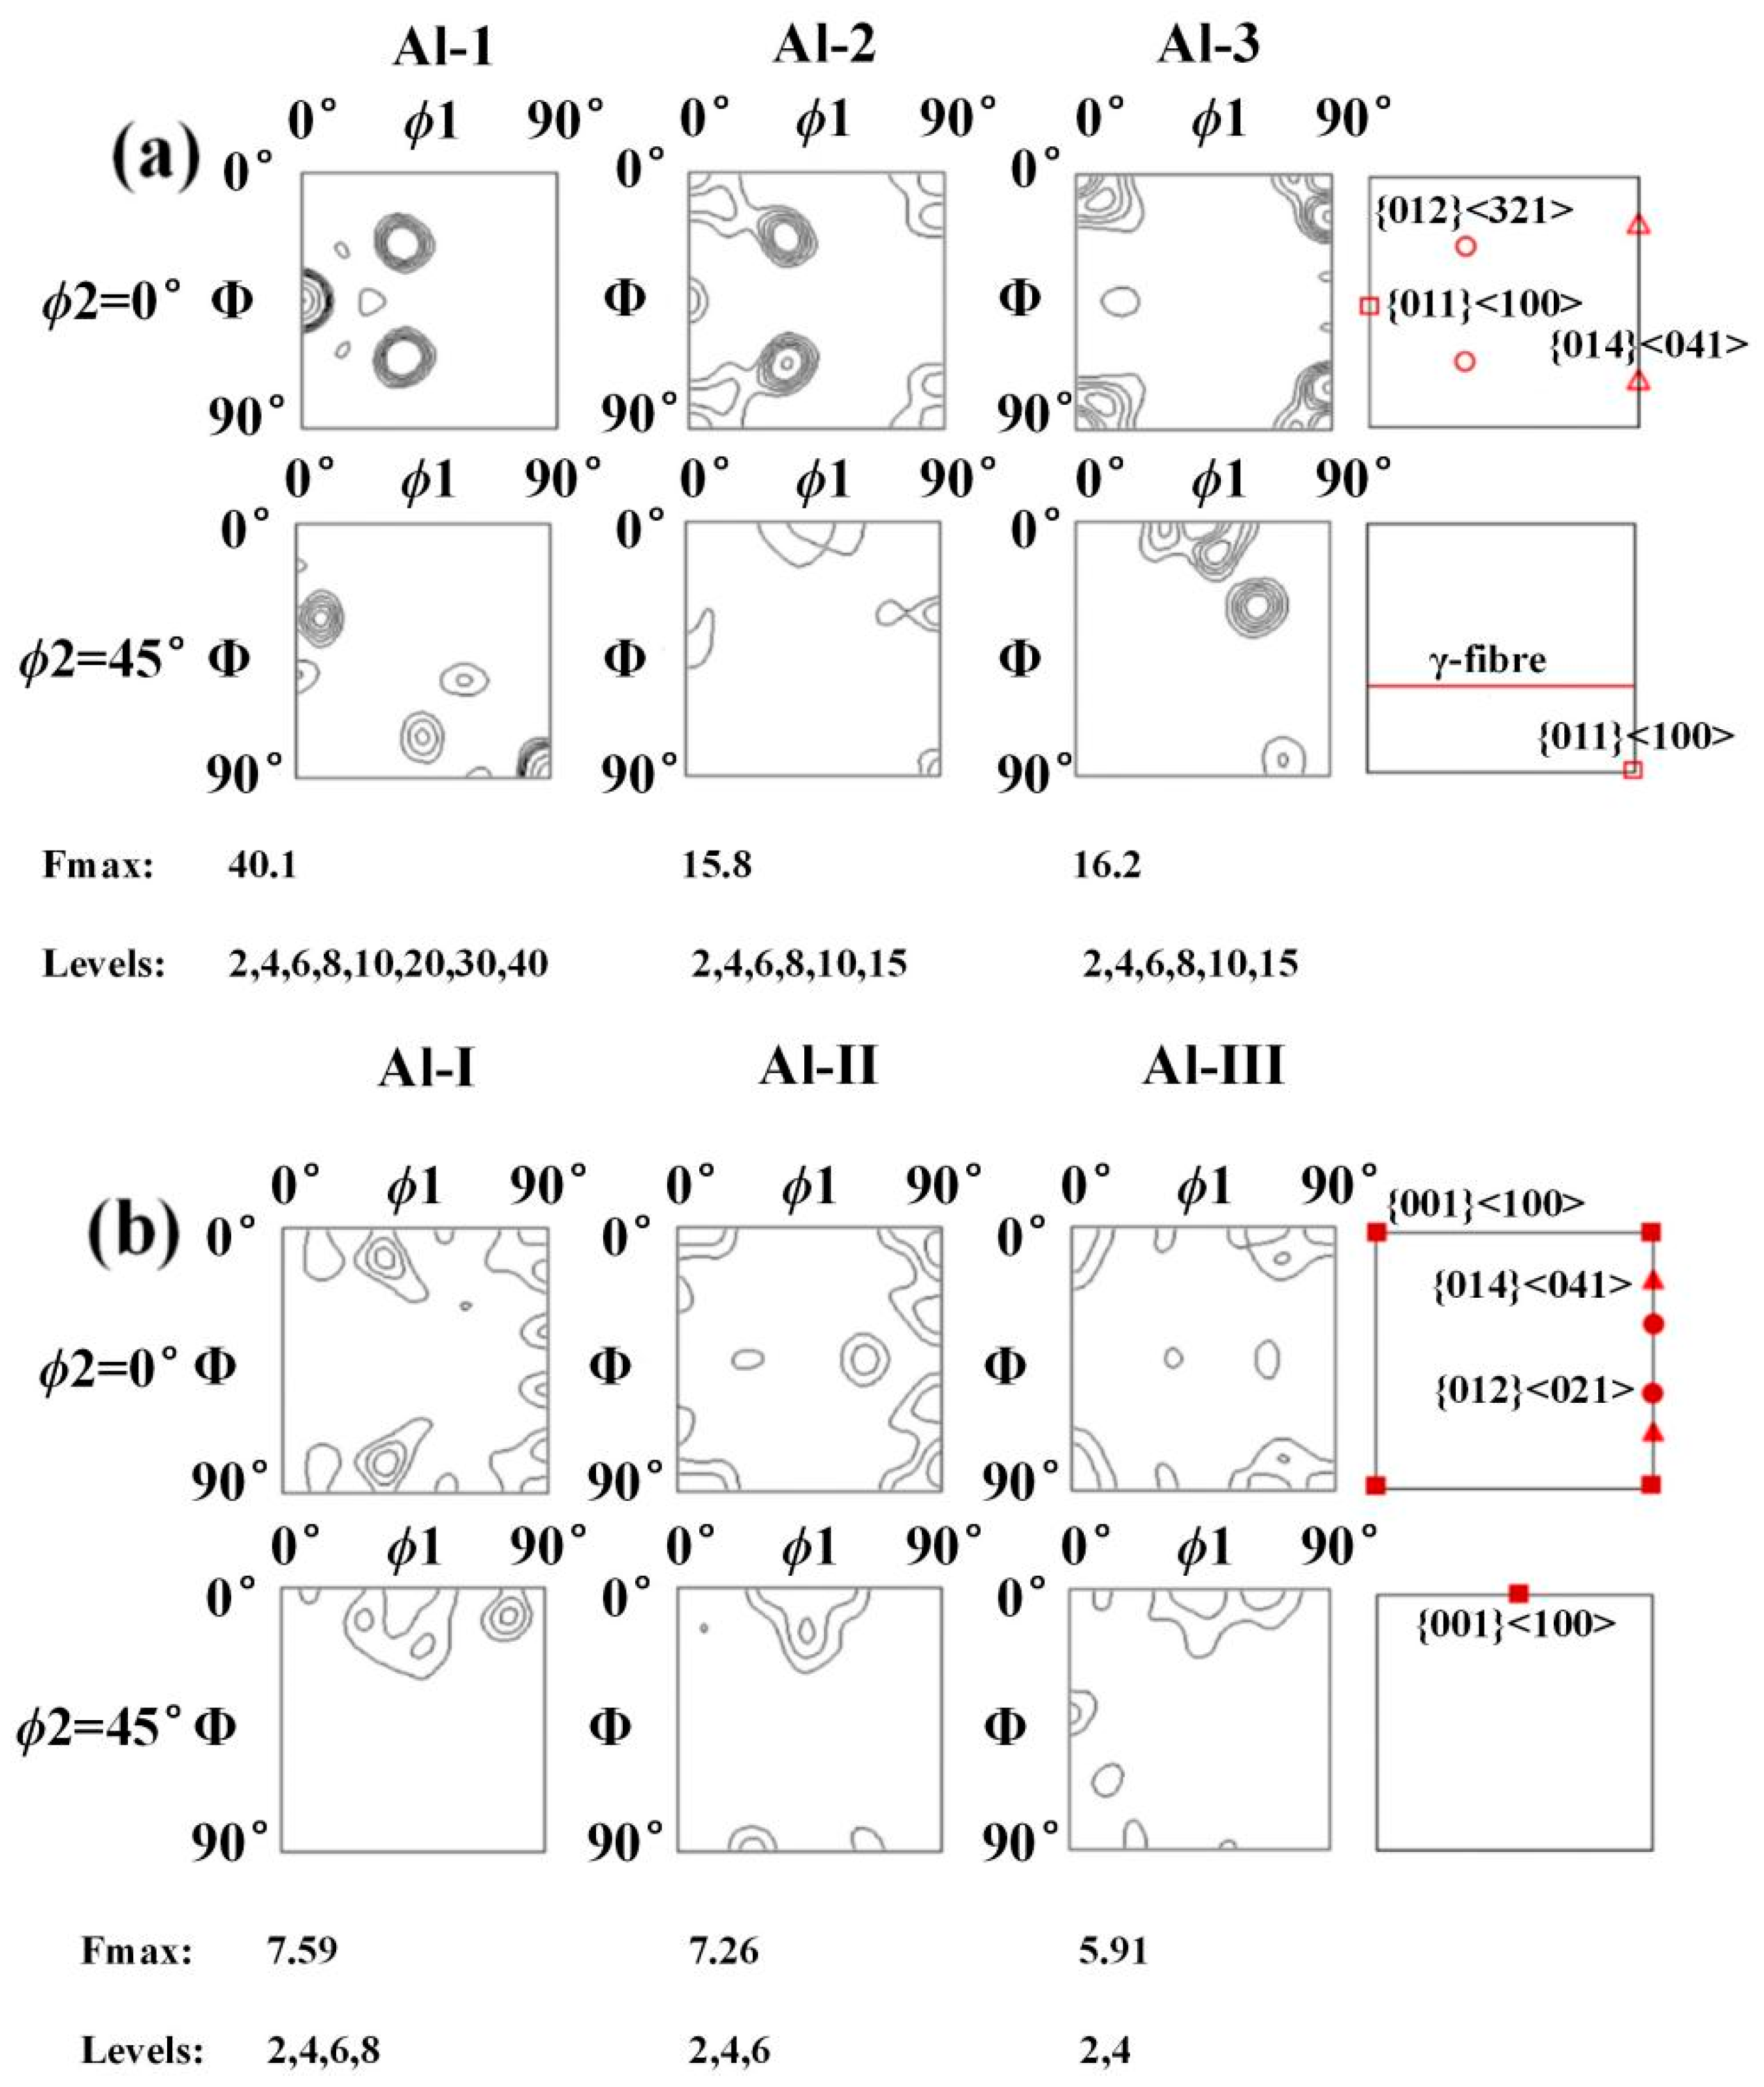
3.6. Microstructure and Texture near the Ti/Al Interface

The difference in the deformation ability between titanium and aluminium makes the microstructure and texture on the titanium and aluminium sides near the interface different. Strengthening the initial aluminium will affect the interaction between the titanium and aluminium layers. In this section, the influence of the strength of the initial aluminium on the microstructure and texture near the interface is investigated by EBSD analysis.

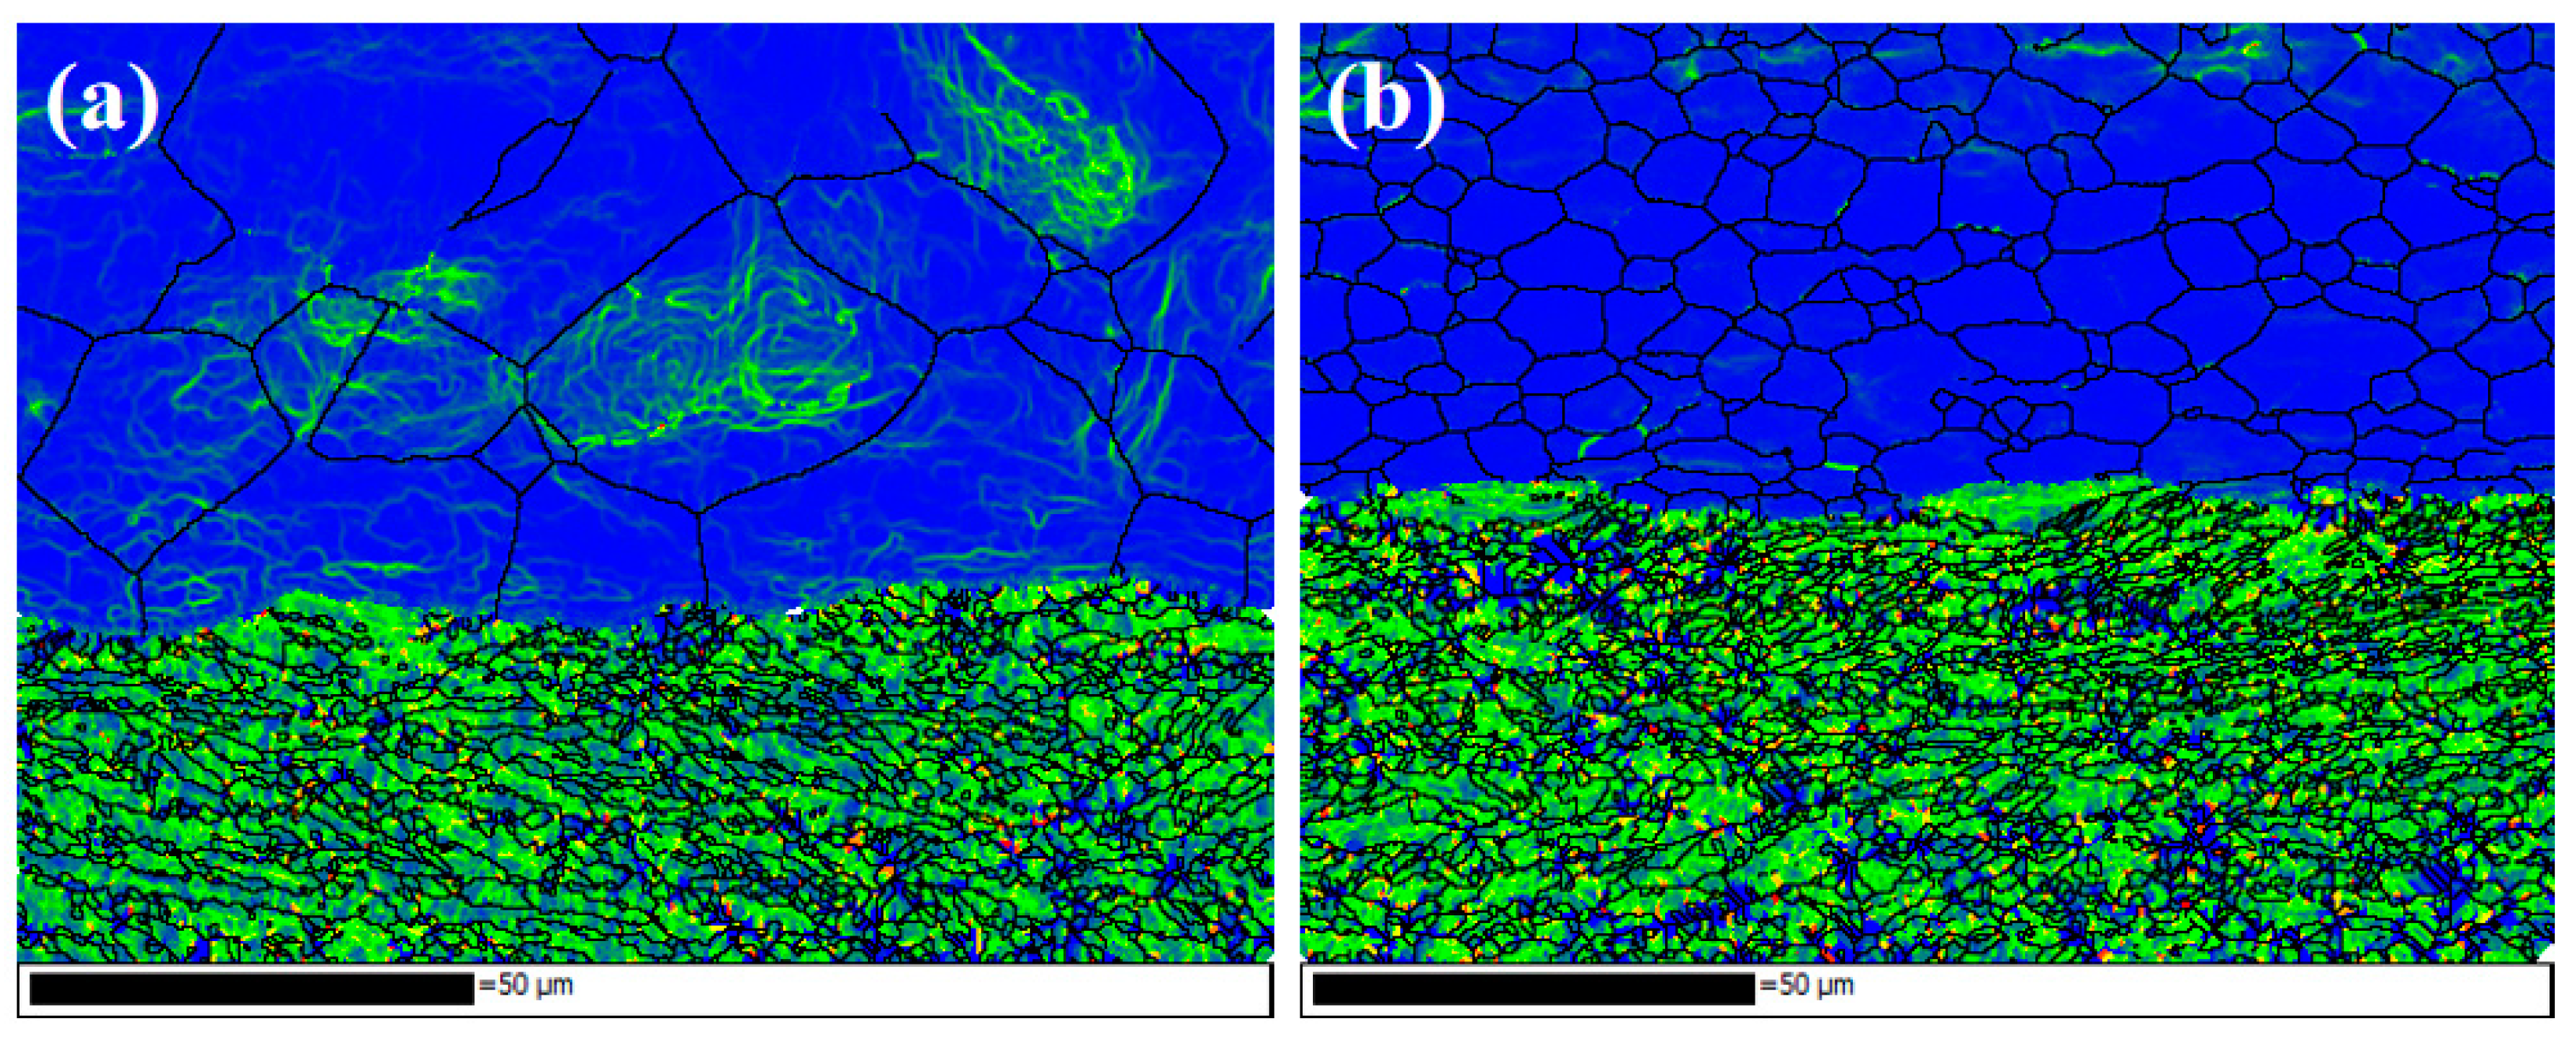
3.6.1. Microstructure
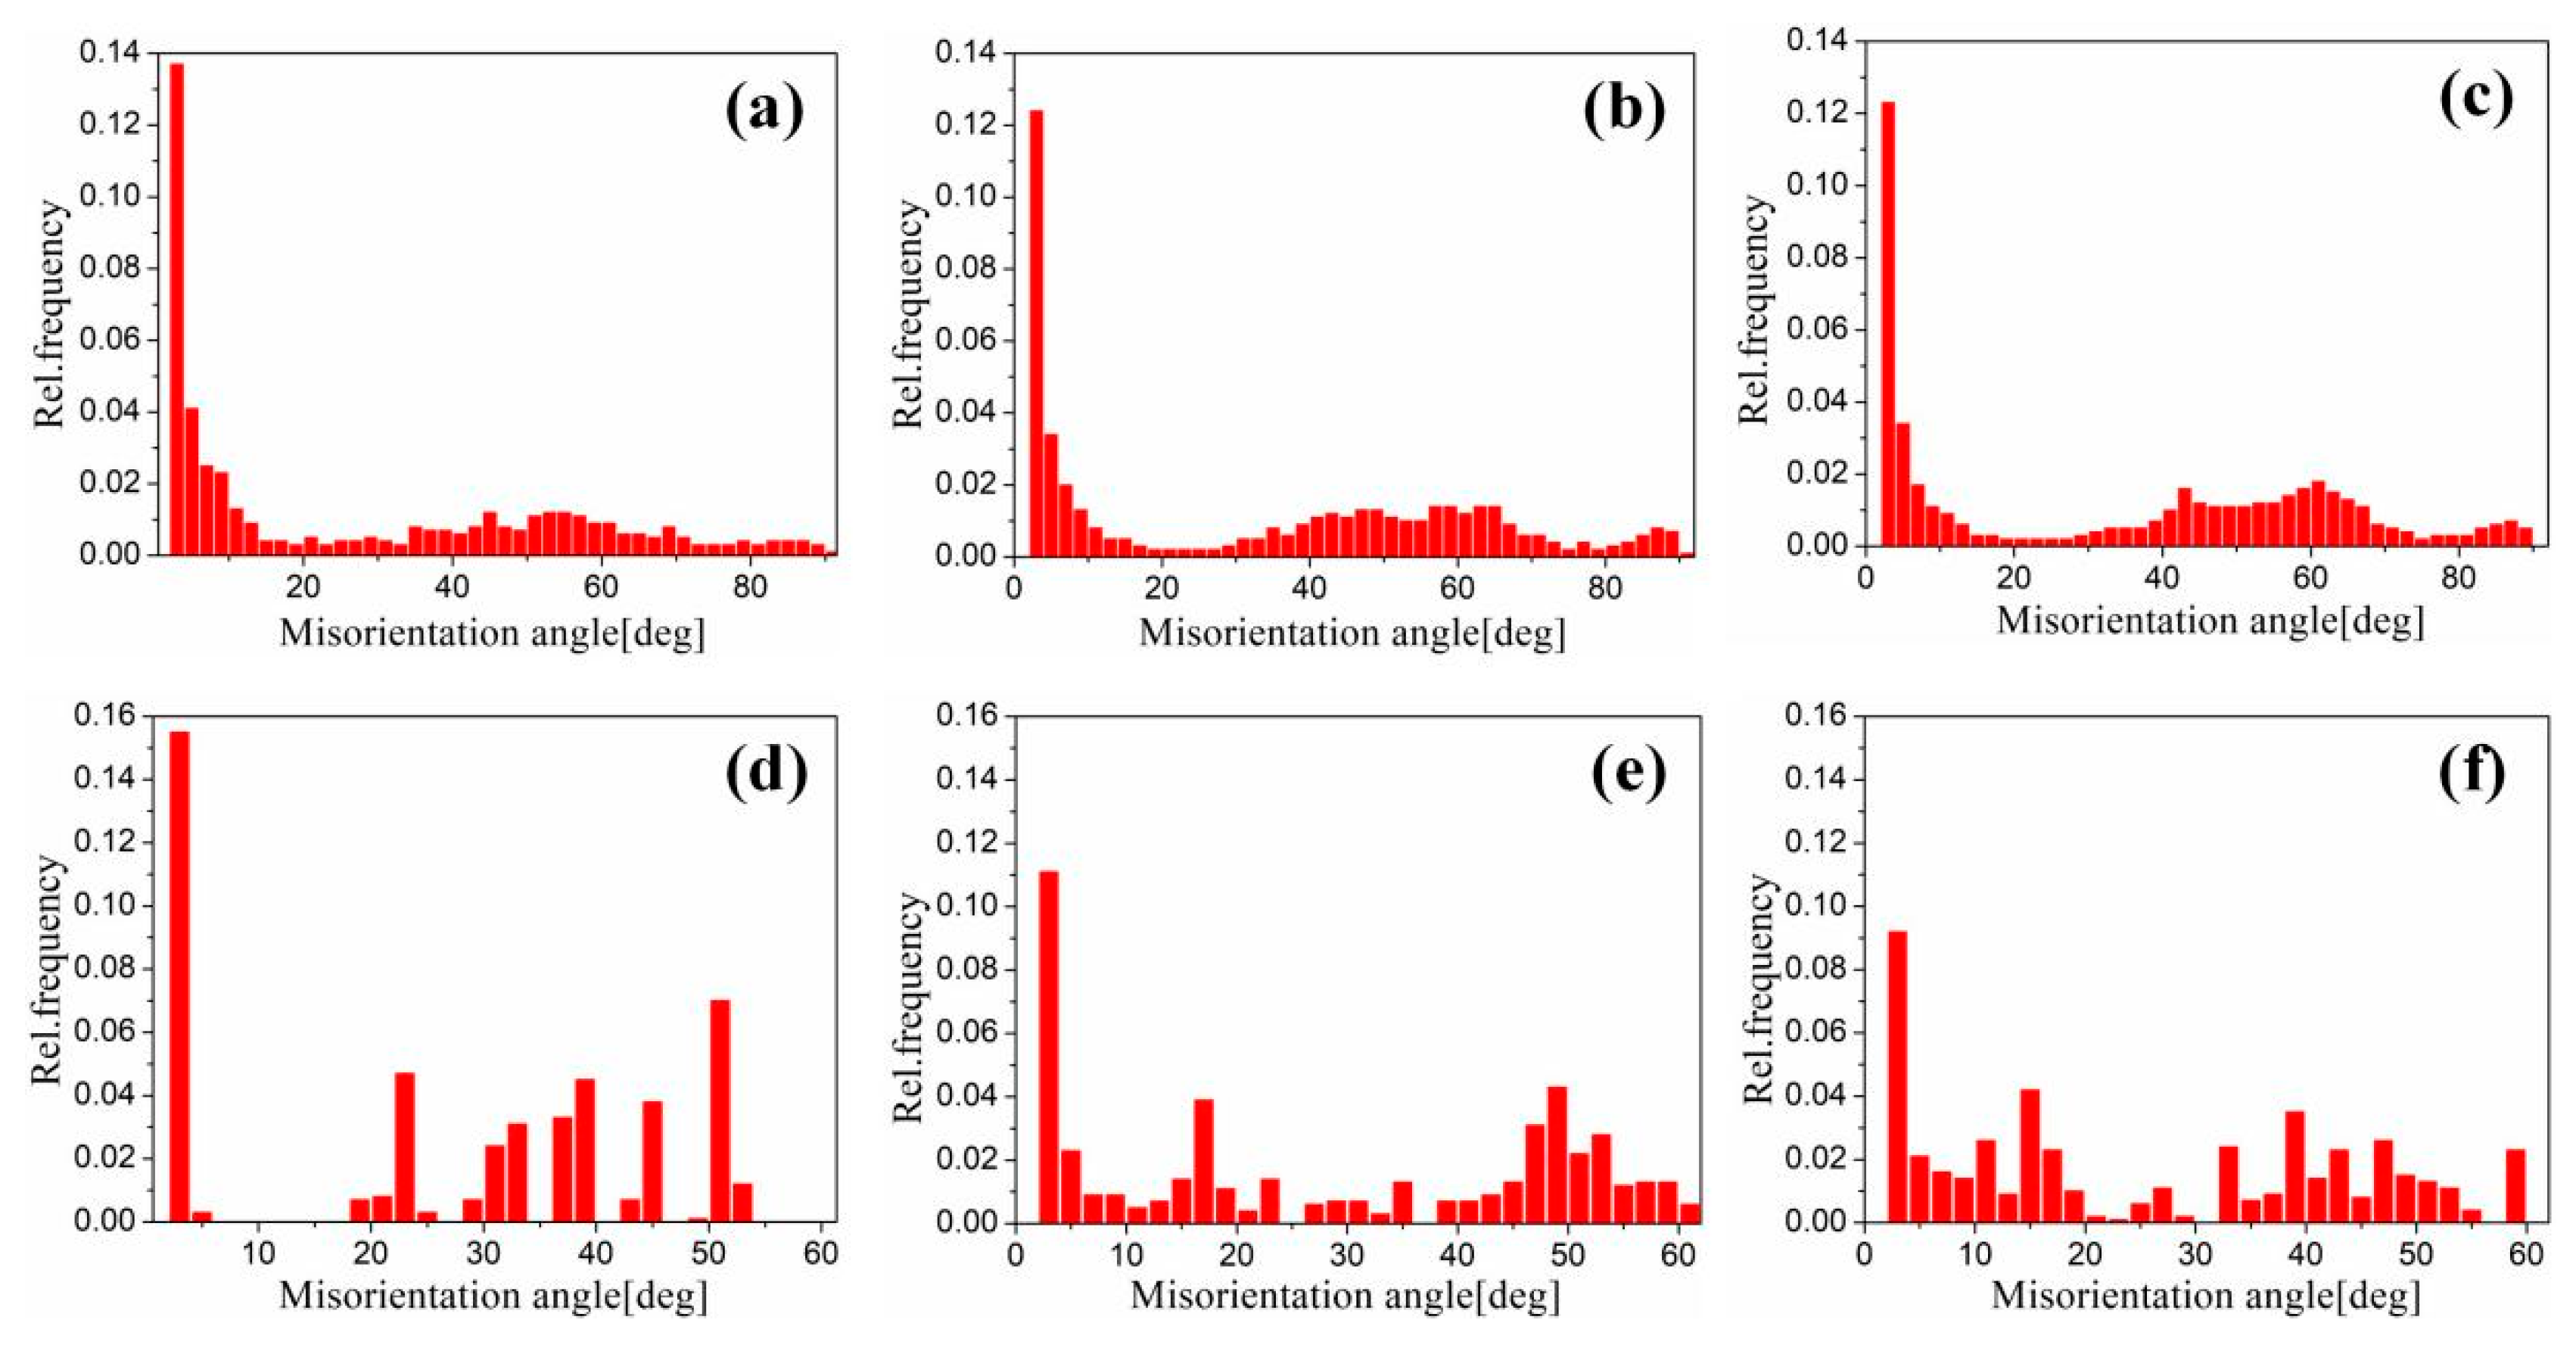
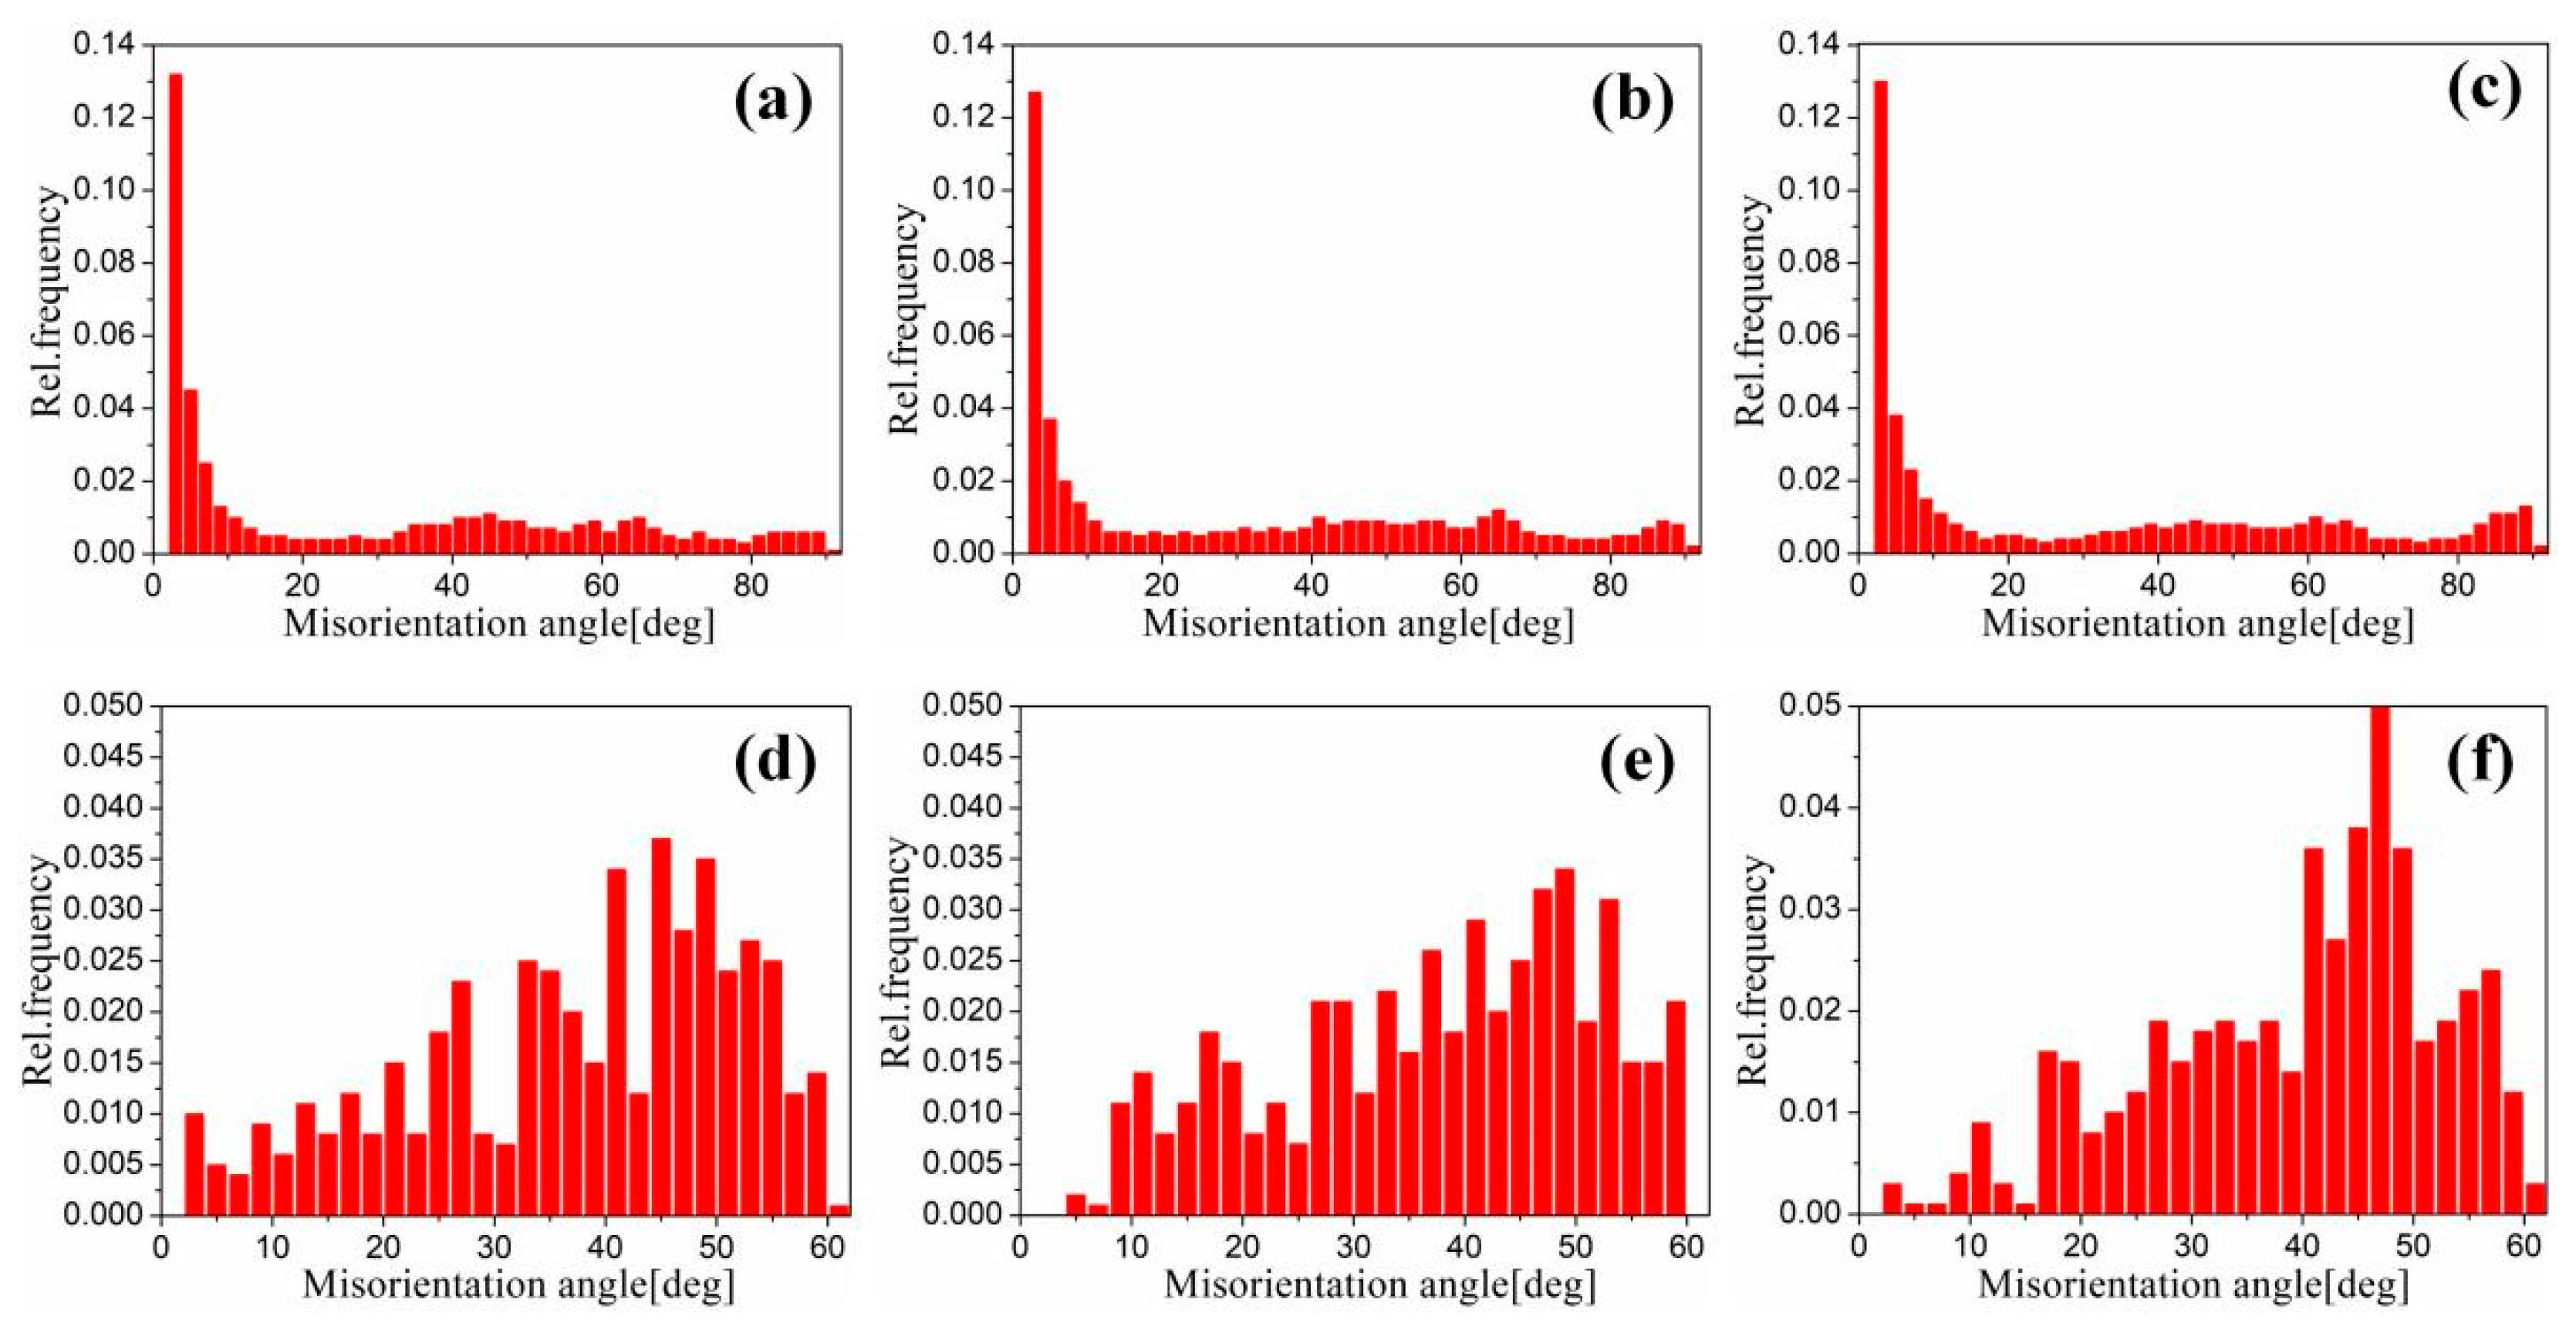
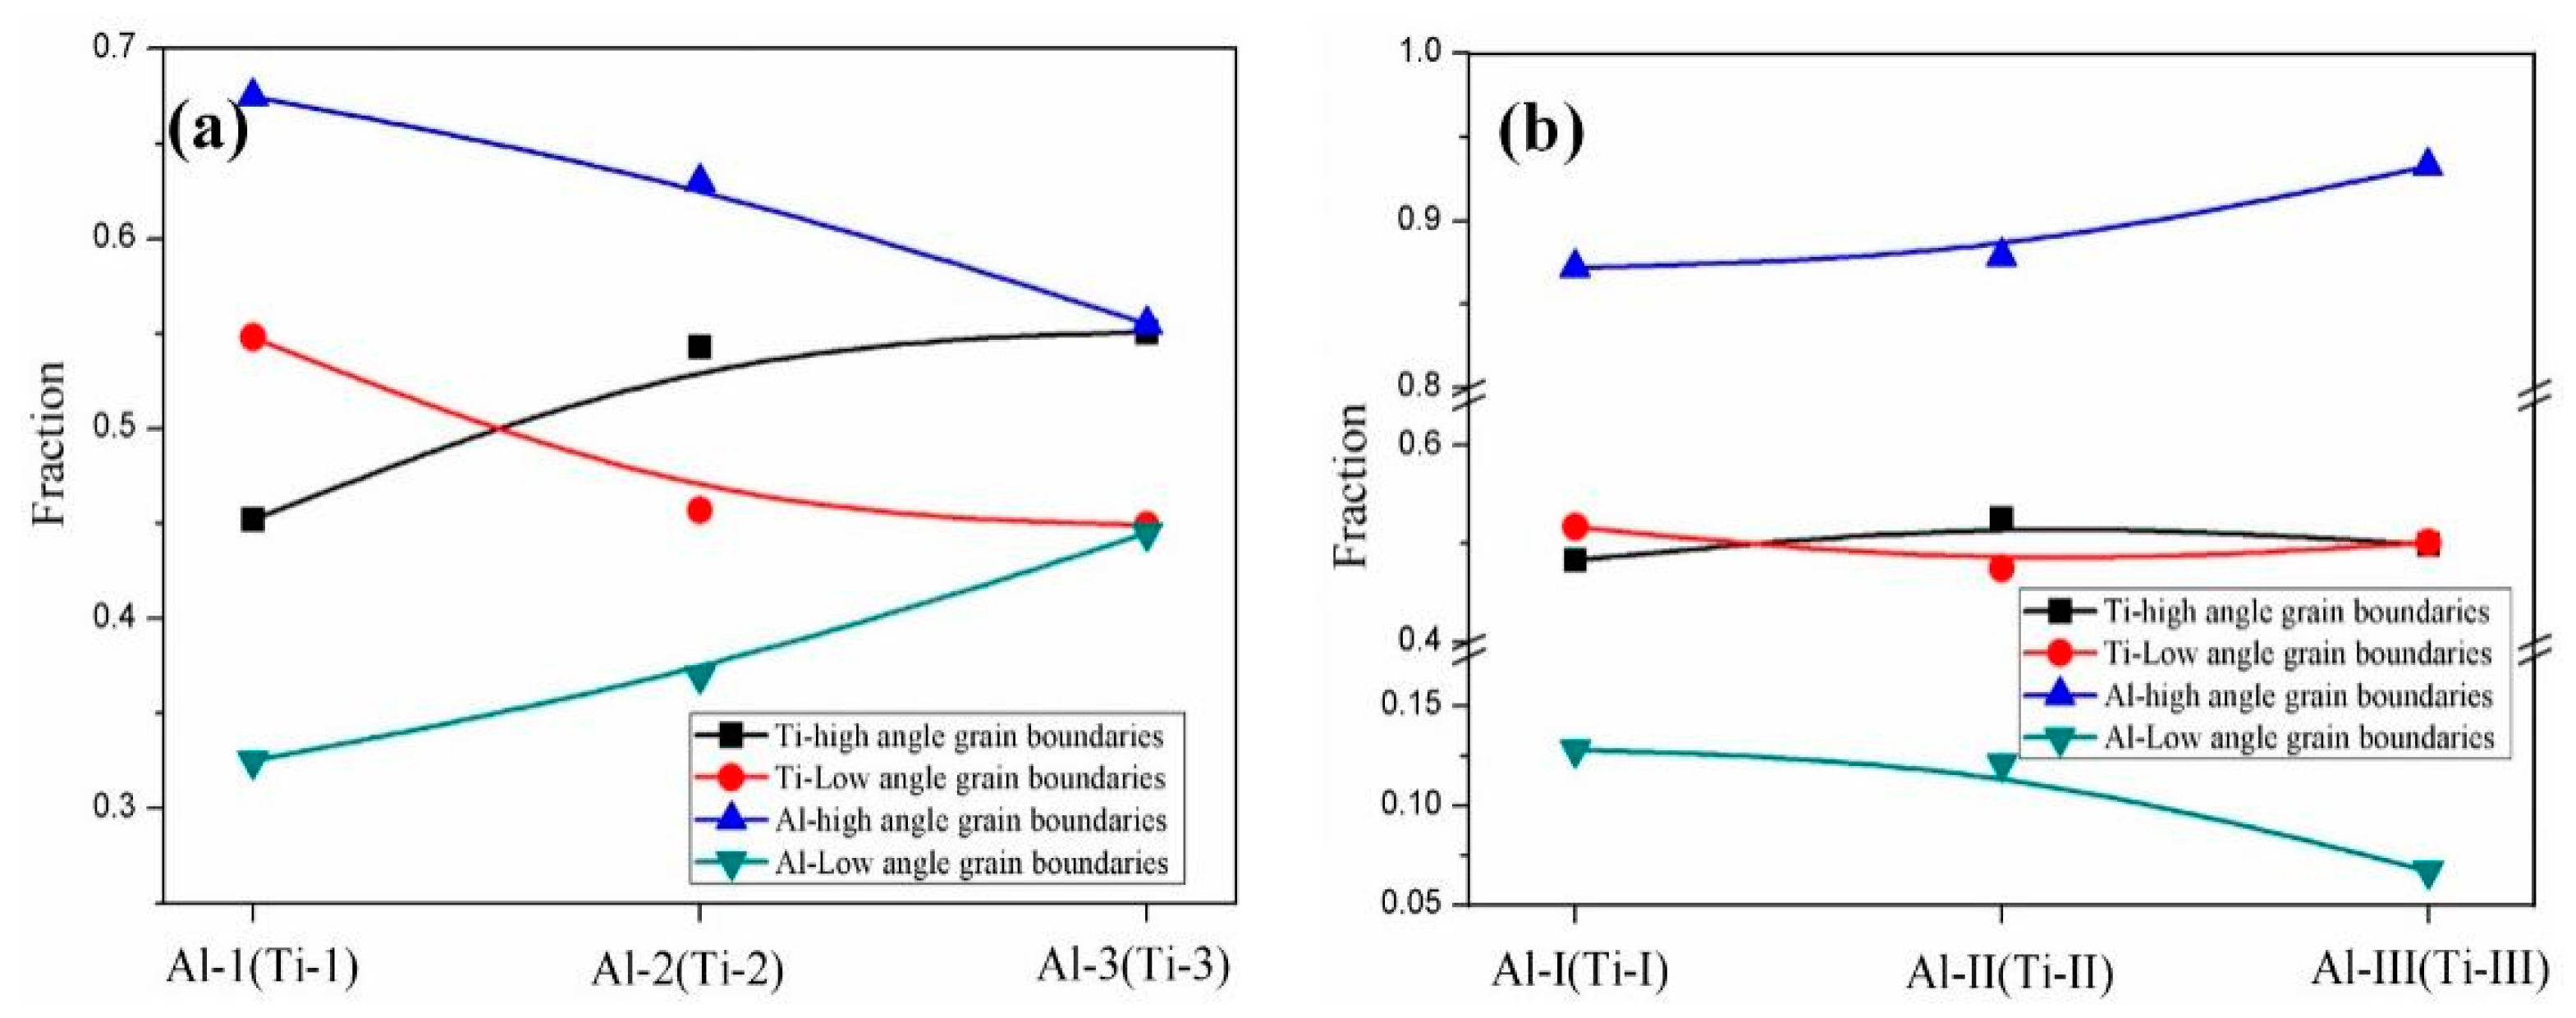
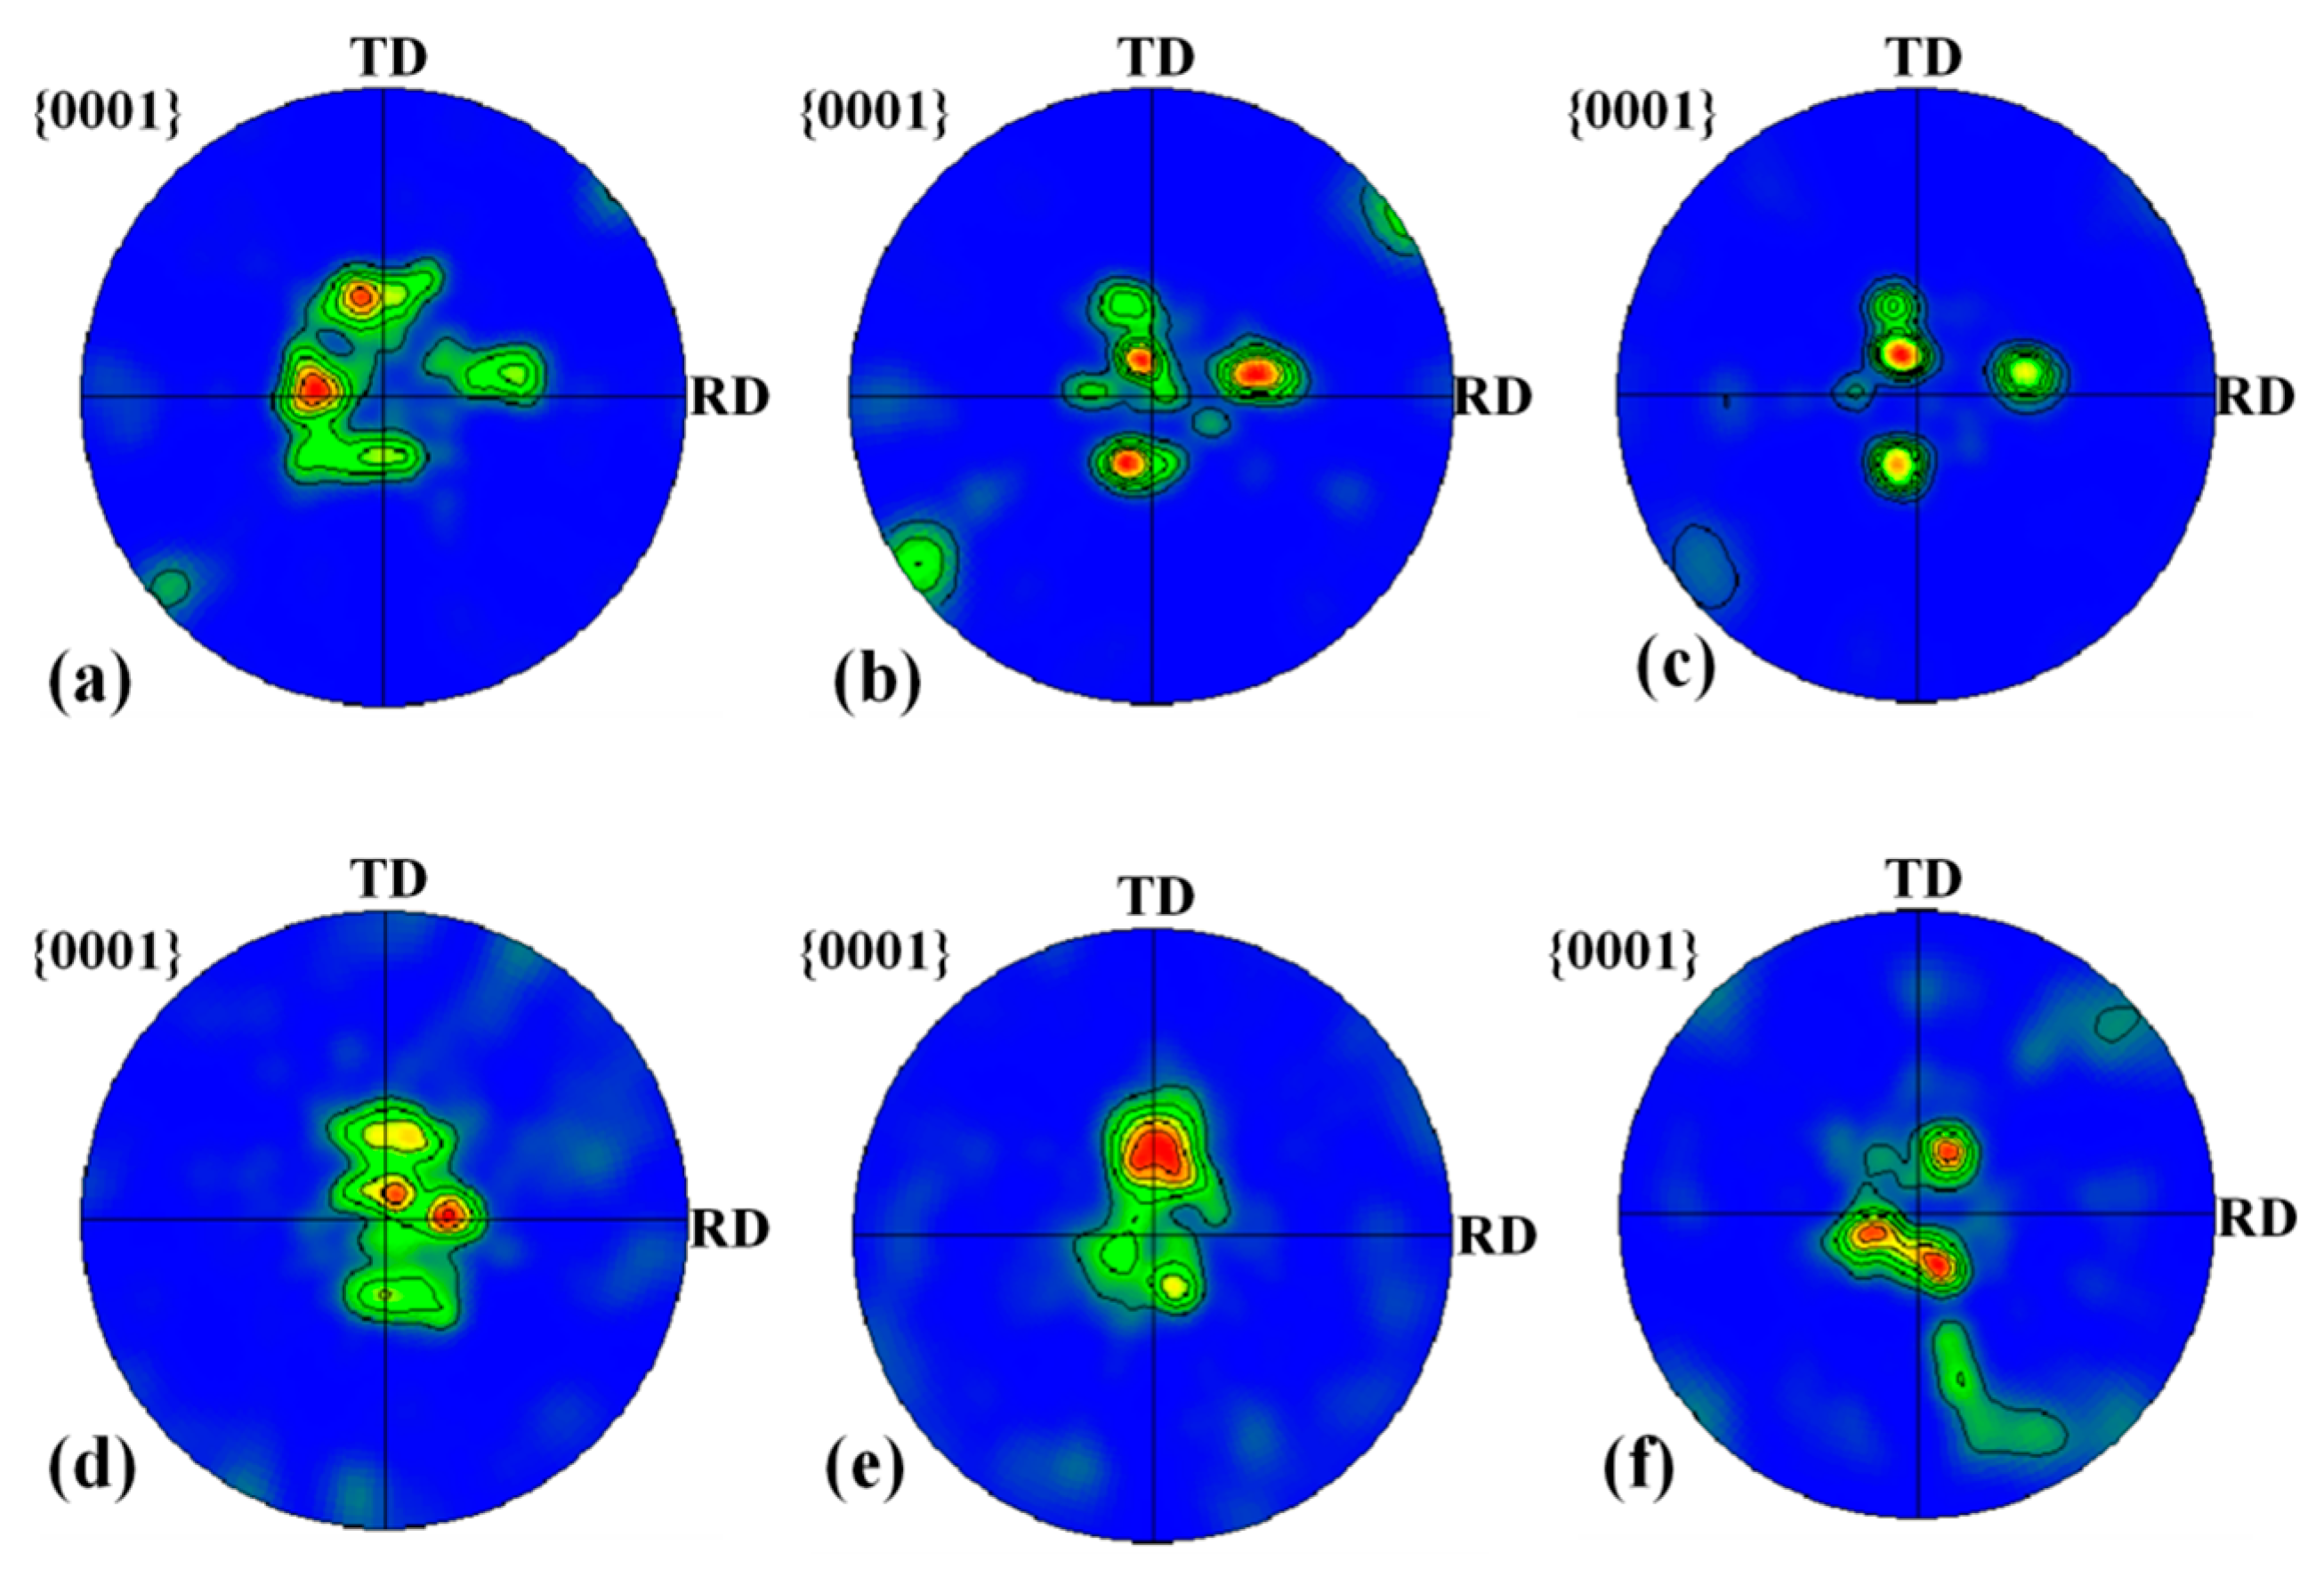
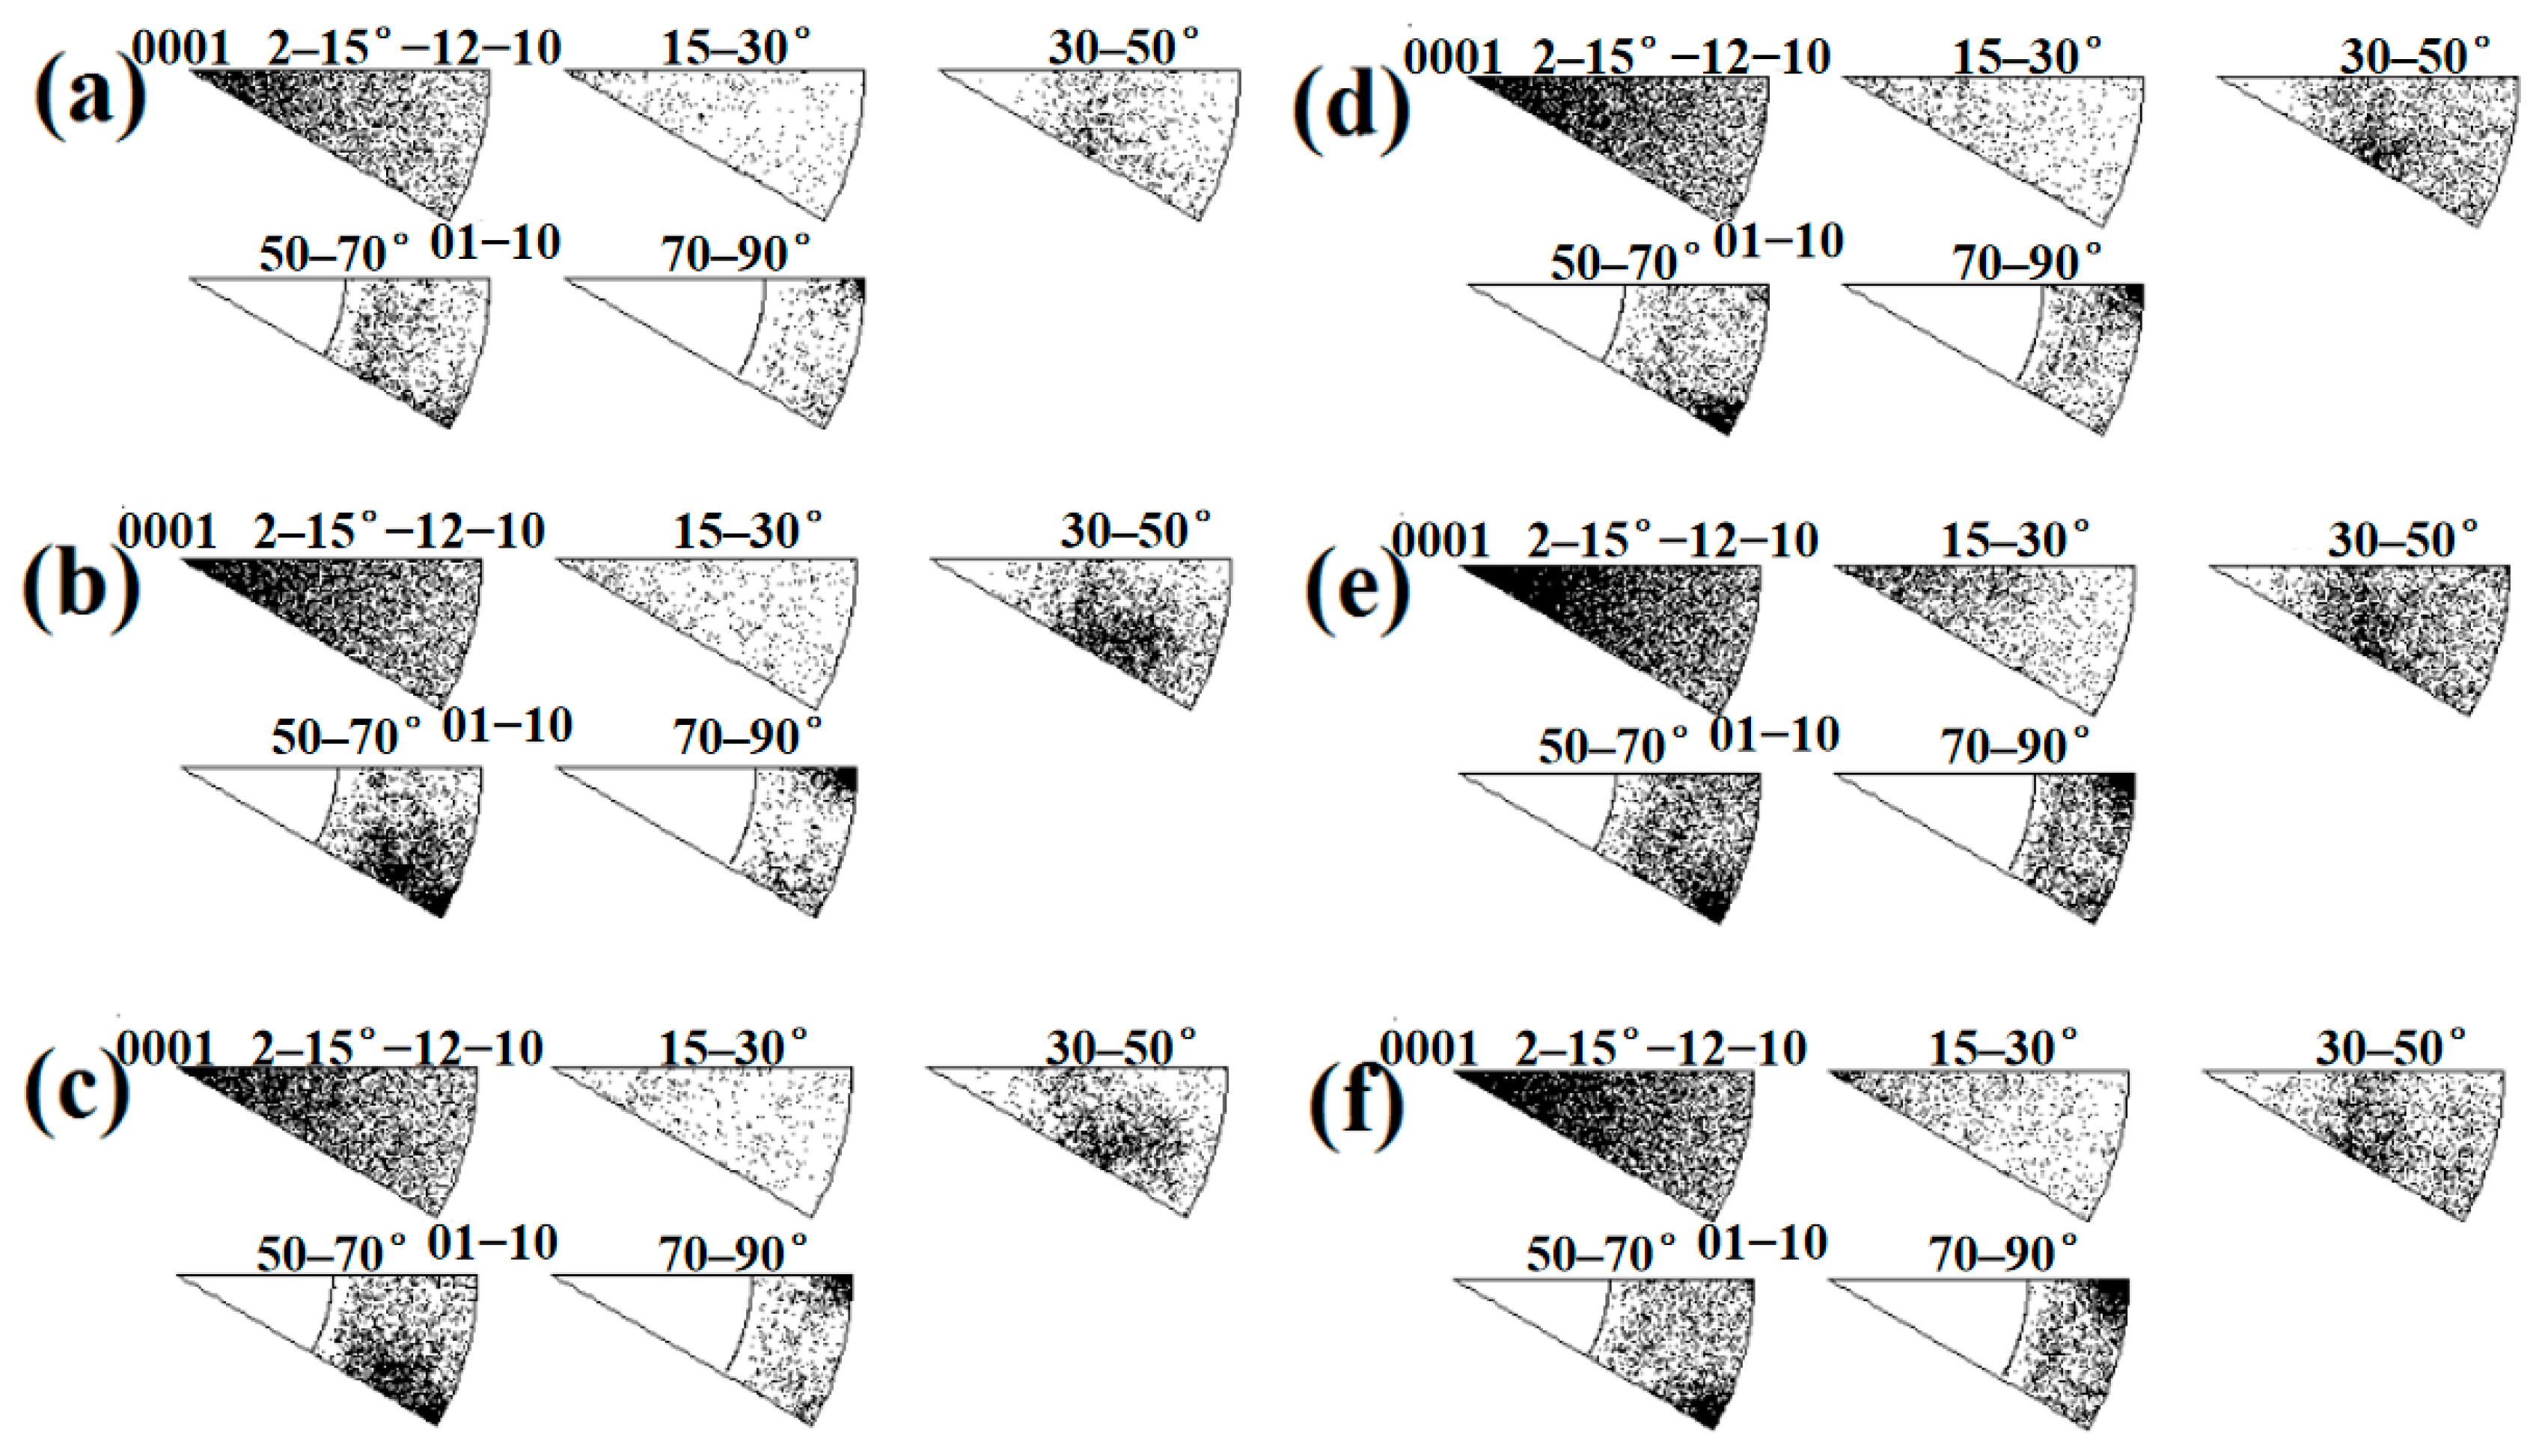
Figure 15 shows the EBSD maps near the Ti/Al interface of specimens B3 and C3. Different colours represent different crystallographic orientations. The grain size of aluminium in specimen B3 is obviously large because the annealing before cold roll bonding makes deformed grains nucleate and grow. The average grain size is 22.3 μm. However, the average grain size of the aluminium in specimen C3 is 6.1 μm, and the grain size distribution is relatively uniform (see Figure 16c). The average grain sizes of the titanium in specimens B3 and C3 are 1.8 μm and 1.6 μm, respectively, and B3 and C3 have similar grain size distributions, but the former has many elongated grains at 15~45° with the rolling direction. The regions in Figure 15a,b are divided into five subdomains to explore the change in grain size. With the position away from the Ti/Al interface, the grain size of titanium and aluminium shows an increasing trend due to the strong shear stress near the interface, which promotes the crushing of titanium grains and makes aluminium deform and elongate along the rolling direction. The fine grains formed at the interface improve the bonding strength. The accumulated deformation under a large strain can promote the diffusion of elements and form a certain diffusion layer. A smaller grain size corresponds to a larger diffusion layer. The grain size of titanium and aluminium in specimen C3 is relatively small, which confirms that specimen C has a higher bonding strength than specimen B at the same reduction, especially at high reduction.
Figure 17 shows the EBSD grain boundaries near the interface for specimens B3 and C3. Both specimens B3 and C3 contain high-angle grain boundaries (HAGBs), low-angle grain boundaries (LAGBs), 65° <01 1 ¯ 0> boundaries, 85° < 1 ¯ 2 1 ¯ 0> boundaries and 45° <5 1 ¯ 4 ¯ 3> boundaries on the titanium side. The last three types of boundaries can be attributed to {11 2 ¯ 2} <11 2 ¯ 3 ¯ > twins, {10 1 ¯ 2} <10 1 ¯ 1 ¯ > twins and “double” twinning (i.e., the formation of tensile twins inside the compressive twins), which is consistent with the findings of many researchers [15,16,17,18]. Moreover, for specimen B3 (See Figure 18), the 65° <01 1 ¯ 0> and 45° <5 1 ¯ 4 ¯ 3> boundaries have higher peak values than the 85° < 1 ¯ 2 1 ¯ 0> boundaries. Closer to the Ti/Al interface, the peak intensity of the 65° <01 1 ¯ 0> and 85° < 1 ¯ 2 1 ¯ 0> boundaries weakens more, the misorientation-angle distribution, which exhibits sharp peaks at approximately 65° and 85°, begins to spread, and the misorientation of twin boundaries gradually deviates from the exact twin–matrix relationship due to the strain-induced crystallographic rotation of the twins and the matrix from their initial orientations [15,18]. For specimen C3 (See Figure 19), with the position approaching the Ti/Al interface, the peak intensity of the 85° < 1 ¯ 2 1 ¯ 0> boundaries gradually decreases, while the peak intensity of the 65° <01 1 ¯ 0> boundaries slightly changes. Simultaneously, the peak intensity of the 45° <5 1 ¯ 4 ¯ 3> boundaries tends to increase. In subdomain Ti-III, the 85° < 1 ¯ 2 1 ¯ 0> boundaries have a higher peak value than the 65° <01 1 ¯ 0> and 45° <5 1 ¯ 4 ¯ 3> boundaries, while in Ti-I, the peak intensity is reversed. Figure 20 shows the variation in HAGBs and LAGBs in different regions. In specimen B3, since the position is closer to the Ti/Al interface, the proportion of LAGBs on the titanium side increases, which is related to the increase in grain boundaries with a misorientation between 2° and 10°, while the decrease in the proportion of HAGBs is related to the decrease in grain boundaries with a misorientation between 30° and 70°. Additionally, the proportion of HAGBs on the aluminium side increases. In specimen C3, since the position is closer to the Ti/Al interface, the proportion of LAGBs on the titanium side does not significantly increase, and the fraction of LAGBs on the aluminium side increases by 6%, but it remains dominated by HAGBs. Figure 18 and Figure 19 show that there are few grain boundaries with misorientation at 20~30° and 70~80° on the titanium side, especially specimen B3, which is almost 0. Moreover, the deformation modes of aluminium are different. For specimen B3, the LAGBs on the aluminium side mainly exist in the large grain in the form of intertwined winding, which reflects the inhomogeneous stress and strain in a single grain, results in different rotation rates in the grain, and leads to different orientations [19]. Therefore, the activated slip system also varies, as observed from the inconsistent orientation colour in multiple large grains in Figure 15a. In specimen C3, combined with Figure 15b, the grain orientation and colour on both sides of the small angle grain boundary on the aluminium side are similar, which indicates that the grains on both sides of the LAGBs are in the process of inconsistent rotation and result in the gradual subdivision of large grains.
Figure 21 shows the misorientation distribution along the solid line in the EBSD maps under different initial strengths of aluminium. For specimen B3, the spacing of HAGBs on the aluminium side is large, which is related to the grain growth caused by annealing before rolling. Moreover, there are many LAGBs between HAGBs, which indicates that the internal deformation of grains is inhomogeneous. Compared with small grains, large grains are more likely to asynchronously deform under the action of force, and the start of the slip system is inconsistent. The accumulation of dislocations forms dislocation cells, which separate large grains into multiple regions with similar orientations. With the increase in lattice rotation under stress, the misorientation between regions becomes larger and gradually tends to break large grains. For specimen C3, there are almost always HAGBs on the aluminium side, which is produced by pre-strengthening before rolling and forms during cold roll bonding. The spacing of HAGBs is small and uniform, which indicates that coordinated deformation can be achieved between grains. Due to the deformation limitation of aluminium with different strengths, the misorientation distribution on the titanium side is different, the HAGBs on the titanium side are dense, and the misorientation of LAGBs is large. Figure 21c,g shows that there are no HAGBs in the titanium and aluminium grains. The point-to-point misorientations of the measured grains are less than 2° along L1–L5, except for the sudden increase at 38 μm along L3. At this position, the subgrain boundaries formed by dislocation entanglement are in the stage of evolution to HAGBs. Along LI-LIII, the point-to-point misorientations are less than 0.25°. Two conclusions can be drawn considering the above results. First, the average point-to-point misorientations in the grains on the titanium side are higher than those on the aluminium side. Second, a higher initial strength of aluminium corresponds to smaller corresponding point-to-point misorientations in the grains. Figure 21d,h indicate several conclusions. First, on the Ti side, when the position is gradually away from the Ti/Al interface, the gradients of misorientation gradually decrease. Second, on the aluminium side, except for the grains with large deformation, the point-to-origin misorientation distribution curves along the lines are relatively smooth, and the curves are smoother when the aluminium has been pre-strengthened. The smoothness of the point-to-origin misorientation distribution curve can reflect the crushing process of coarse grains [17]. The curves along LI-LIII are very smooth, which indicates that the aluminium grains in specimen C3 bear deformation through mutual coordination, and the crushing process has not started inside the grains. In contrast, the curves along L1, L2 and L5 have local small peaks, while in the grain with large deformation, the curves along L3 and L4 have local steep peaks, which corresponds to the sharp change in colours. At this position, the subgrain boundary formed by dislocation entanglement gradually changes to LAGBs and even HAGBs. The curves along L6–L8 and LIV–LVI have similar single steep peaks, which indicates that the grain fragmentation process on the titanium side is in progress and is a continuous process.
Figure 22 shows the kernel average misorientation (KAM) near the interface under different initial strengths of aluminium. The green area has high residual strain, and the blue indicates that the residual deformation in this area is small. The KAM is higher on the titanium side, which implies a high residual strain in the titanium matrix. Under the action of rolling pressure, plastic deformation occurs on the titanium side, so the dislocations accumulate, which form and develop LAGBs. The original grains are subdivided into subgrains bounded by dislocation cells, and HAGBs are formed with the continuous rotation of the lattice. For specimen C3, the distortion of aluminium is not very serious, and the deformation between the grains is more uniform. For specimen B3, the internal distortion of large aluminium grains is serious, which indicates a large number of slip systems in these grains, and the dislocation movement forms entanglement.

3.6.2. Texture

In this study, there are three types of textures in the titanium layer near the interface: basal texture, split-basal texture towards the TD and split-basal texture towards the RD (Figure 23). For specimen B3, the most obvious feature is that the intensity of the basal texture decreases until it disappears when the position gradually approaches the Ti/Al interface. Thornburg et al. [20] found that the basal texture was produced by the joint action of prism <a> and pyramidal <c + a> slip systems through the study of a Taylor-type (isostrain) crystal-plasticity model. Therefore, at Ti-3 and Ti-2, plastic deformation is realized by slip and twinning because the critical resolved shear stress (CRSS) of the pyramidal <c + a> slip system is high (Table 4), and there are twins in these two regions to bear the compression along the c-axis. The failure of the prism <a> slip system due to the Schmidt factor of 0 is avoided. At TI-1, the plastic deformation is mainly realised by twins. Figure 15a shows that closer to the Ti/Al interface, the elongated grains caused by slip gradually decrease, even showing an equiaxed fine shape, which can support the change in deformation mode in the three subdomains. For specimen C3, the most significant feature is that as the position gradually approaches the Ti/Al interface, the split-basal texture ±30° towards the TD obviously decreases, and the basal texture appears. Therefore, the plastic deformation in Ti-II and Ti-III is realised by twins, while the plastic deformation in Ti-I is realised by prism <a> slip and twins.
For the twins form, at subdomain Ti-3, 65° <01 1 ¯ 0> and 45° <5 1 ¯ 4 ¯ 3> are the main twins, and 85° < 1 ¯ 2 1 ¯ 0> is the secondary component of the twins. However, with the position approaching the Ti/Al interface, especially at Ti-1, the components of the twins change considerably, and 45° <5 1 ¯ 4 ¯ 3> is the main twin, accompanied by a small amount of 65° <01 1 ¯ 0> and 85° < 1 ¯ 2 1 ¯ 0> components, as indicated by the misorientation-axis distribution presented in Figure 24. According to Figure 24a–c, at Ti-3, the aggregation degree of the misorientation axis for HAGBs around the [5 1 ¯ 4 ¯ 3] and [01 1 ¯ 0] axes is stronger than that around the [ 1 ¯ 2 1 ¯ 0] axis, while at Ti-1, the aggregation degree around the three axes significantly decreases, especially along the [01 1 ¯ 0] and [ 1 ¯ 2 1 ¯ 0] axes. For specimen C3, at subdomain Ti-III, 65° <01 1 ¯ 0> and 85° < 1 ¯ 2 1 ¯ 0> are the main twins, and 45° <5 1 ¯ 4 ¯ 3> is the secondary component of the twins. However, with the position approaching the Ti/Al interface, especially at Ti-I, the components of the twins change considerably, and 45° <5 1 ¯ 4 ¯ 3> and 65° <01 1 ¯ 0> are the main twins, accompanied by a small amount of the 85° < 1 ¯ 2 1 ¯ 0> component. As shown in Figure 24d–f, from subdomain Ti-III to Ti-I, the aggregation degree along the [5 1 ¯ 4 ¯ 3] axis is enhanced and there is almost no change along the [01 1 ¯ 0] axis, while it significantly decreases along the [ 1 ¯ 2 1 ¯ 0] axis. The activation of twins in the titanium layer is related to the restriction degree of the aluminium and the orientation of the titanium matrix, which affects the microstructure uniformity of the titanium layer. On the whole, the components of twins on the titanium side change more in specimen B3 than in specimen C3, which may cause the low uniformity of the microstructure on the titanium side in specimen B3.
The relationship between the Miller index and Euler angle can be calculated by TexTools software to obtain the preferred orientation direction in the aluminium layer, as shown in Figure 25. For specimen B3, as the position moves towards the Ti/Al interface, the {014} <041> texture with strong texture density (at Al-3, the orientation distribution function value f (g) = 16.2) gradually weakens and disappears, while the {012} <321> texture and Gaussian texture {011} <100> gradually increase. At Al-1, the orientation distribution function values reach 19.8 and 40.1, and a weak fibre texture appears. For specimen C3, when the position moves towards the interface, the types of textures are obviously different: the unstable {012} <021> disappears, the {014} <041> texture appears at Al-I, and the cubic texture {001} <100> always exists.

3.7. Interfacial Bonding Mechanism of the Ti/Al Clad

To date, many theories have been used to describe the bonding mechanism of composite sheets, including film theory, energy barrier theory, diffusion bonding theory and recrystallisation theory. Film theory can be used to describe the bonding mechanism of cold roll bonding, which can be divided into three stages. The first stage is the physical contact of the facing surfaces. The mechanically treated surface is uneven, and there are many asperities. The hardening layer and oxide layer are attached to these asperities and other positions on the facing surfaces, and these asperities have initial contact at the initial stage of the cold roll bonding process. Second, these asperities are flattened, and the hardening layer and oxide film are broken. Third, the bottom fresh metals flow through the broken crack to the microcavity, contact each other and bond under multiple actions of rolling pressure, interfacial shear force and rolling deformation heat. These three stages describe the interface-bonding process from the micro level, which is summarised as the fracture of the hardening layer and oxide film and the extrusion flow process of fresh metal at the bottom. The mathematical models of these two micro processes are described below.

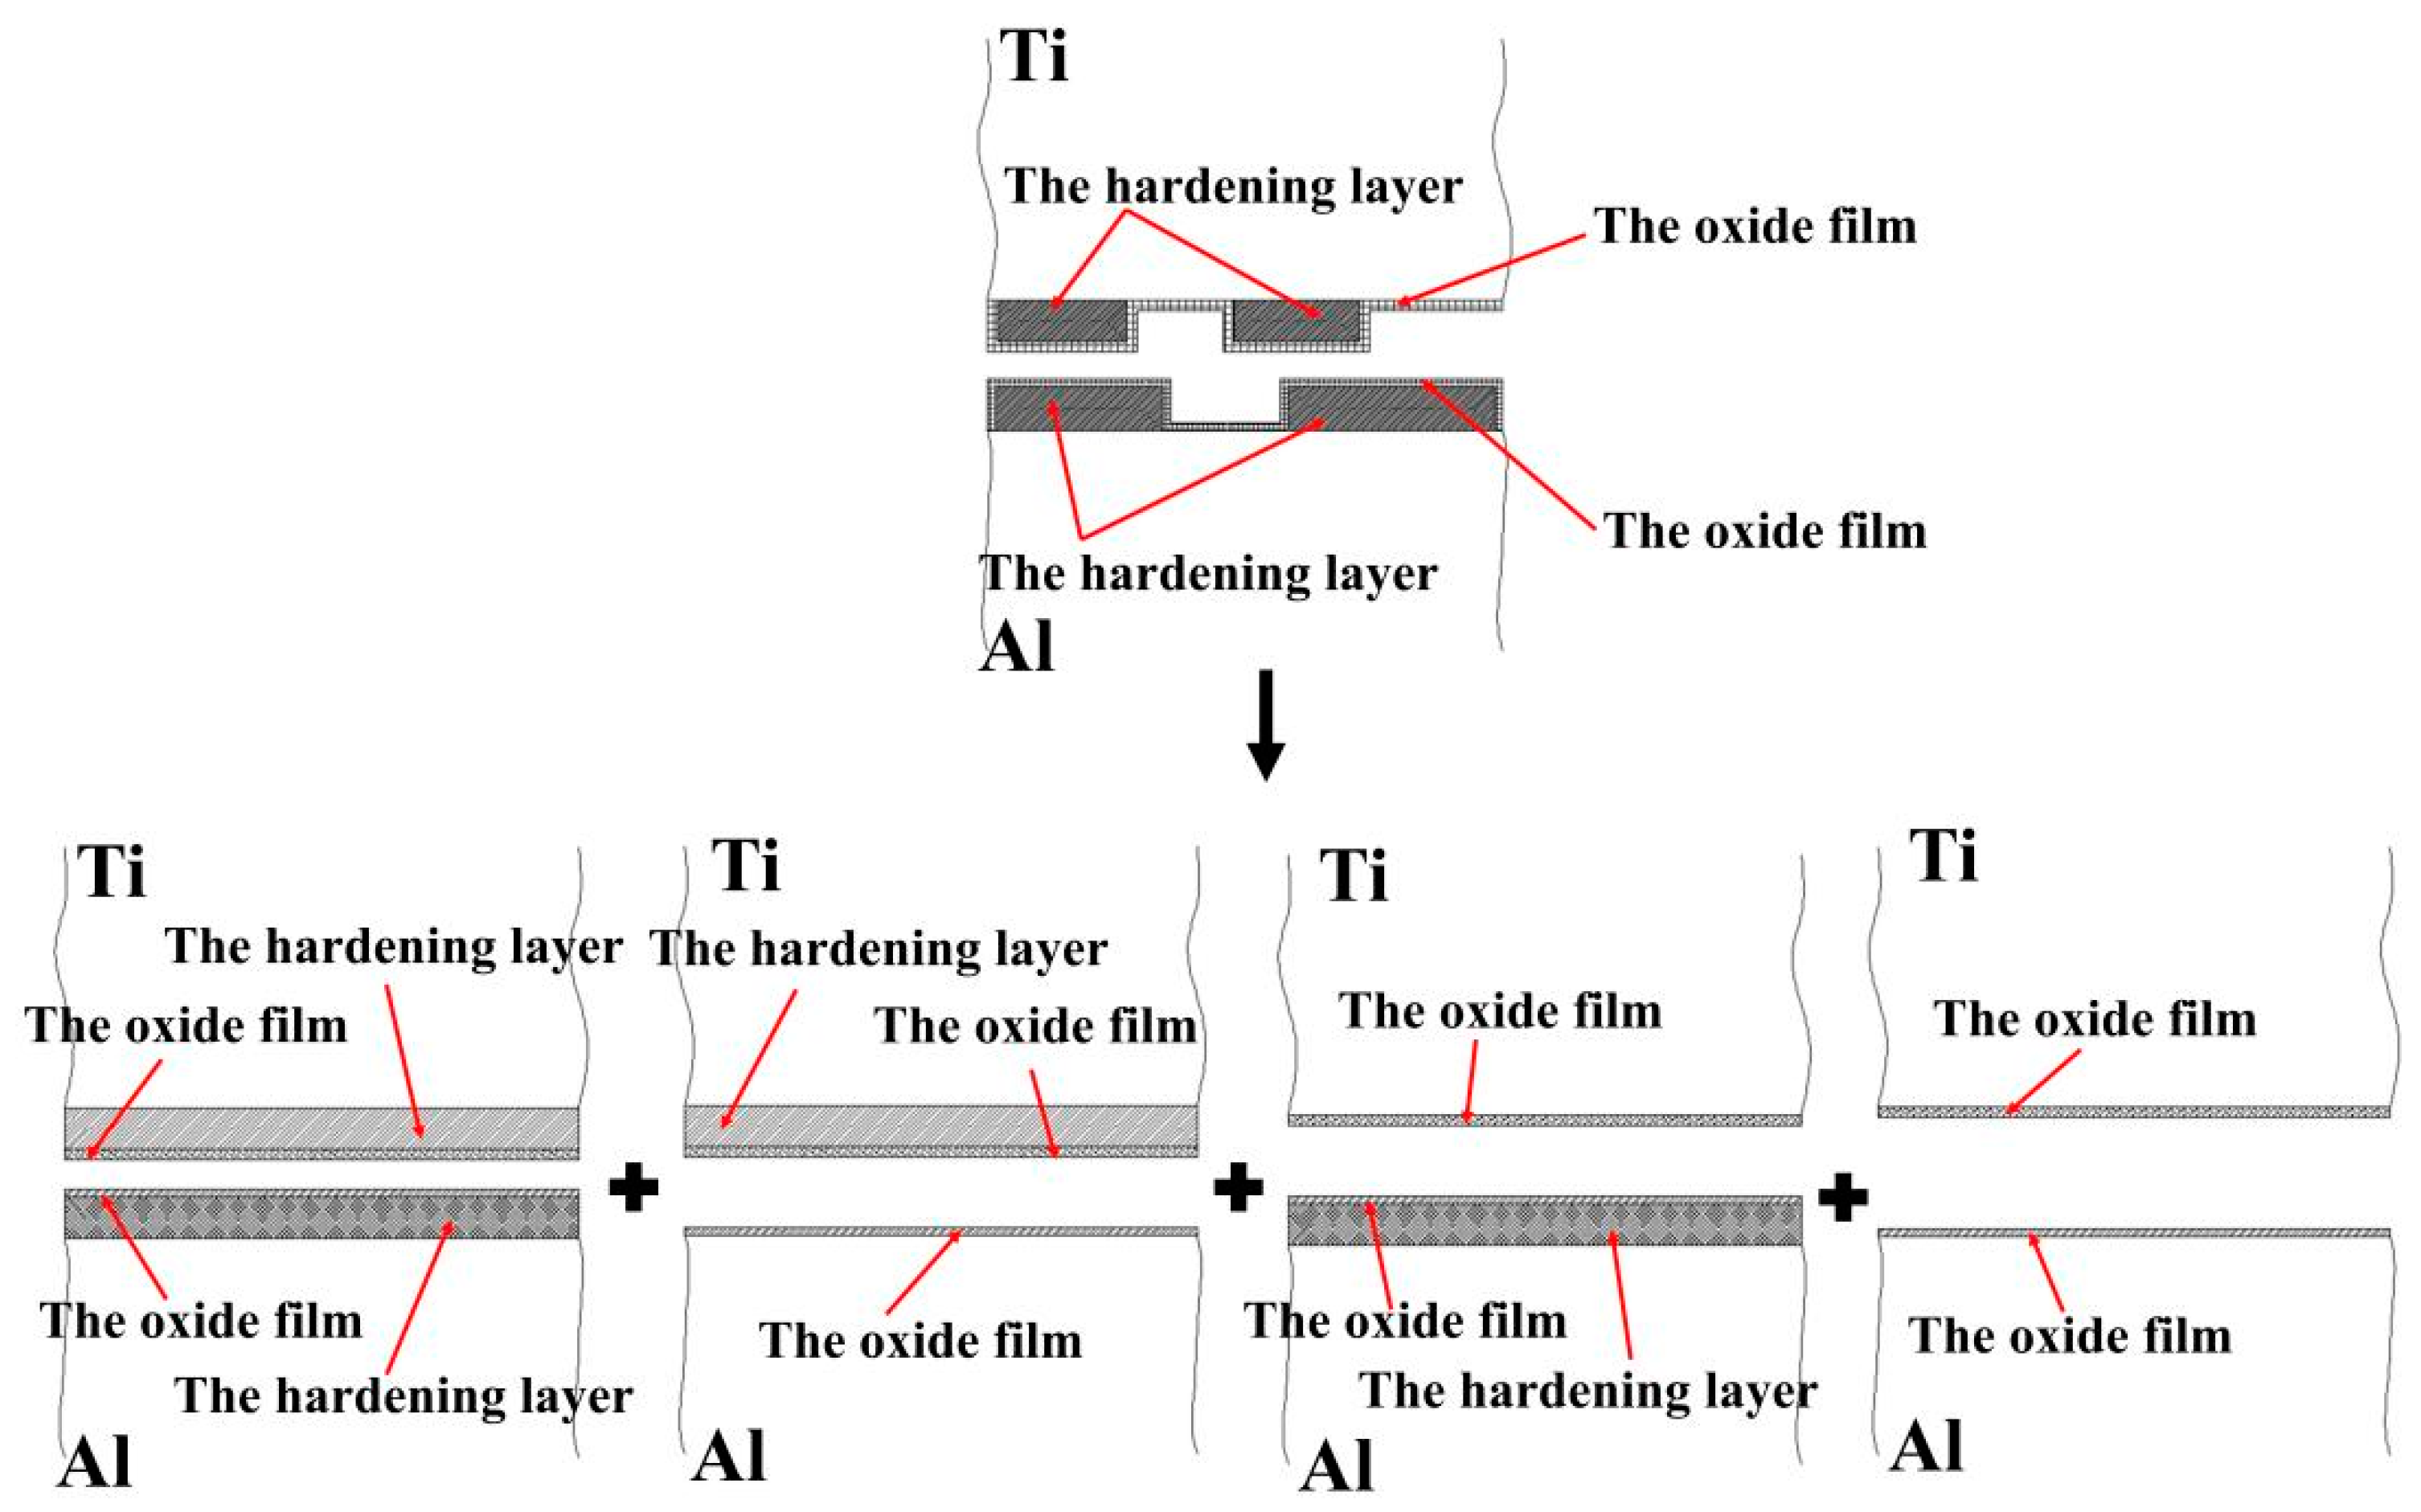
3.7.1. Fracture of the Hardening Layer and Oxide Film under the Rolling Pressure

The following assumptions should be made. First, after wire brushing, the covering layers are composed of a hardening layer and an oxide film. The oxide film is divided into two types: one is attached to the surface of the hardening layer, and the other is attached to the surface of the base metal, i.e., the area of the covering layer other than the hardening layer. Second, the hardening layer with an oxide film on its surface is broken together with the oxide film under the action of rolling pressure. Third, because the hardening layer and oxide film fragments are very short relative to the roll diameter, the roll surface, hardening layer and oxide film surface can be simulated as flat.
Assuming that the percentage of the hardening layer on the surface of the titanium layer is ψ, the percentage of the oxide film on the surface of the titanium layer (deducting the oxide film attached to the surface of the hardening layer) is 1−ψ. Moreover, assuming that the percentage of the hardening layer on the surface of the aluminium layer is ϕ, then the percentage of the oxide film on the surface of the aluminium layer (deducting the oxide film attached to the surface of the hardening layer) is 1−ϕ. The real contact state between the surfaces of the titanium and aluminium layers can be equivalent to the superposition of four types, i.e., the whole hardening layer (WHL) on the surface of titanium/WHL on the surface of aluminium (type I), WHL on the surface of titanium/the oxide film on the surface of aluminium (type II), oxide film on the surface of titanium/WHL on the surface of aluminium (type III), and oxide film on the surface of titanium/the oxide film on the surface of aluminium (type IV), as shown in Figure 26. The aforementioned WHL consists of the hardening layer and the oxide film attached to it on the surface of the corresponding layer, and the oxide film mentioned in the above four types is the oxide film attached to the substrate. Take type I as an example to analyse the fracture of the hardening layer and oxide film, as shown in Figure 27.
The characteristic length of WHL on the surface of the titanium layer is λ 1 c , the thickness of the hardening layer and the oxide film on its surface are t c h and t c o , respectively, and the shear stress values between the substrate titanium and WHL have the opposite direction at neutral point C. The characteristic length of WHL on the surface of the aluminium layer is λ 1 b , the thickness of the hardening layer and the oxide film on its surface are t b h and t b o , respectively, and the shear stress between the substrate aluminium and WHL has the opposite direction at neutral point F. The existence of shear stress will produce longitudinal stress in WHL, and it is assumed that the longitudinal stress is constant along the thickness direction of WHL.
The equilibrium equation of WHL on the titanium layer along the longitudinal direction can be written as Equation (1):
τ A C L A C = τ 1 μ λ 1 c + τ C B L C B
where L A C + L C B = λ 1 c , the position of the neutral point can be obtained, i.e.,
L C B = λ 1 c τ A C τ 1 μ τ A C + τ C B
The maximum tensile stress in WHL appears at neutral point C, where the longitudinal stress state is shown in Figure 28. The equilibrium equation in the longitudinal direction of section CB can be written as Equation (3):
σ 1 c t c h + t c o = L C B τ C B + τ 1 μ
Combining Equations (2) and (3), the maximum longitudinal tensile stress in WHL is
σ 1 c = λ 1 c τ C B + τ 1 μ τ A C τ 1 μ t c h + t c o τ A C + τ C B
Let τ A C = τ C B = τ 1 c , we can obtain
σ 1 c = λ 1 c τ 1 c + τ 1 μ τ 1 c τ 1 μ 2 t c h + t c o τ 1 c
When the maximum longitudinal tensile stress reaches its tensile strength, WHL will break. At neutral point C, the plane strain Mises yield criterion is satisfied, which can be expressed as
σ 1 c + P = 2 t c h t c h + t c o k c h + t c o t c h + t c o k c o
Assume that τ 1 c = k T i , τ 1 μ = μ 1 P = μ 1 Y T i = 2 μ 1 k T i , where k T i and Y T i are the shear yield stress and plane strain yield stress of the titanium substrate, respectively. Combined with Equations (5) and (6), the maximum aspect ratio of the WHL fragment is
λ 1 c t c h + t c o = 4 t c h t c h + t c o k c h + t c h t c h + t c o k c o / k T i 1 1 4 μ 1 2
According to this analysis method, the maximum aspect ratio of the WHL fragment on the aluminium layer is
λ 1 b t b o + t b h = 4 t b o t b o + t b h k b o + t b h t b o + t b h k b h / k A l k T i k A l 1 4 μ 1 2 k T i k A l 2
Similarly, the maximum aspect ratio of WHL or oxide film fragments on the surface of titanium and aluminium layers of types II, III and IV can be obtained as follows:
Type II: The maximum aspect ratio of the WHL fragment on the surface of the titanium layer is
λ 2 c t c h + t c o = 4 t c h t c h + t c o k c h + t c h t c h + t c o k c o / k T i 1 1 4 μ 2 2
The maximum aspect ratio of the oxide film fragment on the surface of the aluminium layer is
λ 2 b t b o = 4 k b o k A l k T i k A l 1 4 μ 2 2 k T i k A l 2
where λ 2 c and λ 2 b are the characteristic lengths of WHL and oxide film fragments on the surface of the titanium and aluminium layers, respectively; μ 2 is the friction coefficient between WHL on the surface of the titanium layer and the oxide film on the surface of the aluminium layer.
Type III: the maximum aspect ratio of the oxide film fragment on the surface of the titanium layer is
λ 3 c t c o = 4 k c o k T i 1 1 4 μ 3 2
The maximum aspect ratio of the WHL fragment on the surface of the aluminium layer is
λ 3 b t b o + t b h = 4 t b o t b o + t b h k b o + t b h t b o + t b h k b h / k A l k T i k A l 1 4 μ 3 2 k T i k A l 2
where λ 3 c and λ 3 b are the characteristic lengths of the oxide film and WHL fragments on the surface of the titanium and aluminium layers, respectively; μ 3 is the friction coefficient between the oxide film on the surface of the titanium layer and WHL on the aluminium layer.
Type IV: the maximum aspect ratio of the oxide film fragment on the surface of the titanium layer is
λ 4 c t c o = 4 k c o k T i 1 1 4 μ 4 2
The maximum aspect ratio of the oxide film fragment on the surface of the aluminium layer is
λ 4 b t b o = 4 k b o k A l k T i k A l 1 4 μ 4 2 k T i k A l 2
where λ 4 c and λ 4 b are the characteristic lengths of the oxide film fragments on the surface of titanium and aluminium, respectively; μ 3 is the friction coefficient between the oxide film on the surface of the titanium layer and that on the surface of the aluminium layer.
Therefore, the maximum aspect ratio of the WHL fragment on the surface of the titanium layer at the real facing surfaces is
λ c t c h + t c o = ψ ϕ 4 t c h t c h + t c o k c h + t c h t c h + t c o k c o / k T i 1 1 4 μ 1 2 + ψ 1 ϕ 4 t c h t c h + t c o k c h + t c h t c h + t c o k c o / k T i 1 1 4 μ 2 2
The maximum aspect ratio of the oxide film fragment on the surface of the titanium layer at the real facing surfaces is
λ c t c o = 1 ψ ϕ 4 k c o k T i 1 1 4 μ 3 2 + 1 ψ 1 ϕ 4 k c o k T i 1 1 4 μ 4 2
The maximum aspect ratio of the WHL fragment on the surface of the aluminium layer at the real facing surfaces is
λ b t b o + t b h = ψ ϕ 4 t b o t b o + t b h k b o + t b h t b o + t b h k b h / k A l k T i k A l 1 4 μ 1 2 k T i k A l 2 + 1 ψ ϕ 4 t b o t b o + t b h k b o + t b h t b o + t b h k b h / k A l k T i k A l 1 4 μ 3 2 k T i k A l 2
The maximum aspect ratio of the oxide film fragment on the surface of the aluminium layer at the real facing surfaces is
λ b t b o = ψ 1 ϕ 4 k b o k A l k T i k A l 1 4 μ 2 2 k T i k A l 2 + 1 ψ 1 ϕ 4 k b o k A l k T i k A l 1 4 μ 4 2 k T i k A l 2

3.7.2. Microscopic Extrusion of Metal through Cracks

When the WHL or oxide film breaks, the bottom fresh metal will flow to the crack when subjected to rolling pressure. The above Ti/Al interface shows that metal aluminium is continuously embedded into the titanium side. Therefore, it is considered that the fresh metal on each side meets the crack of the WHL or oxide film on the titanium side. The plastic strains in the longitudinal and thickness directions to crack the WHL or oxide film in types I, II, III, and IV are ε R 1 , ε R 2 , ε R 3 and ε R 4 , and ε N 1 , ε N 2 , ε N 3 and ε N 4 , respectively. The corresponding spacing of the WHL or oxide film fragment is λ 1 , λ 2 , λ 3 and λ 4 , and the reductions of titanium in the composite sheet are r 1 , r 2 , r 3 and r 4 .
Taking type I as an example, the extrusion rate of fresh metal in a crack is given; then, the extrusion rate of fresh metal in a crack for the real facing surfaces is given. The model of metal extrusion through the crack of WHL on the surface of the titanium layer in type I is shown in Figure 29. P 1 c and P 1 are the pressure exerted on the WHL fragment and mean contact pressure, respectively. δ is the extrusion depth of fresh metal in the crack.
The longitudinal strain of the titanium substrate can be expressed by the characteristic length of the WHL fragment λ 1 c and the spacing of the WHL fragment λ 1 , i.e.,
ε R 1 = λ 1 λ 1 c λ 1 c
The plastic strain in the thickness direction ε N 1 is related to r 1 , i.e.,
ε N 1 = r 1
The metal in the rolling process can be considered a volume-incompressible material, i.e., the volume remains unchanged, so the following is obtained:
λ 1 h = λ 1 c h 0
where h and h 0 are the thicknesses of the titanium layer before and after cold rolling, respectively. Combining Equations (19) and (20), we obtain
ε R 1 = r 1 1 r 1
Sutcliffe [22] gave a dimensionless extrusion rate W 1 , which is a function of the area ratio of WHL fragments ( λ 1 / λ 1 c ) and the difference in pressures on the WHL and on the extruding material ( Δ P = P 1 c P v / Y T i ). P v is the pressure exerted on the surface of the extruded metal in the crack, and the specific expression of the extrusion rate is
W 1 = 2 v f λ 1 ε ˙ R 1 = W 1 λ 1 λ 1 c , Δ P
where v f = d δ / d t is the extrusion velocity. Therefore, the nominal extrusion depth of fresh metal (the ratio of extrusion depth of fresh metal with respect to WHL thickness) can be obtained as follows:
δ t c o + t c h = λ 1 c 2 t c o + t c h 0 ε R 1 W 1 1 + ε d ε = λ 1 c 2 t c o + t c h 0 r 1 1 r 1 W 1 1 + ε d ε
Since the pressure exerted on the surface of the extruded metal is 0, the following can be obtained:
Δ P = P 1 c Y T i = P 1 λ 1 c Y T i λ 1
Johnson [23] reported that the nominal mean pressure ( P 1 / Y T i , where Y T i is the plane strain yield stress of the titanium substrate) was only related to the position in the roll bite and indirectly related to the longitudinal strain, and the contact area ratio ( λ 1 / λ 1 c ) was related to the longitudinal strain. Therefore, the dimensionless extrusion rate is only related to the longitudinal strain. Through integration, the relationship between the nominal extrusion depth of fresh metal and the thickness reduction of the titanium layer can be expressed.
Let δ t T i T i , i and δ t T i A l , i be the nominal extrusion depth of fresh metal titanium and aluminium in the crack of WHL or oxide film fragment on the surface of titanium layer for type i ( i = I , II , III , IV ), respectively, and let ε A l , i be the longitudinal strain of substrate aluminium in type i . Thus, the nominal extrusion depth of fresh metal in the crack of WHL on the surface of the titanium layer for type I is
δ t c h + t c o I = δ t T i T i , I + δ t T i A l , I = λ 1 c 2 t c h + t c o 0 ε A l , I 1 + ε W T i T i , I d ε + ε I ε R 1 1 + ε W T i A l , I d ε
Similarly, the nominal extrusion depth of fresh metal in the crack of WHL on the surface of the titanium layer for type II is
δ t c h + t c o I I = δ t T i T i , I I + δ t T i A l , I I = λ 1 c 2 t c h + t c o 0 ε A l , I I 1 + ε W T i T i , I I d ε + ε I I ε R 2 1 + ε W T i A l , I I d ε
In type III, the nominal extrusion depth of fresh metal in the crack of the oxide film fragment on the surface of the titanium layer is
δ t c o I I I = δ t T i T i , I I I + δ t T i A l , I I I = λ 1 c 2 t c o 0 ε A l , I I I 1 + ε W T i T i , I I I d ε + ε I I I ε R 3 1 + ε W T i A l , I I I d ε
In type IV, the nominal extrusion depth of fresh metal in the crack of the oxide film fragment on the surface of the titanium layer is
δ t c o I V = δ t T i T i , I V + δ t T i A l , I V = λ 1 c 2 t c o 0 ε A l , I V 1 + ε W T i T i , I V d ε + ε I V ε R 4 1 + ε W T i A l , I V d ε
To form the initial bonding, the bottom fresh metal must meet through cracks. When the rolling pressure acts on the surface of the composite sheet, there will be three bonding areas on the bonding surface for each type of contact state: A, B and C. Area B hinders the bonding, area C is a weak bonding, and area A is the position where the initial bonding is formed (Figure 30). Because the real contact surface is composed of four types of contact states, under a certain reduction, the formation of bonding by the bottom fresh metal through the cracks depends on the nominal extrusion depth under four types of contact states. Meanwhile, the order of appearance of the four types of contact states for the real contact surface must be considered, which will affect the opening of fresh metal flow through the crack with increasing rolling pressure.

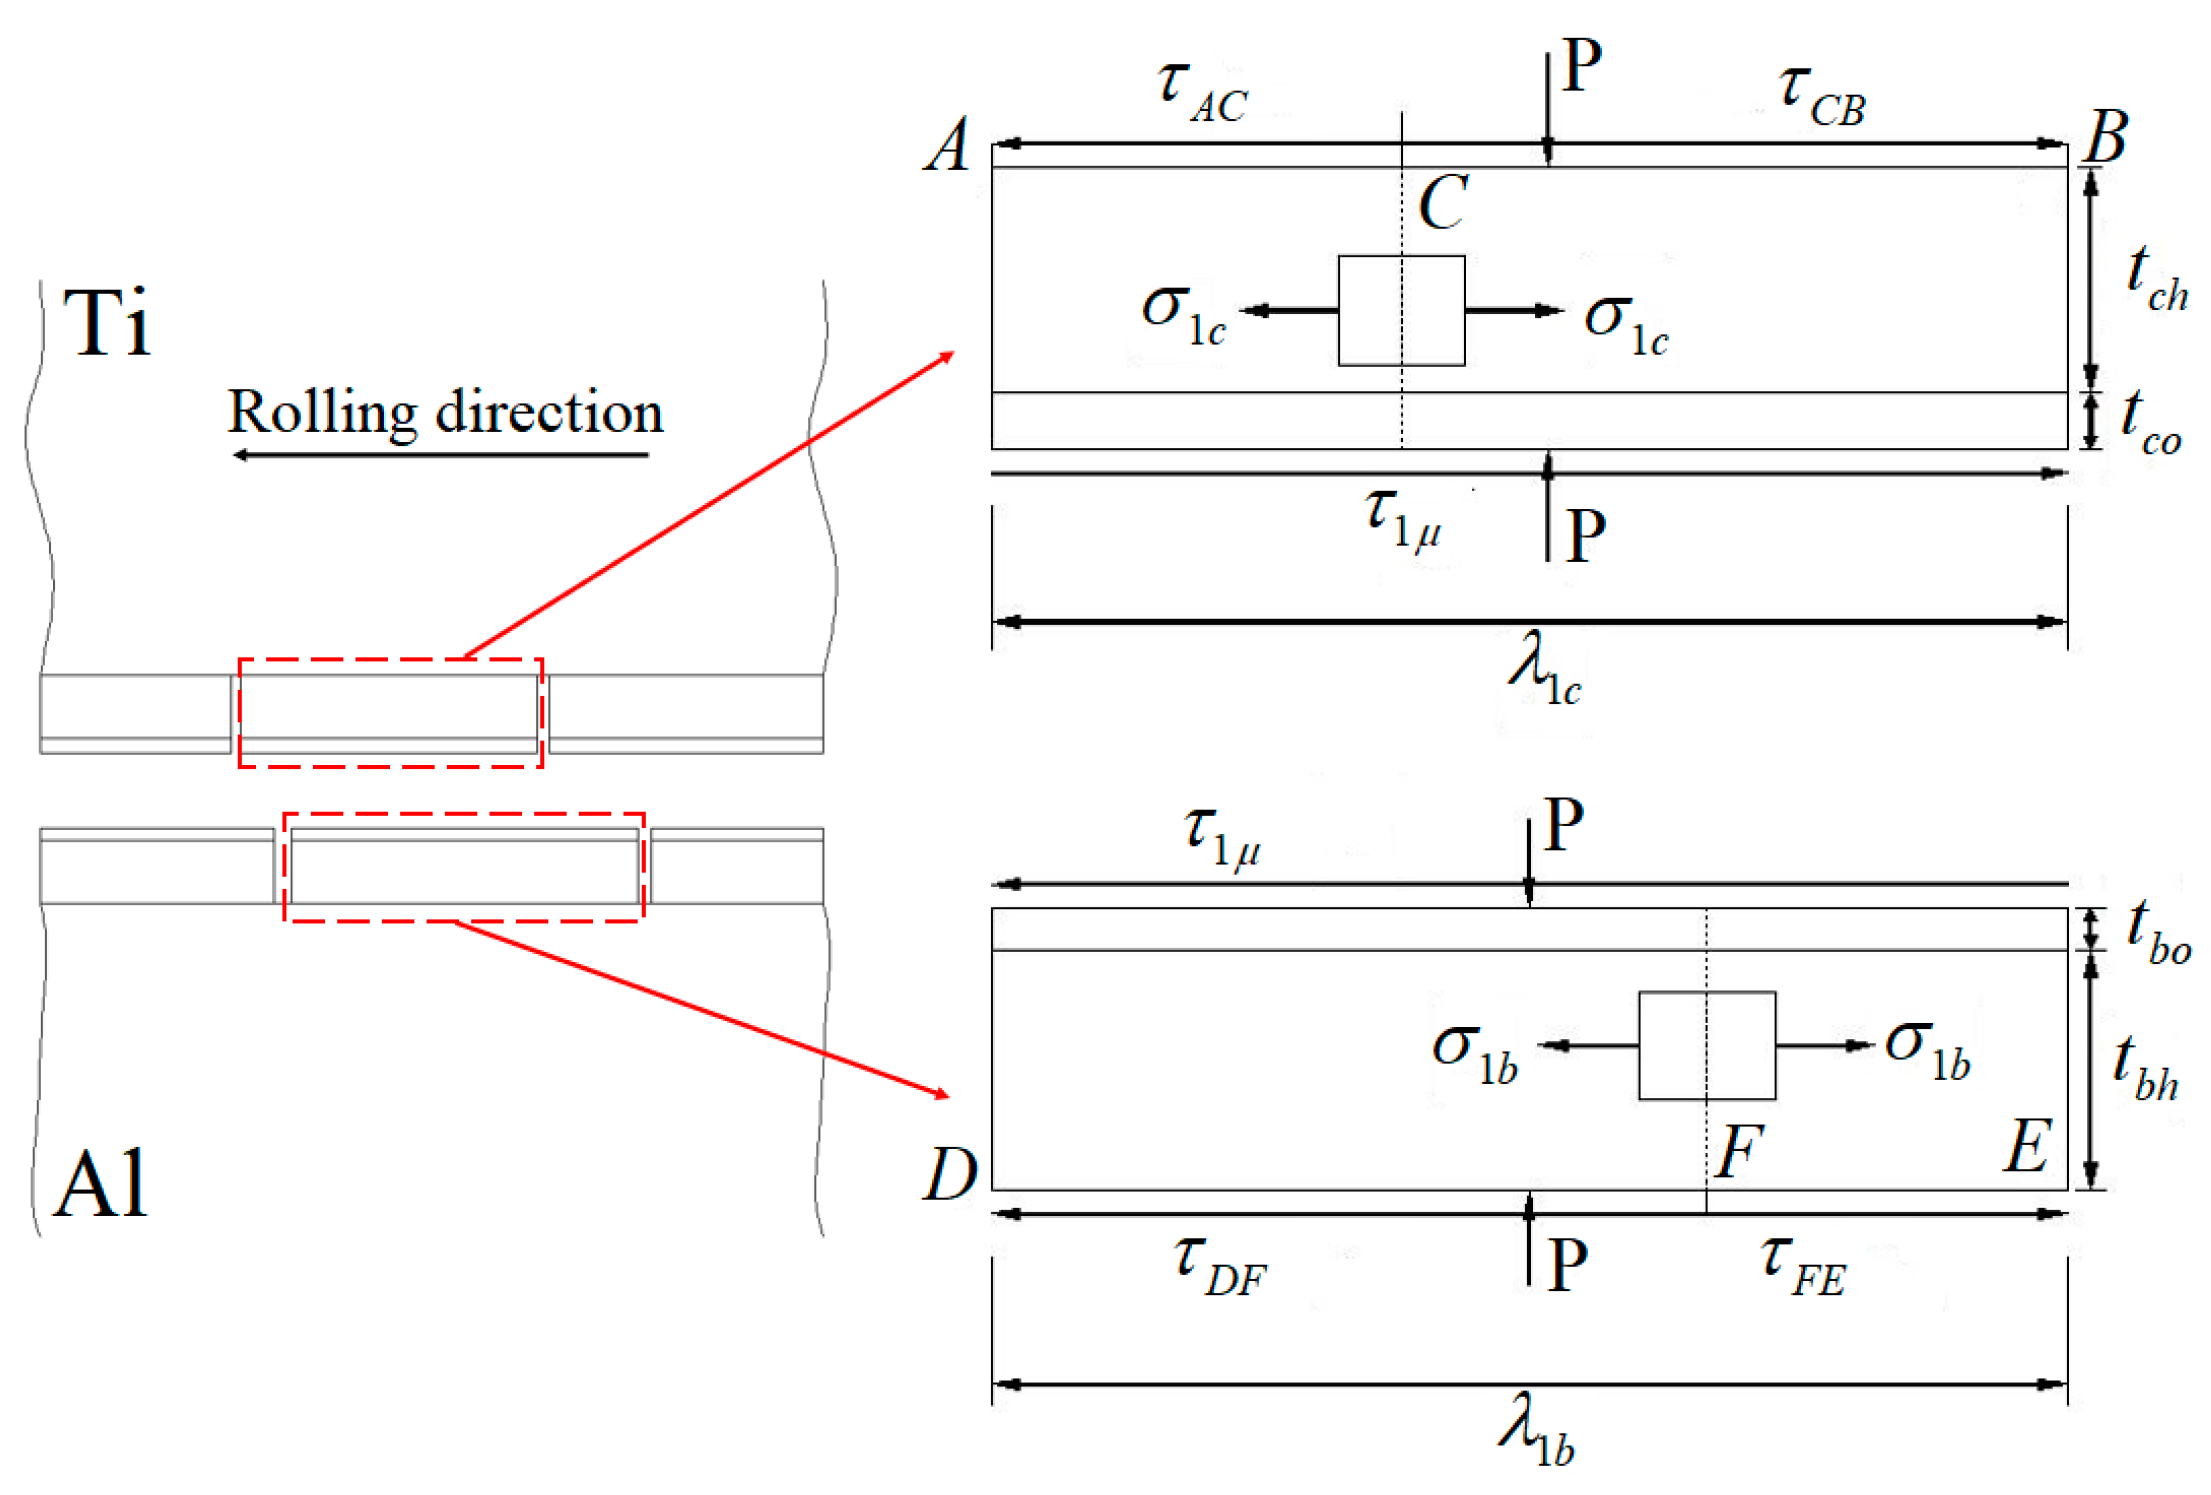
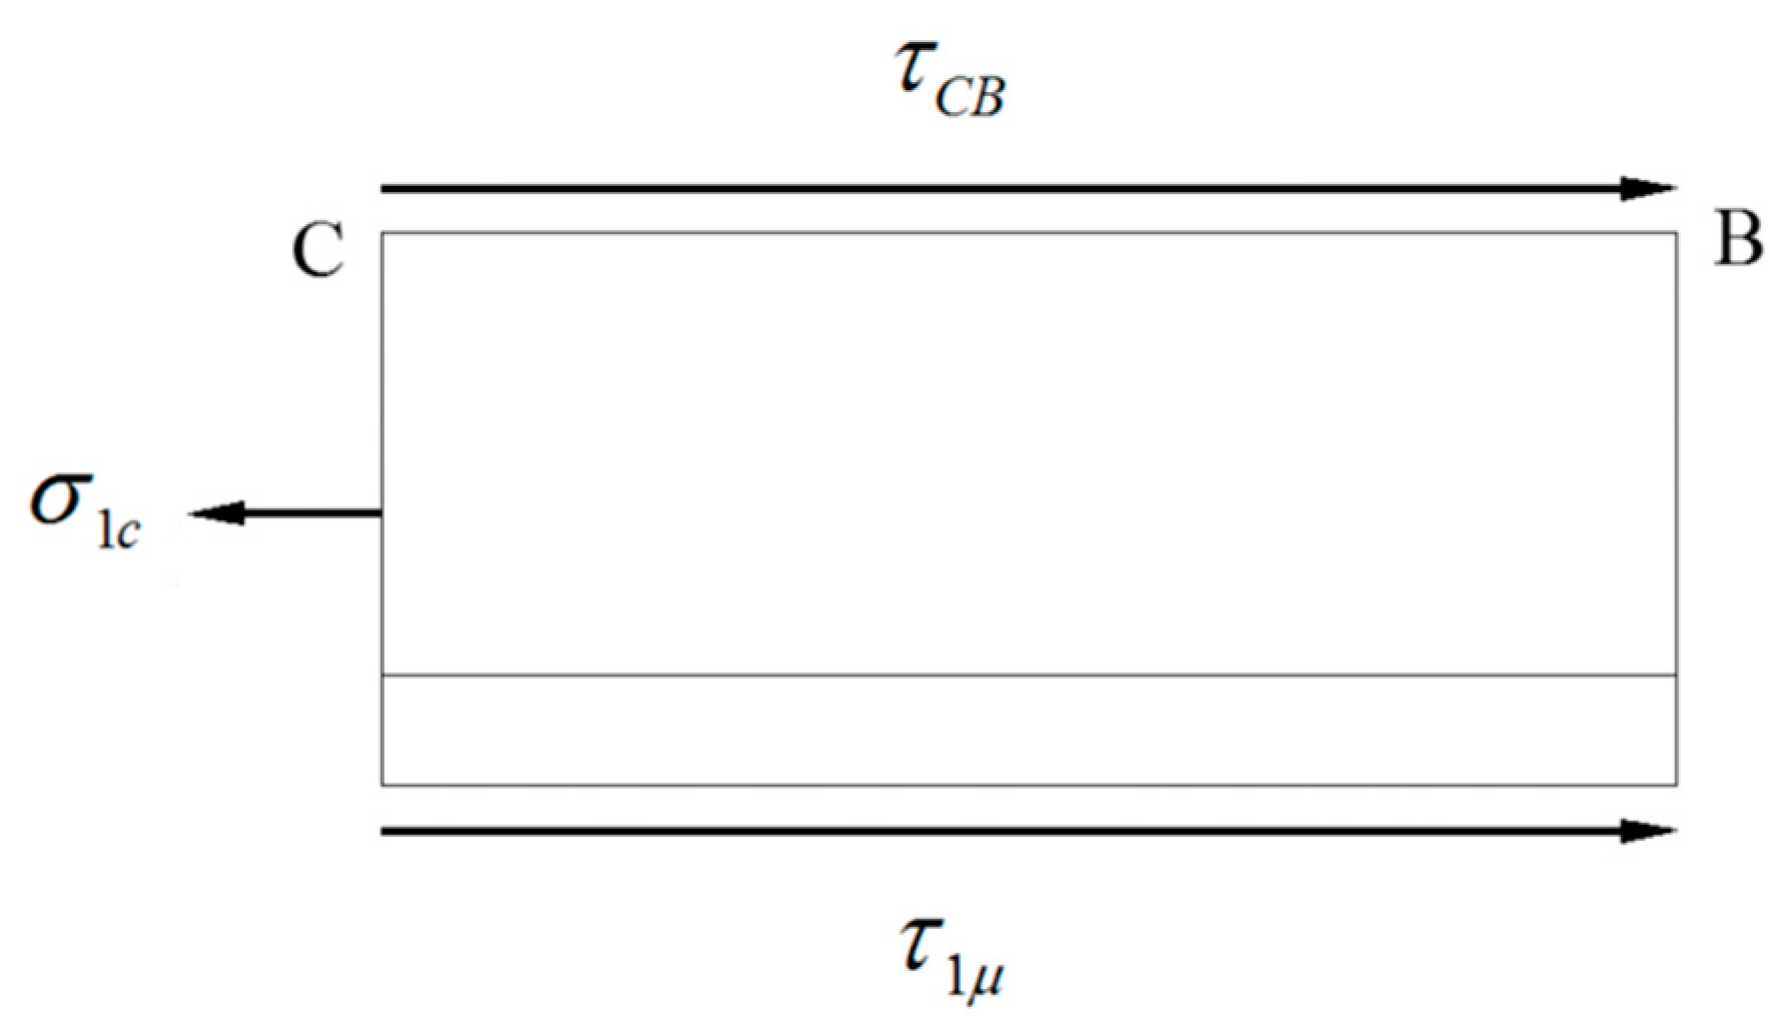
3.7.3. Interfacial Bonding Mechanics of the Ti/Al Clad by the Cold Roll Bonding Process

When the rolling pressure acts on the Ti/Al composite sheet, because the aluminium layer has greater reduction, the oxide film on its surface breaks first. At this time, the bottom fresh aluminium begins to flow to the crack, and the flow velocity is relatively small. With the deformation progress, the WHL on the surface of the aluminium layer is broken, and the flow velocity of the bottom fresh aluminium is accelerated. When the deformation reaches a certain value, the corresponding oxide film and WHL on the surface of the titanium layer break; then, the bottom fresh titanium starts to flow, and it has a lower flow velocity than aluminium. Therefore, there will be 12 bonding areas on the real contact surface, of which only four bonding areas in form A are called strong bonding. As previously mentioned, the initial bonding between the titanium and aluminium depends on the bonding area of A. When all four strong bonding areas are formed, the entire bonding process is complete. The interfacial bonding strength of the Ti/Al composite sheet depends on the area and strength of the strong bonding areas because there is aluminium on the titanium side of the peeling surface, while there is almost no titanium on the aluminium side of the peeling surface. Although the titanium side of the peeling surface for specimen B has more aluminium residue than the other two composite sheets with aluminium pre-strengthening, the strength of the aluminium is small, which results in the small bonding strength. Thus, the main factor that affects the bonding strength of the Ti/Al cold-rolled composite sheet is the strength of the aluminium in bonding area A, and the area of bonding area A is the secondary factor.

4. Conclusions

In this study, the influence of the initial strength of aluminium on the change rule of interfacial bonding strength and the deformation coordination between titanium and aluminium are analysed. Meanwhile, combined with the peeling surface morphology, characteristics of the bonding interface, microstructure and texture near the interface, fracture of the oxide film and hardening layer, and metal extrusion model, the bonding mechanism of the Ti/Al cold-rolled composite sheet is described. The results are as follows:
(1)
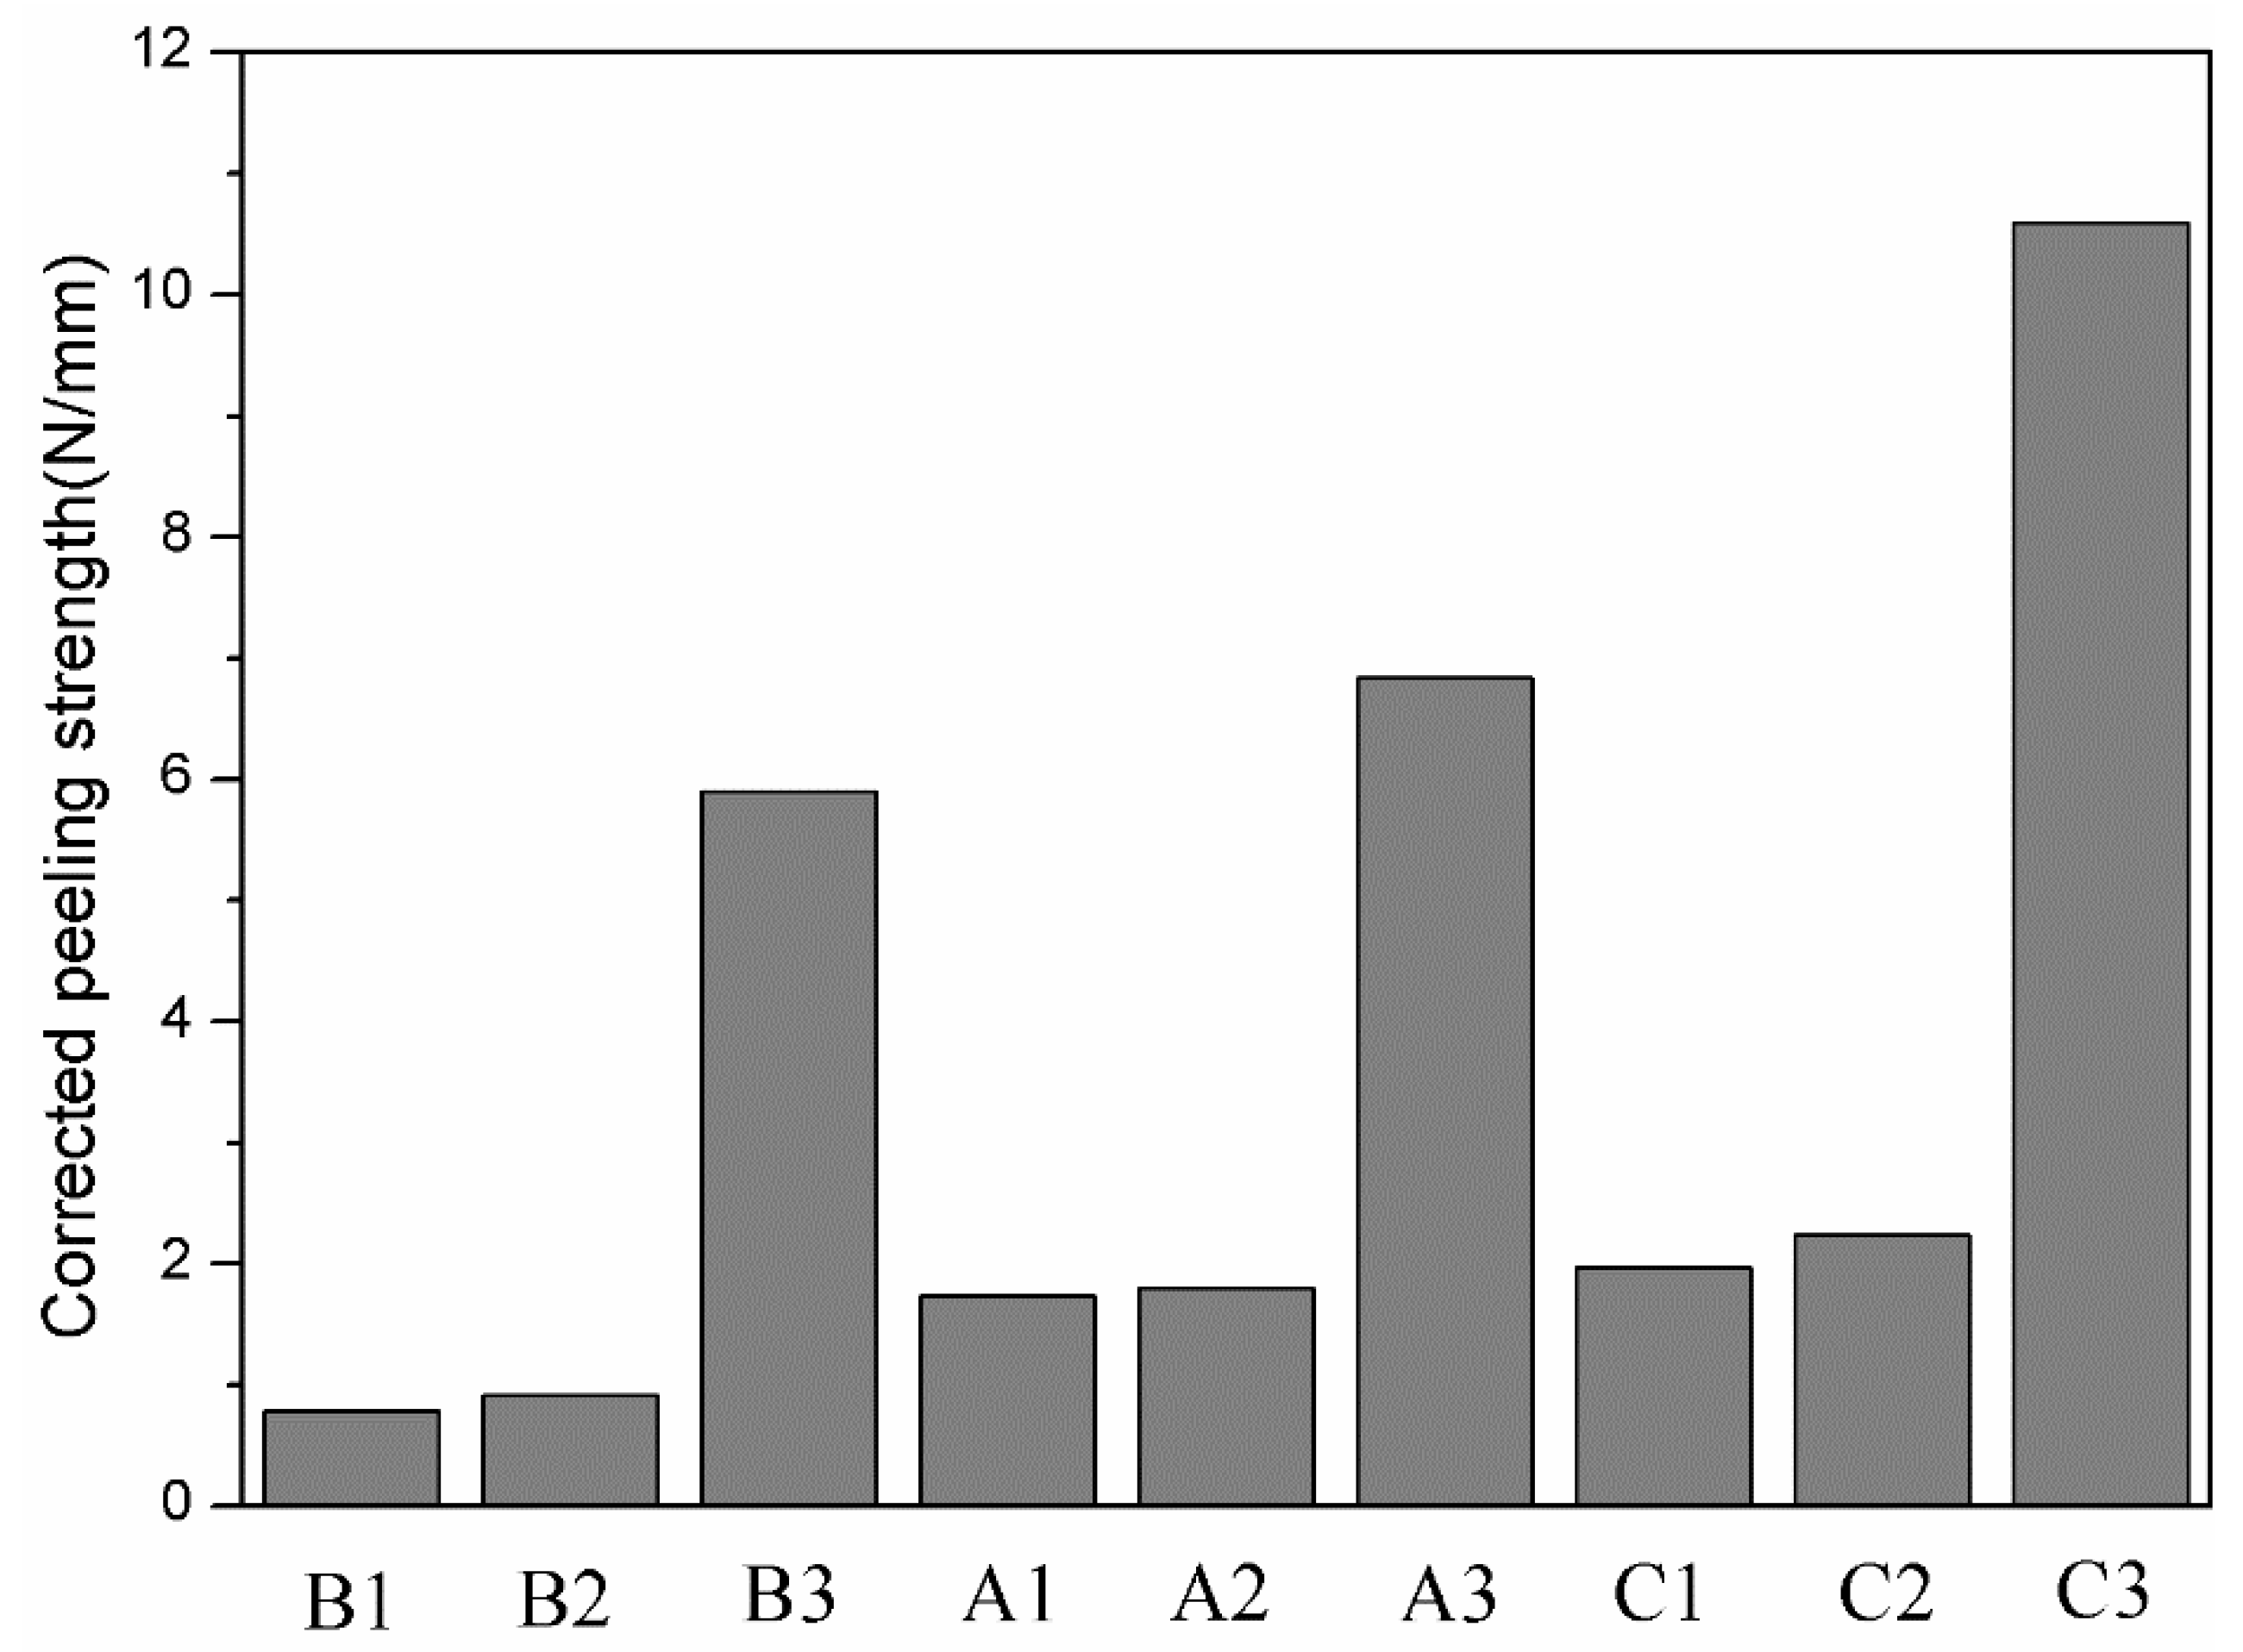
The peel strength of the Ti/Al composite sheet increases with increasing rolling reduction. At the same reduction, the Ti/Al composite sheet with initial aluminium pre-strengthening has higher peel strength, especially at a large reduction.
(2)
With the increase in rolling reduction, the deformation coordination between titanium and aluminium tends to improve. The deformation coordination of the Ti/Al composite sheet with initial aluminium pre-strengthening is better, which is related to the strain hardening of titanium and aluminium.
(3)
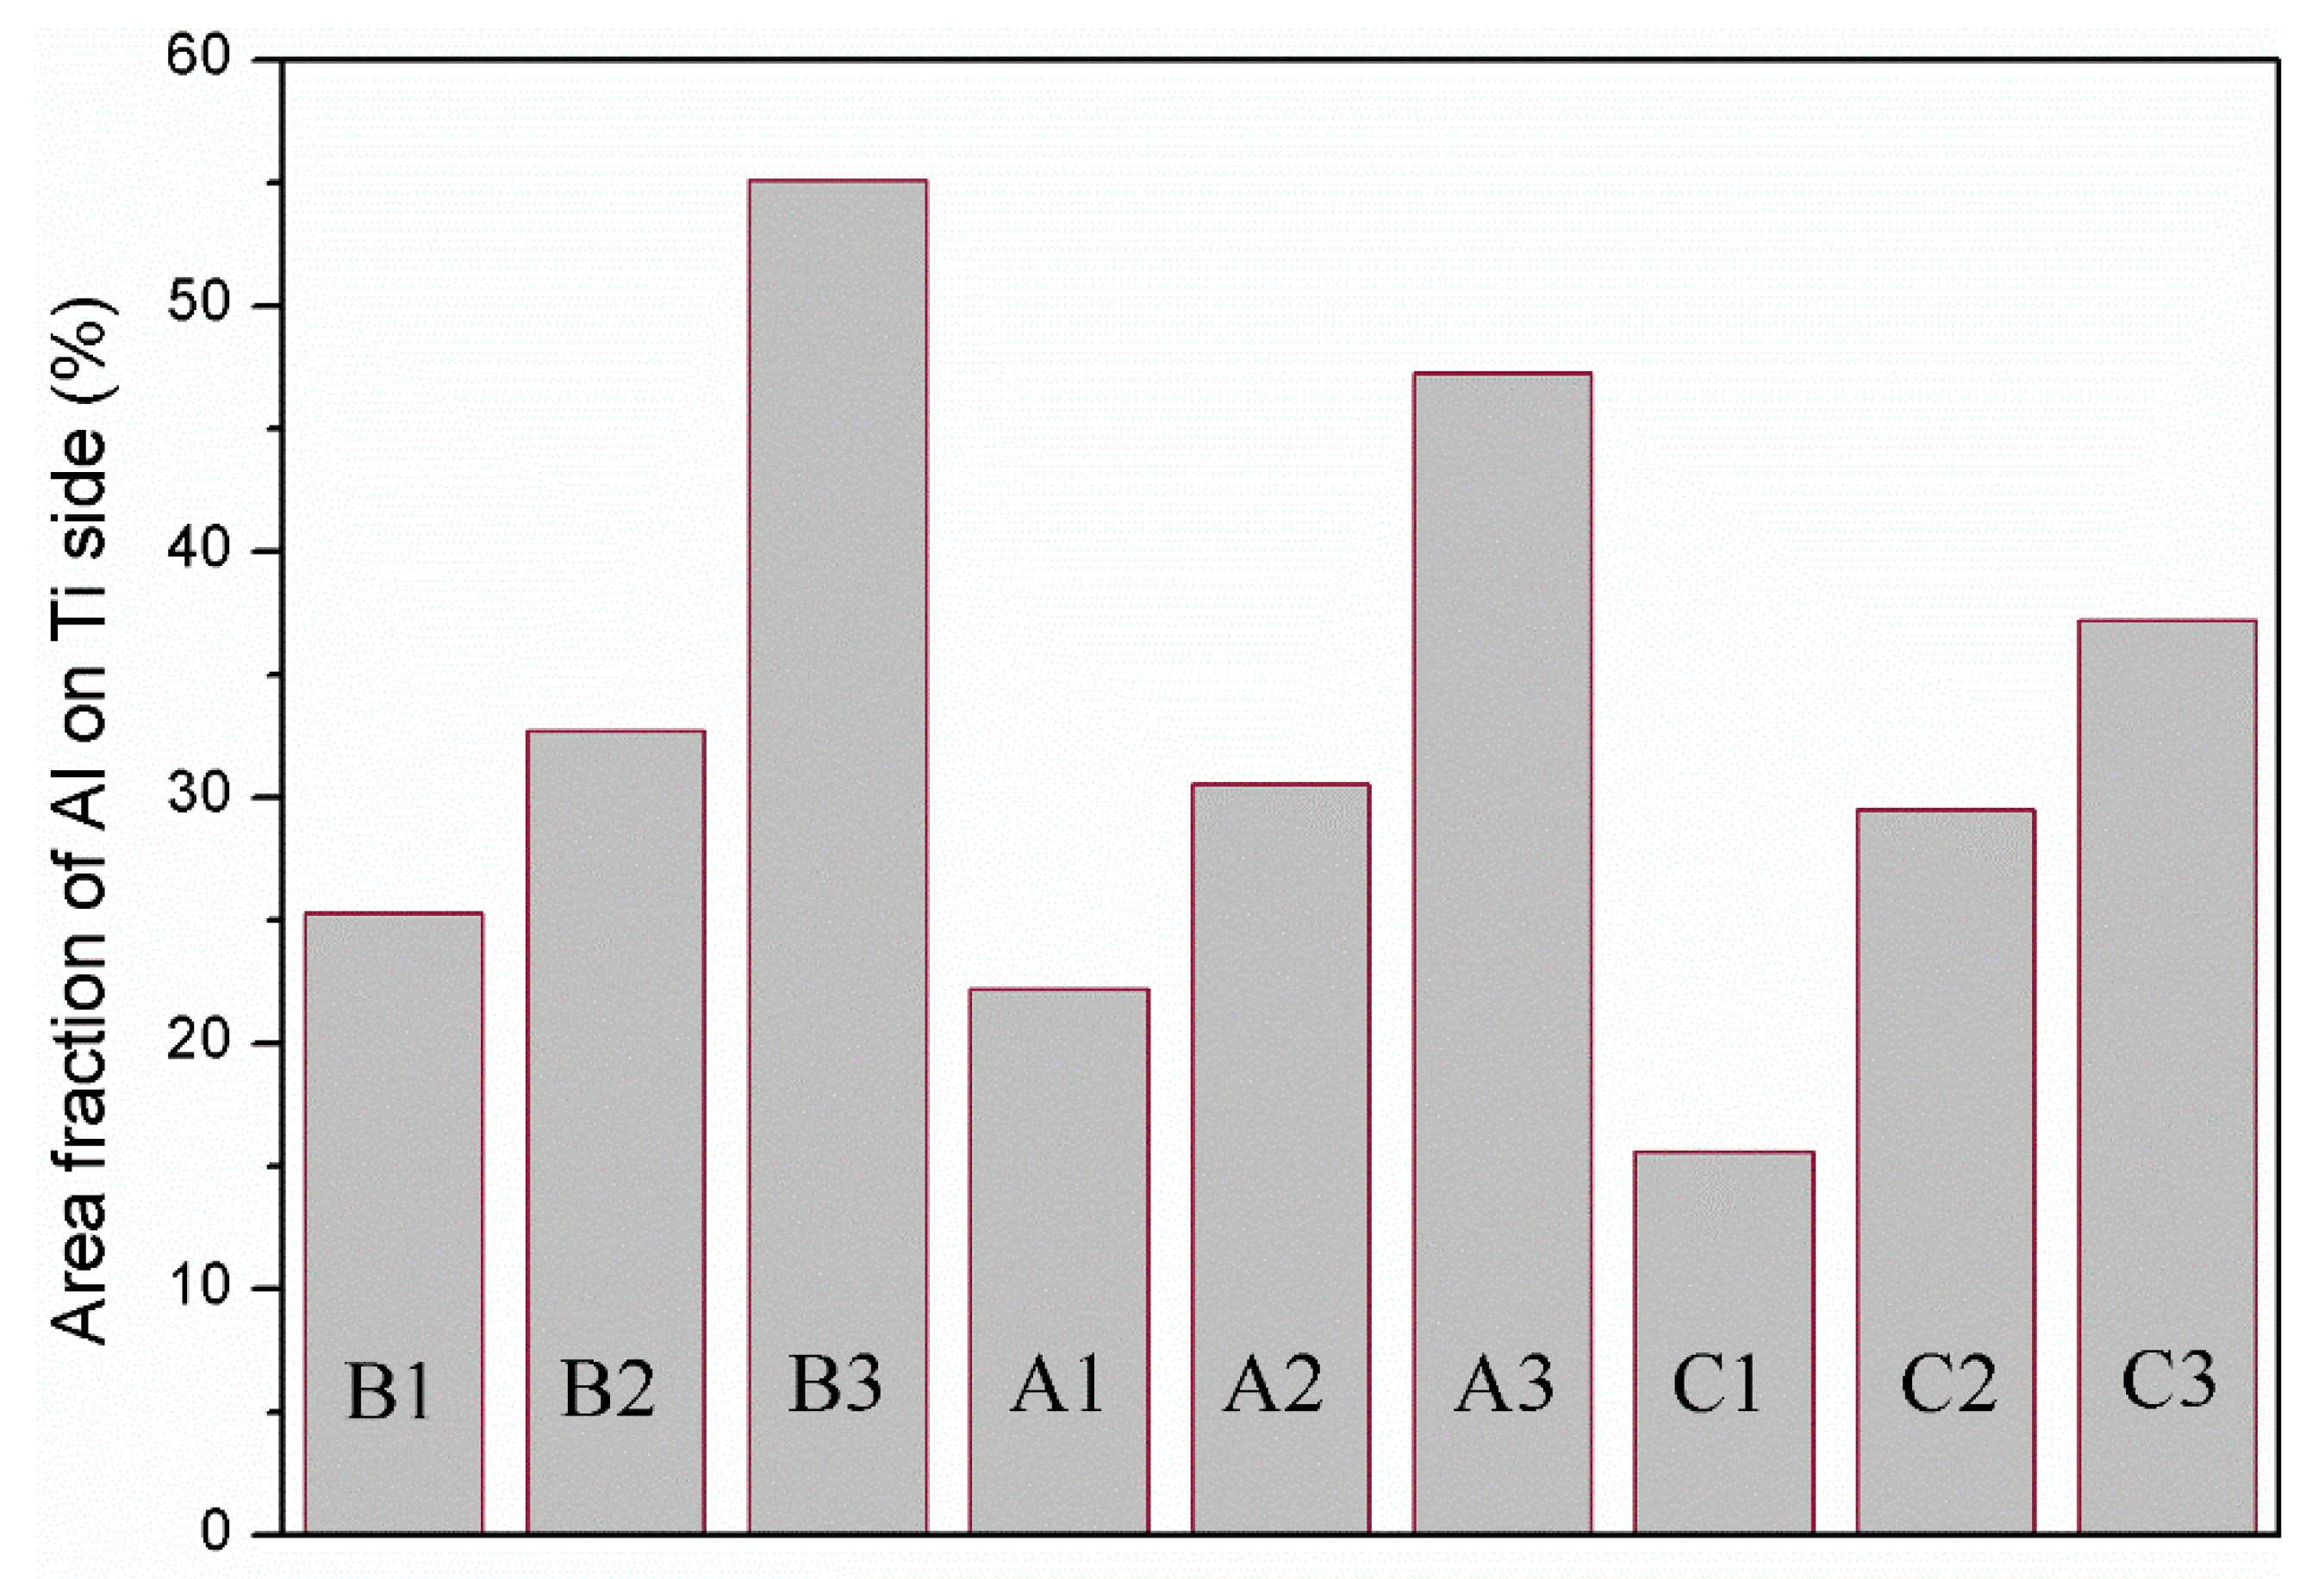
The peeling surfaces of Ti/Al cold-rolled composite sheets have common characteristics: there is aluminium residue on the titanium side, but there is almost no titanium residue on the aluminium side. For Ti/Al composite sheets with an identical initial strength of aluminium, greater reduction corresponds to more aluminium residue on the titanium side. For Ti/Al composite sheets under the same reduction, a greater initial strength of the aluminium corresponds to less aluminium residue on the titanium side.
(4)
When the reduction is below 42%, the crack gap at the interface is several microns. When the reduction is 50%, the crack gap becomes larger with an average of 10~40 μm, the interface presents a sawtooth shape, and a shear deformation zone at 45° to the interface is formed on the titanium side near the interface.
(5)
The activation of twins in the titanium layer is related to the restriction degree of the aluminium and the orientation of the titanium matrix, which affects the microstructure uniformity of the titanium layer. The change degree of the components of twins on the titanium side for the Ti/Al composite sheet with initial aluminium annealing is stronger than that for the Ti/Al composite sheet with initial aluminium pre-strengthening. The strong change in the components of twins may cause the low uniformity of the microstructure on the titanium side.
(6)
A model considering the rupture of the surface oxide film and hardening layer and the metal extrusion process is established. The interfacial bonding strength of the Ti/Al composite sheet depends on the four strong bonding areas. The bonding strength of the Ti/Al composite sheet with aluminium pre-strengthening is higher than that with aluminium annealing. The strength of aluminium in strong bonding areas is the main factor, and the residual aluminium on the peeling surface of the titanium side is the secondary factor.

Author Contributions

Conceptualization and original draft preparation, J.L.; methodology, Q.L. and S.J.; data curation, J.W. (Jiang Wu); review and editing, F.W. and J.W. (Jiang Wang); project administration, X.Z. All authors have read and agreed to the published version of the manuscript.

Funding

The authors would like to thank the Science and Technology Base and Talent Special Project of Guangxi Province, China (AD19245030 and AD20325007), the Guangxi University middle-aged and young teachers’ basic scientific research ability improvement project, China (2021KY0219) and the Guangxi Key Laboratory of Information Materials and Guilin University of Electronic Technology, China (201018Z), for their support.

Institutional Review Board Statement

Not applicable.

Informed Consent Statement

Not applicable.

Data Availability Statement

Not applicable.

Conflicts of Interest

The authors declare no conflict of interest.

References

  1. Ma, M.; Huo, P.; Liu, W.C.; Wang, G.J.; Wang, D.M. Microstructure and mechanical properties of Al/Ti/Al laminated composites prepared by roll bonding. Mater. Sci. Eng. A 2015, 636, 301–310. [Google Scholar] [CrossRef]
  2. Lee, K.S.; Bae, S.J.; Lee, H.W.; Kang, S.H. Interface-correlated bonding properties for a roll-bonded Ti/Al 2-ply sheet. Mater. Charact. 2017, 134, 163–171. [Google Scholar] [CrossRef]
  3. Du, Y.; Fan, G.H.; Yu, T.B.; Hansen, D.; Geng, L.; Huang, X.X. Laminated Ti-Al composites: Processing, structure and strength. Mater. Sci. Eng. A 2016, 673, 572–580. [Google Scholar] [CrossRef] [Green Version]
  4. Mo, T.Q.; Chen, J.; Chen, Z.J.; He, W.J.; Liu, Q. Microstructure Evolution During Roll Bonding and Growth of Interfacial Intermetallic Compounds in Al/Ti/Al Laminated Metal Composites. JOM 2019, 71, 4769–4777. [Google Scholar] [CrossRef]
  5. Xiao, H.; Qi, Z.C.; Yu, C.; Xu, C. Preparation and properties for Ti/Al clad plates generated by differential temperature rolling. J. Mater. Process. Technol. 2017, 249, 285–290. [Google Scholar] [CrossRef]
  6. Miyajima, Y.; Iguchi, K.; Onaka, S.; Kato, M. Effects of Rolling Reduction and Strength of Composed Layers on Bond Strength of Pure Copper and Aluminium Alloy Clad Sheets Fabricated by Cold Roll Bonding. Adv. Mater. Sci. Eng. 2014, 2014, 614821. [Google Scholar] [CrossRef] [Green Version]
  7. Wu, B.; Li, L.; Xia, C.D.; Guo, X.F.; Zhou, D.J. Effect of surface nitridingtreatment in a steel plate on the interfacial bonding strength of the aluminum/steel clad sheets by the cold roll bonding process. Mater. Sci. Eng. A 2017, 682, 270–278. [Google Scholar] [CrossRef]
  8. Wang, C.Y.; Jiang, Y.B.; Xie, J.X.; Zhou, D.J.; Zhang, X.J. Effect of the steel sheet surface hardening state on interfacial bonding strength of embedded aluminum–steel composite sheet produced by cold roll bonding process. Mater. Sci. Eng. A 2016, 652, 51–58. [Google Scholar] [CrossRef]
  9. Fu, L.; Xiao, H.; Yu, C.; Lv, Q.; Zhang, S.Y.; Xie, H.B. Bonding enhancement of cold rolling Al/steel composite plates via self-nano film modification. J. Mater. Process. Technol. 2022, 300, 117427. [Google Scholar] [CrossRef]
  10. Zhang, W.; Bay, N. A Numerical Model for Cold Welding of Metals. CIRP Ann.-Manuf. Technol. 1996, 45, 215–220. [Google Scholar] [CrossRef]
  11. Le, H.R.; Sutcliffe, M.P.F.; Wang, P.Z.; Burstein, G.T. Surface oxide fracture in cold aluminium rolling. Acta Mater. 2004, 52, 911–920. [Google Scholar] [CrossRef]
  12. Yang, W. An Investigation of Bonding Mechanism in Metal Cladding by Warm Rolling; Texas A&M University: College Station, TX, USA, 2011. [Google Scholar]
  13. Hosseini, M.; Manesh, H.D. Bond strength optimization of Ti/Cu/Ti clad composites produced by roll-bonding. Mater. Des. 2015, 81, 122–132. [Google Scholar] [CrossRef]
  14. Yang, D.K.; Xiong, J.Y.; Hodgson, P.; Wen, C.E. Influence of deformation-induced heating on the bond strength of rolled metal multilayers. Mater. Lett. 2009, 63, 2300–2302. [Google Scholar] [CrossRef]
  15. Dyakonov, G.S.; Mironov, S.; Zherebtsov, S.V.; Malysheva, S.P.; Salishchev, G.A.; Salem, A.A.; Semiatin, S.L. Grain-structure development in heavily cold-rolled alpha-titanium. Mater. Sci. Eng. A 2014, 607, 145–154. [Google Scholar] [CrossRef]
  16. Zherebtsov, S.V.; Dyakonov, G.S.; Salem, A.A.; Malysheva, S.P.; Salishchev, G.A.; Semiatin, S.L. Evolution of grain and subgrain structure during cold rolling of commercial-purity titanium. Mater. Sci. Eng. A 2011, 528, 3474–3479. [Google Scholar] [CrossRef]
  17. Zeng, Z.P.; Jonsson, S.; Roven, H.J. The effects of deformation conditions on microstructure and texture of commercially pure Ti. Acta Mater. 2009, 57, 5822–5833. [Google Scholar] [CrossRef]
  18. Chun, Y.B.; Yu, S.H.; Semiatin, S.L.; Hwang, S.K. Effect of deformation twinning on microstructure and texture evolution during cold rolling of CP-titanium. Mater. Sci. Eng. A 2005, 398, 209–219. [Google Scholar] [CrossRef]
  19. Lee, J.K.; Lee, D.N. Texture control and grain refinement of AA1050 Al alloy sheets by asymmetric rolling. Int. J. Mech. Sci. 2008, 50, 869–887. [Google Scholar] [CrossRef]
  20. Thornburg, D.R.; Piehler, H.R. An analysis of constrained deformation by slip and twinning in hexagonal close packed metals and alloys. Metall. Trans. A 1975, 6, 1511–1523. [Google Scholar] [CrossRef]
  21. Lopatin, N.V. Microstructure evolution in pure titanium during warm deformation by combined rolling processes. Mater. Sci. Eng. A 2012, 556, 704–715. [Google Scholar] [CrossRef]
  22. Sutcliffe, M.P.F. Flattening of Random Rough Surfaces in Metal-Forming Processes. ASME J. Tribol. 1999, 121, 433–440. [Google Scholar] [CrossRef]
  23. Johnson, K.L. Contact Mechanics; Cambridge University Press: Cambridge, UK, 1985. [Google Scholar]
Figure 1. Schematic diagram of Ti/Al cold roll bonding.
Crystals 12 01665 g001
Figure 2. Peel test for Ti/Al composite sheet.
Crystals 12 01665 g002
Figure 3. SEM micrograph of the surface morphology of TA1 and AA4047 after wire brushing: (a) TA1; (b) Al ①; (c) Al ②; (d) Al ③.
Crystals 12 01665 g003
Figure 4. Variation of peel strength of specimens A, B and C with reduction.
Crystals 12 01665 g004
Figure 5. Deformation of each layer of three types of Ti/Al composite sheets under different rolling reductions. (a) Specimen B; (b) specimen A; (c) specimen C; (d) variation of deformation ratio of titanium and aluminium with total rolling reduction.
Crystals 12 01665 g005
Figure 6. Relationship between tensile yield stress and reduction. (a) TA1; (b) Al ①; (c) Al ②; (d) Al ③.
Crystals 12 01665 g006
Figure 7. Peeling surface morphology on the titanium side. (a) Specimen B2; (b) specimen B3; (c) specimen C2; (d) specimen C3. The red arrows indicates cracks on the peeling surfaces.
Crystals 12 01665 g007
Figure 8. Peeling surface morphology on the aluminium side. (a) Specimen B2; (b) specimen B3; (c) specimen C2; (d) specimen C3.
Crystals 12 01665 g008
Figure 9. SEM images of the peeled surface on the titanium side of specimen C3. (a) Secondary electron SEM micrographs; (b) distribution of Al element (red areas) in (a) obtained by EDS; (c) distribution of Ti element (blue areas) in (a) obtained by EDS.
Crystals 12 01665 g009
Figure 10. SEM images of the peeled surface on the aluminium side of specimen C3. (a) Secondary electron SEM micrographs; (b) distribution of Al element (red areas) in (a) obtained by EDS; (c) distribution of Ti element (blue areas) in (a) obtained by EDS.
Crystals 12 01665 g010
Figure 11. Area fraction of aluminium on the titanium side of the peeling surface of specimens A1, A2, A3, B1, B2, B3, C1, C2 and C3.
Crystals 12 01665 g011
Figure 12. Corrected peel strength of specimens A1, A2, A3, B1, B2, B3, C1, C2 and C3.
Crystals 12 01665 g012
Figure 13. Optical micrograph of the interface of the Ti/Al composite sheet. (a) Specimen B1; (b) specimen B2; (c) specimen B3; (d) specimen A1; (e) specimen A2; (f) specimen A3; (g) specimen C1; (h) specimen C2; (i) specimen C3.
Crystals 12 01665 g013
Figure 14. SEM micrographs of the interface of the Ti/Al composite sheet. (a) Specimen B1; (b) specimen B2; (c) specimen B3; (d) specimen A1; (e) specimen A2; (f) specimen A3; (g) specimen C1; (h) specimen C2; (i) specimen C3.
Crystals 12 01665 g014
Figure 15. EBSD maps near the Ti/Al interface under different initial strengths of aluminium. (a) Specimen B3; (b) specimen C3.
Crystals 12 01665 g015
Figure 16. Grain size and distribution of each region in Figure 15. (a) Specimen B3; (b) specimen C3; (c) grain size distribution.
Crystals 12 01665 g016
Figure 17. EBSD grain boundaries near the interface. (a) Specimen B3; (b) specimen C3. Lime green, black, red, blue and purple correspond to LAGBs (2° < misorientation angle < 15°), HAGBs (misorientation angle > 15°), 65° <01 1 ¯ 0> boundaries, 85° < 1 ¯ 2 1 ¯ 0> boundaries and 45° <5 1 ¯ 4 ¯ 3> boundaries, respectively.
Crystals 12 01665 g017
Figure 18. Misorientation distribution in different regions near the interface of specimen B3. (a) Ti-1; (b) Ti-2; (c) Ti-3; (d) Al-1; (e) Al-2; (f) Al-3.
Crystals 12 01665 g018
Figure 19. Misorientation distribution in different regions near the interface of specimen B3. (a) Ti-I; (b) Ti-II; (c) Ti-III; (d) Al-I; (e) Al-II; (f) Al-III.
Crystals 12 01665 g019
Figure 20. Variations in HAGBs and LAGBs in different regions near the interface. (a) Specimen B3; (b) specimen C3.
Crystals 12 01665 g020
Figure 21. Relative misorientation profiles ((b,f)) along the vertical lines under different initial strengths of aluminium. (a) Specimen B3; (e) specimen C3; (c) and (g) point-to-point misorientation along L1–L8 and LI–LVI; (d,h) point-to-origin misorientation along L1–L8 and LI–LVI.
Crystals 12 01665 g021
Figure 22. Kernel average misorientation (KAM) maps. (a) Specimens B3; (b) specimen C3.
Crystals 12 01665 g022
Figure 23. Pole figures for titanium calculated using the Channel 5 software for subdomains near the interface. (a) Ti-1; (b) Ti-2; (c) Ti-3; (d) Ti-I; (e) Ti-II; (f) Ti-III.
Crystals 12 01665 g023
Figure 24. Misorientation-axis distributions measured at various subdomains in specimens B3 and C3. (a) Ti-1; (b) Ti-2; (c) Ti-3; (d) Ti-I; (e) Ti-II; (f) Ti-III.
Crystals 12 01665 g024
Figure 25. The 0° and 45° ODF sections of the Euler space (Bunge’s notation) to illustrate the textures in the aluminium layer. (a) Specimen B3; (b) specimen C3.
Crystals 12 01665 g025
Figure 26. Equivalent contact model of the facing surfaces of the Ti/Al clad.
Crystals 12 01665 g026
Figure 27. Model for the fracture of the hardening layer and oxide film at the roll bite due to extension of the substrate metal during cold rolling [12].
Crystals 12 01665 g027
Figure 28. Longitudinal stress state of the WHL at neutral point C.
Crystals 12 01665 g028
Figure 29. Model of metal extrusion through the crack of WHL on the surface of the titanium layer in type I.
Crystals 12 01665 g029
Figure 30. Extrusion flow of aluminium and titanium in cracks of WHL on the surface of the titanium layer.
Crystals 12 01665 g030
Table 1. Chemical composition of the raw materials.
MaterialsChemical Composition (wt.%)
CONHTiFeAlMnSi
TA10.0240.0620.00760.002Bal.0.023---
AA4047----0.150.8Bal.0.1512.0
Table 2. Mechanical properties of the raw materials.
MaterialsYS (MPa)
(Transverse Direction)
YS (MPa)
(Rolling Direction)
El (%)
Al ①43.643.650.8
Al ②94.098.06.0
Al ③258.0279.04.0
TA1229.4229.440.8
Table 3. Cold roll bonding process.
SpecimenSpecimen NumberSurface TreatmentState of AluminiumRolling Reduction
AA1Wire brushingAl ②35.6
A2Wire brushingAl ②43.3
A3Wire brushingAl ②50.6
BB1Wire brushingAl ①35.8
B2Wire brushingAl ①42.8
B3Wire brushingAl ①50.3
CC1Wire brushingAl ③35.9
C2Wire brushingAl ③41.8
C3Wire brushingAl ③50.3
Table 4. Main slip and twin systems of commercially pure titanium [21].
Deformation ModePlaneDirectionCritical Resolved Shear Stress (CRSS, MPa)
Basal slip, <a>{0001}<11 2 ¯ 0>190
Prismatic slip, <a>{10 1 ¯ 0}<11 2 ¯ 0>34
Pyramidal slip, <a>{1 1 ¯ 01}<11 2 ¯ 0>136
Pyramidal slip, <c+a>{10 1 ¯ 1}< 1 ¯ 1 ¯ 23>276
Tension twin, T1{10 1 ¯ 2}<10 1 ¯ 1 ¯ > 65
Tension twin, T2{11 2 ¯ 1}< 1 ¯ 1 ¯ 26>-
Compression twin, C1{11 2 ¯ 2}<11 2 ¯ 3 ¯ > 180
Compression twin, C2{10 1 ¯ 1}< 1 ¯ 012>83
Publisher’s Note: MDPI stays neutral with regard to jurisdictional claims in published maps and institutional affiliations.

