Article

Unusual Temperature Behavior of Stability of Proteinase K Dimer Formed in Crystallization Solution Defined by Molecular Dynamics

by
Yuliya V. Kordonskaya
1,*,
Vladimir I. Timofeev
2,
Yulia A. Dyakova
1,
Margarita A. Marchenkova
2,
Yury V. Pisarevsky
2,
Svetlana Yu. Silvestrova
3 and
Mikhail V. Kovalchuk
1
1
National Research Centre “Kurchatov Institute”, 1, Akademika Kurchatova pl., 123182 Moscow, Russia
2
A.V. Shubnikov Institute of Crystallography, Federal Scientific Research Centre “Crystallography and Photonics”, Russian Academy of Sciences, 59, Leninskii Prospect, 119333 Moscow, Russia
3
The Loginov Moscow Clinical Scientific Center, Moscow Health Department, Shosse Entusiastov 84/1, 111123 Moscow, Russia
*
Author to whom correspondence should be addressed.
Crystals 2022, 12(11), 1645; https://doi.org/10.3390/cryst12111645
Submission received: 19 October 2022 / Revised: 6 November 2022 / Accepted: 14 November 2022 / Published: 16 November 2022
(This article belongs to the Section Biomolecular Crystals)

Abstract

:
It is known that protein dimers form in a solution before proteinase K crystallization. Simulations of the dimer, i.e., a precursor cluster of the proteinase K crystal, at different temperatures, show that molecular dynamics methods make it possible to trace spatial and temporal changes in the internal structure of the crystal-forming dimer when heated to temperatures far from the denaturation. Based on the results of the modeling, the stability of the precursor cluster was evaluated at 19 temperatures (from 20 to 80 °C). An anomalous behavior of the dimer was found above 60 °C—a special temperature for the proteinase K (from Parengyodontium album) when the enzyme exhibits its maximal activity.

1. Introduction

It is well known that the investigation of proteins’ structures is the most important tool for determining the mechanisms of their functioning. However, protein structure identification remains one of the main problems. At the same time, the main challenge of X-ray diffraction analysis, which is the most common technique of protein structure determination, is the crystallization of proteins. However, significant progress has been made in this area recently. It is shown that at the initial stage of nucleation an intermediate solution phase appears with the formation of special protein oligomers—precursor clusters [1,2,3], whose examination can provide important information about the behavior of proteins before crystallization and their interaction with each other and the environment.
Recently, using the SAXS method, it has been found that precursor clusters during proteinase K crystallization are dimers [4], while the molecular dynamics technique has revealed which of the six possible dimers is the most stable [5].
In molecular biology, proteinase K is widely used to remove protein impurities in nucleic acid preparations. In addition, proteinase K rapidly cleaves and inactivates nucleases in DNA or RNA preparations. At the same time, activity of the proteinase K extracted from Parengyodontium album increases by heating from 20 to 60 °C and then decreases from 60 to 80 °C [6].
In the present work, the stability of the precursor cluster of the proteinase K crystal was studied by molecular dynamics in a wide temperature range from 20 to 80 °C, including a point of the enzyme maximal activity at 60 °C.

2. Materials and Methods

Preparation of dimer models was conducted as in [5]. The molecular model of possible growth units of proteinase K crystals was built using the crystal structure obtained from tetragonal crystals of the enzyme, PDB ID: 7A68, which belongs to the P43212 space group. Using the PyMOL software [7] and the symmetry operators of sp. gr. P43212, a fragment of the tetragonal proteinase K crystal structure was reconstructed, a dimer was isolated from it, and the dimer co-ordinates were obtained. The precipitant ions associated with proteinase K crystal were retained in the dimer structure (there are two sodium ions per protein molecule), while water molecules were removed.
Protonation states of amino acid residues at pH 8.0 (in accordance with the pH values of the corresponding crystallization solution [4]) were defined using the PROPKA server (Version 2.0.0 [8]).
All calculations were performed using the GROMACS version 2021 software [9]. Molecular dynamics was simulated in the Amber ff99SB-ILDN force field [10] containing refined torsion potentials for some groups of atoms.
Each dimer was placed in the center of a cubic simulation box. The minimum distance between the box edge and any protein atom was 1 nm. Each box was filled with the 4-site water model designed to use the Ewald summation methods (TIP4P-Ew [11]). The NaNO3 precipitant concentration in the box was 0.5 M, according to the crystallization conditions. 3D structure of NO3 ion was obtained from PDBeChem (code: NO3), and the ion’s topology was generated using the ACPYPE protocol [12]. The total charge of each box was neutralized by adding a negligible number of chloride ions (four), as it applies to the PME algorithm for calculating long-range electrostatic interactions.
Before each start of the productive MD calculations, the energy of the systems was minimized by the steepest descent method (50,000 steps) until the force acting on any atom became less than 1000 kJ/(M∙nm−2). Then, the boxes were thermostated for 100 ps by the modified Berendsen (V-rescale) method [13] in the NVT-ensemble and barostated for 100 ps by the Parrinello–Raman algorithm [14] in the NPT-ensemble.
The productive MD simulation was conducted in the NPT-ensemble using the V-rescale thermostat and the Parrinello–Raman barostat. Integration was performed using a standard leap-frog algorithm [15] with the integration step set at 2 fs. The simulations were conducted using three-dimensional periodic boundary conditions. Noncovalent interactions were considered only for atoms located within a radius of 1 nm. The long-range electrostatic interactions were processed by the smooth particle mesh Ewald (PME) summation method [16] with cubic interpolation and grid spacing in Fourier space of 0.16 nm. The dimers’ bond lengths were constrained using the LINCS algorithm [17].
The duration of each trajectory was 100 ns. Independent simulations of the proteinase K dimer were performed three times for each of 19 temperature values from 20 to 80 °C.
The structural alignment of the trajectories of the proteinase K atoms to the initial position was performed by the command gmx trjconv with the flag −fit rot + trans. The RMSF (Root Mean Square Fluctuation), RMSD (Root Mean Square Deviation), and Rg (Radius of gyration) of Cα atoms were then calculated by running the commands gmx rmsf, gmx rms and gmx gyrate, respectively.

3. Results and Discussion

Based on the results of the MD simulation, the graphs of the mean square fluctuations (RMSF) of Cα atoms were plotted at all temperatures from 20 to 80 °C. The RMSF values serve as a measure of the polypeptide chain flexibility, as they indicate the degree of deviation of every Cα atom from its average position. The lower the RMSF value of an atom the more stable it is.
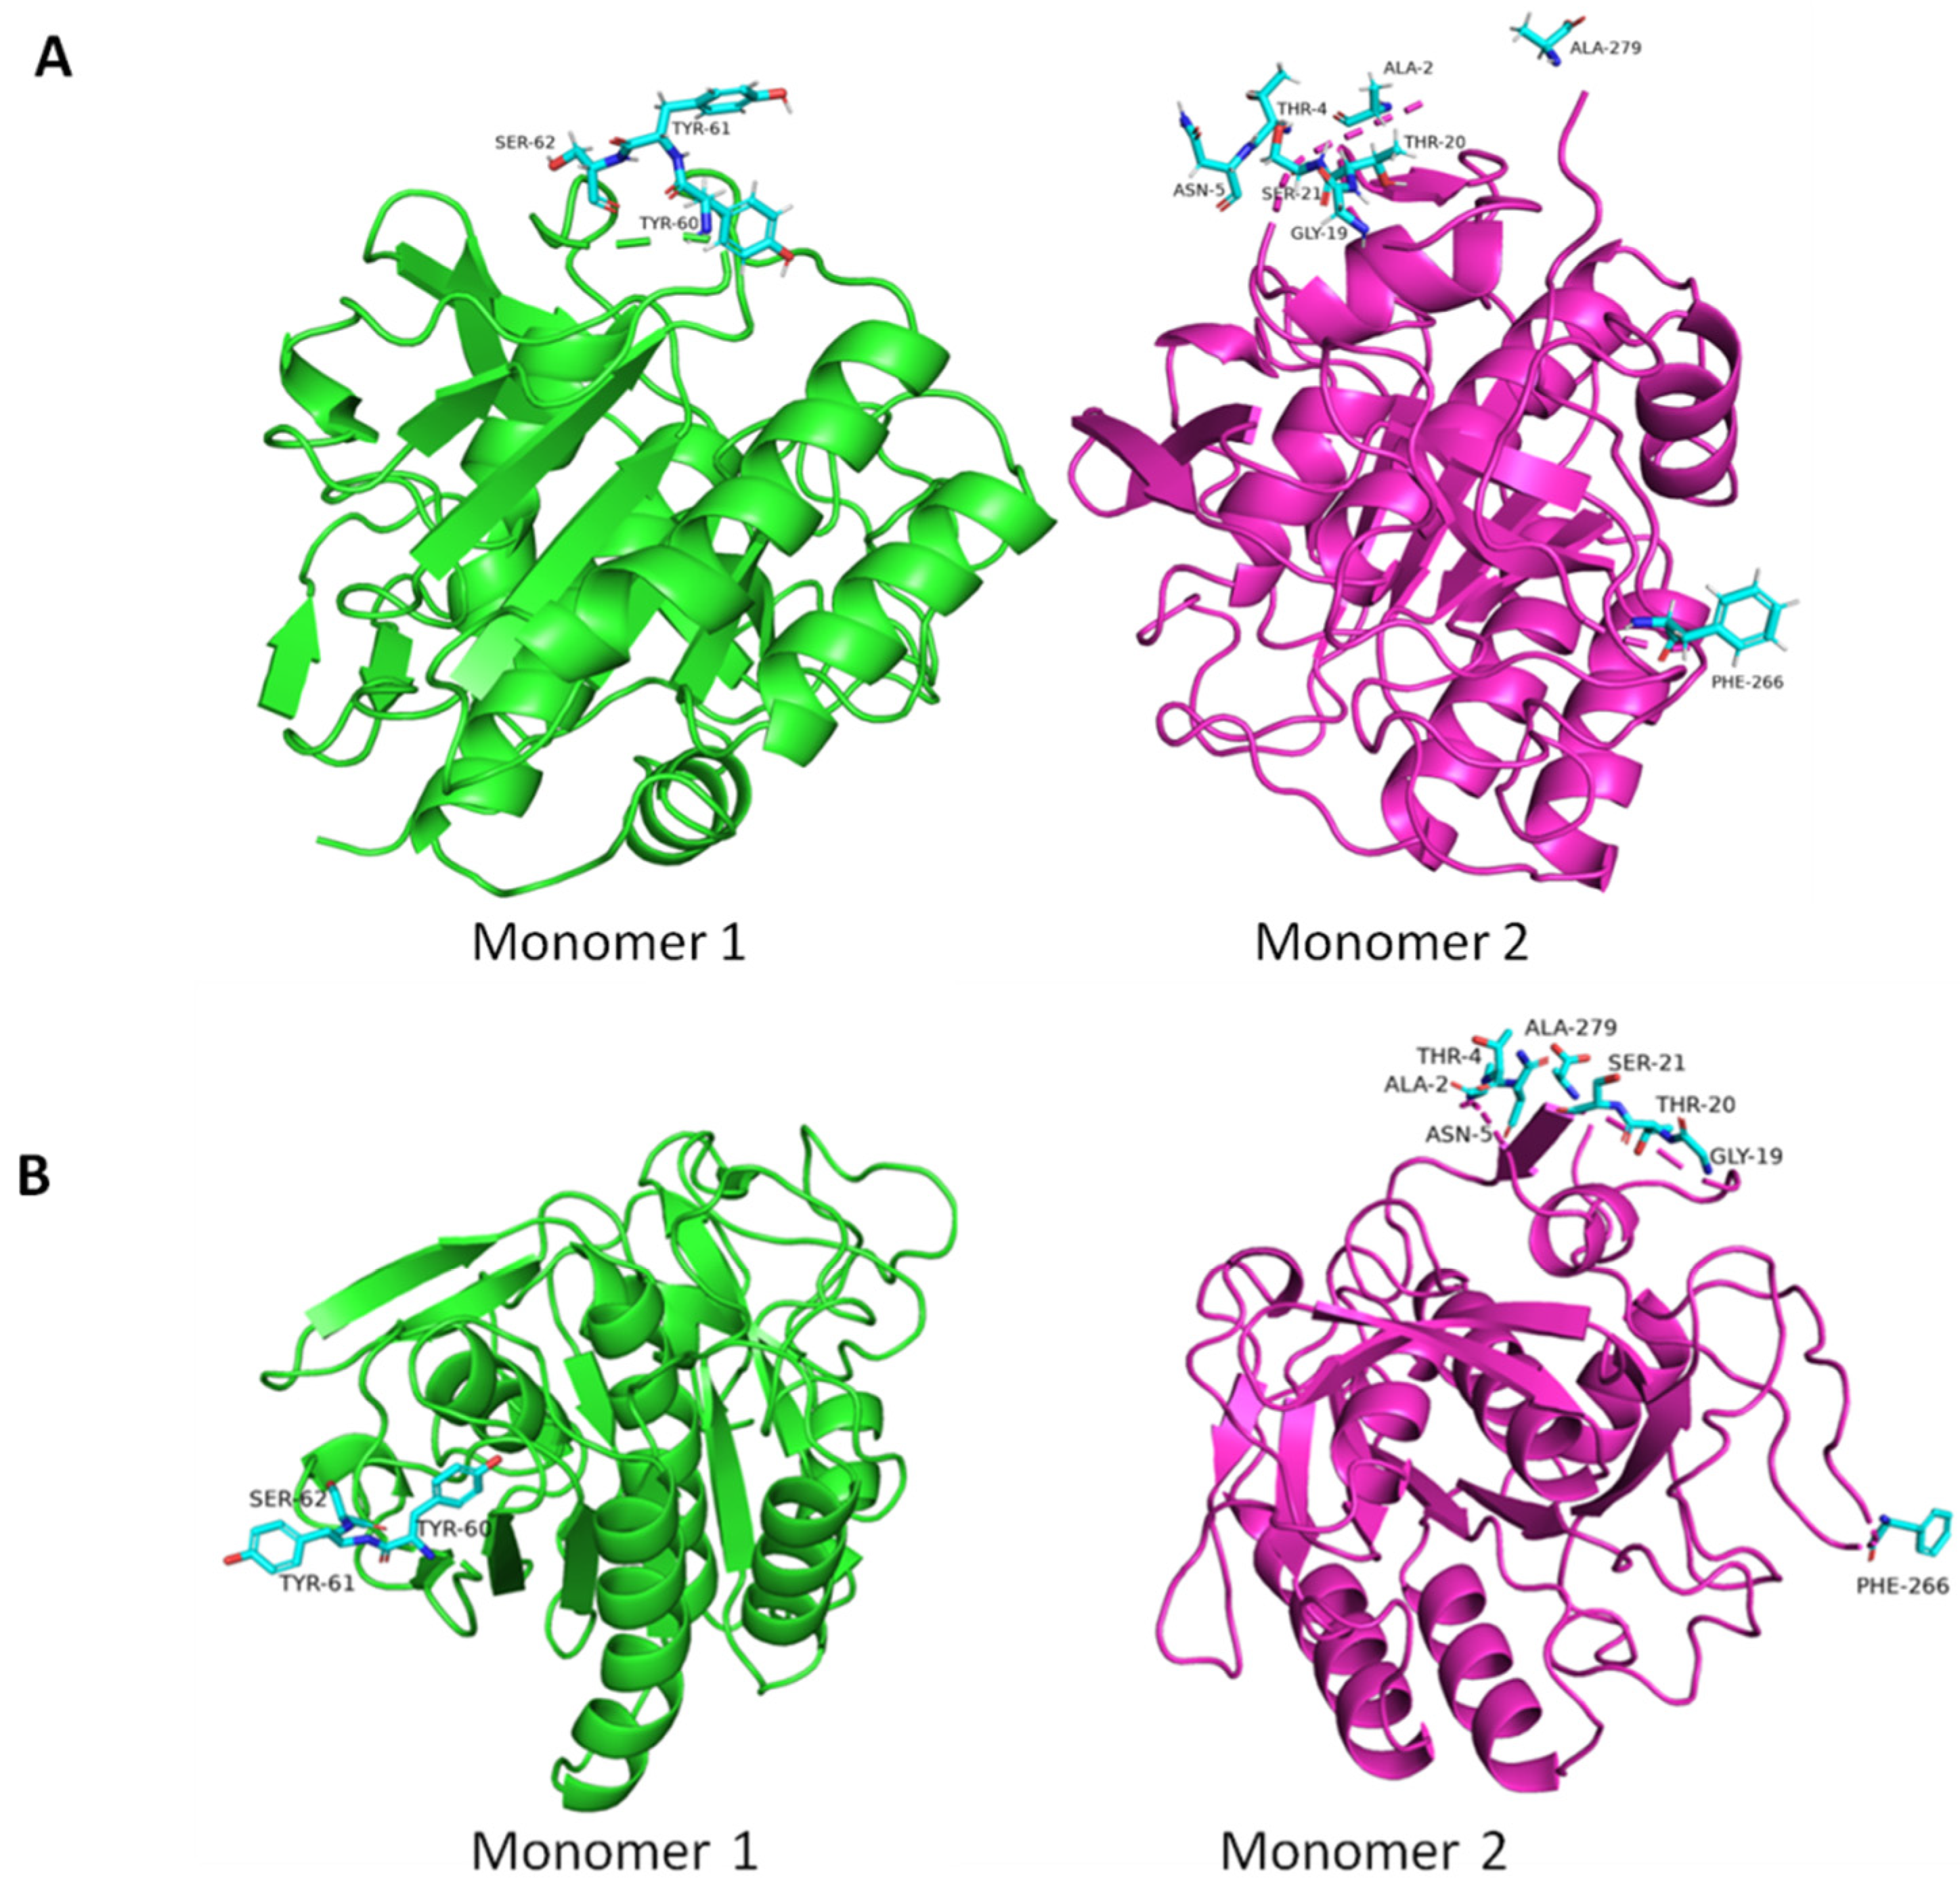
To be clear, Figure 1 shows the RMSF only at several characteristic temperatures, for each of which the RMSF values were averaged over three independent simulations. It is obvious that the proteinase K dimer is the most unstable at 70 °C and the most rigid at 20 °C. Unexpectedly, the protein was more stable at 80 than at 70 °C. A visual inspection of the dimer trajectories revealed that from all modellings it dissociated into monomers only once (in one of the three simulations at 70 °C). Figure 1 demonstrates that all Cα atoms contribute to dimer destabilization at different temperatures almost equally, and they mostly differ only by the absolute value of the RMSF. From Figure 1 it follows that residues HID 229, PRO 228, and THR 227 of monomer 1 and LEU 131, SER 130, ALA 129, ALA 156, VAL 37, ILE 38, TYR 36, and ALA 231 of monomer 2 fluctuate the least (RMSF < 0.55 nm); residues SER 62, TYR 60, and TYR 61 of monomer 1 and ALA 2, ASN 5, PHE 266, SER 21, THR 20, GLY 19, ALA 279, and THR 4 of monomer 2 destabilize the most (RMSF > 1.31 nm) at 70 °C.
Figure 2 shows that the most active residues are located on the surface of the dimer and do not participate in the forming of direct contact, e.g., by covalent bonds, between monomers.
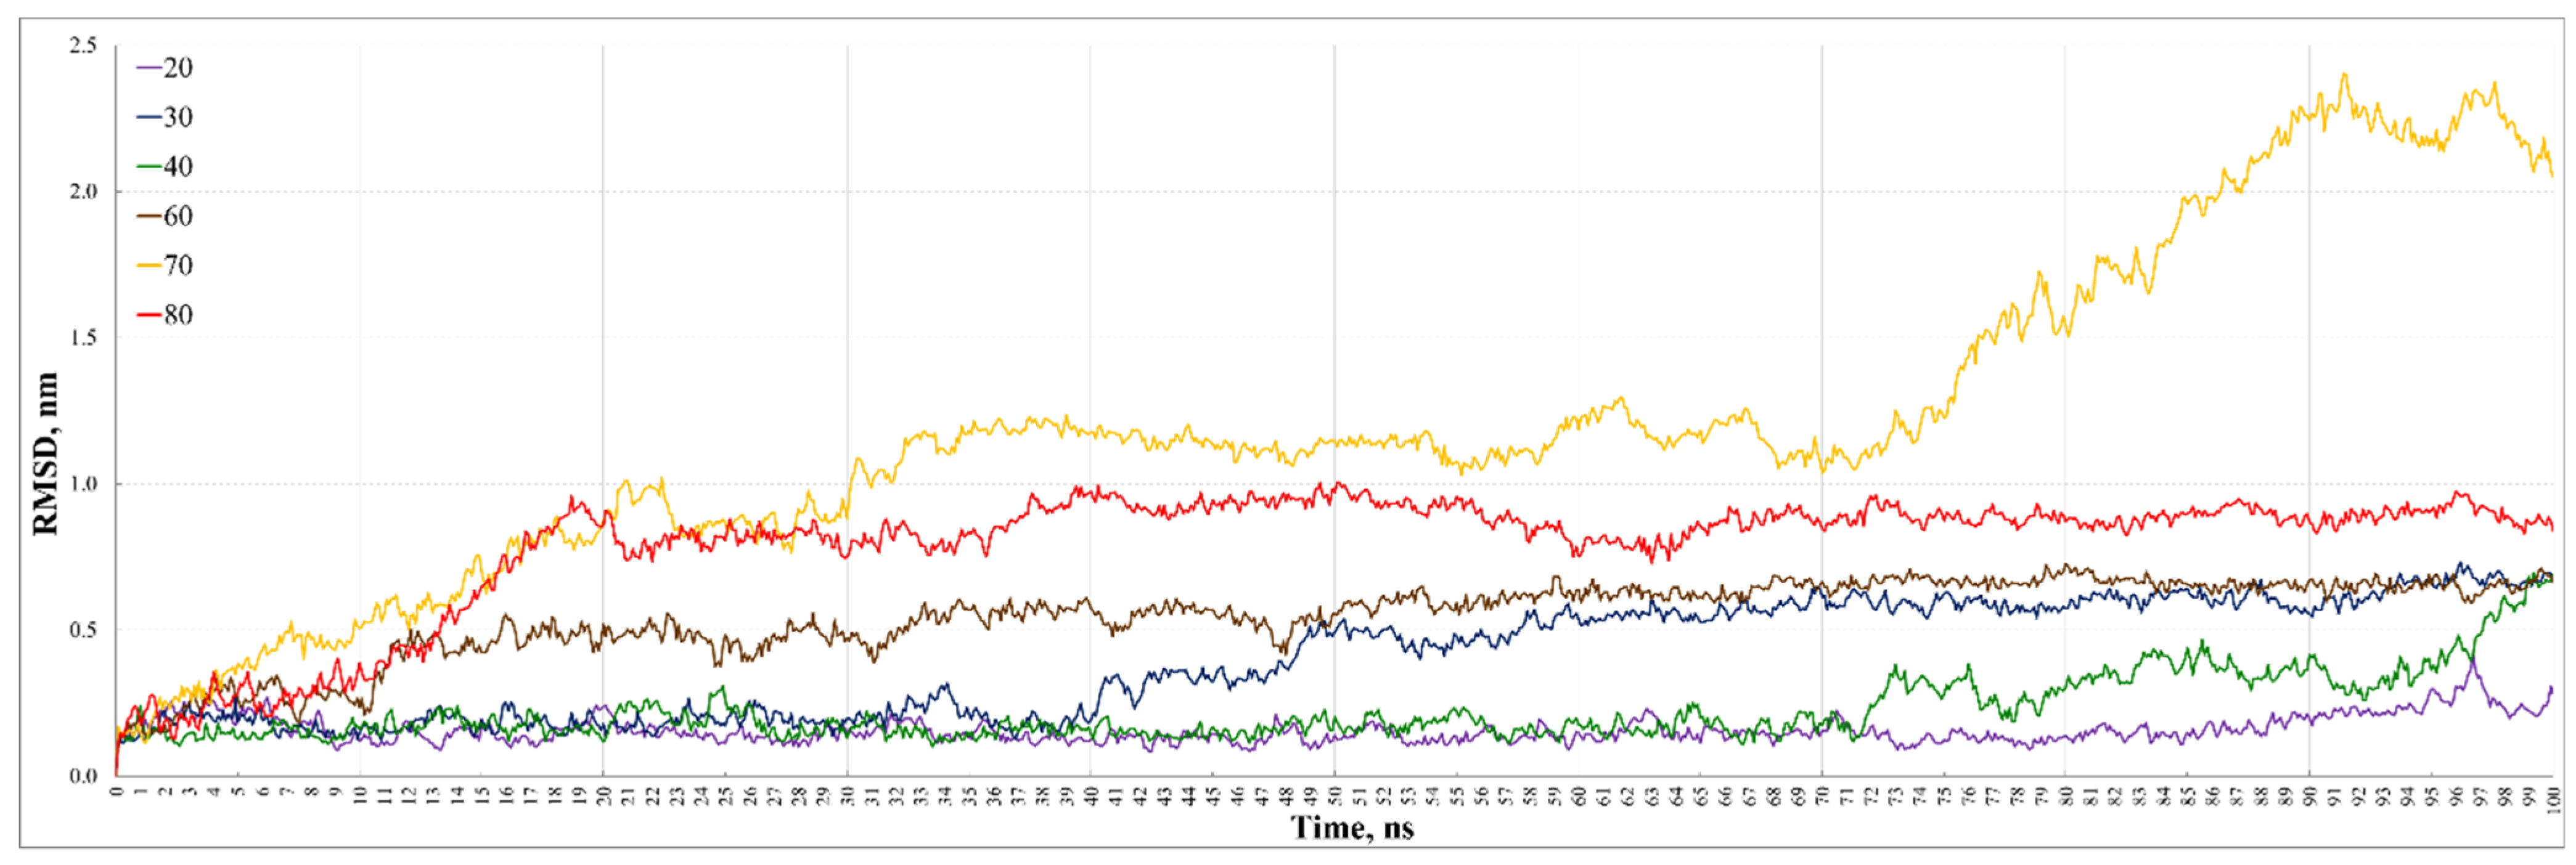
The change of oligomer structure during molecular dynamics was evaluated based on the RMSD plots, i.e., root-mean-square deviation of all Cα atoms from the initial (crystalline) structure. The difference between RMSF and RMSD is that RMSF reflects the fluctuations of each atom around its average position over the entire simulation time, while RMSD corresponds to the deviation of all atoms as a function of time.
The RMSD plot in Figure 3 demonstrates that most of all dimers destabilize at 70 °C whereas its structure remained the most similar to the initial one at 20 °C, which agrees with the RMSF results. It should be noted that at 80 °C protein destabilizes at the similar pace as at 70 °C up to 20 ns, but it achieves its stable conformation in 20 ns at 80 °C, while at 70 °C the dimer continues to transform, especially after 70 ns.
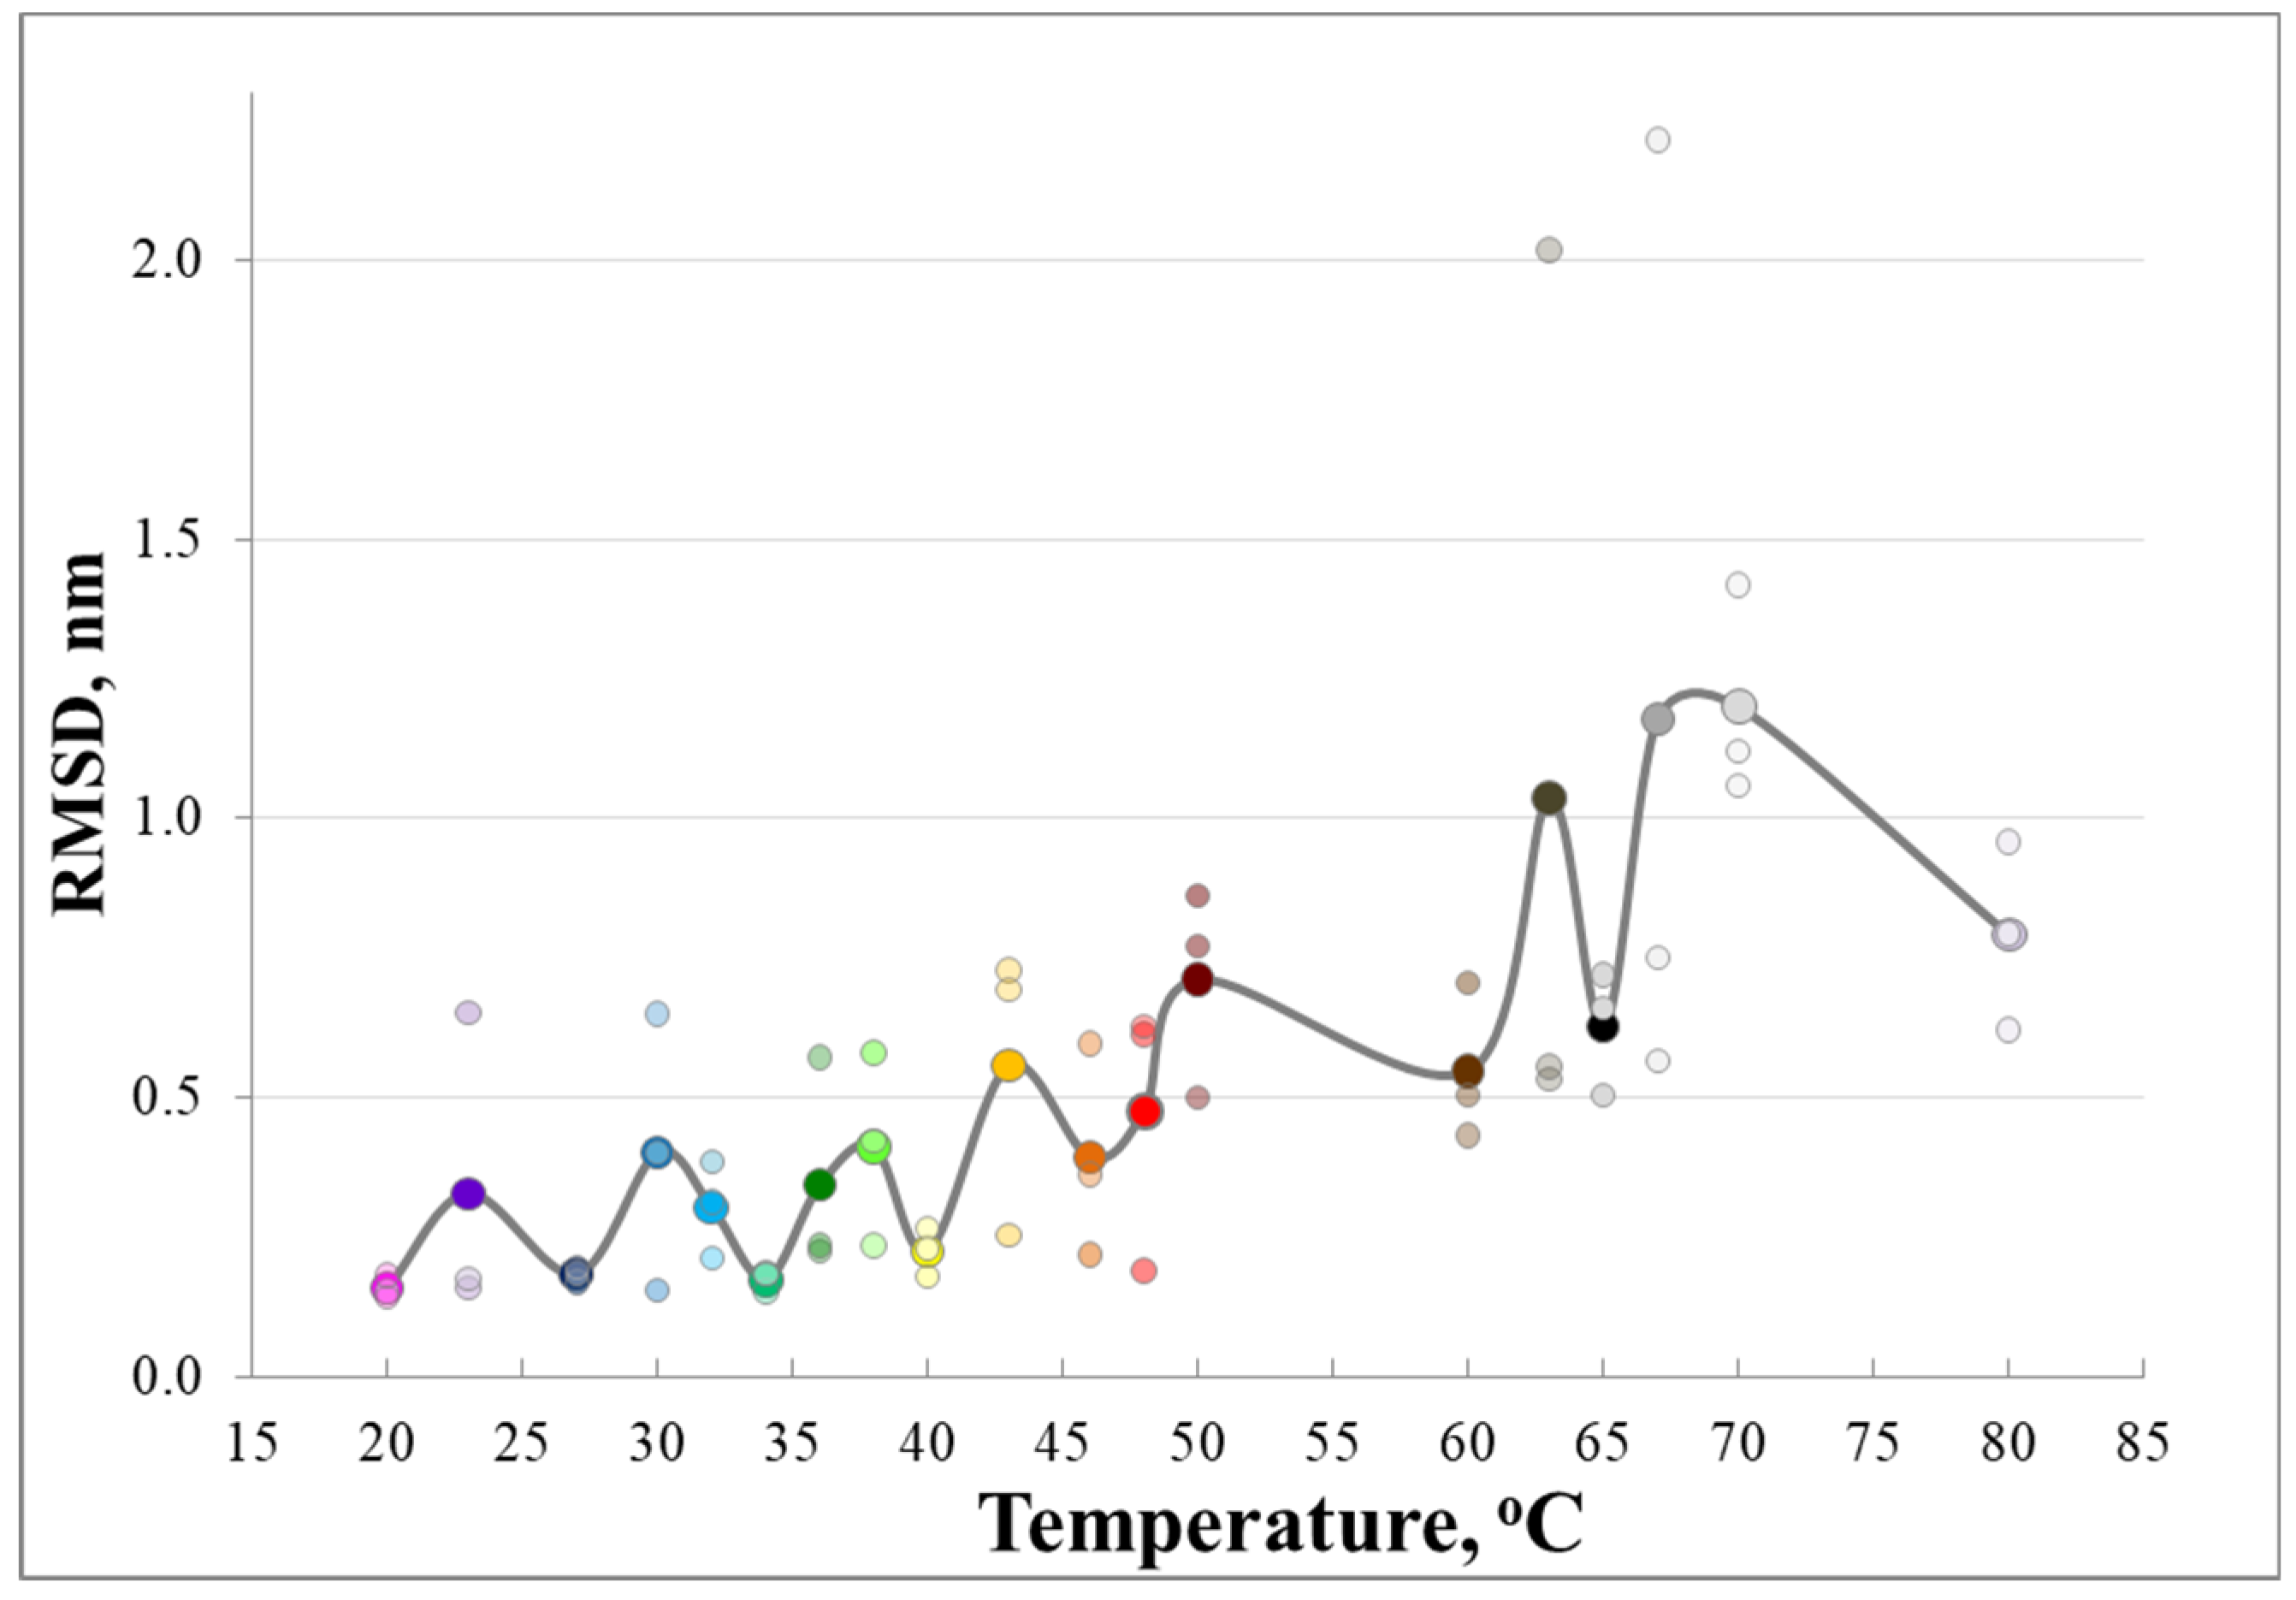
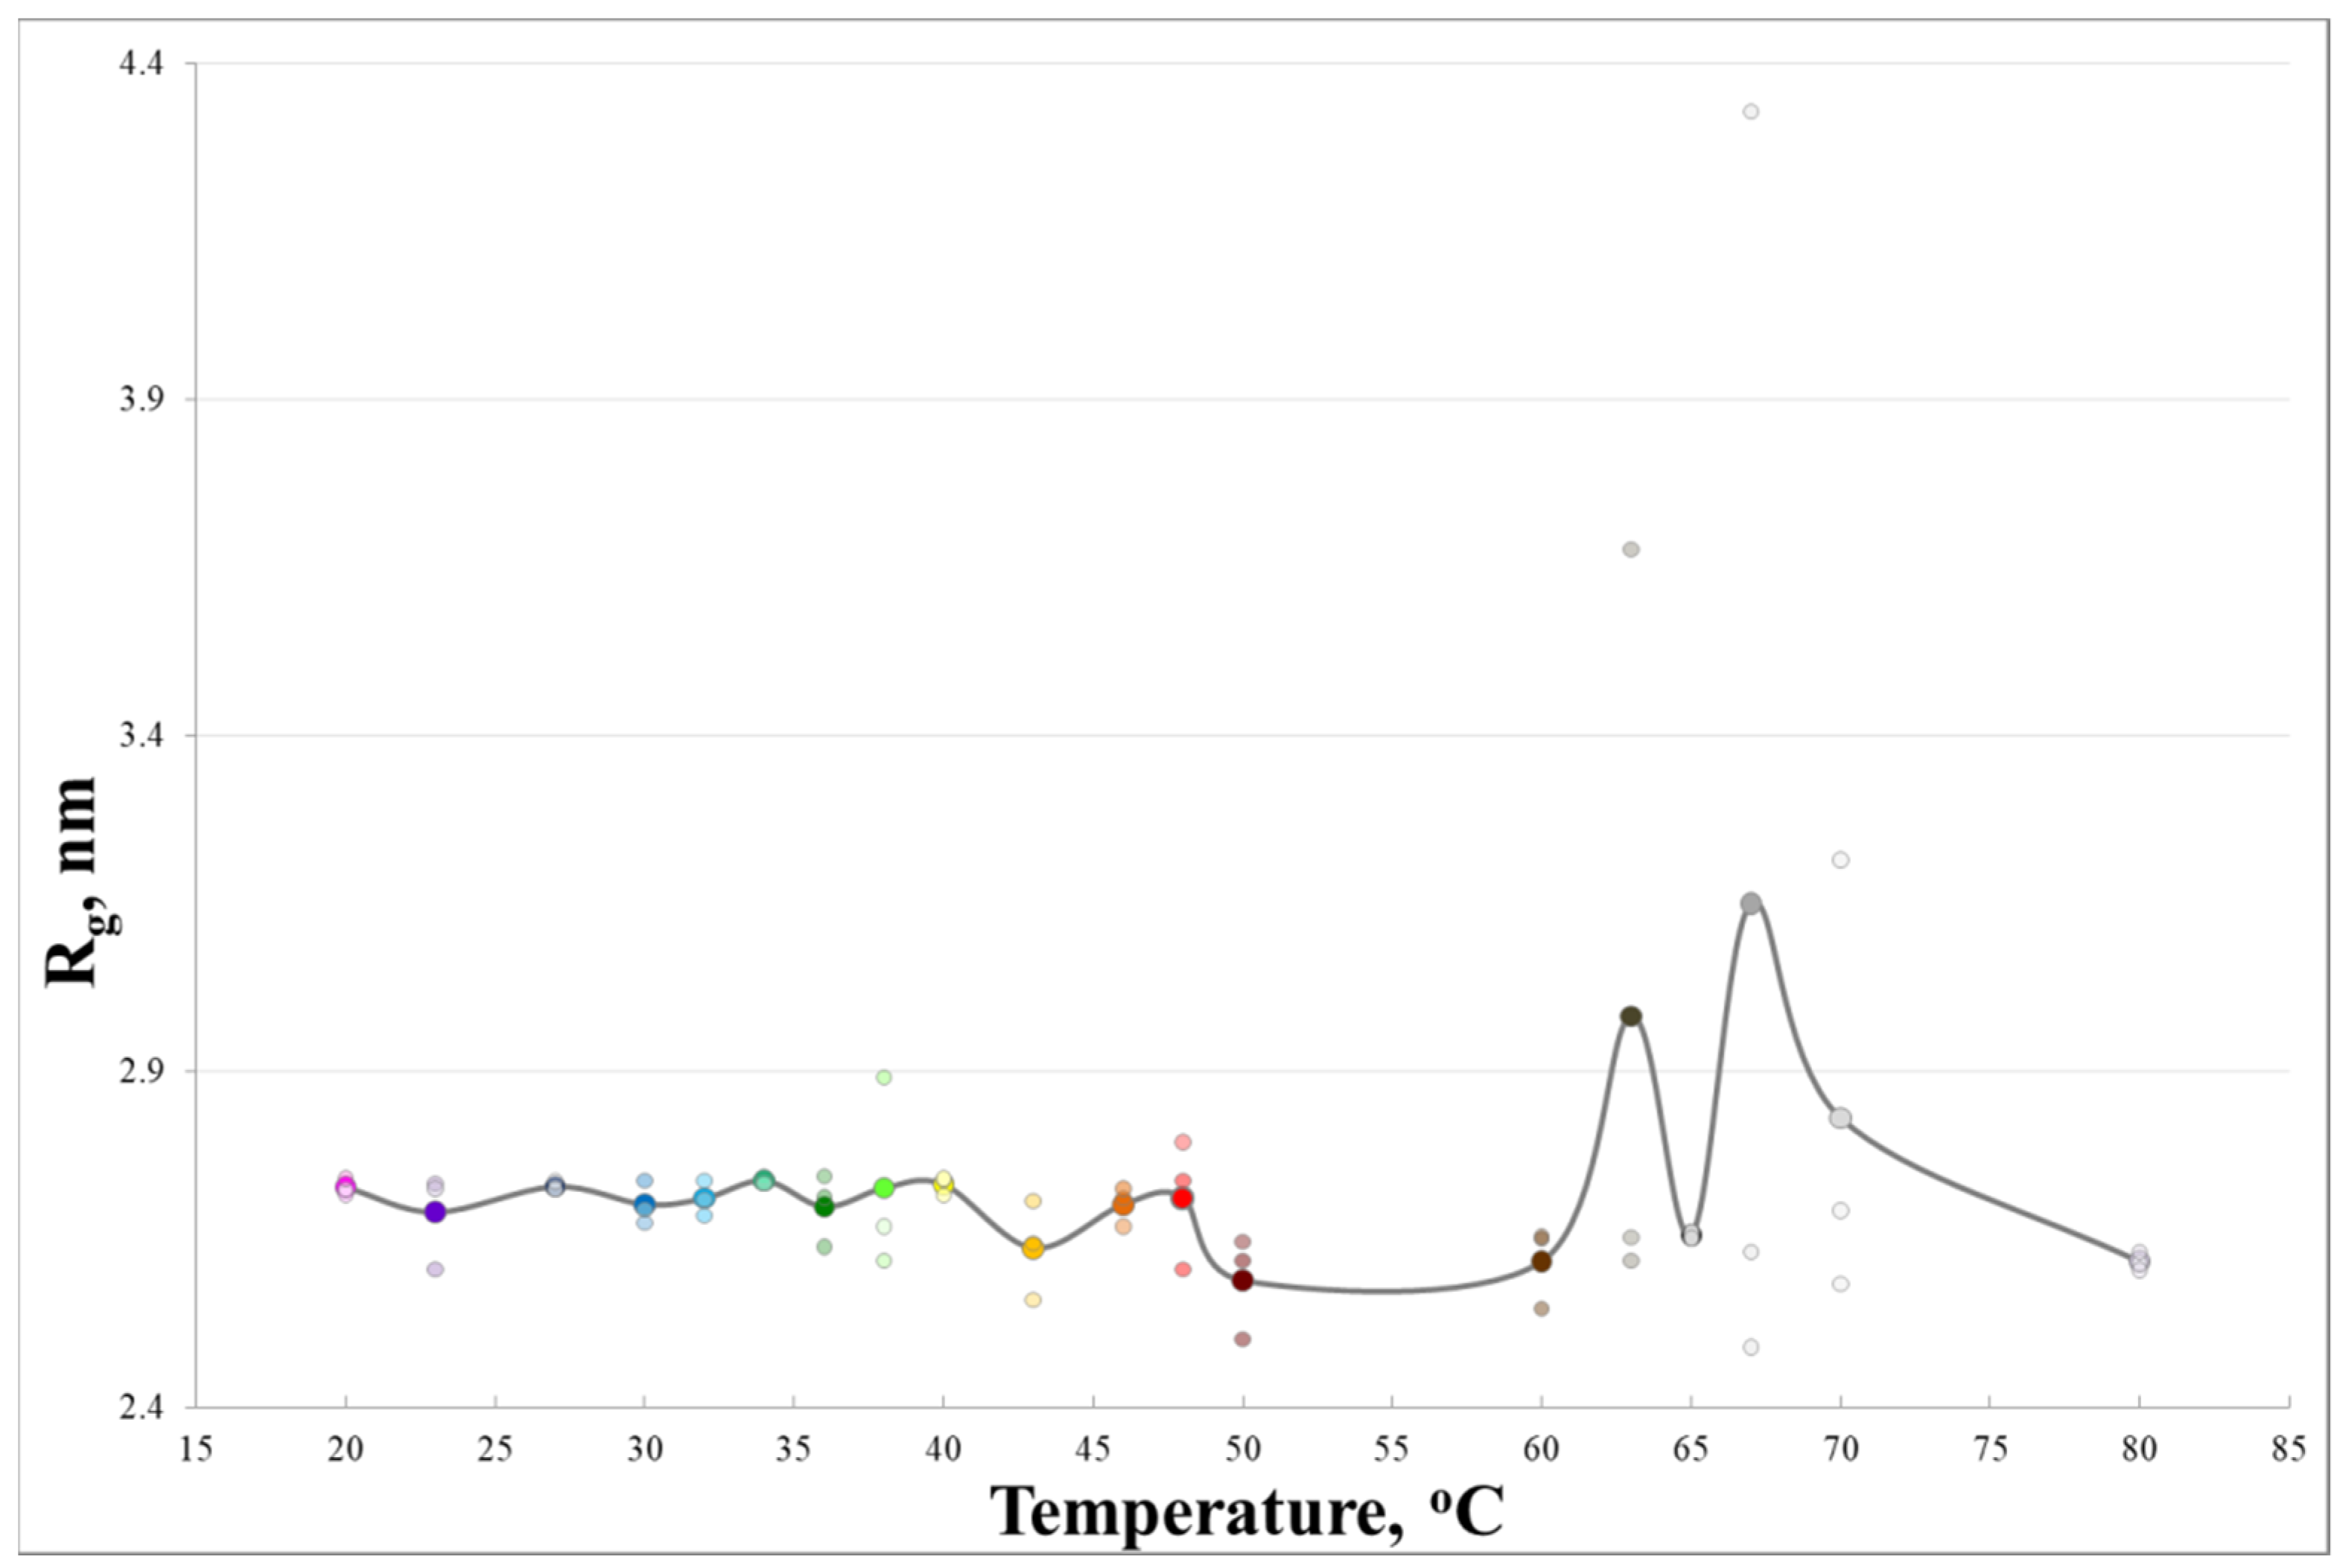
Based on these dependences (Figure 1 and Figure 3 and similar for Rg), the values of the RMSD, RMSF and Rg were averaged over all Cα atoms to study a set of temperatures, the results of which are shown in Figure 4, Figure 5 and Figure 6. The Rg (Radius of gyration) plot in Figure 6 characterizes the protein compactness. It is defined as the root-mean-square average of the distance of all atoms from the center of mass of the protein.
It should be noted that the RMSF and RMSD values at 70 °C are higher than at 80 °C for all three independent simulations.
It follows from Figure 4, Figure 5 and Figure 6 that, in general, the dimer tends to destabilize with the temperature growth even though the dependence is nonmonotonic. Figure 6 shows the dimer tends to shrink with a temperature increase of up to 50 °C. The most noticeable contribution to the averaged Rg value (3.26 nm) at 70 °C relates to the simulation when the dimer dissociated into monomers.
The explicit maximum at 70 °C in Figure 4, Figure 5 and Figure 6 demonstrates an anomaly in this region. In addition, as it follows from Figure 1, oscillations of all atoms are the most considerable at this temperature. The structure transformation probably occurs because of the nature of the proteinase K molecule itself since it continues to function at up to 80 °C even though its activity peak is observed at 60 °C.
It is interesting to note that the pre-crystallization precursor clusters of the proteinase K are stable over a wide temperature range: from 20 to 60 °C, which significantly exceeds the temperatures of the existence of the lysozyme precursor clusters (octamers), which begin to decompose at 30 °C [18]. Moreover, the stability of precursor clusters of a “nonthermophilic” lysozyme depends on the temperature much more monotonically than it is for a proteinase K.

4. Conclusions

Precursor clusters of proteinase K crystals are characterized by their strong stability over a wide temperature range (up to 60 °C), which means that an uncommon crystallization of this protein can be tested at high temperatures such as 50 °C. This expands the possibilities of growing high quality proteinase K crystals.
The abnormal behavior of proteinase K dimers begins at 60 °C, that is the temperature at which the interaction of the proteinase K with other proteins during their purification disappears. The temperature of a sharp decrease in the interaction between proteinase K molecules was found to coincide with the temperature of a decrease in the interaction of the proteinase K with other proteins when using this protein for purification of other proteins.
Drastic changes in the interaction between the proteinase K molecules when the temperature rises above 70 °C are unusual. The nature of this phenomenon is probably a consequence of the proteinase K thermophilicity and requires further research.

Author Contributions

Conceptualization, V.I.T.; methodology, V.I.T.; validation, Y.V.K.; formal analysis, Y.V.K.; investigation, Y.V.K., V.I.T. and Y.V.P.; resources, M.A.M.; data curation, Y.V.K.; writing—original draft preparation, Y.V.K. and Y.V.P.; writing—review and editing, Y.V.K., V.I.T. and Y.V.P.; visualization, Y.V.K.; supervision, M.A.M., Y.A.D. and M.V.K.; project administration, M.A.M. and S.Y.S.; funding acquisition, M.A.M. All authors have read and agreed to the published version of the manuscript.

Funding

This research was funded by Ministry of Science and Higher Education: grant No. 075-15-2021-1363, contract No. 208 EII in a part of calculating molecular dynamics, by the NRC “Kurchatov Institute” (No. 1360) in a part of analyzing the results of computer modeling and by the Ministry of Science and Higher Education within the State assignment FSRC «Crystallography and Photonics» RAS in a part of the development of a molecular modeling protocol.

Data Availability Statement

Not applicable.

Acknowledgments

This work has been carried out using computing resources of the federal collective usage center, Complex for Simulation and Data Processing for Mega-science Facilities at NRC “Kurchatov Institute”, http://ckp.nrcki.ru/ (accessed on 1 November 2022).

Conflicts of Interest

The authors declare no conflict of interest.

References

  1. Kovalchuk, M.V.; Blagov, A.E.; Dyakova, Y.A.; Gruzinov, A.Y.; Marchenkova, M.A.; Peters, G.S.; Pisarevsky, Y.V.; Timofeev, V.I.; Volkov, V.V. Investigation of the Initial Crystallization Stage in Lysozyme Solutions by Small-Angle X-ray Scattering. Cryst. Growth Des. 2016, 16, 1792–1797. [Google Scholar] [CrossRef]
  2. Marchenkova, M.A.; Volkov, V.V.; Blagov, A.E.; Dyakova, Y.A.; Ilina, K.B.; Tereschenko, E.Y.; Timofeev, V.I.; Pisarevsky, Y.V.; Kovalchuk, M.V. In Situ Study of the State of Lysozyme Molecules at the Very Early Stage of the Crystallization Process by Small-Angle X-ray Scattering. Crystallogr. Rep. 2016, 61, 5–10. [Google Scholar] [CrossRef]
  3. Boikova, A.S.; D’yakova, Y.A.; Il’ina, K.B.; Konarev, P.V.; Kryukova, A.E.; Marchenkova, M.A.; Blagov, A.E.; Pisarevskii, Y.V.; Koval’chuk, M.V. Small-Angle X-ray Scattering Study of the Influence of Solvent Replacement (from H2O to D2O) on the Initial Crystallization Stage of Tetragonal Lysozyme. Crystallogr. Rep. 2017, 62, 837–842. [Google Scholar] [CrossRef]
  4. Boikova, A.S.; D’yakova, Y.A.; Il’ina, K.B.; Konarev, P.V.; Kryukova, A.E.; Marchenkova, M.A.; Pisarevskii, Y.V.; Koval’chuk, M.V. Investigation of the Pre-Crystallization Stage of Proteinase K in Solution (Influence of Temperature and Precipitant Type) by Small-Angle X-ray Scattering. Crystallogr. Rep. 2018, 63, 865–870. [Google Scholar] [CrossRef]
  5. Kordonskaya, Y.V.; Timofeev, V.I.; Marchenkova, M.A.; Konarev, P.V. Identification of the Precursor Cluster in the Crystallization Solution of Proteinase K Protein by Molecular Dynamics Methods. Crystals 2022, 12, 484. [Google Scholar] [CrossRef]
  6. Ren, Y.; Luo, H.; Huang, H.; Hakulinen, N.; Wang, Y.; Wang, Y.; Su, X.; Bai, Y.; Zhang, J.; Yao, B.; et al. Improving the Catalytic Performance of Proteinase K from Parengyodontium Album for Use in Feather Degradation. Int. J. Biol. Macromol. 2020, 154, 1586–1595. [Google Scholar] [CrossRef] [PubMed]
  7. Schrödinger, L.; DeLano, W. PyMOL. 2015. Available online: http://www.pymol.org/pymol (accessed on 1 November 2022).
  8. Dolinsky, T.J.; Nielsen, J.E.; McCammon, J.A.; Baker, N.A. PDB2PQR: An Automated Pipeline for the Setup of Poisson-Boltzmann Electrostatics Calculations. Nucleic Acids Res. 2004, 32, W665–W667. [Google Scholar] [CrossRef] [PubMed]
  9. van der Spoel, D.; Lindahl, E.; Hess, B.; Groenhof, G.; Mark, A.E.; Berendsen, H.J.C. GROMACS: Fast, Flexible, and Free. J. Comput. Chem. 2005, 26, 1701–1718. [Google Scholar] [CrossRef] [PubMed]
  10. Lindorff-Larsen, K.; Piana, S.; Palmo, K.; Maragakis, P.; Klepeis, J.L.; Dror, R.O.; Shaw, D.E. Improved Side-Chain Torsion Potentials for the Amber Ff99SB Protein Force Field. Proteins Struct. Funct. Bioinform. 2010, 78, 1950–1958. [Google Scholar] [CrossRef] [PubMed] [Green Version]
  11. Horn, H.W.; Swope, W.C.; Pitera, J.W.; Madura, J.D.; Dick, T.J.; Hura, G.L.; Head-Gordon, T. Development of an Improved Four-Site Water Model for Biomolecular Simulations: TIP4P-Ew. J. Chem. Phys. 2004, 120, 9665–9678. [Google Scholar] [CrossRef] [PubMed] [Green Version]
  12. Sousa Da Silva, A.W.; Vranken, W.F. ACPYPE-AnteChamber PYthon Parser InterfacE. BMC Res. Notes 2012, 5, 367. [Google Scholar] [CrossRef] [PubMed] [Green Version]
  13. Berendsen, H.J.C.; Postma, J.P.M.; van Gunsteren, W.F.; Dinola, A.; Haak, J.R. Molecular Dynamics with Coupling to an External Bath. J. Chem. Phys. 1984, 81, 3684–3690. [Google Scholar] [CrossRef] [Green Version]
  14. Parrinello, M.; Rahman, A. Strain Fluctuations and Elastic Constants. J. Chem. Phys. 1982, 76, 2662–2666. [Google Scholar] [CrossRef]
  15. Van Gunsteren, W.F.; Berendsen, H.J.C. A Leap-Frog Algorithm for Stochastic Dynamics. Mol. Simul. 1988, 1, 173–185. [Google Scholar] [CrossRef]
  16. Essmann, U.; Perera, L.; Berkowitz, M.L.; Darden, T.; Lee, H.; Pedersen, L.G. A Smooth Particle Mesh Ewald Method. J. Chem. Phys. 1995, 103, 8577–8592. [Google Scholar] [CrossRef] [Green Version]
  17. Hess, B.; Bekker, H.; Berendsen, H.J.C.; Fraaije, J.G.E.M. LINCS: A Linear Constraint Solver for Molecular Simulations. J. Comput. Chem. 1997, 18, 1463–1472. [Google Scholar] [CrossRef]
  18. Kordonskaya, Y.V.; Marchenkova, M.A.; Timofeev, V.I.; Dyakova, Y.A.; Pisarevsky, Y.V.; Kovalchuk, M.V. Precipitant ions influence on lysozyme oligomers stability investigated by molecular dynamics simulation at different temperatures. J. Biomol. Struct. Dyn. 2021, 39, 7223–7230. [Google Scholar] [CrossRef] [PubMed]
Figure 1. RMSF graphs of Cα atoms of proteinase K dimers simulated in a solution at several temperatures (20, 30, 40, 60, 70, and 80 °C).
Crystals 12 01645 g001
Figure 2. The initial (A) and dissociated (B) structures of the dimer at 70 °C at the 0th and 100th nanosecond of simulation, correspondingly. The backbone of residues with the highest RMSF values (the most mobile) are represented with cyan sticks.
Crystals 12 01645 g002
Figure 3. RMSD graphs of Cα atoms of proteinase K dimers simulated in a solution at several temperatures (20, 30, 40, 60, 70, and 80 °C).
Crystals 12 01645 g003
Figure 4. RMSF of proteinase K dimers averaged over Cα atoms at different temperatures (from 20 to 80 °C). Saturated connected points represent data averaged over three independent simulations marked by unsaturated points.
Crystals 12 01645 g004
Figure 5. RMSD of proteinase K dimers averaged over Cα atoms at different temperatures (from 20 to 80 °C). Saturated connected points represent data averaged over three independent simulations marked by unsaturated points.
Crystals 12 01645 g005
Figure 6. Rg of proteinase K dimers averaged over Cα atoms at different temperatures (from 20 to 80 °C). Saturated connected points represent data averaged over three independent simulations marked by unsaturated points.
Crystals 12 01645 g006
Publisher’s Note: MDPI stays neutral with regard to jurisdictional claims in published maps and institutional affiliations.