Article

Fabrication and Characterization of Clinacanthus nutans Mediated Reduced Graphene Oxide Using a Green Approach

by
Dharshini Perumal
1,
Emmellie Laura Albert
2,
Norazalina Saad
3,
Taufiq Yap Yun Hin
4,
Ruzniza Mohd Zawawi
5,
Huey Fang Teh
6 and
Che Azurahanim Che Abdullah
1,2,3,*
1
Biophysics Laboratory, Department of Physics, Faculty of Science, Universiti Putra Malaysia, Serdang 43400, Malaysia
2
Institute of Nanoscience and Nanotechnology, Universiti Putra Malaysia, Serdang 43400, Malaysia
3
UPM-MAKNA Cancer Research Laboratory, Institute of Bioscience, Universiti Putra Malaysia, Serdang 43400, Malaysia
4
Catalysis Science and Technology Research Centre (PutraCAT), Faculty of Science, Universiti Putra Malaysia, Serdang 43400, Malaysia
5
Department of Chemistry, Faculty of Science, Universiti Putra Malaysia, Serdang 43400, Malaysia
6
Sime Darby Technology Centre, Lebuh Silikon, Universiti Putra Malaysia, Serdang 43400, Malaysia
*
Author to whom correspondence should be addressed.
Crystals 2022, 12(11), 1539; https://doi.org/10.3390/cryst12111539
Submission received: 15 September 2022 / Revised: 7 October 2022 / Accepted: 18 October 2022 / Published: 28 October 2022
(This article belongs to the Section Materials for Energy Applications)

Abstract

:
The reduction of graphene oxide (rGO) utilizing green methods such as plants has attracted much attention due to its productivity, eco—friendly features, and cost effectiveness. In the present study, the reflux method was employed to synthesize Clinacanthus nutans (C. nutans) leaf extract mediated rGO using a simple approach. The synthesized rGO was characterized using various spectroscopic and microscopic techniques. The UV-Vis spectrum demonstrated the absorption peak of rGO (270 nm) at distinct locations, while the FTIR analysis demonstrated that the amount of oxygen group in rGO was reduced. The Raman analysis confirms the reduction of GO by a slight increase in the D—band to G—band intensity ratio. The XRD spectra demonstrated that rGO was successfully produced based on the illustrated 2Ɵ angles at a peak of 22.12° with d-spacing of 0.40 nm. FESEM clearly reveals the morphology of rGO that shows crumpled thin sheets, a rougher surface, and a wave—shaped corrugated structure. The reduction of GO was analyzed in the removal of the hydroxyl group and amorphotization of sp2 carbon structures. The C/O ratio in rGO was higher than GO which indicates the small amount of oxygen-containing functional groups were still presented in the reduced graphene oxide. Furthermore, the cyclic voltammetry behavior of a modified screen—printed carbon electrode (SPCE) was measured. The redox reactivity of rGO—SPCE has been affirmed and compared with GO—SPCE and bare—SPCE. The toxicity using A. salina cysts demonstrated that rGO is less toxic compared to GO. The analysis adequately supports the synthesis of rGO and the effective removal of oxygen-containing functional groups from GO. The findings herein illustrate that C. nutans mediates the synthesis of rGO and is a promising eco-friendly substitute to conventional carbon-based fabrication.

1. Introduction

Since its discovery in 2004, graphene, a monolayer sp2 hybridized carbon atom arrayed in a hexagonal lattice, has sparked widespread interest among scientists in a wide variety of fields [1]. Graphene has a high specific surface area, excellent electrical, optical, and thermal conductivity and is extremely strong [2]. These exceptional properties enable graphene to be used in a wide variety of applications, including solar cells, super capacitors, biosensors, catalysts, drug delivery, water purification, and absorption of non-aqueous fluids, oils, olefins, aromatic compounds, dyes and organic solvents [3,4].
Chemical vapor deposition, micromechanical exfoliation of graphite, epitaxial growth of electrically insulating surfaces such as silicon carbide, and chemical reduction of exfoliated GO are just a few of the methods that can be used to synthesize graphene [5]. Among the graphene synthesis routes, the chemical reduction method is widely used because it is the cheapest, most versatile, and simplest method for producing graphene in bulk. After chemically oxidizing graphite to form GO, reducing agents are used to convert GO into graphene.
Numerous chemical reducing agents, such as hydrazine hydrate, sodium borohydride, hydroquinone, and dimethyl hydrazine have been reported for the reduction of GO [6]. However, the major disadvantage of the chemical reduction of GO to rGO is the toxicity of the reducing agents, which are costly, explosive, and harmful to human health and the ecological system [7,8].
Thus, in order to overcome the aforementioned difficulties, extensive research has been conducted on the production of rGO using green reductants. Organic acids, microorganisms, sugars, amino acids, proteins and plant extracts are the six major categories of green reducing agents [7]. Recent studies have demonstrated the efficacy of plant extracts in reducing GO, owing to the extracts feasibility, economics, and environmental safety [9]. There have been reports on Urtica dioica leaf [10], Euphorbia milli leaf [11], Eucalyptus leaf [12], Annona squamosa leaf [13], palm leaves [14] and Ocimum sanctum leaf [15], among others. Although numerous green reductants have been reported, no study has been undertaken using C. nutans as a green reductant to synthesize rGO.
Over the decades, interest in plant-based natural products as an alternative to contemporary synthetic medicine has developed quickly because they are safer and more potent. The powerful antioxidant effects of medicinal plants are well-known to aid in the recovery from disease and to improve general health. C. nutans (Acanthaceae family), as depicted in Figure 1, is locally referred to as the Sabah Snake grass or “Belalai gajah” in Malay and “you dun coa” in Mandarin [16]. It is a small annual shrub that grows wild in Southeast Asian countries such as Malaysia, China, Thailand, and Indonesia. The priceless medicinal plant is frequently used in folk medicine to treat viral infections, allergic reactions, insect and snake bites, diabetes mellitus, and gout [17]. C. nutans was added to Thailand’s National List of Essential Medicine in 2001 due to its elevated medicinal values [18].
C. nutans plants are widely propagated vegetatively via stem cuttings due to the low cost, simplicity, and high rate of multiplication [19]. Numerous bioactive chemical compounds were discovered in the leaves of C. nutans [20] with a variety of pharmacological properties, including anti—inflammatory, antiviral, antioxidant, antibacterial, antidiabetic, antihyperlipidemic, and anticancer properties [21,22]. Due to the benefits of C. nutans, it has been economically exploited to produce a variety of products, including extracts, juice, herbal beverages, and tea [23,24].
In this brief piece of study, we investigated the reducing ability of C. nutans leaf extracts for the reduction of GO utilizing a simple, economical, and environmentally friendly method that did not involve complicated laboratory setup or the use of hazardous chemicals. This study also focuses on the spectroscopic and microscopic characterization including ultraviolet-visible (UV—Vis) spectroscopy, X-ray diffraction (XRD) spectroscopy, Fourier transform infrared (FTIR) spectroscopy, Raman spectroscopy, energy dispersive X-ray (EDX) spectroscopy, and a field emission scanning electron microscope (FESEM) to demonstrate the reduction of GO to rGO. The prepared rGO were investigated for cyclic voltammetry to show their suitability for various electrochemical applications. In addition, the ecotoxicity study using hatching assay was also conducted. Furthermore, the goal of this study is to provide a framework for future researchers interested in green synthesis of rGO for various applications.

2. Materials and Methods

Graphite powder, <20 µm was purchased from Sigma Aldrich. Sulfuric acid (H2SO4, 98%), phosphoric acid (H3PO4, 85%), hydrogen peroxide (H2O2, 30%), hydrochloric acid (HCl, 37%), ethyl alcohol, and potassium permanganate (KMnO4) powder were obtained from R&M chemicals. Potassium chloride (KCl) was bought from ChemiZ (M) Sdn. Bhd. Potassium Hexacyanoferrate (III) was bought from Friedemann Schmidt. Screen—printed carbon electrodes (SPCEs) with a diameter of 4 mm were obtained from Metrohm Malaysia Sdn. Bhd. Deionized water (DI) was used throughout the experiment.

2.1. Graphene Oxide Preparation

GO was synthesized using Improved Hummers’ method based on Marcano et al. [25,26] with slight modification. In a nutshell, 3 g of graphite powder was added to a beaker. The graphite powder was then treated with a 9:1 solution of concentrated H2SO4/H3PO4 (360 mL: 40 mL). Following that, 18 g of KMnO4 was gradually added to the mixture in the beaker, resulting in a mild exothermic reaction reaching a temperature of 35–40 °C. The mixture was then brought to a temperature of 50 °C and stirred for 13 h. The mixture was allowed to cool to room temperature before being poured onto 400 mL of ice. Finally, 3 mL of 30% H2O2 was gradually added to the mixture until no bubbles were visible, forming a bright yellow suspension. Centrifuge the suspension at 3500 rpm for 30 min and discard the supernatants. The remaining pellet was then washed twice with 200 mL of DI water, 200 mL of 37% HCl and 200 mL of ethyl alcohol; the mixture was centrifuged (3500 rpm for 30 min) after each wash and the supernatant was decanted away. The pellet was dried in a freeze dryer to obtain a brown solid, yielding approximately 6.56 g of GO.

2.2. Preparation of Plant Material

C. nutans leaves were purchased from a local farmer in Kuala Lumpur, Malaysia. Fresh leaves were separated from stalks and cleaned on the surface with running tap water. Furthermore, C. nutans mature leaves were washed thoroughly with distilled water, and oven—dried at 50 °C. The dried leaves were then homogeneously ground to a fine powder using a household blender. Powdered leaves were kept in an airtight container within a desiccator.

2.3. Preparation of C. Nutans Leaf Extract

The procedure for preparing the C. nutans leaf extract was slightly modified from that reported in the literature for other leaf extracts. 15 g of finely powdered leaves were added to 150 mL of DI water in a 500 mL round bottom flask for this experiment. The compounds from the leaves were then extracted into the DI water by refluxing the mixture for 30 min at 90 °C on an oil bath. After bringing the solution to room temperature, it was centrifuged for 10 min at 3500 rpm to remove bulk waste. Finally, the obtained supernatant was filtered through Whatman filter paper (Grade 1; 11 µm) to remove any remaining trace solids. The filtrate, which contained the C. nutans leaf extract, was stored in a refrigerator (4 °C) for future use.

2.4. Reduced Graphene Oxide Synthesis Using Leaf Extracts

rGO was synthesized from the GO precursor using C. nutans leaf extract. To begin, 50 mL of DI water was added to 50 mg of GO powder, which was then sonicated for 1 h, resulting in a brown—colored dispersion. The homogenous GO dispersion was then treated with 50 mL of C. nutans leaf extract. The mixture was heated in an oil bath while being constantly stirred. For temperature optimization, reactions were carried out at different temperatures, namely 60, 80 and 100 °C, as shown in Table 1, while keeping the leaf extract concentration and time constant. When the reaction was stopped, the mixture was allowed to cool to room temperature. The mixture was centrifuged at 3500 rpm for 30 min. The pellet was then washed with DI water several times to remove any remaining contaminants. The results of the UV—Vis scan were used as the foundation for the next optimization study. Similarly, the concentration of leaf extract and time intervals were optimized while the other two parameters remained constant. Finally, the black precipitate known as rGO was freeze—dried in a vacuum chamber for 48 h. The color change from brownish yellow to black indicates deoxygenation of GO.

3. Characterization

3.1. Ultraviolet—Visible Spectroscopy

The optical measurements were performed using a spectrophotometer with an accuracy of ± 2 nm (Jenway 7315, Staffordshire, UK). Quartz cuvettes were used for the analysis, and DI water was used as the reference solvent. Stock solutions of GO and rGO were prepared by dispersing 3 mg of the sample in 3 mL of DI water and bath sonicated for 30 min. To prepare the UV samples of GO and rGO, 1 mL of stock solution was diluted with 9 mL of DI water. Spectra of absorption were acquired between 200 and 700 nm.

3.2. X-ray Diffraction Spectroscopy

The as-produced materials were analyzed with powder X-ray diffraction (SmartLab, Rigaku, Tokyo, Japan) using Cu Kα radiation (λ = 1.54 Å) by drying a dispersion of fine powder and packing them on a glass sample plate. The diffraction intensities were determined for all 2Ɵ angles ranging from 8° to 90° with a scanning rate of 5°/min operating at 30 mA and 40 kV as well as a step size of 0.01°.

3.3. Fourier Transform Infrared Spectroscopy

The data for the infrared spectroscopy were collected using attenuated total reflectance—Fourier transform infrared spectroscopy (FTIR—spectrum 400, Perkin Elmer, Waltham, MA, USA) with a wavelength range 400 – 4000 cm−1 with spectrum resolution of 0.5 cm−1 and wavelength accuracy of 0.1 cm−1 at 3000 cm−1.

3.4. Raman Spectroscopy

Raman spectroscopy of the synthesized GO and rGO was performed using a Raman spectrophotometer (uRaman-532 TEC-Ci, Technospex Pte Ltd., Singapore) in ambient conditions. The spectrum was recorded using an incident laser with an excitation wavelength of 532 nm, excitation power of 20 mW for 20 s exposure time in the spectrum range between 400 to 4000 cm−1 with wavenumber accuracy of ± 1 cm−1.

3.5. Field Emission Scanning Electron Microscopy and Energy Dispersive X-ray Spectroscopy

A field emission scanning electron microscope was used to characterize the morphology and microstructure of the prepared samples (Nova NanoSEM 230, FEI, Hillsboro, Oregon, OR, USA) while elemental composition was determined using energy dispersive X-ray spectroscopy incorporated with FESEM. Powdered GO and rGO were affixed to an aluminum stub using colloidal silver paint and allowed to dry before loading into the FESEM chamber.

3.6. CHNS-O Elemental Analysis

The ultimate analysis of component carbon (C), hydrogen (H), nitrogen (N), sulfur (S), and oxygen (O) was performed using a CHNS/O elemental analyzer (FlashSmart CHNS/O, Thermo Scientific, Waltham, MA, USA).

3.7. Electrochemical Measurements

The electrochemical experiments were carried out utilizing Metrohm Multi Autolab M101 with Nova 2.1.4 software (Barendrecht, The Netherlands) provided along with the apparatus. The GO and rGO solution were prepared by dispersing in ethanol solvent. 150 µL of the as—synthesized solution and 50 µL of chitosan were mixed for 3 min. The resulting mixture was dropped onto the surface of screen—printed carbon electrode (SPCE). The modified GO and rGO electrode were immediately utilized for analysis after being dried under a nitrogen stream. Cyclic voltammetry (CV) was performed for the modified electrode using a K3Fe (CN)6 as the redox probe. The redox process occurred because of oxidation of ferrocyanide ion and reduction of ferricyanide ion, in the presence of KCl as the supporting electrolyte. The potential range was between −0.3 V and 0.7 V with a scan rate of 100 mV/s. Prior to the analysis, the electrolyte was purged with nitrogen gas for 5–10 min to avoid the interferences caused by the oxygen.

3.8. Hatching Assay

Brine shrimp Artemia salina (A. salina) cysts were collected, processed, and tested to determine the percentage of hatching. 96—well plates were used for the experiment. Each well contained 10 cysts with varying concentrations of GO and rGO solution (0, 0.001, 0.01, 0.1, and 1.0 mg/mL). Five duplicates of each test concentration and the control were performed. To create a favorable environment for the cyst to hatch out, the experimental setup was exposed to light. After 24, 48, and 72 h of incubation, the number of hatched cysts was determined. The number of nauplii was subtracted from the total number of cysts stocked to calculate the percentage of hatched cysts. The results were tabulated and graphed.

4. Results and Discussion

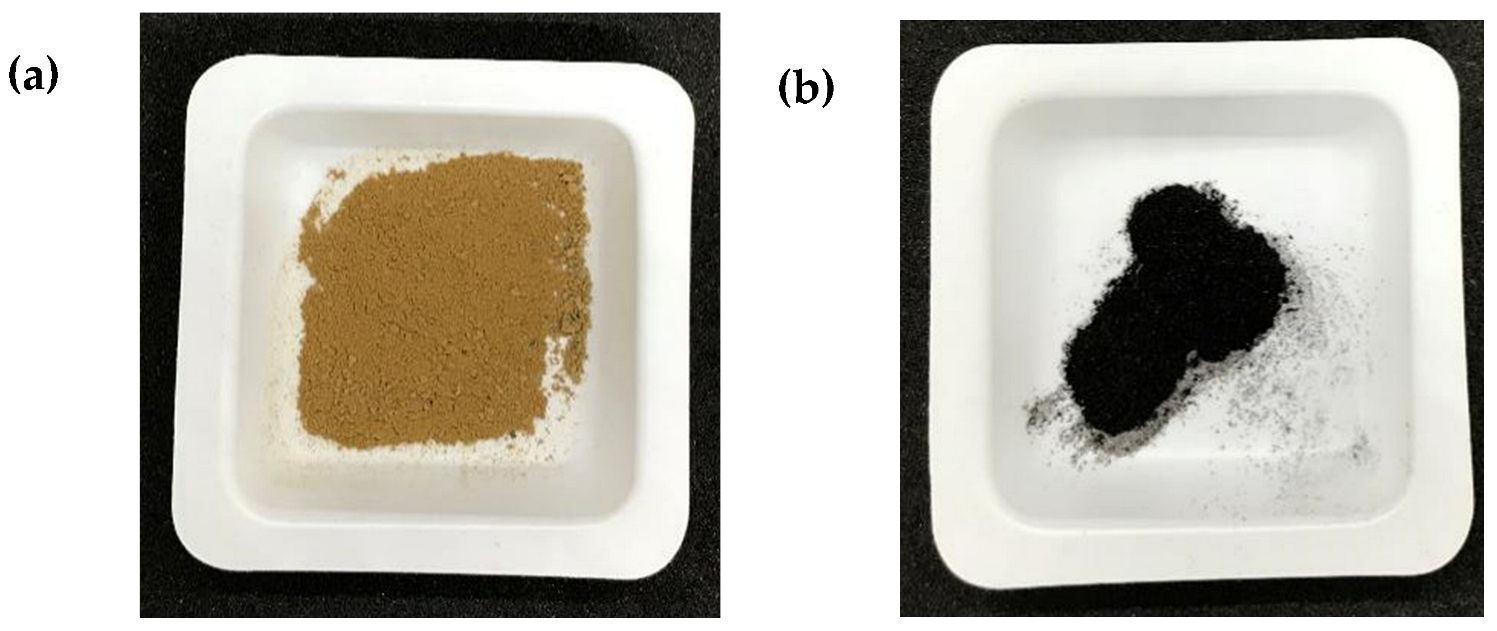
This work described a straightforward method for reducing GO using phytoextracts. During the reduction, C. nutans leaf extract acts as a reducing and stabilizing agent. The GO dispersion in DI water has a brownish yellow color (Figure 2a), whereas the C. nutans leaf extract is brown (Figure 2b). When the GO dispersion was combined with the leaf extract, the mixture took on a dark brown hue (Figure 2c), which darkened to black upon reduction (Figure 2d). The formation of a dark black suspension indicates that GO has been reduced to form rGO. The fabricated powders depicted in Figure 3 are GO and rGO.

4.1. Ultraviolet—Visible Analysis

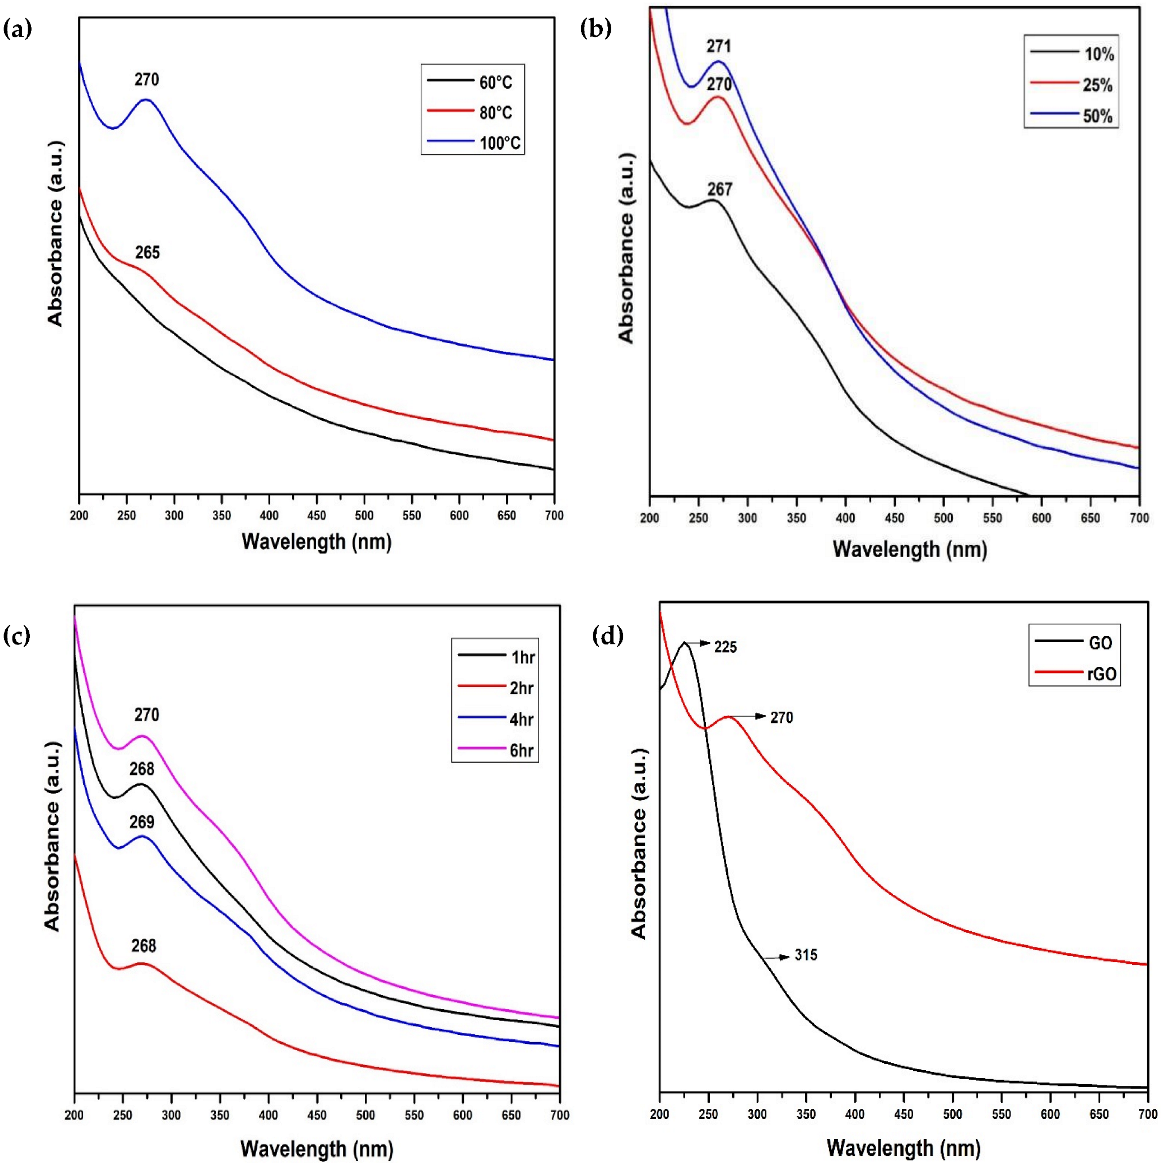
To investigate the bioreduction of GO, we examined the effect of temperature, leaf extract concentration, and reaction time on the formation of rGO. Initially, the degree of oxidation was determined using UV—Vis spectroscopy. The presence of various degrees of conjugation in GO and rGO was determined using the UV—Vis spectral maximum absorption peak (λmax) value. The absorption peak of rGO was determined at 60, 80 and 100 °C, as shown in Figure 4a. As the bioreduction process progressed, the absorption peak gradually increased in proportion to the increase in temperature [27]. This demonstrates that the rGO absorption peak is more efficient at higher temperatures. Following that, the effect of leaf extract concentration on GO reduction was investigated. At 100 °C, Figure 4b illustrates the changes in the optical absorbance of the GO mixture when different concentrations of C. nutans leaf extract (10, 25 and 50% v/v) are added to 1 mg/mL of GO. Because the absorption peaks position was redshifted to 271 nm as the leaf extract concentration increased, it was maintained at this ratio for further study [15]. At 100 °C and 50 % v/v of C. nutans leaf extract concentration, the effect of various times (reflux time) on the bioreduction of GO on the formation of rGO was investigated. The absorption spectra for four different periods are shown in Figure 4c (1, 2, 4 and 6 h). At 6 h, the maximum absorption peak was observed, indicating a wavelength of 270 nm [12]. However, additional qualitative data collection is required for a more detailed analysis. As a result, the optimal conditions for C. nutans leaf extract to reduce GO were as follows: 50 mL of leaf extract was added to 50 mL of GO (1 mg/mL) and incubated at 100 °C for 6 h.
The GO and rGO spectra are compared in Figure 4d. The optical absorption value of GO was 225 nm, which was attributed to the π-π * transitions of aromatic C=C bonds [28]. At 315 nm, a weak hump peak was observed due to the n-π * transition of the aromatic C=O functional group [29]. The plasmon peak of rGO assigned to the π-π * transitions of aromatic C=C bonds was redshifted to 270 nm, indicating that oxygen—bearing functional groups were successfully removed as a result of reduction by C. nutans leaf extract, and thus electrons require very little excitation energy [30]. This is consistent with the work of Lin et al., which shows the shift of the absorption peak to a higher wavelength of 270 nm using Euphorbia milli leaves extract [11]. Additionally, the color change of the GO precipitates from brownish yellow to black after reduction with C. nutans leaf extract suggests deoxygenation. This is most likely the outcome of an increase in the hydrophobicity of the material caused by a decrease in the polar functionality of the sheets surface [31]. As a result, the color changes to black can be a clear visual indicator that the C. nutans leaf extract is a bio—reductant.

4.2. X-ray Diffraction Analysis

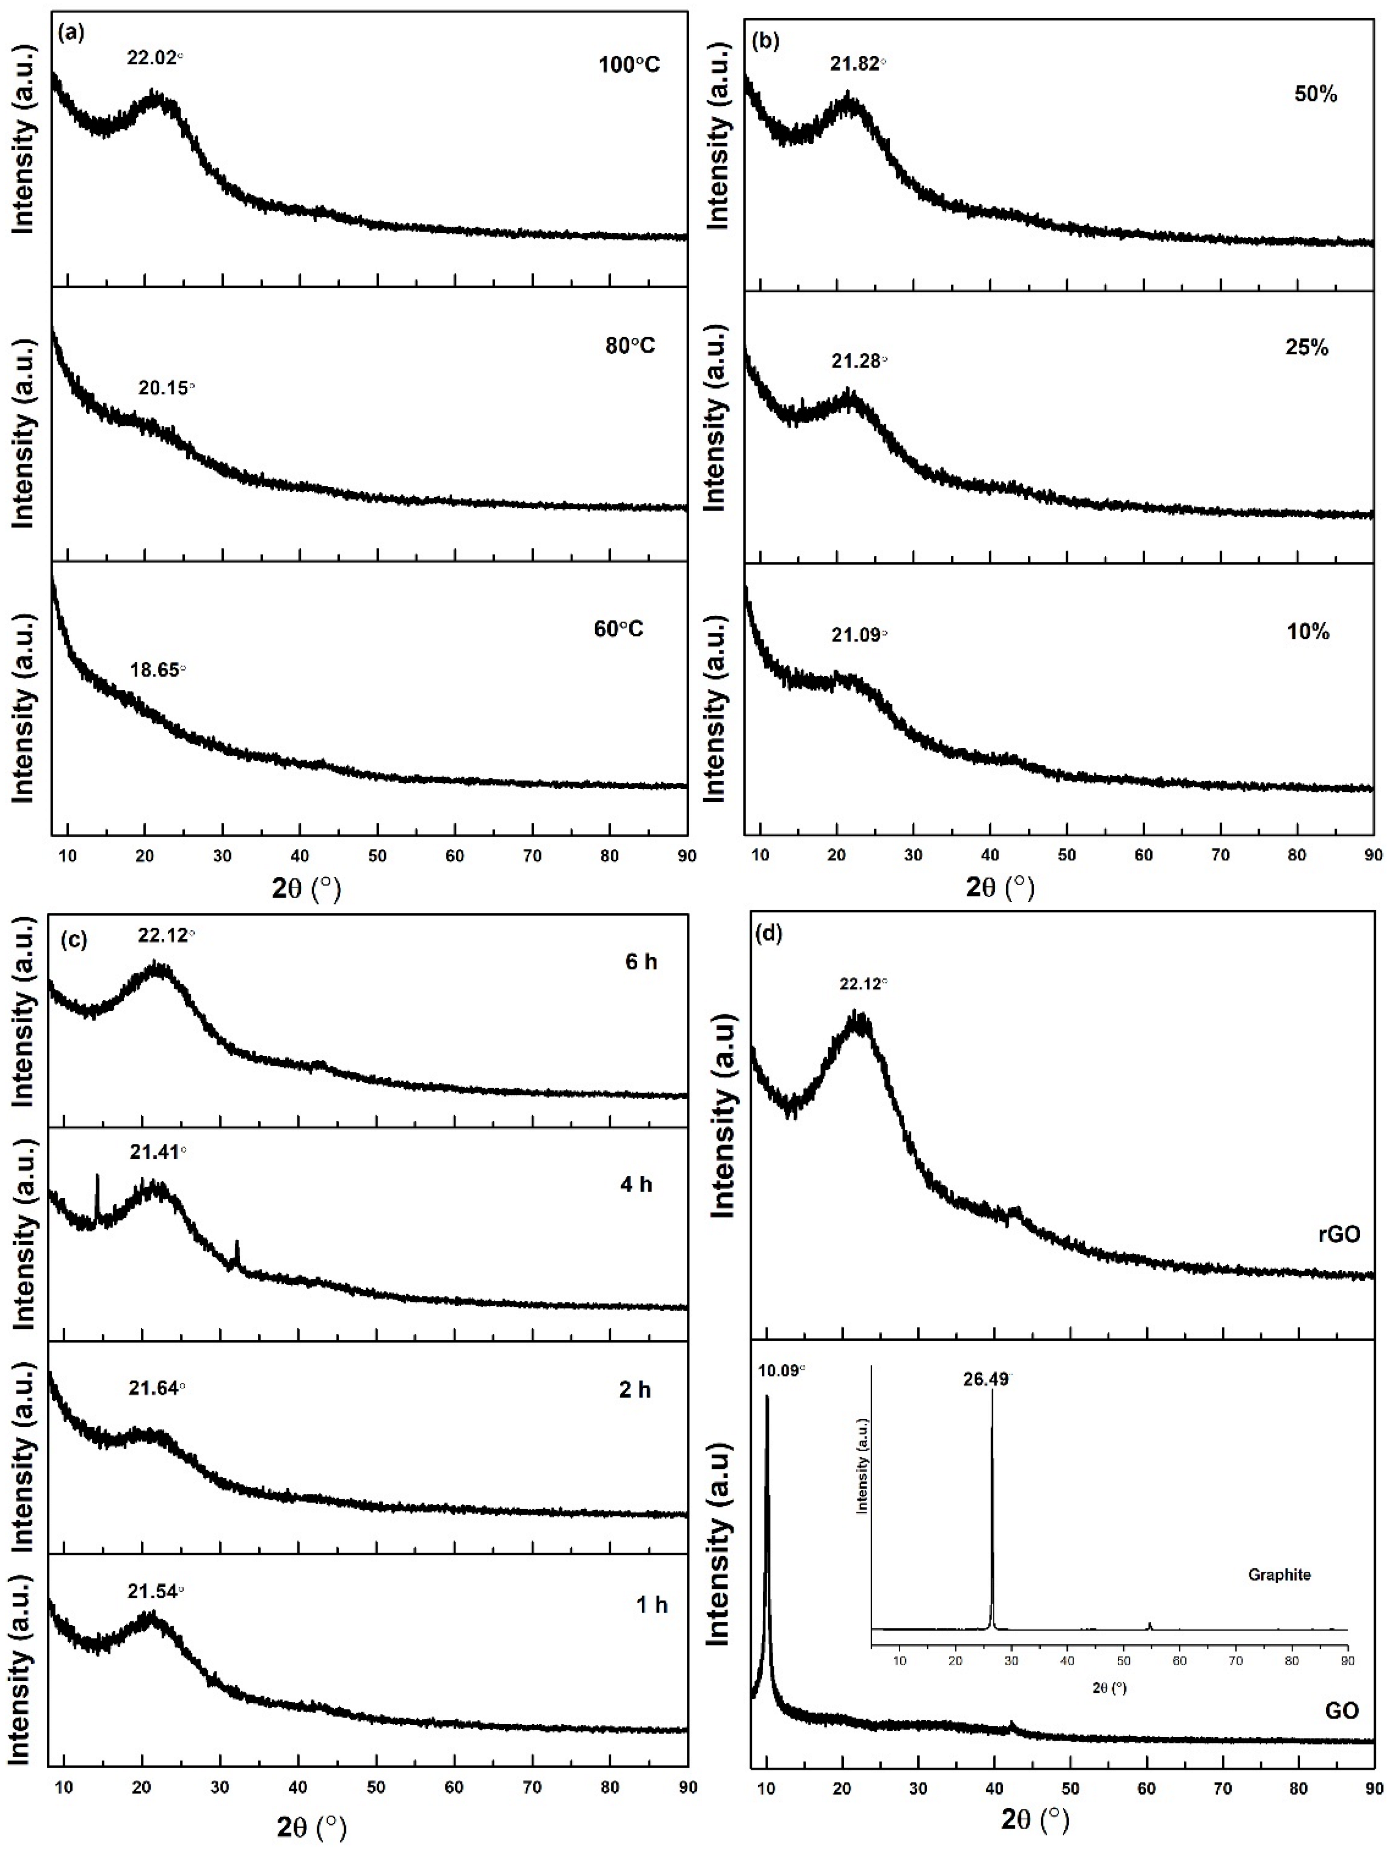
The XRD configuration used to confirm the deoxygenation of GO was illustrated in Figure 5 for various (a) temperatures, (b) concentration of C. nutans leaf extract, (c) time, and (d) GO and rGO. The interlayer spacing shown in Table 2 corroborates the UV—Vis absorption spectra. The biosynthesis of rGO at a temperature of 100 °C, a concentration of 50% v/v C. nutans leaf extract, and a reflux time of 6 h results in the lowest d—spacing value. The spectra of GO and rGO were observed to be crystalline and amorphous in nature. A prominent and distinct diffraction peak for pure graphite can be seen at 2Ɵ = 26.49° with a 0.34 nm layer separation. After chemical exfoliation and oxidation of graphite, the XRD pattern of GO exhibits a peak shift toward a lower angle at approximately 2Ɵ = 10.09° and an increase in the d—spacing value from 0.34 nm to 0.88 nm in comparison to graphite, revealing the insertion of water molecules and oxygen—containing groups from the oxidizing agent KMnO4 via the intercalating agent H2SO4 between the graphite layers. When graphite is chemically oxidized, a large amount of oxygen—containing functional groups is formed at its basal plane (hydroxyl and epoxy) and at its edges (carboxyl and carbonyl). This increases the interlayer space between the graphite layers. Thus, by introducing reducing agents, the oxygen-containing functional groups weaken the interlayer van der Waals interaction between the layers, allowing them to disintegrate into graphene or rGO fragments [32]. The produced rGO exhibits a broad diffraction peak at 2Ɵ = 22.12° with a layer distance of 0.40 nm as previously reported in the literature [13]. The position of the diffraction peak is similar to that of graphite powder, indicating that graphitic work is efficiently restored during reduction through the elimination of oxygen moieties [33]. This value was slightly greater than that of well-ordered natural graphite, which may be due to the presence of trace amounts of residual oxygen—containing functional groups or other structural defects [34]. It is a characteristic of rGO with few layers that results in a more diffuse and less intense peak in the XRD spectrum [35]. The peak at 2Ɵ = 10.09° was interesting to eliminate because it demonstrated that oxygen—containing groups in GO were efficiently removed following reduction [31]. As a result, the XRD results confirm that GO was successfully reduced using C. nutans leaf extract.

4.3. Fourier Transform Infrared Analysis

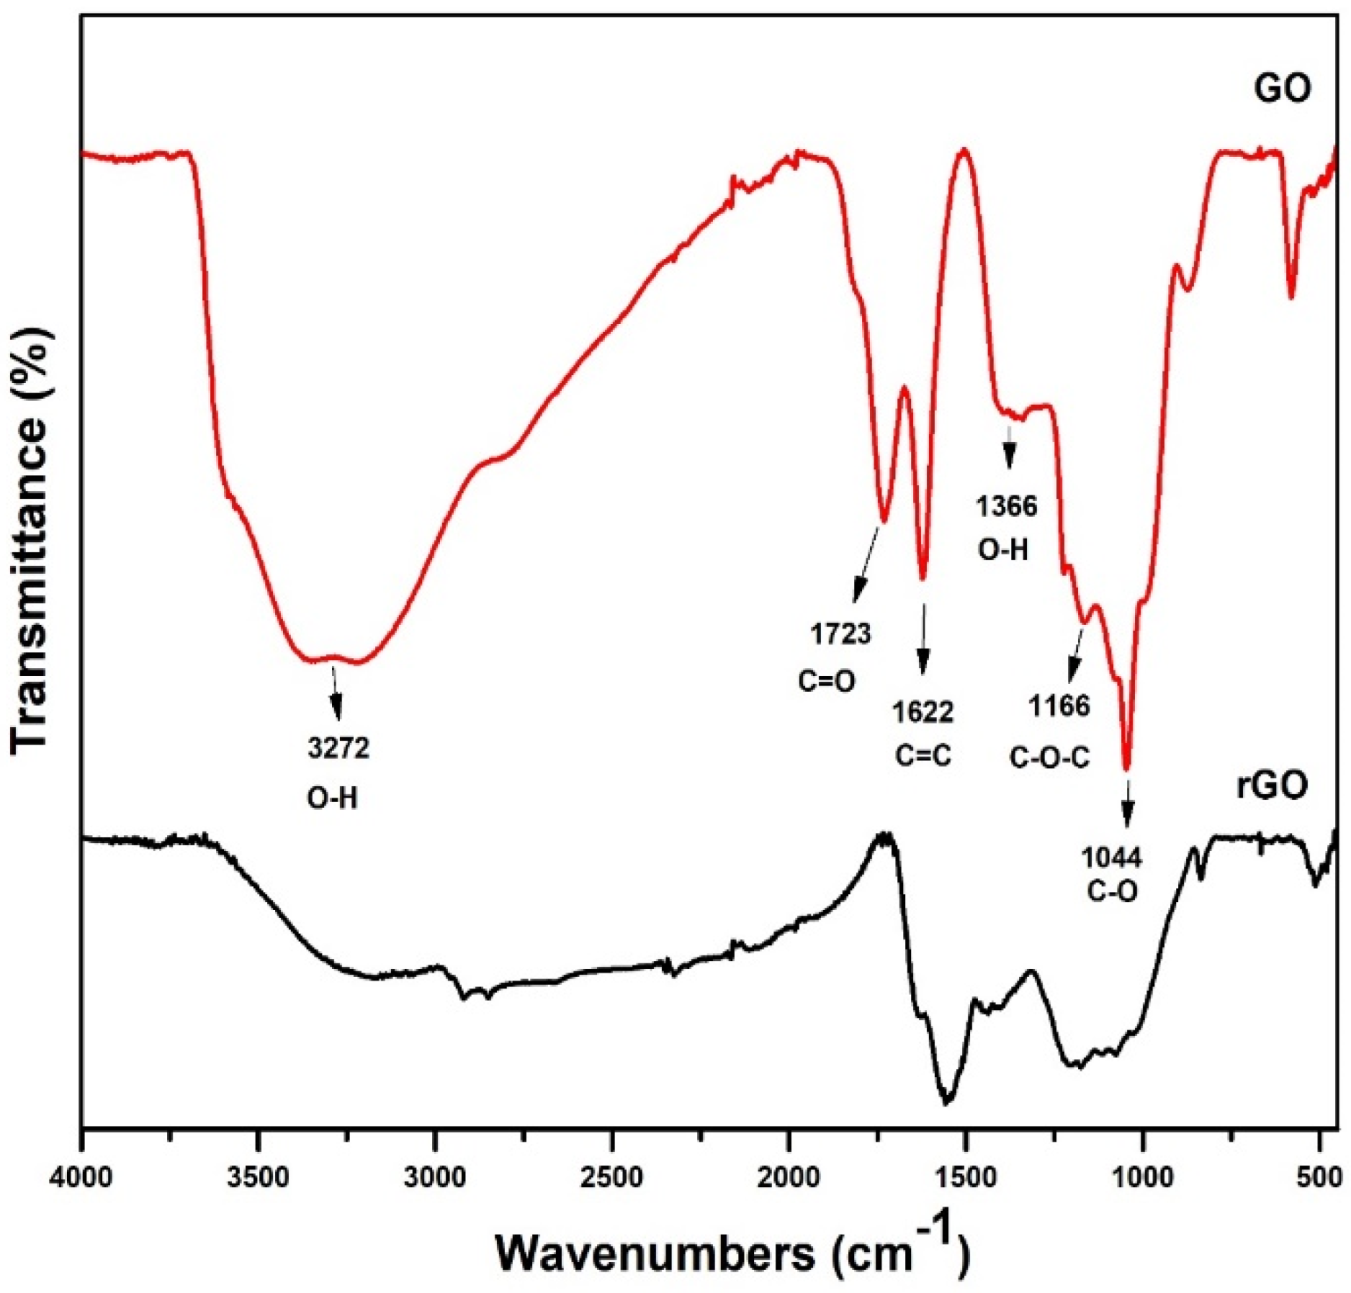
The presence of functional groups in the samples was determined by FTIR analysis of the obtained vibrational spectra. After oxidation, GO is expected to contain a greater number of oxygen—containing functional groups. The presence of hydroxyl groups was confirmed by the presence of intense and broad peaks in GO at a wavelength of 3272 cm−1 (O—H), stretching vibrations of carbonyl or carboxyl groups (C=O) at 1723 cm −1, and C—O stretching vibration is indicated by the peak at 1044 cm−1 [30]. Additionally, the stretching vibration of C=C at 1622 cm−1 originates from unoxidized graphitic domains and another peak at approximately 1366 cm−1 revealed the presence of O—H bending of the carboxyl functional group [36]. A peak at 1166 cm−1 corresponded to the C—O—C group [37]. With the presence of all of these carboxylic, hydroxyl, epoxide, and carbonyl groups, oxygen molecules were found to be highly occupied at the edges and basal plane of GO, indicating that GO was successfully synthesized [38]. However, after reduction, rGO is expected to contain a negligible number of functional groups containing oxygen. As shown in Figure 6, all bands associated with oxygen—carrying functional groups have been nearly or fully eliminated from the FTIR spectrum following reduction processes by the reducing agent, which supports GO reduction to rGO. The elimination of the hydroxyl group results in a flattening of the broad peak at approximately 3200 cm−1 in the formed rGO [30].

4.4. Raman Characterization

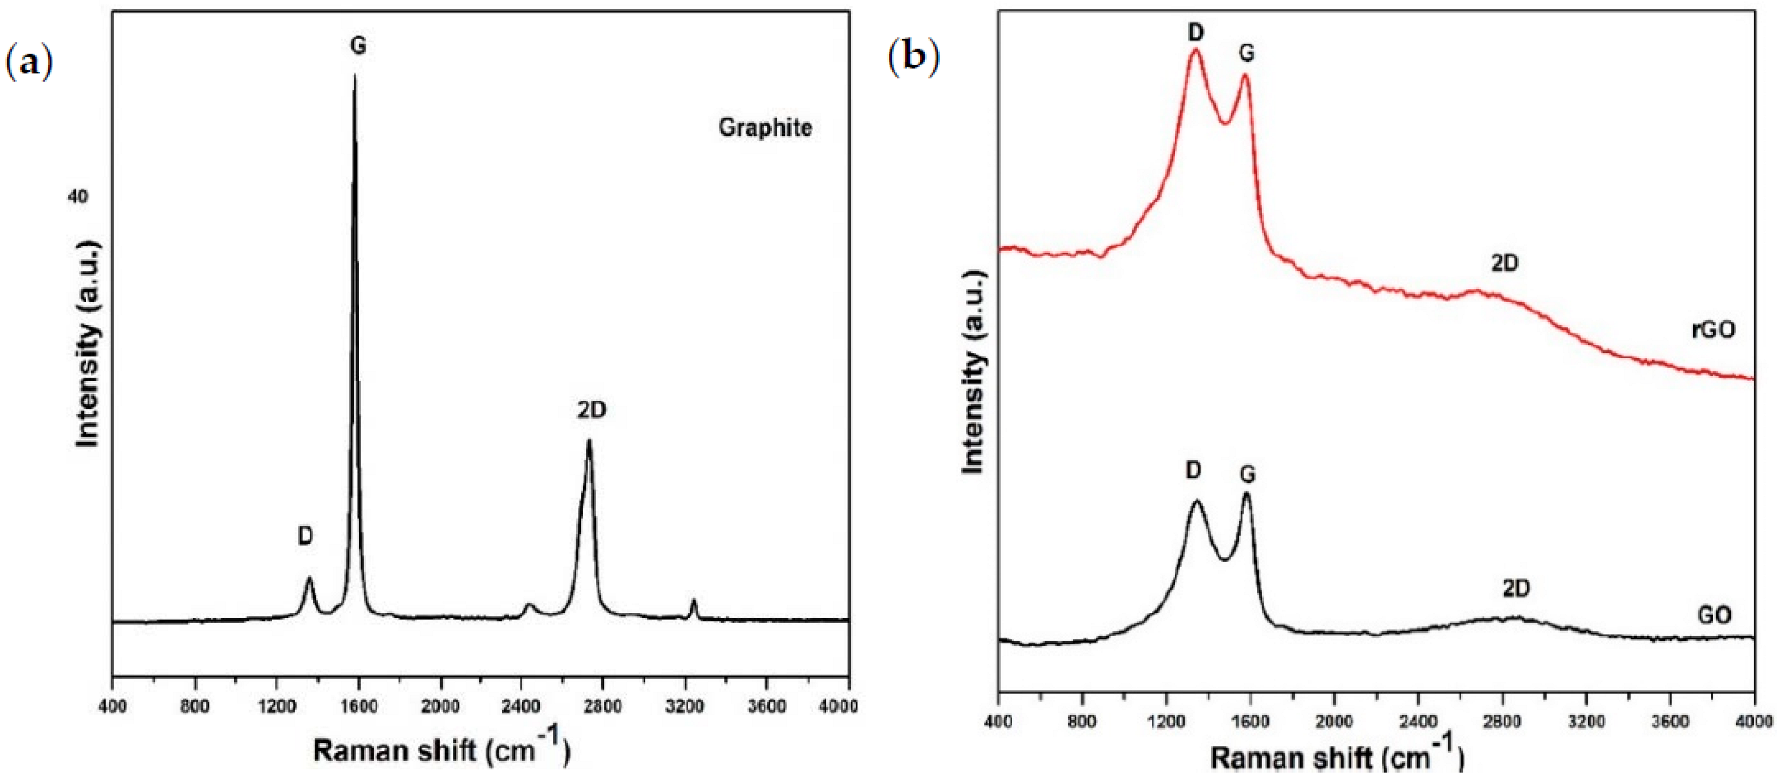
Raman spectroscopy is a well-established technique for determining the electronic and structural properties of graphene while taking defect and disorder patterns into account. Two fundamental vibrations for GO and rGO can be examined at 1350 cm−1 (D—band) and 1577 cm−1 (G—band). The D vibration band is formed by the breathing in—plane zone—edge mode of the k-point photons of A1g symmetry assigned to structural imperfections caused by oxygenated group attachment to the carbon basal plane, while the G vibration band is generated by the first order scattering of the doubly degenerate E2g phonons in plane by sp2 carbon [39,40]. As illustrated in Figure 7, the characterized peaks of GO at 1349.76 cm−1 (D—band) and 1576.55 cm−1 (G—band) have been shifted to rGO at 1342.19 cm−1 and 1565.57 cm−1, respectively, based on Raman spectrum [41]. All kinds of sp2 carbon exhibit the same intensity ratio between the disorder-induced D band and the G band, demonstrating the disordered nature of the graphene structure. As listed in Table 3, the D—band to G—band intensity ratio (ID/IG) was slightly increased from 1.01 in GO to 1.08 in rGO [42]. The defects caused by the removal of oxygen—containing functional groups from GO are demonstrated by the higher intensity ratio of rGO and the reduction of the in-plane size of sp2 domains following reduction [36].

4.5. Field Emission Scanning Electron Microscopic Analysis and Energy Dispersive X-ray Spectroscopy Analysis

At a magnification of 100,000x, FESEM was used to examine the surface morphology of GO and synthesized rGO, as shown in Figure 8. A micrograph of the GO obtained from the Improved Hummers’ approach reveals wrinkly edges, a smooth, sheet—like structure, and layers of flaking material on the surface [39]. Flakes illustrate that the graphene surface has a large number of oxygen—containing functional groups, which results in the formation of GO. In comparison to GO, an improvement in the surface morphology of rGO was observed. The micrograph of rGO reveals crumpled thin sheets, a rougher surface, and a wave-shaped corrugated structure [43]. The wrinkled appearance of the thin sheets was a common feature of rGO [44]. Although the biomolecules from C. nutans leaf extract dispersed well in aqueous solution, the rGO surface exhibited minute creases, which could be attributed to the biomolecules adhering to the rGO surface during the reduction process [12]. The FESEM images demonstrate that the reduction of GO to rGO was successfully attained using C. nutans leaf extract.
Table 4 contains the energy dispersive spectra of GO and rGO. It demonstrates both the presence of carbon (C) and oxygen (O) atoms. Given that the elemental composition is determined by EDS, the values of the atomic ratio (C/O) can be used to quantify the reduction of GO to rGO. The low O content of rGO ensures that it is effectively reduced via green synthesis. The C and O atomic percentages in GO were determined to be 66.8% and 30.3%, respectively. The spectrum of rGO revealed a C content of 72.7% and O of 12.4%, respectively. This information is consistent with the prior literatures [14,45]. However, the traces of O, S, Ca, N, Mg, and Si that were obtained were attributed to the presence of bioactive molecules of C. nutans leaf extract on the surface of rGO [46,47].

4.6. CHNS/O Elemental Analysis

The ultimate analysis of component carbon (C), hydrogen (H), nitrogen (N), sulfur (S) and oxygen (O) was performed using a CHNSO analyzer (Thermo Scientific, FlashSmart CHNS/O) and the results are shown in Table 5. As it can be seen from Table 5, GO consists of 39.10% of carbon and 38.92% of oxygen, whereas rGO consists of 46.32% of C and 26.90% of O. After the reduction, the C/O ratio for rGO is higher indicating less oxygen content.

4.7. Electrochemical Analysis

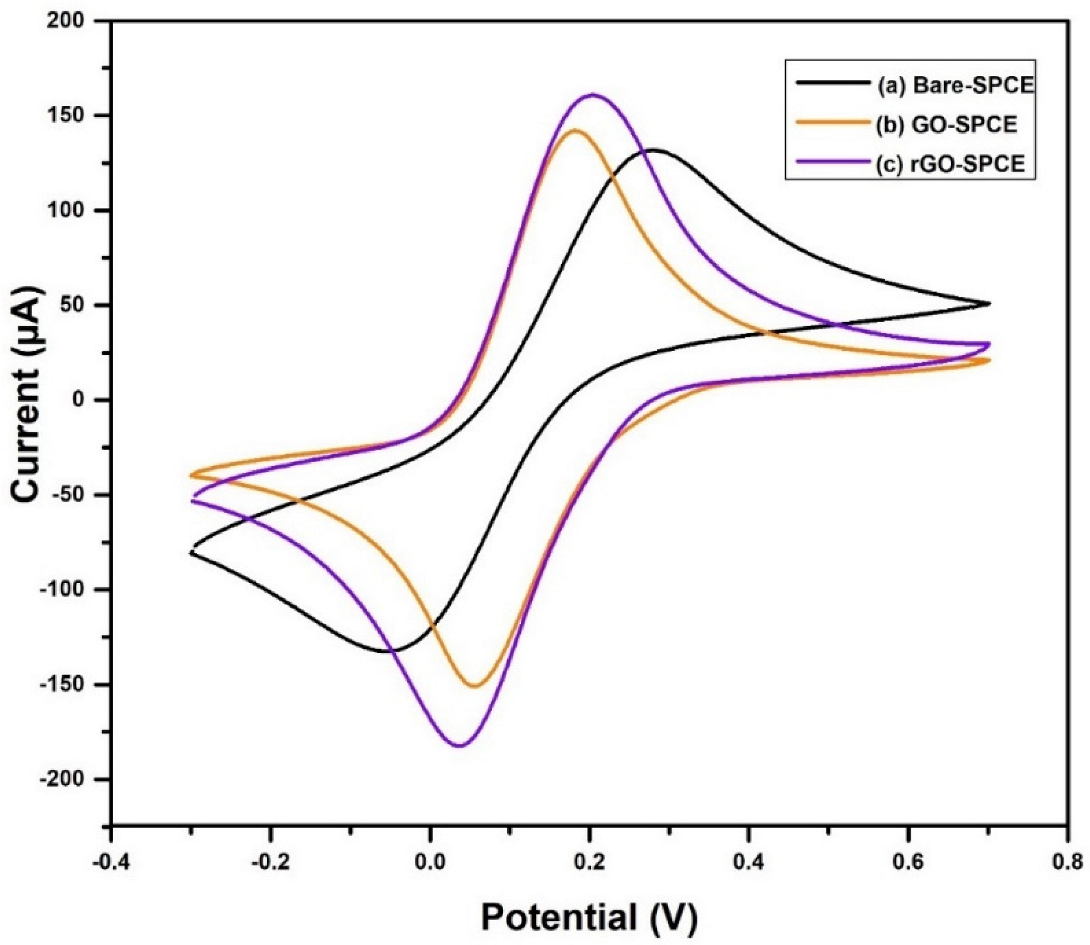
The redox reactivity performance of modified GO—SPCE and rGO—SPCE can be seen through cyclic voltammetry analytical studies. The electrochemical properties of modified SPCE were investigated by electron transfer by 0.1 M KCl and 5 mM K3[Fe (CN)6] as an electrolyte. Figure 9 illustrates redox reactivity of bare—SPCE, modified GO—SPCE and rGO—SPCE. The peak current for the rGO—SPCE electrode showed the highest peak compared to GO—SPCE and bare—SPCE. This implies that rGO gave higher electrical conductivity than bare—SPCE and GO—SPCE. The findings are in accordance with a previous study conducted for green reduction of GO using Bougainvillea glabra flower extract [48].

4.8. Hatching Assay Analysis

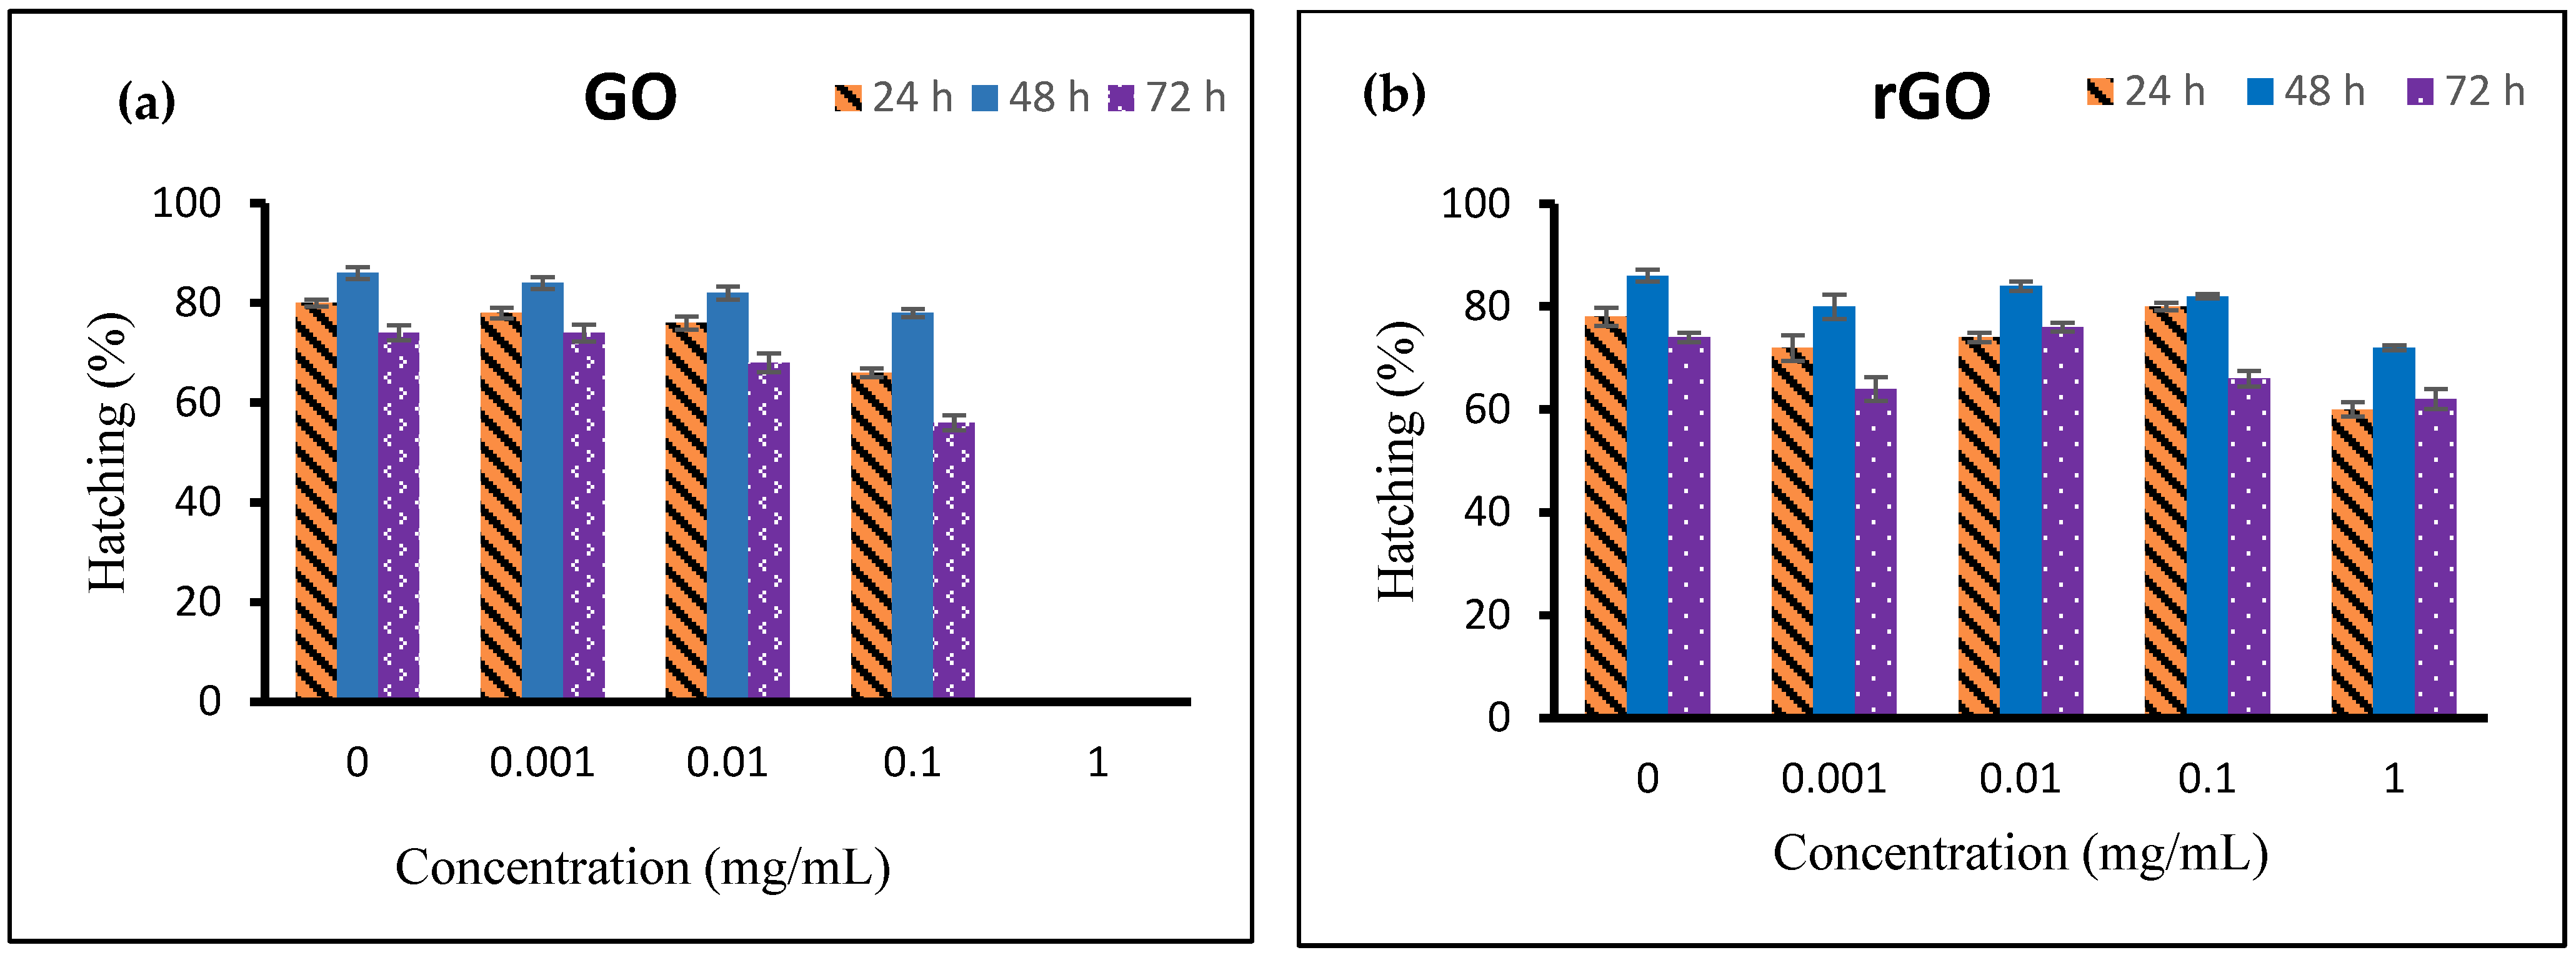
International Organization for Standardization (ISO) guidelines have been introduced to assess the aquatic acute toxicity of nanoparticles by a standardized testing procedure using Artemia species nauplii [49]. The assay has been used for the detection of heavy metals, the toxicity of plant extracts, the toxicity of fungi, various carbon—based materials, and the toxicity of nanoparticles. It is regarded as a valuable tool for the preliminary assessment of toxicity [49,50]. A. salina is a non-selective filter—feeding invertebrate zooplankton organism that can be found in highly saline water all over the world [51]. In comparison to other crustaceans, A. salina has an incredibly basic feeding mechanism; it is a phagotrophic filter-feeder that feeds continuously and non—selectively. Regardless of the type of suspended particle, A. salina consumes it continually. An earlier study discovered that A. salina consumes nanoparticles following exposure, which is demonstrated by the absence of aggregated nanoparticles under a microscope [52]. The hatchability of A. salina cysts was shown to be affected by the GO synthesis using the Improved Hummers’ method as shown in Figure 10a. GO showed dose—dependent decreases in hatching rates for A. salina cysts at 24 h, 48 h, and 72 h when compared to the control. In 24 h of treatment with a concentration of 0.001–0.1 mg/mL, the hatching percentage slightly reduced compared to the control. After that, the unhatched cyst in 24 h of treatment hatched after 48 h. Some cysts hatched at 72 h, however the vast majority of hatched nauplii died of starvation because the nanoparticles are too large for the A. salina to consume. At 1 mg/mL, no A. salina cysts hatched within 72 h when it was treated with GO. The thick covering of GO blocked light from reaching the A. salina, thus preventing hatching. The data are in agreement with previous research [53]. Figure 10b depicts the hatching rate of A. salina cysts when exposed to rGO. The hatching percentage exposed to rGO at varying concentrations from 0.001 mg/mL to 0.1 mg/mL, appeared to be slightly lower than the control in 24 h of treatment. When the concentration is increased to 1 mg/mL, the hatching rate is dramatically reduced. After 48 h, the hatching rate increased marginally, suggesting that more cysts had hatched. Even after 72 h, the remaining unhatched cysts hatch, while most hatched cysts died from starvation, probably from a lack of nutrients. Comparatively, the hatching rate of cysts treated with GO and rGO at a concentration of 0.001 to 0.1 mg/mL is almost similar and it is between 60% and 70% after 24 h. At 1 mg/mL, rGO is more biocompatible to A. salina cyst than GO since no cyst can develop at this concentration. Both GO and rGO exhibit a greater percentage of hatching cysts after 48 h, indicating their biocompatibility. The biocompatibility of rGO might be due to the green reducing agent which is C. nutans. This finding corroborates the data found in a previous study which indicate the rGO is not toxic to A. salina at low concentrations [54].

5. Conclusions

Finally, rGO was successfully developed and characterized using C. nutans leaf extract. Our environmentally friendly reduction process is non—toxic, effective, simple, and cost—effective. A variety of spectroscopic and microscopic techniques were used to characterize the synthesized rGO. Data analysis from UV—Vis, XRD, FTIR, Raman, CHNS/O, FESEM, and EDS tests demonstrated that the synthesis process was effective. Using cyclic voltammetry, rGO—SPCE revealed the highest peak in terms of electrochemical activity. Ecotoxicity testing on brine shrimp cysts revealed lower toxicity after rGO exposure. The findings suggested that the current technique, rather than chemical reduction, is feasible. The method promotes the avoidance of hazardous chemicals while meeting the demand for graphene derivatives. Furthermore, this will open new opportunities for a wide range of graphene derivative applications.

Author Contributions

Conceptualization, D.P. and C.A.C.A.; methodology, D.P., C.A.C.A. and R.M.Z.; validation, D.P. and C.A.C.A.; formal analysis, D.P. and E.L.A.; investigation, D.P.; resources, N.S., R.M.Z., T.Y.Y.H. and H.F.T.; writing—original draft preparation, D.P.; writing—review and editing, C.A.C.A.; visualization, E.L.A.; supervision, C.A.C.A.; project administration, C.A.C.A. All authors have read and agreed to the published version of the manuscript.

Funding

This work was supported by Kurita Water and Environment Foundation, Tokyo, Japan [Grant number: 20Pmy046-122, 2020; 21Pmy154-31k].

Institutional Review Board Statement

Not applicable.

Informed Consent Statement

Not applicable.

Data Availability Statement

On reasonable request, the corresponding author will provide the datasets created/or analyzed during the work.

Acknowledgments

The authors express their sincere thanks to Sime Darby Technology Centre Sdn Bhd for their support and for providing the infrastructure to carry out this work. Special thanks to Mohd. Zairey Md. Zain and Theresa Ng for their assistance with the laboratory equipment. The authors express their gratitude to Tan Wen Siang from Universiti Putra Malaysia for providing ultraviolet-visible spectroscopy usage. The authors are also thankful to Nazzatush Shimar from University of Malaya for providing access to FTIR instruments.

Conflicts of Interest

The authors declare that there are no conflicts of interest to disclose.

References

  1. Geim, A.K.; Novoselov, K.S. The rise of graphene. Nat. Mater. 2007, 6, 183–191. [Google Scholar] [CrossRef]
  2. Whitener, K.E.; Sheehan, P.E. Diamond & Related Materials Graphene synthesis. Diam. Relat. Mater. 2014, 46, 25–34. [Google Scholar] [CrossRef]
  3. Mbayachi, V.B.; Ndayiragije, E.; Sammani, T.; Taj, S.; Mbuta, E.R.; khan, A.U. Graphene synthesis, characterization and its applications: A review. Results Chem. 2021, 3, 100163. [Google Scholar] [CrossRef]
  4. La, D.D.; Nguyen, T.A.; Nguyen, T.T.; Ninh, H.D.; Thi, H.P.N.; Nguyen, T.T.; Nguyen, D.A.; Dang, T.D.; Rene, E.R.; Chang, S.W.; et al. Absorption behavior of graphene nanoplates toward oils and organic solvents in contaminated water. Sustainability 2019, 11, 7228. [Google Scholar] [CrossRef] [Green Version]
  5. Bhuyan, M.S.A.; Uddin, M.N.; Islam, M.M.; Bipasha, F.A.; Hossain, S.S. Synthesis of graphene. Int. Nano Lett. 2016, 6, 65–83. [Google Scholar] [CrossRef] [Green Version]
  6. Behar, D.; Rajh, T.; Liu, Y.; Connell, J.; Stamenkovic, V.; Rabani, J. Unusual Reduction of Graphene Oxide by Titanium Dioxide Electrons Produced by Ionizing Radiation: Reaction Products and Mechanism. J. Phys. Chem. C 2020, 124, 5425–5435. [Google Scholar] [CrossRef]
  7. De Silva, K.K.H.; Huang, H.H.; Joshi, R.K.; Yoshimura, M. Chemical reduction of graphene oxide using green reductants. Carbon N. Y. 2017, 119, 190–199. [Google Scholar] [CrossRef]
  8. Wang, Y.; Zhang, P.; Fang Liu, C.; Zhan, L.; Fang Li, Y.; Huang, C.Z. Green and easy synthesis of biocompatible graphene for use as an anticoagulant. RSC Adv. 2012, 2, 2322–2328. [Google Scholar] [CrossRef]
  9. Ismail, Z. Green reduction of graphene oxide by plant extracts: A short review. Ceram. Int. 2019, 45, 23857–23868. [Google Scholar] [CrossRef]
  10. Mahmudzadeh, M.; Yari, H.; Ramezanzadeh, B.; Mahdavian, M. Highly potent radical scavenging-anti-oxidant activity of biologically reduced graphene oxide using Nettle extract as a green bio-genic amines- based reductants source instead of hazardous hydrazine hydrate. J. Hazard. Mater. 2019, 371, 609–624. [Google Scholar] [CrossRef]
  11. Lin, S.; Ruan, J.; Wang, S. Biosynthesized of reduced graphene oxide nanosheets and its loading with paclitaxel for their anti cancer effect for treatment of lung cancer. J. Photochem. Photobiol. B Biol. 2019, 191, 13–17. [Google Scholar] [CrossRef]
  12. Jin, X.; Li, N.; Weng, X.; Li, C.; Chen, Z. Green reduction of graphene oxide using Eucalyptus leaf extract and its application to remove dye. Chemosphere 2018, 208, 417–424. [Google Scholar] [CrossRef]
  13. Chandu, B.; Sai, V.; Mosali, S.; Mullamuri, B.; Bollikolla, H.B. A facile green reduction of graphene oxide using Annona squamosa leaf extract. Carbon Lett. 2017, 21, 74–80. [Google Scholar] [CrossRef] [Green Version]
  14. Faiz, M.S.A.; Azurahanim, C.A.C.; Raba, S.A.; Ruzniza, M.Z. Low Cost and Green Approach in The Reduction of Graphene Oxide (GO) Using Palm Oil Leaves Extract for Potential in Industrial Applications. Results Phys. 2020, 16, 102954. [Google Scholar] [CrossRef]
  15. Mahata, S.; Sahu, A.; Shukla, P.; Rai, A.; Singh, M.; Rai, V.K. The novel and efficient reduction of graphene oxide using Ocimum sanctum L. leaf extract as an alternative renewable bio-resource. N. J. Chem. 2018, 42, 19945–19952. [Google Scholar] [CrossRef]
  16. Teoh, P.L. A minireview on phytochemical and medicinal properties of Clinacanthus nutans. J. Appl. Pharm. Sci. 2021, 11, 15–21. [Google Scholar] [CrossRef]
  17. Kuo, X.; Herr, D.R.; Ong, W.Y. Anti-inflammatory and Cytoprotective Effect of Clinacanthus nutans Leaf But Not Stem Extracts on 7-Ketocholesterol Induced Brain Endothelial Cell Injury. NeuroMolecular Med. 2021, 23, 176–183. [Google Scholar] [CrossRef]
  18. Ismail-Embong, N.; Manan, N.A.; Md Salleh, N.A.; Pa’ee, F. The effect of different growing media on growth performance of Clinacanthus nutans. IOP Conf. Ser. Earth Environ. Sci. 2021, 736, 012026. [Google Scholar] [CrossRef]
  19. Fong, S.Y.; Piva, T.; Urban, S.; Huynh, T. Genetic homogeneity of vegetatively propagated Clinacanthus nutans (Acanthaceae). J. Med. Plants Res. 2014, 8, 903–914. [Google Scholar] [CrossRef] [Green Version]
  20. Alam, A.; Ferdosh, S.; Ghafoor, K.; Hakim, A.; Juraimi, A.S.; Khatib, A.; Sarker, Z.I. Clinacanthus nutans: A review of the medicinal uses, pharmacology and phytochemistry. Asian Pac. J. Trop. Med. 2016, 9, 402–409. [Google Scholar] [CrossRef]
  21. Bong, F.J.; Yeou Chear, N.J.; Ramanathan, S.; Mohana-Kumaran, N.; Subramaniam, S.; Chew, B.L. The development of callus and cell suspension cultures of Sabah Snake Grass (Clinacanthus nutans) for the production of flavonoids and phenolics. Biocatal. Agric. Biotechnol. 2021, 33, 101977. [Google Scholar] [CrossRef]
  22. Chamutpong, S.; Chen, C.J.; Chaiprateep, E.O. Optimization ultrasonic-microwave-assisted extraction of phenolic compounds from Clinacanthus nutans using response surface methodology. J. Adv. Pharm. Technol. Res. 2021, 12, 190–195. [Google Scholar] [CrossRef]
  23. Kasim, K.F.; Husin, N.; Shamsudin, S.; Amer, N.A.M.; Salleh, N.H.M.; Sofian-Seng, N.S. Impact of commercial cellulase enzyme on the quality of Clinacanthus nutans extracts. IOP Conf. Ser. Earth Environ. Sci. 2021, 765, 012007. [Google Scholar] [CrossRef]
  24. Kamarudin, M.N.A.; Sarker, M.M.R.; Kadir, H.A.; Ming, L.C. Ethnopharmacological uses, phytochemistry, biological activities, and therapeutic applications of Clinacanthus nutans (Burm. f.) Lindau: A comprehensive review. J. Ethnopharmacol. 2017, 206, 245–266. [Google Scholar] [CrossRef]
  25. Marcano, D.C.; Kosynkin, D.V.; Berlin, J.M.; Sinitskii, A.; Sun, Z.; Slesarev, A.; Alemany, L.B.; Lu, W.; Tour, J.M. Improved synthesis of graphene oxide. ACS Nano 2010, 4, 4806–4814. [Google Scholar] [CrossRef]
  26. Nasir, S.; Hussein, M.; Yusof, N.; Zainal, Z. Oil Palm Waste-Based Precursors as a Renewable and Economical Carbon Sources for the Preparation of Reduced Graphene Oxide from Graphene Oxide. Nanomaterials 2017, 7, 182. [Google Scholar] [CrossRef] [Green Version]
  27. Baioun, A.; Kellawi, H.; Falah, A. A modified electrode by a facile green preparation of reduced graphene oxide utilizing olive leaves extract. Carbon Lett. 2017, 24, 47–54. [Google Scholar] [CrossRef]
  28. Umar, M.F.; Ahmad, F.; Saeed, H.; Usmani, S.A.; Owais, M.; Rafatullah, M. Bio-mediated synthesis of reduced graphene oxide nanoparticles from chenopodium album: Their antimicrobial and anticancer activities. Nanomaterials 2020, 10, 1096. [Google Scholar] [CrossRef]
  29. Wijaya, R.; Andersan, G.; Santoso, S.P.; Irawaty, W. Green Reduction of Graphene Oxide using Kaffir Lime Peel Extract ( Citrus hystrix ) and Its Application as Adsorbent for Methylene Blue. Sci. Rep. 2020, 10, 667. [Google Scholar] [CrossRef] [Green Version]
  30. Qi, J.; Zhang, S.; Xie, C.; Liu, Q.; Yang, S. Fabrication of Erythrina senegalensis leaf extract mediated reduced graphene oxide for cardiac repair applications in the nursing care. Inorg. Nano-Metal. Chem. 2021, 51, 143–149. [Google Scholar] [CrossRef]
  31. Smita, K.M.; Abraham, L.S.; Kumar, V.G.; Vasantharaja, R.; Thirugnanasambandam, R.; Antony, A.; Govindaraju, K.; Velan, T.S. Biosynthesis of reduced graphene oxide using Turbinaria ornata and its cytotoxic effect on MCF-7 cells. IET Nanobiotechnol. 2021, 15, 455–464. [Google Scholar] [CrossRef]
  32. Chufa, B.M.; Abdisa Gonfa, B.; Yohannes Anshebo, T.; Adam Workneh, G. A Novel and Simplest Green Synthesis Method of Reduced Graphene Oxide Using Methanol Extracted Vernonia Amygdalina: Large-Scale Production. Adv. Condens. Matter Phys. 2021, 2021, 1–10. [Google Scholar] [CrossRef]
  33. Lingaraju, K.; Raja Naika, H.; Nagaraju, G.; Nagabhushana, H. Biocompatible synthesis of reduced graphene oxide from Euphorbia heterophylla (L.) and their in-vitro cytotoxicity against human cancer cell lines. Biotechnol. Rep. 2019, 24, e00376. [Google Scholar] [CrossRef]
  34. Shamaila, S.; Khan Leghari Sajjad, A.; Quart-Ul-Ain; Shaheen, S.; Iqbal, A.; Noor, S.; Sughra, G.; Ali, U. A cost effective and eco-friendly green route for fabrication of efficient graphene nanosheets photocatalyst. J. Environ. Chem. Eng. 2017, 5, 5770–5776. [Google Scholar] [CrossRef]
  35. Coros, M.; Pogacean, F.; Turza, A.; Dan, M.; Berghian-Grosan, C.; Pana, I.O.; Pruneanu, S. Green synthesis, characterization and potential application of reduced graphene oxide. Phys. E Low-Dimens. Syst. Nanostruct. 2020, 119, 113971. [Google Scholar] [CrossRef]
  36. Parthipan, P.; Cheng, L.; Rajasekar, A.; Govarthanan, M.; Subramania, A. Biologically reduced graphene oxide as a green and easily available photocatalyst for degradation of organic dyes. Environ. Res. 2021, 196, 110983. [Google Scholar] [CrossRef]
  37. Panicker, N.J.; Sahu, P.P. Green reduction of graphene oxide using phytochemicals extracted from Pomelo Grandis and Tamarindus indica and its supercapacitor applications. J. Mater. Sci. Mater. Electron. 2021, 32, 15265–15278. [Google Scholar] [CrossRef]
  38. Hidayah, N.M.S.; Liu, W.W.; Lai, C.W.; Noriman, N.Z.; Khe, C.S.; Hashim, U.; Lee, H.C. Comparison on graphite, graphene oxide and reduced graphene oxide: Synthesis and characterization. AIP Conf. Proc. 2017, 1892, 150002. [Google Scholar] [CrossRef]
  39. Gan, L.; Li, B.; Chen, Y.; Yu, B.; Chen, Z. Green synthesis of reduced graphene oxide using bagasse and its application in dye removal: A waste-to-resource supply chain. Chemosphere 2019, 219, 148–154. [Google Scholar] [CrossRef]
  40. Kumar, S.; Bhorolua, D.; Ojha, A.K.; Kumar, A. Onion Juice Assisted Green Reduction Of Graphene Oxide With Tunable Structural And Optical Properties: Effect Of Onion Juice Concentration And Reaction Temperature. Adv. Mater. Lett. 2019, 10, 58–66. [Google Scholar] [CrossRef]
  41. Khan, M.; Al-marri, A.H.; Khan, M.; Shaik, M.R.; Mohri, N.; Adil, S.F.; Kuniyil, M.; Alkhathlan, H.Z.; Al-warthan, A.; Tremel, W.; et al. Green Approach for the Effective Reduction of Graphene Oxide Using Salvadora persica L. Root (Miswak) Extract. Nanoscale Res. Lett. 2015, 10, 987. [Google Scholar] [CrossRef] [Green Version]
  42. Li, C.; Zhuang, Z.; Jin, X.; Chen, Z. A facile and green preparation of reduced graphene oxide using Eucalyptus leaf extract. Appl. Surf. Sci. 2017, 422, 469–474. [Google Scholar] [CrossRef]
  43. Tai, M.J.Y.; Liu, W.W.; Khe, C.S.; Hidayah, N.M.S.; Teoh, Y.P.; Voon, C.H.; Lee, H.C.; Adelyn, P.Y.P. Green synthesis of reduced graphene oxide using green tea extract. AIP Conf. Proc. 2018, 2045, 020032. [Google Scholar] [CrossRef]
  44. Deng, S.; Berry, V. Wrinkled, rippled and crumpled graphene: An overview of formation mechanism, electronic properties, and applications. Mater. Today 2016, 19, 197–212. [Google Scholar] [CrossRef]
  45. Alshamsi, H.A.; Jaber, N.A.A.B.; Altaa, S.H.A. Facile Green Synthesis of Reduced Graphene Oxide in L-cysteine Solution and its Structural, Morphological, Optical and Thermal Characteristics. J. Phys. Conf. Ser. 2021, 1999, 012016. [Google Scholar] [CrossRef]
  46. Khane, Y.; Benouis, K.; Albukhaty, S.; Sulaiman, G.M.; Abomughaid, M.M.; Al Ali, A.; Aouf, D.; Fenniche, F.; Khane, S.; Chaibi, W.; et al. Green Synthesis of Silver Nanoparticles Using Aqueous Citrus limon Zest Extract: Characterization and Evaluation of Their Antioxidant and Antimicrobial Properties. Nanomaterials 2022, 12, 2013. [Google Scholar] [CrossRef]
  47. Krishnaraj, C.; Kaliannagounder, V.K.; Rajan, R.; Ramesh, T.; Kim, C.S.; Park, C.H.; Liu, B.; Yun, S. Il Silver nanoparticles decorated reduced graphene oxide: Eco-friendly synthesis, characterization, biological activities and embryo toxicity studies. Environ. Res. 2022, 210, 112864. [Google Scholar] [CrossRef]
  48. Mahendran, G.B.; Ramalingam, S.J.; Rayappan, J.B.B.; Kesavan, S.; Periathambi, T.; Nesakumar, N. Green preparation of reduced graphene oxide by Bougainvillea glabra flower extract and sensing application. J. Mater. Sci. Mater. Electron. 2020, 31, 14345–14356. [Google Scholar] [CrossRef]
  49. Cavion, F.; Fusco, L.; Sosa, S.; Manfrin, C.; Alonso, B.; Zurutuza, A.; Della Loggia, R.; Tubaro, A.; Prato, M.; Pelin, M. Ecotoxicological impact of graphene oxide: Toxic effects on the model organism: Artemia franciscana. Environ. Sci. Nano 2020, 7, 3605–3615. [Google Scholar] [CrossRef]
  50. Carballo, J.L.; Hernández-Inda, Z.L.; Pérez, P.; García-Grávalos, M.D. A comparison between two brine shrimp assays to detect in vitro cytotoxicity in marine natural products. BMC Biotechnol. 2002, 2, 17. [Google Scholar] [CrossRef]
  51. Zhu, S.; Luo, F.; Chen, W.; Zhu, B.; Wang, G. Toxicity evaluation of graphene oxide on cysts and three larval stages of Artemia salin. Sci. Total Environ. 2017, 595, 101–109. [Google Scholar] [CrossRef] [PubMed]
  52. Zhu, S.; Xue, M.Y.; Luo, F.; Chen, W.C.; Zhu, B.; Wang, G.X. Developmental toxicity of Fe3O4 nanoparticles on cysts and three larval stages of Artemia salin. Environ. Pollut. 2017, 230, 683–691. [Google Scholar] [CrossRef] [PubMed]
  53. Albert, E.L.; Aziz, N.A.A.A.; Shaifuddin, M.A.F.; Perumal, D.; Een, L.G.; Abdullah, C.A.C. The effect of various nanoparticles towards Artemia salin cyst. Int. J. Chem. Biochem. Sci. 2021, 20, 35–40. [Google Scholar]
  54. Murugesan, B.; Sonamuthu, J.; Pandiyan, N.; Pandi, B.; Samayanan, S.; Mahalingam, S. Photoluminescent reduced graphene oxide quantum dots from latex of Calotropis gigantea for metal sensing, radical scavenging, cytotoxicity, and bioimaging in Artemia salin: A greener route. J. Photochem. Photobiol. B Biol. 2018, 178, 371–379. [Google Scholar] [CrossRef]
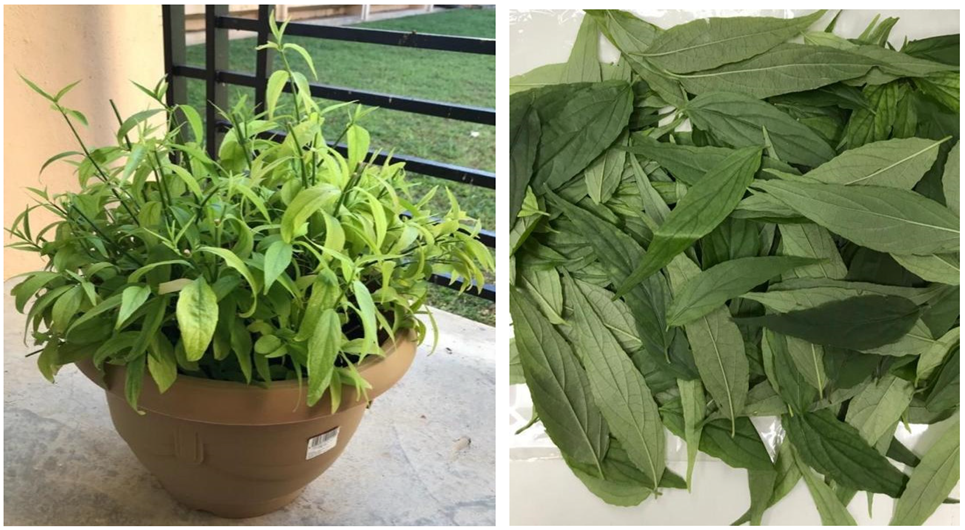
Figure 1. Image of C. nutans plants and leaves.
Crystals 12 01539 g001
Figure 2. Photographs of the (a) GO dispersion, (b) the C. nutans leaf extract, (c) a mixture of GO and the C. nutans leaf extract, and (d) reduction suspension.
Crystals 12 01539 g002
Figure 3. The fabricated powder of (a) GO and (b) rGO.
Crystals 12 01539 g003
Figure 4. UV—Vis optical absorption spectrum of GO reduction at various (a) temperatures, (b) concentration of C. nutans leaf extract, (c) time, and (d) GO and rGO.
Crystals 12 01539 g004
Figure 5. X-ray diffraction patterns of GO reduction at various (a) temperatures, (b) concentration of C. nutans leaf extract, (c) time, and (d) GO and rGO (insert figure is result of graphite).
Crystals 12 01539 g005
Figure 6. FT-IR spectrum of GO and rGO.
Crystals 12 01539 g006
Figure 7. Raman spectrum of (a) Graphite and (b) GO and rGO.
Crystals 12 01539 g007
Figure 8. FESEM images of (a) GO and (b) rGO (magnification x100,000).
Crystals 12 01539 g008
Figure 9. Cyclic voltammograms (CV) of (a) bare—SPCE, (b) GO—SPCE, and (c) rGO—SPCE in 0.1 M of KCl solution with 5 mM K3Fe(CN)6 at a scan rate of 100 mVs−1.
Crystals 12 01539 g009
Figure 10. Percentage of hatched A. salina cysts incubated in different concentrations of (a) GO and (b) rGO.
Crystals 12 01539 g010
Table 1. The optimized rGO synthesis parameter variables.
ParameterVariable
Temperature60, 80 and 100 °C
Leaf extract concentration10, 25, 50% (v/v)
Time1, 2, 4 and 6 h
Table 2. The distance between carbon plane and XRD peak was determined using Bragg’s Law equation.
Sample2Ɵ (°)D—Spacing (nm)
Graphite26.490.34
GO10.090.88
rGO—60 °C18.650.48
rGO—80 °C20.150.44
rGO—100 °C22.020.40
rGO—10%21.090.42
rGO—25%21.280.42
rGO—50%21.820.41
rGO—1 h21.540.41
rGO—2 h21.640.41
rGO—4 h21.410.41
rGO—6 h22.120.40
Table 3. D band, G band and D/G ratio from the Raman spectra of Graphite, GO and rGO.
SampleD—BandG—BandID/IG Ratio
Graphite1359.551582.630.40
GO1349.761576.551.01
rGO1342.191565.571.08
Table 4. Elemental composition of GO and rGO.
AtomElemental Compound Weight Percentage (%)C/O
COSClCaNMgSi
GO66.830.32.00.90.00.00.00.02.2
rGO72.712.40.80.07.73.61.61.15.9
Table 5. GO and rGO composition measured by elemental analysis.
SampleElemental Compound Percentage (%)C/O
NCHSO
GO0.0039.100.002.2638.921.00
rGO3.7246.324.350.3026.901.72
Publisher’s Note: MDPI stays neutral with regard to jurisdictional claims in published maps and institutional affiliations.