Article

Correlation between Mechanical Properties—Structural Characteristics and Cavitation Resistance of Cast Aluminum Alloy Type 5083

by
Dionisie Istrate
1,
Beatrice-Gabriela Sbârcea
2,*,
Alin Mihai Demian
1,
Andreea Daniela Buzatu
1,
Laura Salcianu
3,
Ilare Bordeasu
3,*,
Lavinia Madalina Micu
4,
Cristian Ghera
3,
Bogdan Florea
5 and
Brândușa Ghiban
1,*
1
Metallic Materials Science and Physical Metallurgy Department, University Politehnica of Bucharest, 313 Splaiul Independentei, 060042 Bucharest, Romania
2
Department of Materials and Products Characterization for Electrical and Energy Engineering, National Institute for R&D in Electrical Engineering ICPE-CA, 313 Splaiul Unirii, 030138 Bucharest, Romania
3
Department of Mechanical Machines Equipment and Transportation, University Politehnica of Timisoara, 2 Piata Victoriei, 300006 Timisoara, Romania
4
Department of Agricultural Technologies, University of Agricultural Sciences and Veterinary Medicine of Banat King Mihai I from Romania, 119 Calea Aradului, 300645 Timisoara, Romania
5
Engineering and Management of Obtaining Metallic Materials Department, University Politehnica of Bucharest, 313 Splaiul Independentei, 060042 Bucharest, Romania
*
Authors to whom correspondence should be addressed.
Crystals 2022, 12(11), 1538; https://doi.org/10.3390/cryst12111538
Submission received: 3 October 2022 / Revised: 13 October 2022 / Accepted: 19 October 2022 / Published: 28 October 2022
(This article belongs to the Special Issue Multifunctional Materials and Structures)

Abstract

:
The aluminum alloy type 5083, which has high corrosion resistance, excellent weldability, and good strength, is widely used in shipbuilding, automotive, aerospace, and industrial construction. The present paper has the aim of establishing a possible correlation between mechanical properties, structural characteristics, and cavitation erosion properties of the 5083 alloy after applying different heat treatments. Different homogenization heat treatments (350 °C, 450 °C) were applied, each followed by cooling in air and artificial aging at different temperature (140 °C and 180 °C) with three maintenance periods, 1 h, 12 h, and 24 h. The experiments concerning cavitation resistance of the experimental samples were completed in accordance with ASTM G32-2016. The cavitation erosion resistance were determined either by analytical diagrams MDER (or MDE) vs. cavity attack duration, or by measuring the maximum erosion attack by stereomicroscopy and scanning electron microscopy. Finally, the best combination of heat treatments applied to cast aluminum products type 5083 is homogenization at 350 °C followed by artificial aging at 180 °C, at which the highest mechanical characteristics are obtained, a resilience of 25 J/cm2, a grain size of 140–180 μm, and a maximum depth of the erosion MDEmax around 14–17 µm.

1. Introduction

Aluminum alloys, especially those of the 5083 series, are used in the automotive, aerospace, and transportation industries due to its properties such as low density, high specific strength and excellent corrosion resistance [1,2,3]. The 5083 series aluminum alloy is an alloy that possesses good hardenability and weldability properties [4]. Alloy 5083, with properties of high corrosion resistance, excellent weldability and good strength, is used in shipbuilding, automotive, and aerospace industries [1,2,3,4,5,6]. The principal alloying element in aluminum alloy 5083 is magnesium 5 wt% of which induces strong solution hardening effects. It is used in corrosive environments due to its relatively high strength and good corrosion resistance properties [3].
The hardening mechanism of these type 5083 aluminum alloys is due to the formation of the β-phase (Mg5Al8). The excess Mg atoms that exist in the matrix are supersaturated atoms and the remaining Mg atoms are in the form of β-phase [7,8,9,10,11,12]. An important problem is that following the welding process of 5083 alloy is the grain flow in fusion welding [9]. Liu et al. [10] concluded that considerable softening occurs in alloy 5083 welds due to grain growth. Ma et al. [11] showed in their research that the grain size in the fusion zone increased up to 200 µm, and the base metal grain size was about 50 µm, leading to 15% decrease in tensile strength. Corigliano et al. [12] also showed that 5 mm Al 5083 joints by single-pass GMAW could fail in the thermally affected zone due to stress concentration.
On the other hand, some components, during operation, such as radiators and rotors of vehicle cooling pumps, as well as the propellers of fishing and recreational boats are affected by the abrasive, chemical, and cavitational corrosive action of water. At certain hydrodynamic flow regimes, cavitational corrosion becomes the most dangerous. Operation in such regimes inevitably leads to damage to the structure due to cyclic microjet stresses and shock waves produced by imploding cavitating bubbles. Although the chemical constitution and alloying with other chemical elements enhance the mechanical properties, the lifetime is still limited when operating in high-intensity cavitating flows.
Aluminum alloy type 5083 is mainly used for pressure vessels, products that are used in special temperature conditions, and areas with increased aggressiveness, generally, pieces that require special properties for alloy 5083. The present work aims to define the best combination of heat treatments and erosion–cavitation resistance in these heat-treated states, in order to obtain the best combination of properties obtained from heat treatments of cast products.

2. Materials and Experimental Procedure

Aluminum alloy sample types 5083 were taken in a cast state, without heat treatment, having the chemical composition indicated in Table 1.
The following heat treatments were performed on the experimental specimens with dimensions 10 × 10 × 50 (mm): homogenization at 350 °C/with maintenance 100 min followed by air cooling and artificial aging at 180 °C, with three maintenance periods, 1 h, 12 h, and 24 h; homogenization at 450 °C/with maintenance 100 min followed by cooling in air and artificial aging at 140 °C, with three maintenance periods, 1 h, 12 h, and 24 h; homogenization at 450 °C/with maintenance 100 min followed by air cooling and artificial aging at 180 °C, with three maintenance periods, 1 h, 12 h, and 24 h.
The heat treatments were performed in a Nabertherm type furnace, from of the laboratory of Metallic Materials Science, Physical Metallurgy within the University Politehnica of Bucharest. For each type of heat treatment, six tests were performed to determine the mechanical properties: tensile strength, yield strength, elongation, resilience, hardness, and microhardness. The grain size was determined according to ASTM E3, ASTM E 407, and ASTM E 112, using Barker electrolytic reagent, measuring 100. Structural investigations were performed on an OLYMPUS microscope from the Metallic Materials Science and Physical Metallurgy Laboratory from University Politehnica of Bucharest.
The analysis of the samples by X-ray diffraction was performed with the help of the D8 Advance diffractometer, Bruker-Germany, Cu anode tube (λ = 1.540598 Å), and scintillation detector. The diffractograms were recorded with an angular increment of 0.040, at a scanning speed of 0.5 s/step, angular range measuring 2θ = 20–100°.
The experiments concerning cavitational resistance of the experimental samples were made in Cavitation Erosion Research Laboratory of the Polytechnic University of Timișoara, on the vibrating device with standard piezoceramic crystals, using cylindrical vibrating samples, with a diameter of 15.8 mm and 16 mm long [7]. The research conditions on the total duration (165 min), the intermediate periods (one of 5 and 10 min each and 10 of 15 min) on the liquid medium, and the processing and interpretation of the recorded data are in accordance with the laboratory custom [5,7,13,14,15,16,17,18,19,20] and those prescribed in the international standard ASTM G32-2016 [21].
Throughout the research, the functional parameters of the vibrating device, on which depends the intensity of the hydrodynamics of the vibrating cavity, respectively, that of erosion, due to the automated control by a special software, were maintained at standard values [7,21]: double vibration amplitude 50 µm, vibration frequency 20 ± 0.2 kHz, electronic ultrasonic generator power 500 W, distilled water temperature 22 ± 1 °C.
From each type of state (delivered/semi-finished and obtained by heat treatments) five samples were tested, whose experimental values were algebraically mediated in order to build specific cavitation diagrams, which are the basis for analyzing the behavior and strength of exposed surface structures cavity attack.

3. Experimental Results, Interpretations, and Discussions

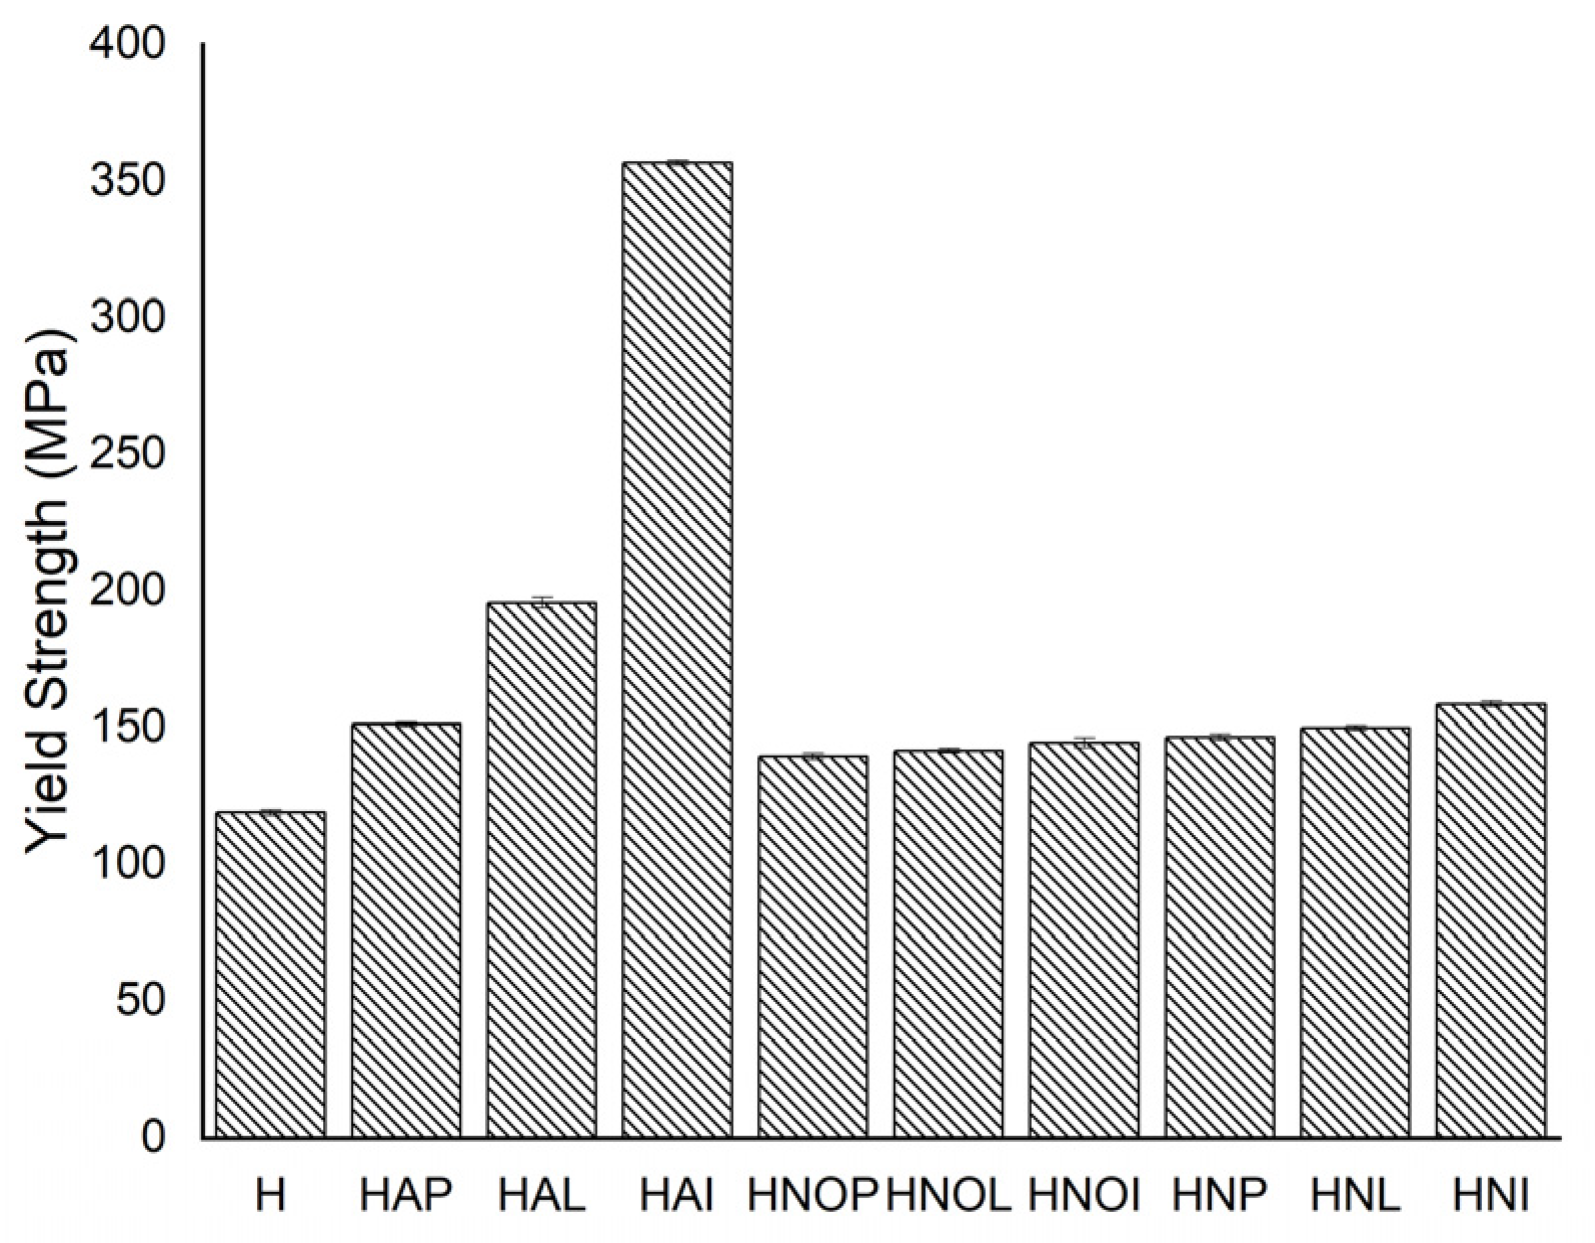
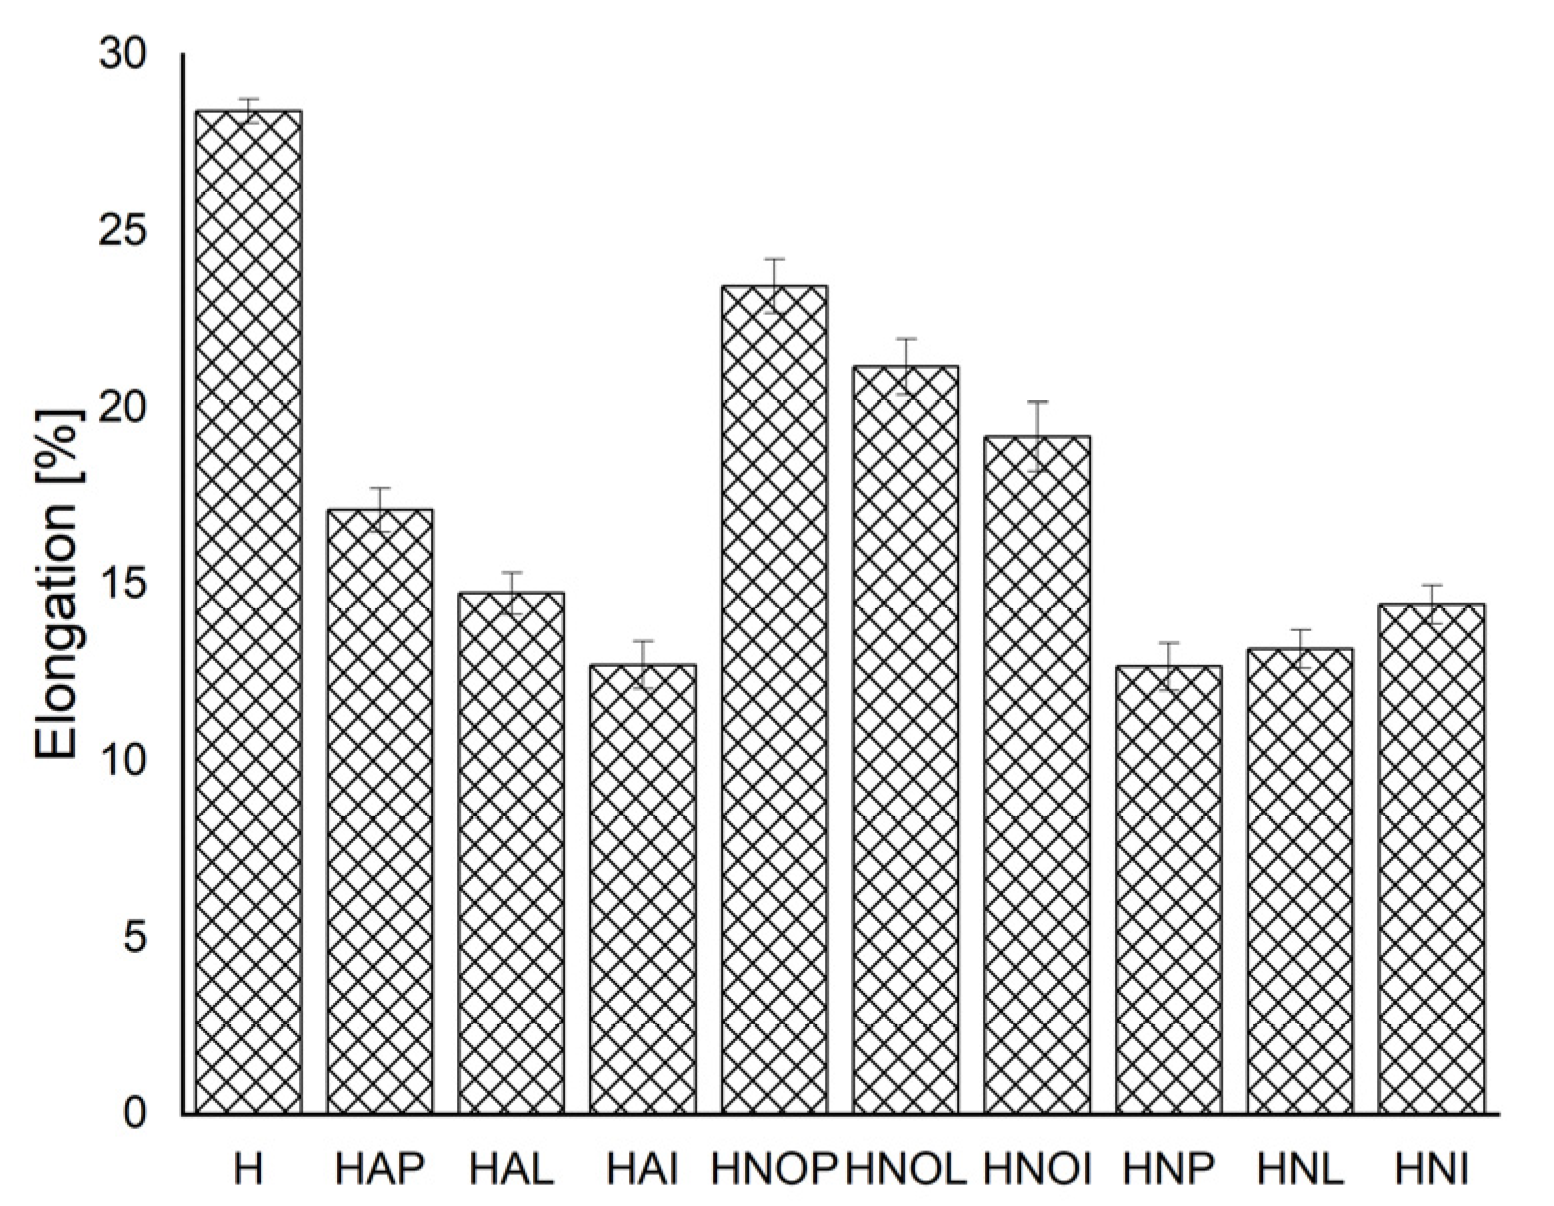
3.1. Results concerning the Mechanical Behavior of the Experimental Samples

The experimental results regarding the determination of the mechanical characteristics are presented in Table 2. The analysis of the evolution of the values of the mechanical characteristics comparatively for each specimen is presented successively in Figure 1, Figure 2, Figure 3, Figure 4 and Figure 5. From the graph of Figure 1, it can be noticed that the values of tensile strength increase significantly by applying heat treatment. After homogenization and aging at 180 °C, different durations of maintenance, the highest values are obtained, respectively, 318 MPa for maintenance at 1 h (44% higher than the value of the control sample), followed by 346.20 MPa, at 12 h maintenance, (increase by 57%) and the highest value after 24 h, respectively, 436 MPa (increase by approximately 100%).
The evolution of yield strength is given in Figure 2. As one may remark, the increasing this property is only after 350 °C + 180 °C, at any other heat treatment this increase is with no importance. Elongation property decreases by applying different heat treatments, as is given in Figure 3. Considering only elongation, the recommended heat treatment is at 450 °C + 140 °C/1, 12, 24 h. In Figure 4 one may remark that the hardness values may increase with the time of maintaining at the same aging temperature, the highest values being for 450 °C + 140 °C/ 24 h. As is given in Figure 5, one may remark a slight modification regarding hardness values after applying different heat treatments. Generally, the hardness values are between 72 and 82 daN. The most important property for cast products made of 5083 aluminum alloy is resilience, whose evolution is given in Figure 5. As one may remark, considering as admitted value is 25 J/cm2, only homogenization at 350 °C + 180 °C is proper to maintain high values of resilience. At any other heat treatment, the increasing of the time of maintenance leads to drastically diminishing the resilience, reaching very low values, 18–22 J/cm2.

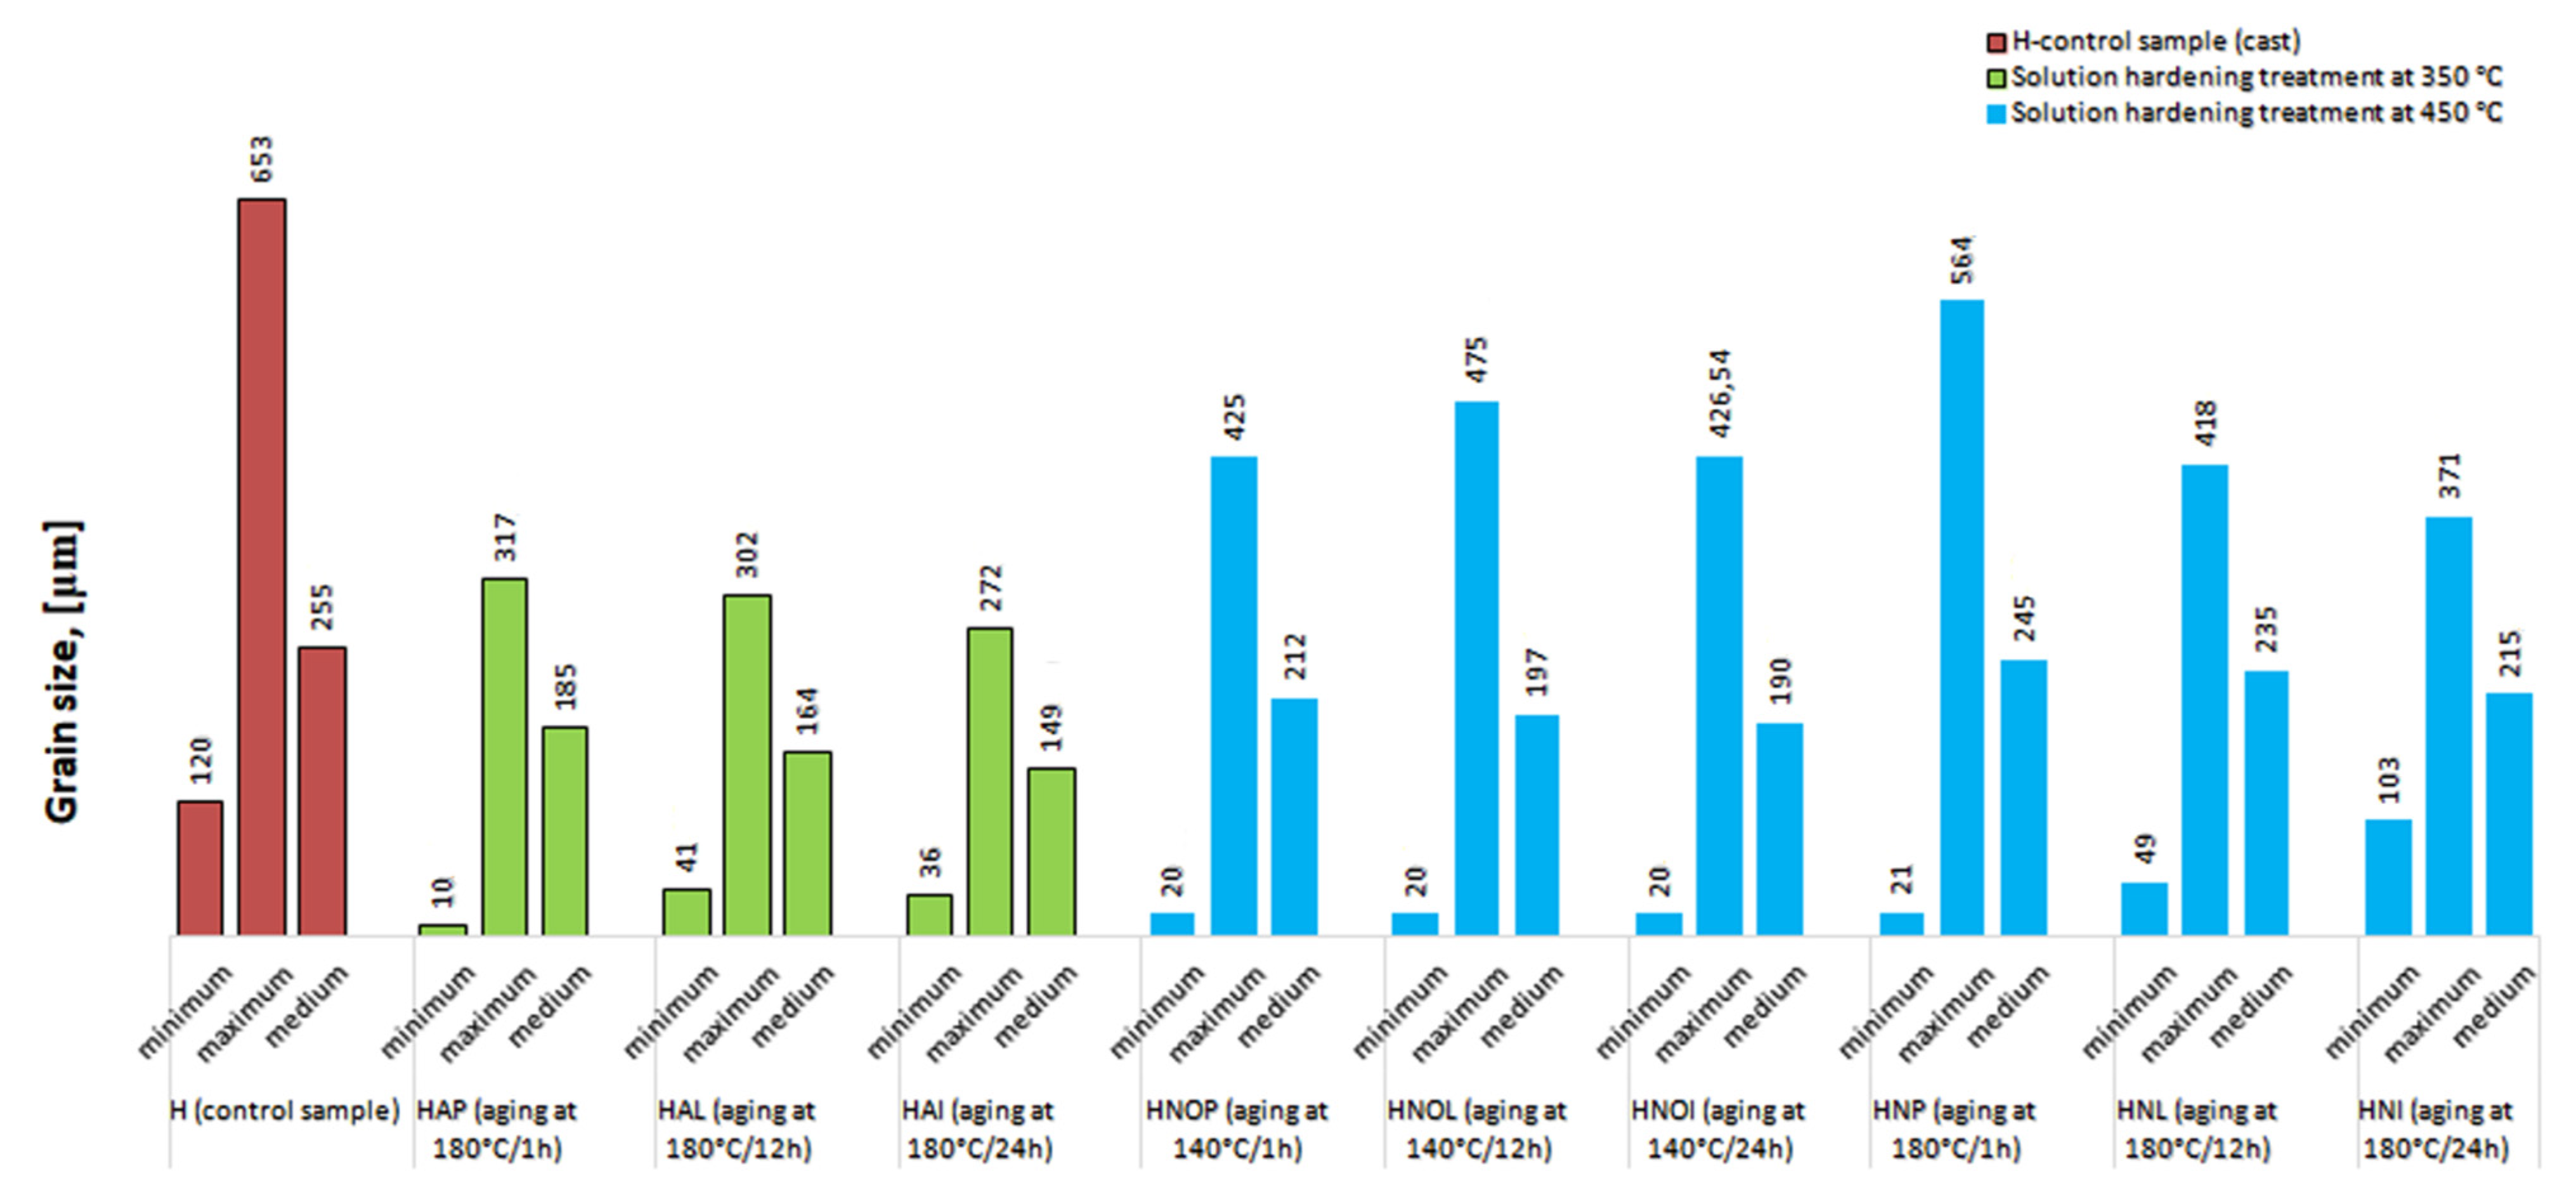
3.2. Results concerning Structural Characterization of the Experimental Samples

Results concerning the structural analysis of the experimental samples concerning metallographic aspects after applications of different heat treatments of the cast aluminum 5083 samples are given in Figure 6. One may remark that at the gauge sample there is a dendritic aspect of the sample (Figure 6a), with small amounts of particles, precipitated in a dendritic manner. By applying quenching and aging, it takes place the homogenization of the matrix, the particles being still in dendritic separation (Figure 6b–j). Additionally, one may remark that in gauge samples there are the biggest gains, in a nonhomogeneous solution, and after applying quenching at 450 °C there are obtained structures with smaller grain sizes than after quenching at −350 °C.
The experimental results regarding the determination of the grain size after statistical analysis of the experimental specimens are shown in Table 3. It is noted that in the control sample the average grain size is at the highest level, around 255 μm. By applying heat treatments, the diminishing of the granulation takes place. At quenching and aging at 350 °C + 180 °C the average grain size is in general higher than at 450 °C + 180 °C or 450 °C + 140 °C. The graph of the grain size varies depending on the heat treatment applied to the experimental samples as shown in Figure 7.

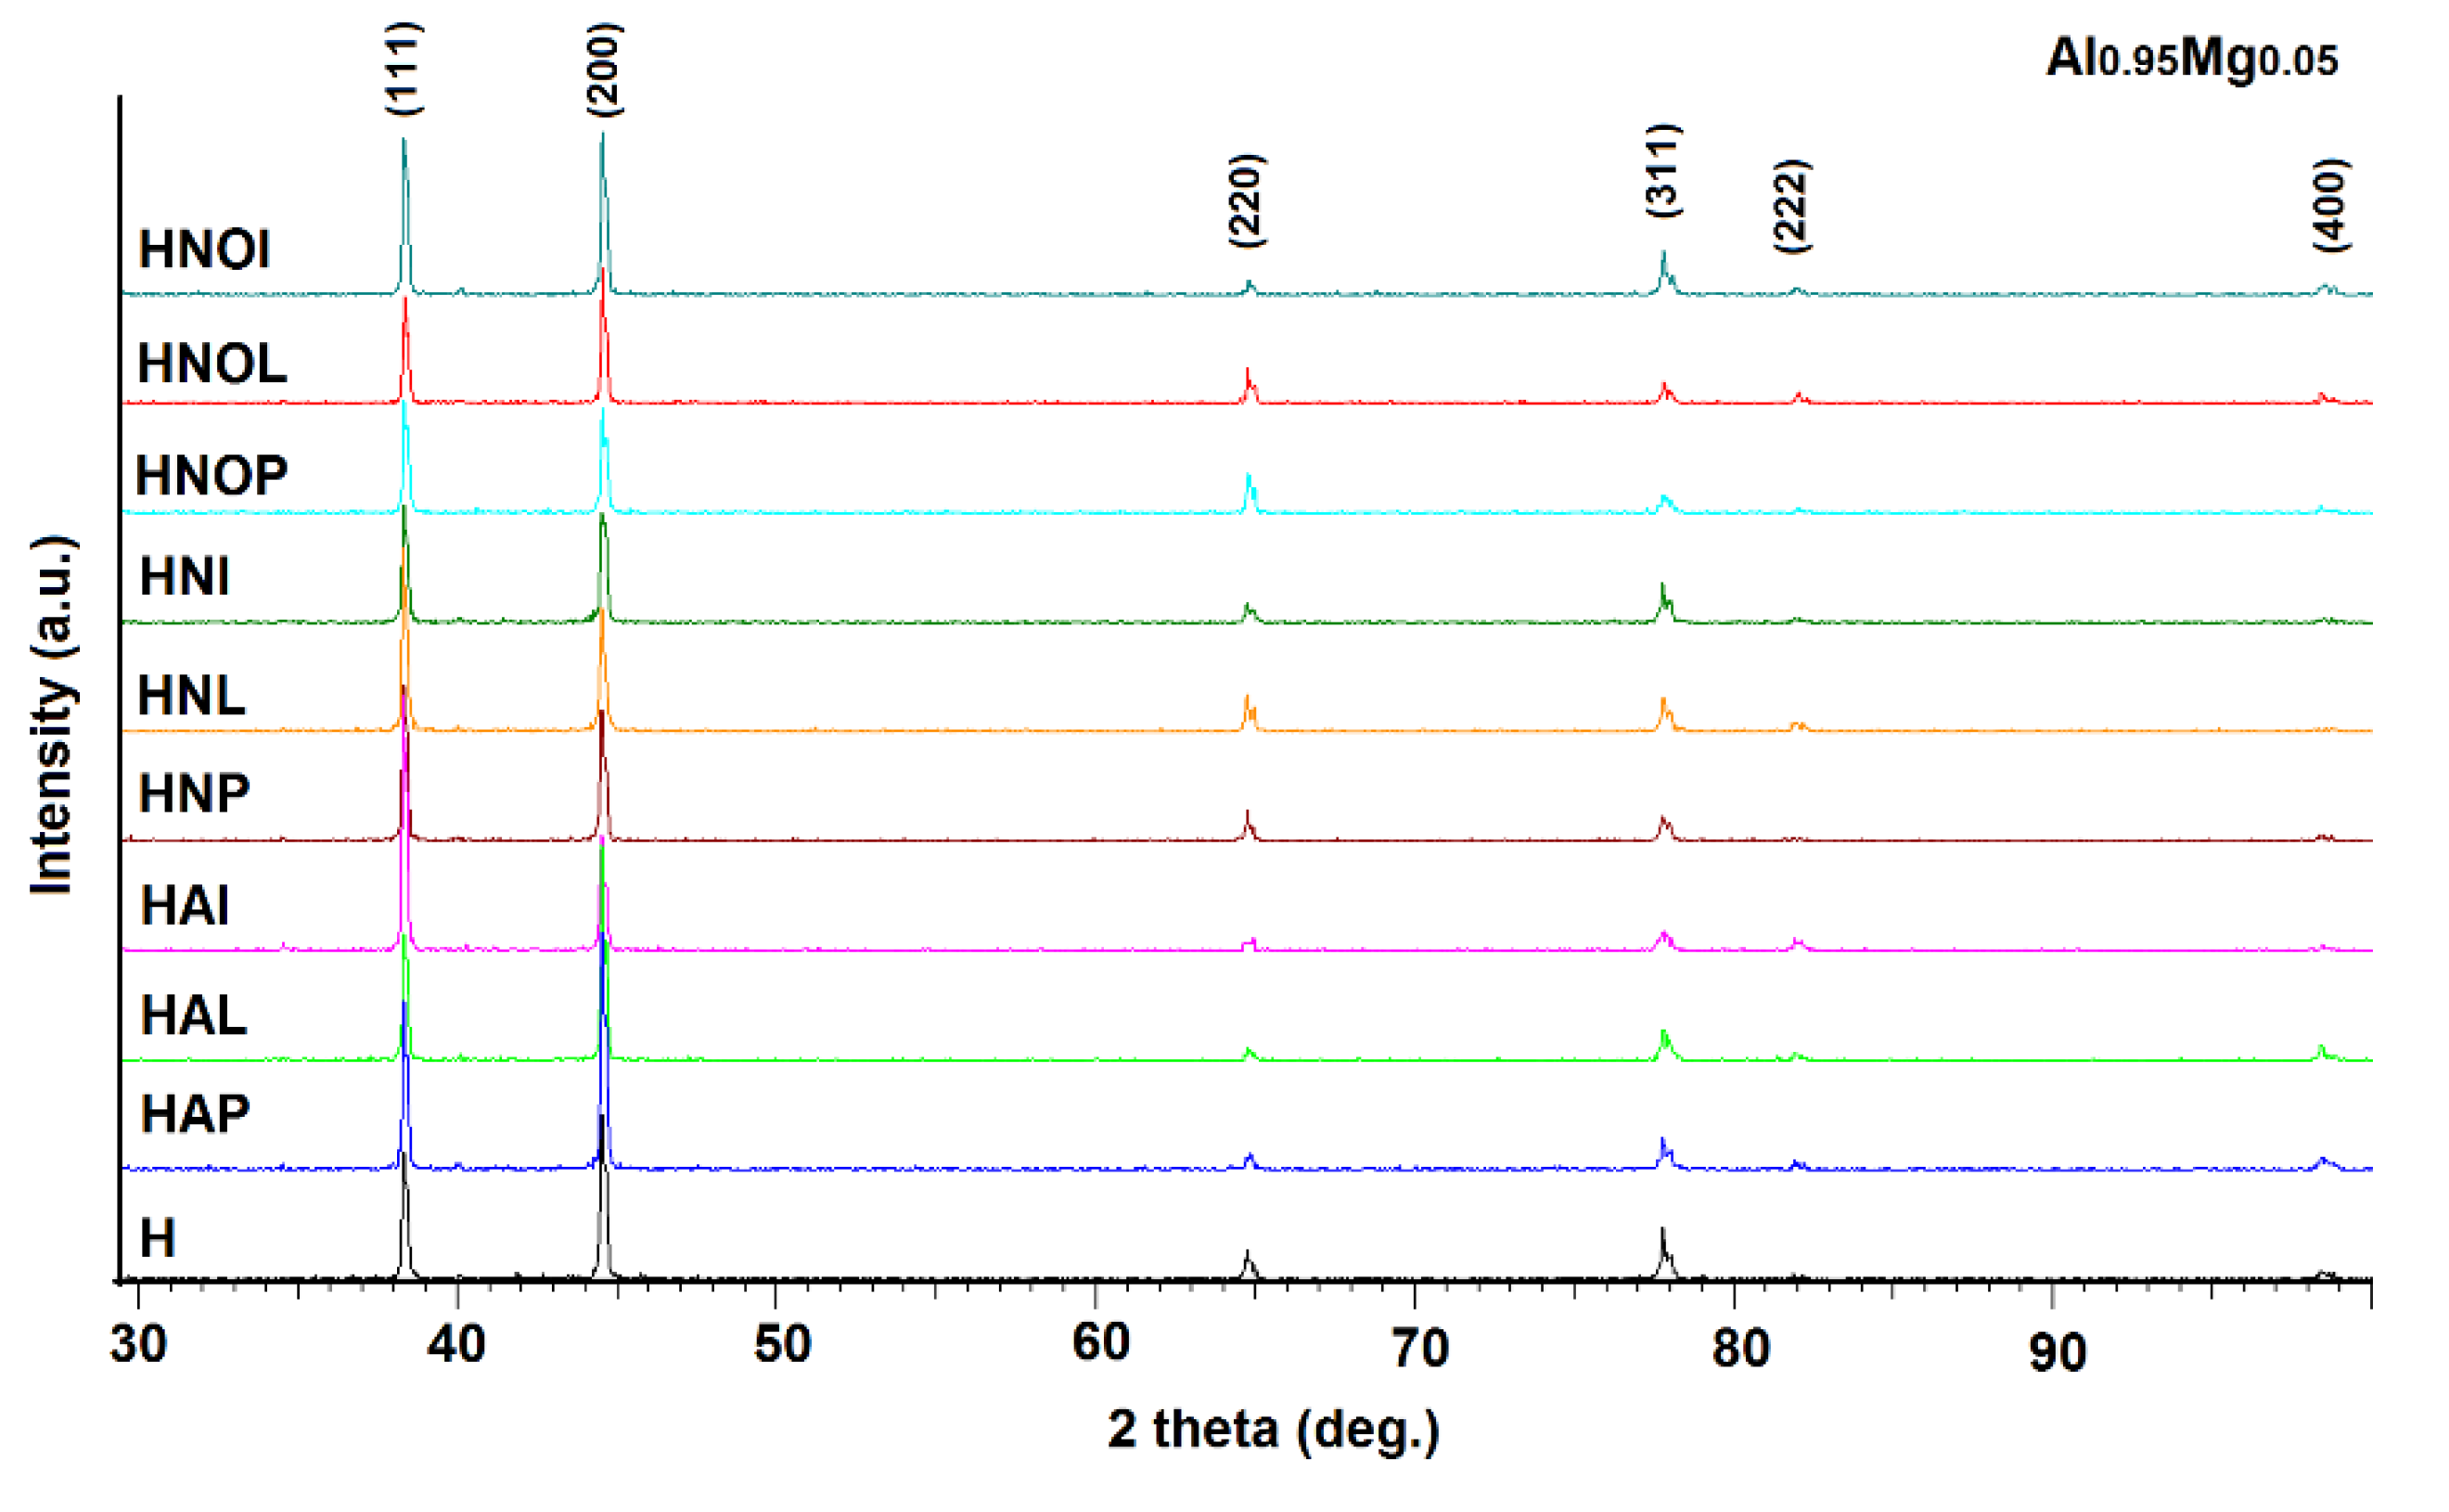
3.3. X-rays Diffraction Analysis

Qualitative X-ray diffraction phase analysis revealed the polycrystalline nature of the analyzed samples. The appearance of the diffractograms for the specimens subjected to the various heat treatments is shown in Figure 8. The crystallographic phases were identified according to the ICDD Release 2015 database, PDF 01-074-5237. The parameters of the elementary cell, respectively, and the size of the crystallite were calculated using the Rietveld method and correspond to Al0.95Mg0.05, represented in Table 4. The proportion of Mg5Al8 secondary phases is very small, better identification of which can be achieved by analysis with a scanning electron microscope. A careful analysis of the values of the elements of the elementary cell revealed the fact that applying heat treatments to hardening and aging can lead to the modification of this parameter. The combination 450 °C + 140 °C leaves the element cell parameter unchanged, respectively, 4.073 [Å], compared to the control sample. In contrast to the other heat treatments there is an increase in the network parameter, either in the range 4.072–4.075 [Å] when applying the heat treatments 350 °C + 180 °C, or an increase in the network parameter in the range 4.074–4.076 [Å] when applying heat treatments at 450 °C + 180 °C.

3.4. Determination of the Behavior of Experimental Specimens in Cavitational Corrosion

The results regarding the behavior of cavitational erosion are expressed either in the form of graphs such as average erosion depth (MDE)/average penetration rate of cavitation erosion depending on the duration of the corrosive attack (Figure 9), indicated in international standards ASTM G 32-2016 [21] or by analysis under an optical/stereomicroscopic (Figure 10, Figure 11, Figure 12 and Figure 13) or the scanning electron microscope, Figure 14.
The diagrams containing the experimental values of the erosion test, with a total duration of 165 min, and the mediation curves MDE (t) and MDER (t) built with the statistically established relationships within the Cavity Erosion Research Laboratory [22] are presented in Figure 9. The areas marked by dark red curves include the experimental values that express the yield of surface material to the impact with the cavitation microjet which, in a significant duration of the cavitation (depending on the duration of maintenance to the artificial aging treatment) degrades by expanding the caverns in area and depth. At the same time, it is noted that after about 120 min of cavitation, until the end of the experiment (165 min), the mass loss, respectively, average depth of erosion, and their erosion rates have non-significant evolution. From the experiences of the laboratory [16,17,19,20,23] and other authors [7,24,25], we consider that this behavior, towards the end of the experiment, is caused by the air entering the caverns during the surface vibration, which dampens the impact pressure/shock between the surface exposed with the shock wave and the micro-jets produced by the implosion of the cavitation bubbles.
A careful analysis of these graphs, the comparative results of which are illustrated in Table 5, shows that the 5083 alloy specimens have similar behavior, with the same erosion mechanisms, specific to the class of aluminum alloys, much different from the erosion mechanisms found in other classes of metallic materials hardened by solid-state transformations [18,26]. The following aspects can be highlighted:
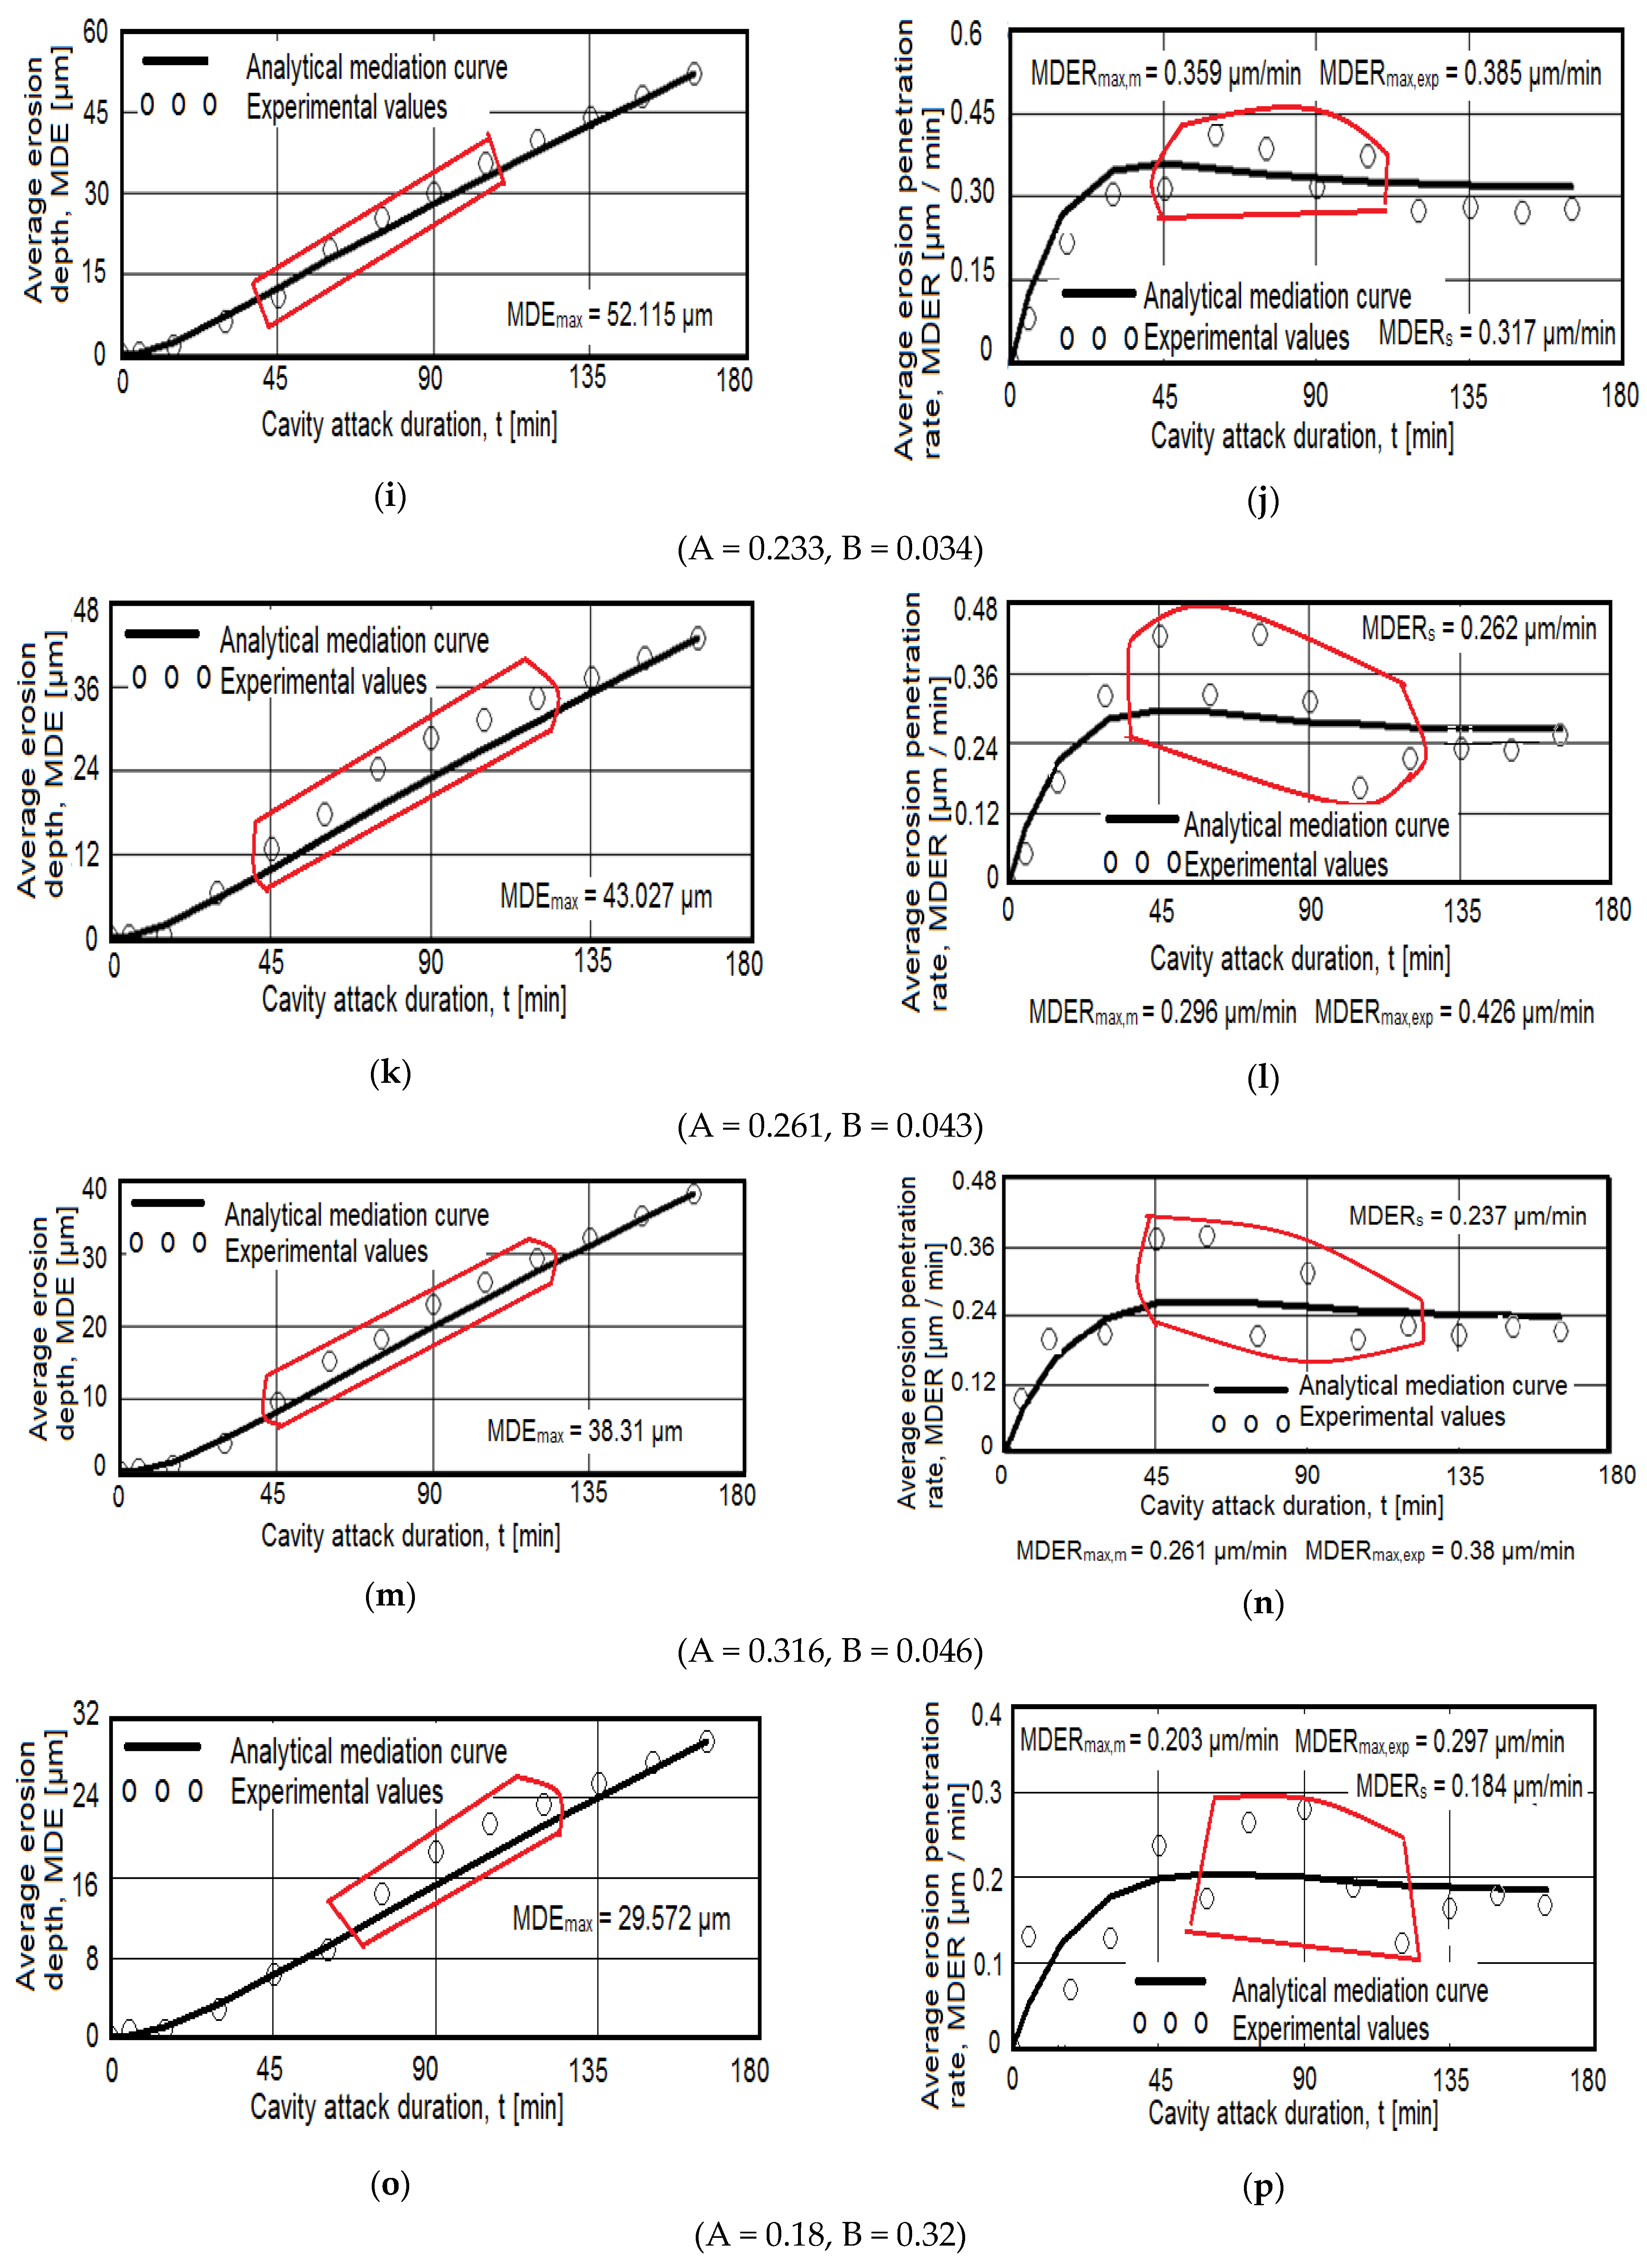
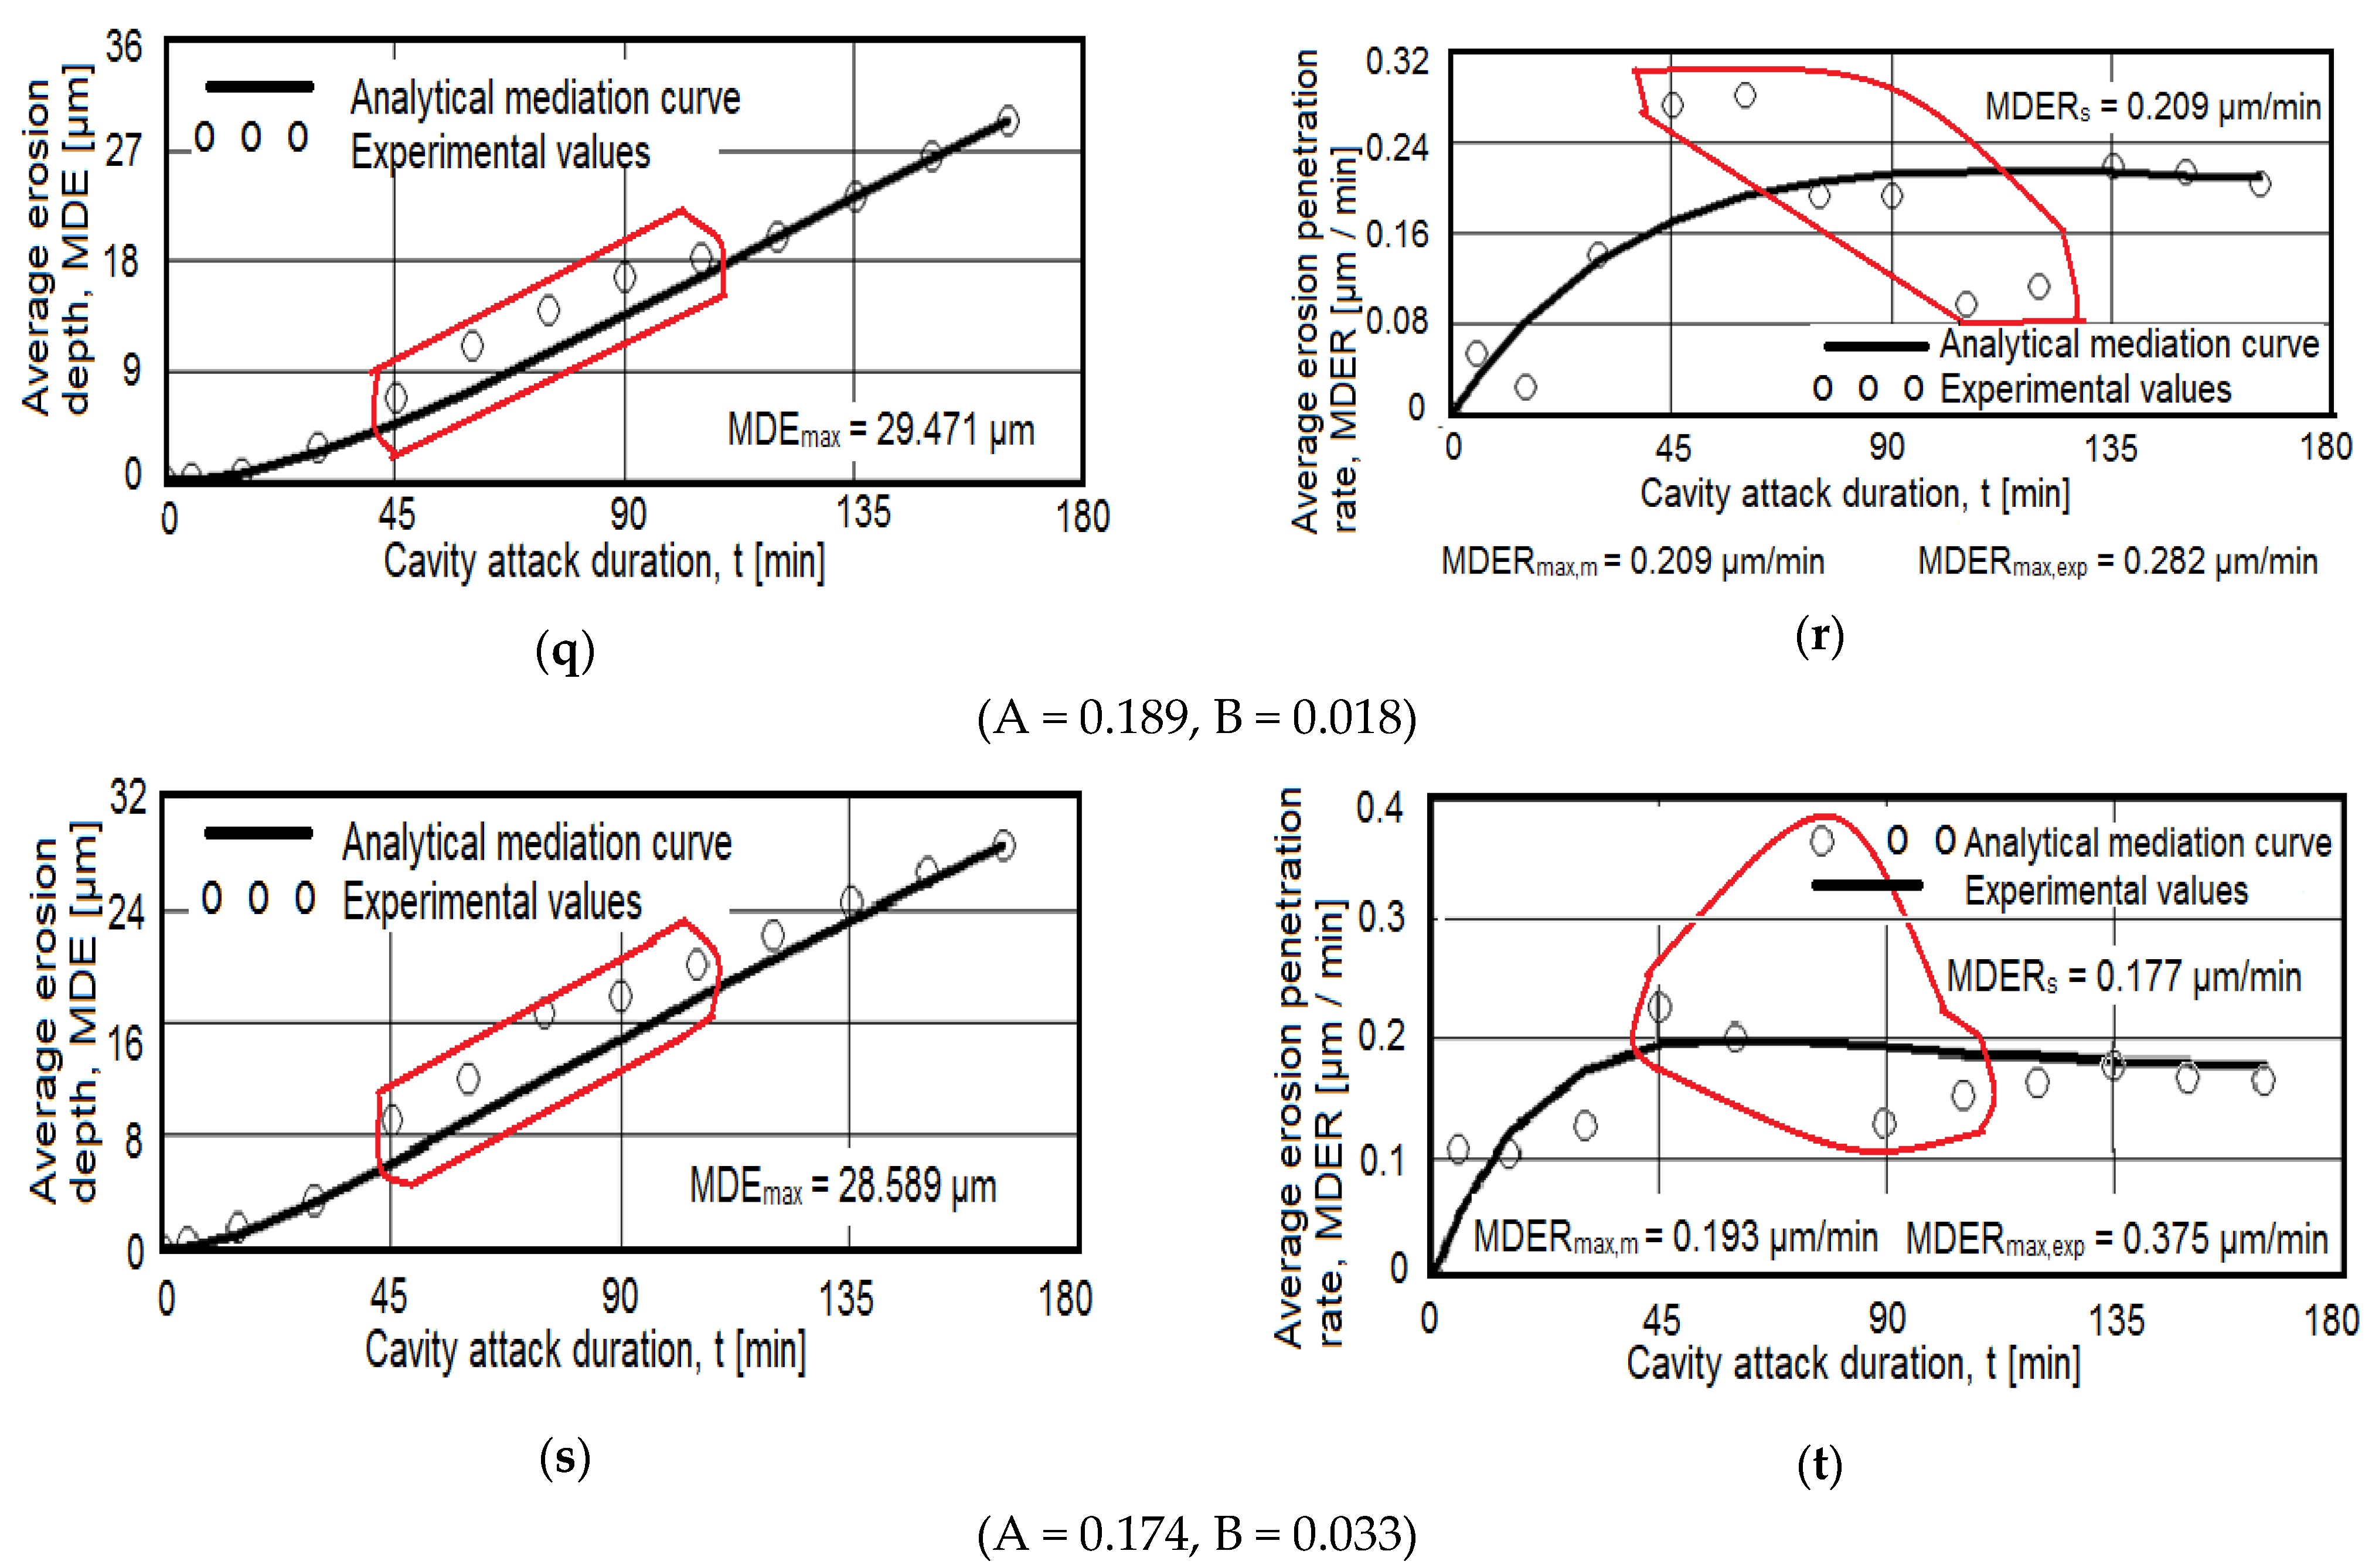
  • The most significant losses, with the development of pinches and caverns in the area of the exposed surface, are registered in the interval 45–120 min (large differences between the experimental, successive values of the measured parameters MDE and MDER, as well as large deviations from the MDE mediation curves (t), respectively, MDER (t)) for all experimental specimens;
  • In the first 30 min there is an erosive mechanism by which the roughness tips, and abrasive dust are removed and elasto-plastic deformations and crack networks occur [16,20,23];
  • The shape of the approximation/mediation curve of the experimental values has different values between maximum value (MDERmax), and that value which tends to stabilization of the process (final value MDERs) (as can be seen from Table 6, registering differences of about 0–12%). This difference, manifested in all situations, is specific to surfaces with average mechanical properties in a value (with values of hardness of about 80 HB and resilience of about 25 J), which gives this condition a behavior specific to materials with a low resistance to cavitation [20,21,23,27,28,29];
  • There are insignificant differences in all heat treatment situations between the experimental values of the erosion rates after 120 min and until the end of the test, which leads to an approximately linear increase in the MDE curve (t) over this time interval and slightly asymptotic stabilization of the MDER curve (t), differences of the structural plastic characteristics which may decrease the resistance to cyclic stresses of cavitation micrometers;
  • There is a big difference (which, as indicated in Table 6, is in the range of 8–94%) between the maximum value obtained by the experiment (MDER max.exp) and that defined by the mediation curve (MDER max,m), even if it is recorded at the same duration of the cavitation (90 min). The smallest difference is recorded in the heat-treated sample at 450 °C/100 min/air + 140 °C/12 h/air of about 8%, and the largest difference is recorded in the heat-treated sample at 450 °C/100 min/air + 180 °C/12 h/air of about 94%. In the other heat treatment states, this difference is in the range of 40–65%. This aspect is further proof of the complexity of the mechanism by which the structure responds to the cavitation load and by which the effect of the duration of maintenance at the temperature of the heat treatment on the structure and mechanical properties, as value and mode of distribution in the sample volume.
The morphological analysis of the eroded structure is given comparatively after the metallographic analysis in Figure 10 (for the control sample) and Figure 11, Figure 12 and Figure 13 (for the heat-treated samples). The cavitational erosion of the surface starts as early as 15–30 min, but substantial, large losses, with the creation of deep caverns in the form of crevices, take place in the interval of 60–120 min. From the 135th minute, the caverns deepen, and the losses are close, causing approximately constant erosion rates. The causes are the ones mentioned (the amount of air entering and the degree of hardening of the layer impacted by the cavitation microgrids). The macrostructural aspects highlighted under the stereomicroscope show the extension of the cavitational attack in the frontal section. The control sample (Figure 10) has the largest surface affected by the cavitational attack, while the heat-treated specimens at 350 °C/100 min/air + 180 °C show the smallest areas affected by the cavitational attack. The detailed cross-sectional analysis of the surfaces required for cavitation (the images on the right of Figure 10, Figure 11, Figure 12 and Figure 13) allowed both the visualization of the profile and the determination of the maximum penetration depth of the cavitation attack. There is a huge difference between the value of the maximum measured depth of the cavern caught in the section plane (in the range 125–451 µm, Figure 10, Figure 11, Figure 12 and Figure 13) and the maximum cumulative average calculated after 165 min (in the range 14–60 µm, Figure 9), a difference of about 6–11 times. It is reconfirmed that for the evaluation of the behavior and strength of a structure at the request of the cavity it is recommended to use the average value on the surface MDEmax and not the maximum of a cave, in an arbitrary area. However, the very high value of the pit trapped in the section plan raises a big question mark as to the degree of fineness and the constitution of the structure of an aluminum alloy with or without preliminary heat treatment. This behavior can give clues about the mechanism of the cavitational phenomenon between different structural classes of metallic materials. Where the surface hardening mechanism takes place in volume, following a transformation into a solid state with martensite formation, then the differences are minimal [20,30]. Where the surface hardening mechanism occurs only by hardening the solid solution (such as aluminum alloys), then the differences are particularly high due to the formation of deep local caverns around the hardening particles in a mass of solid solution unaffected by the cavitational attack.
The analysis of cavitation eroded surfaces under a scanning electron microscope completes the information on the morphology of the surfaces, as well as on the mechanism of propagation of cavitational cracks in this class of metallic materials. Thus, as noted in Figure 14a,b, in the case of a sample not subjected to heat treatment, in a cast state, on a macroscopic scale the surface appears eroded almost uniformly with numerous cavities spread over large areas with polygonal shapes (Figure 14a). On microscopic analysis (Figure 14b) the surface of the bottom of the cavity is cleavage-like, brittle, faceted, and delimited by numerous secondary cracks.
In the heat-treated samples, the appearance of the cavitationally eroded surfaces is approximately similar, especially in the frequency of the cavities, as well as the microscopic appearance. Thus, for example on a heat-treated surface at 450 °C/100 min/air + 180 °C/12 h/air (Figure 14c) on a macroscopic scale, the surface has a high frequency of cavities, with rounded edges, of relatively small dimensions (0.1–0.5 mm). On microscopic analysis (Figure 14d) the surface has a fragile appearance, with cleavage, faceted, with numerous intergranular secondary cracks. SEM analysis confirms the brittle behavior of the 5083 aluminum alloy after cavitation erosion, the cavities produced being generated by the secondary particles of the alloy, around which the structural integrity is destroyed. There is no volumetric hardening of the material by the formation of a hard phase with high mechanical properties (such as martensite), but only a hardening of the solid solution by precipitation of secondary phases (as in the case of aluminum alloy 5083 (with hardening phase Mg5Al8), in as a result of the jet’s interaction with the surface, the particles dislocate, leaving an eroded surface with numerous intergranular secondary cracks.
The comparative analysis of the mechanical behavior and the cavitation erosion behavior of the aluminum alloy samples type 5083, as is given in Table 6, allows the formulation of the following interesting observations:
  • By applying heat treatments to 5073 alloy castings, either hardening of the solution at 350 °C/100 min + artificial aging at 180 °C (1 h, 12 h, 24 h), or hardening of the solution at 450 °C/100 min + artificial aging at 140 °C (1 h, 12 h, 24 h) or solution hardening 450 °C/100 min + artificial aging at 180 °C (1 h, 12 h, 24 h) can increase the resistance to cavitational corrosion, in the sense of decreasing the depths of penetration to erosion;
  • Within the same combination of heat treatments, increasing the duration of maintenance to artificial aging causes a decrease in the maximum depths of penetration of the cavities. Thus, after hardening of the solution at 350 °C/100 min + 180 °C (Figure 9c–h) the maximum penetration depth of the MDEmax cavity decreases from 17.928 μm (at maintenance 1 h), at 15.128 μm (at maintenance 12 h), reaching 14.572 μm (at maintenance 24 h). After hardening the solution at 450 °C/100 min + 140 °C (Figure 9i–n) the maximum penetration depth of the MDEmax cavity decreases from 52.115 μm (at maintenance 1 h), at 43.017 μm (12 h maintenance), reaching 38.31 μm (24 h maintenance). After hardening the solution at 450 °C/100 min + 180 °C (Figure 9o–t) the maximum penetration depth of the MDEmax cavity decreases from 29.572 μm (at maintenance 1 h), at 29.471 μm (12 h maintenance), reaching 28.589 μm (24 h maintenance);
  • After applying a solution hardening at 350 °C/100 min + artificial aging at 180 °C, the lowest penetration depths of the cavity are obtained both compared to the control sample, with 60 μm, and compared to the samples subjected to hardening solution at 450 °C/100 min + artificial aging (either at 140 °C where the maximum depth of penetration is 38–52 μm, or at 180 °C, where the maximum penetration depth is about 29 μm);
  • The correlation between the highest mechanical characteristics obtained after applying a solution hardening at 350 °C/100 min + artificial aging at 180 °C (1 h, 12 h, 24 h) and the behavior at cavitational erosion, which is the more favorable to these heat treatments applied to 5083 aluminum alloy castings.

4. Conclusions

The following conclusions can be drawn from the experiments carried out in this paper:
  • By applying homogenization heat treatments, the mechanical and structural characteristics of 5083 alloy cast products can be modified. So, the values of breaking strength and yield strength change similarly. The elongation values are intermediate for homogenization at 350 °C, compared to homogenization at 450 °C, regardless of the duration of aging. Hardness values decrease slightly after applying homogenization at 350 °C + 180 °C (only 1–4%), compared to homogenization at 450 °C + 140 °C, where the hardness decreases reach up to 10% compared to gauge sample.
  • The lowest values of the average grain size are recorded at homogenizations at 350 °C + 180 °C, average sizes for homogenization at 450 °C + 140 °C and the highest grain sizes for 450 °C + 180 °C.
  • By applying heat treatments to 5073 alloy castings, we can increase the resistance to cavitational corrosion, in the sense of decreasing the depths of penetration and erosion penetration rate. Within the same combination of heat treatments, increasing the duration of maintenance to artificial aging causes a decrease in the maximum depths of penetration of the cavities. Thus, after hardening of the solution at 350 °C/100 min + 180 °C the maximum penetration depth of the MDEmax cavity decreases from 17.928 μm (for 1 h), at 15.128 μm (for 12 h), reaching 14.572 μm (for 24 h). After hardening the solution at 450 °C/100 min + 140 °C the maximum penetration depth of the MDEmax cavity decreases from 52.115 μm (for 1 h), at 43.017 μm (for 12 h), reaching 38.31 μm (for 24 h). After hardening the solution at 450 °C/100 min + 180 °C the maximum penetration depth of the MDEmax cavity decreases from 29.572 μm (for 1 h), at 29.471 μm (for 12 h), reaching 28.589 μm (for 24 h).
  • After applying a solution hardening at 350 °C/100 min + artificial aging at 180 °C, the lowest penetration depths of the cavity are obtained both compared to the control sample, with 60 μm, and compared to the samples subjected to hardening solution at 450 °C/100 min + artificial aging (either at 140 °C where the maximum depth of penetration is 38–52 μm, or at 180 °C, where the maximum penetration depth is about 29 μm).
  • The best combination of heat treatments applied to cast aluminum products type 5083 is homogenization at 350 °C followed by artificial aging at 180 °C, at which the highest mechanical characteristics are obtained, a resilience of 25 J/cm2, a grain size of 140–180 μm, and a maximum depth of the erosion MDEm around 14–17 μm.

Author Contributions

D.I.: conceptualization, methodology. B.-G.S.: X-rays diffraction analyses. A.M.D.: editing, data curation. A.D.B.: editing, data curation. L.S.: investigations. I.B.: methodology of cavitation, writing—original draft preparation. L.M.M.: cavitation experiments. C.G.: software, data curation. B.F.: methodology. B.G.: conceptualization, writing—original draft preparation, writing—reviewing and editing. All authors have read and agreed to the published version of the manuscript.

Funding

This research received no external funding.

Institutional Review Board Statement

Not applicable.

Informed Consent Statement

Not applicable.

Data Availability Statement

Not applicable.

Acknowledgments

This work has been funded by the European Social Fund from the Sectoral Operational Programme Human Capital 2014–2020, through the Financial Agreement with the title “Training of PhD students and postdoctoral researchers in order to acquire applied research skills—SMART”, Contract no. 13530/16.06.2022—SMIS code: 153734.

Conflicts of Interest

The authors declare no conflict of interest.

References

  1. Huang, K.; Lui, T.; Chen, L. Effect of microstructural feature on the tensile properties and vibration fracture resistance of friction stirred 5083 Alloy. J. Alloys Compd. 2011, 509, 7466–7472. [Google Scholar] [CrossRef]
  2. Bauri, R.; Yadav, D.; Kumar, C.N.S.; Balaji, B. Tungsten particle reinforced Al 5083 composite with high strength and ductility. Mater. Sci. Eng. A 2015, 620, 67–75. [Google Scholar] [CrossRef]
  3. Newbery, A.P.; Nutt, S.R.; Lavernia, E.J. Multi-scale Al 5083 for military vehicles with improved performance. Jom-Us 2006, 58, 56–61. [Google Scholar] [CrossRef]
  4. Ke, W.; Bu, X.; Oliveira, J.; Xu, W.; Wang, Z.; Zeng, Z. Modeling and numerical study of keyhole-induced porosity formation in laser beam oscillating welding of 5A06 aluminum alloy. Opt. Laser Technol 2021, 133, 106540. [Google Scholar] [CrossRef]
  5. Pereira, D.; Oliveira, J.; Santos, T.; Miranda, R.; Lourenço, F.; Gumpinger, J.; Bellarosa, R. Aluminium to Carbon Fibre Reinforced Polymer tubes joints produced by magnetic pulse welding. Compos. Struct. 2019, 230, 111512. [Google Scholar] [CrossRef]
  6. Torzewski, J.; Grzelak, K.; Wachowski, M.; Kosturek, R. Microstructure and Low Cycle Fatigue Properties of AA5083 H111 Friction Stir Welded Joint. Materials 2020, 13, 2381. [Google Scholar] [CrossRef] [PubMed]
  7. Tian, N.; Wang, G.; Zhou, Y.; Liu, K.; Zhao, G.; Zuo, L. Study of the Portevin-Le Chatelier (PLC) Characteristics of a 5083 Aluminum Alloy Sheet in Two Heat Treatment States. States Mater. 2018, 11, 1533. [Google Scholar] [CrossRef] [PubMed] [Green Version]
  8. Nakamura, T.; Obikawa, T.; Nishizaki, I.; Enomoto, M.; Fang, Z. Friction Stir Welding of Non-Heat-Treatable High-Strength Alloy 5083-O. Metals 2018, 8, 208. [Google Scholar] [CrossRef] [Green Version]
  9. Tamasgavabari, R.; Ebrahimi, A.; Abbasi, S.; Yazdipour, A. The effect of harmonic vibration with a frequency below the resonant range on the mechanical properties of AA-5083-H321 aluminum alloy GMAW welded parts. Mater. Sci. Eng. A 2018, 736, 248. [Google Scholar] [CrossRef]
  10. Liu, Y.; Wang, W.; Xie, J.; Sun, S.; Wang, L.; Qian, Y.; Meng, Y.; Wei, Y. Microstructure and mechanical properties of aluminum 5083 weldments by gas tungsten arc and gas metal arc welding. Mater. Sci. Eng. 2012, 549, 7–13. [Google Scholar] [CrossRef]
  11. Ma, M.; Lai, R.; Qin, J.; Wang, B.; Liu, H.; Yi, D. Effect of weld reinforcement on tensile and fatigue properties of 5083 aluminum metal inert gas (MIG) welded joint: Experiments and numerical simulations. Int. J. Fatigue 2021, 144, 106046. [Google Scholar] [CrossRef]
  12. Corigliano, P.; Crupi, V.; Pei, X.; Dong, P. DIC-based structural strain approach for low-cycle fatigue assessment of AA 5083 welded joints. Theor. Appl. Fract. Mech. 2021, 116, 103090. [Google Scholar] [CrossRef]
  13. Mânzână, M.E. Experimental Studies and Investigations Regarding the Structural Modifications Produced through Cavitation-erosion in Different Metallic Materials. Doctoral Thesis, University Politehnica of Bucharest, Bucharest, Romania, 2012. [Google Scholar]
  14. Guragata, M.C. Studies and Experimental Researches Concerning Plastic Forming and Erosion-Cavitation Behavior of Superalloy Type INCONEL 718. PhD Thesis, University Politehnica of Bucharest, Bucharest, Romania, 2021. [Google Scholar]
  15. Bordeașu, I. Monograph of the Cavitation Erosion Research Laboratory of the University Politehnica of Timisoara (1960–2020); Politehnica Publishing House: Timisoara, Romania, 2020. [Google Scholar]
  16. Micu, L.M. Cavitation Erosion Behavior of Duplex Stainless Steels. Doctoral Thesis, University Politehnica of Timisoara, Timisoara, Romania, 2017. [Google Scholar]
  17. Bordeaşu, I.; Patrăşcoiu, C.; Bădărău, R.; Sucitu, L.; Popoviciu, M.O.; Bălăşoiu, V. New contributions to cavitation erosion curves modeling. FME Trans. 2006, 34, 39–43. [Google Scholar]
  18. Cornelia Laura, S.; Bordeaşu, I.; Sîrbu, N.A.; Bădărău, R.; Mălaimare, G.; Hluscu, M.; Daniel, O.; Oancă, O.V. Evaluation of the Cavitation Resistance of INCONEL 718, in Delivered and Respectively Heat Treated Condition. Adv. Mater. Res. 2020, 1157, 47–51. [Google Scholar]
  19. Istrate, D.; Ghera, C.; Sălcianu, L.; Bordeașu, I.; Ghiban, B.; Băzăvan, D.V.; Micu, L.M.; Stroiță, D.C.; Ostoia, D. Heat Treatment Influence of Alloy 5083 on Cavitational Erosion Resistance. Hidraul. Mag. 2021, 3, 15–25. [Google Scholar]
  20. Bordeasu, I.; Mitelea, I. Cavitation Erosion Behavior of Stainless Steels with Constant Nickel and Variable Chromium Content. Mater. Test. 2012, 54, 53–58. [Google Scholar] [CrossRef]
  21. Standard G32; Standard Method of Vibratory Cavitation Erosion Test. ASTM: West Conshohocken, PA, USA, 2016.
  22. Mitelea, I.; Bordeaşu, I.; Riemschneider, E.; Uţu, I.D.; Crăciunescu, C.M. Cavitation erosion improvement following TIG surface-remelting of gray cast iron. Wear 2022, 496, 204282. [Google Scholar] [CrossRef]
  23. Oanca Victor Octavian Techniques for Optimizing the Resistance to Cavitation Erosion of Some CuAlNiFeMn Alloys Intended for the Execution of Naval Propellers. Doctoral Thesis, University Politehnica of Timisoara, Timisoara, Romania, 2014.
  24. Steller, K.; Reymann, Z.; Krzysztoowicz, T. Evaluation of the resistance of materials to cavitational erosion. In Proceedings of the Fifth Conference on Fluid Machinery, Akad Kiado, Budapest, 15–20 September 1975; Volume 2. [Google Scholar]
  25. Sakai, I.; Shima, A. On a New Representative Equation for Cavitation Damage Resistance of Materials; Report, No. 385; Magazine of Hydraulics, Pneumatics, Tribology, Ecology, Sensorics, Mechatronics 24: Tokyo, Japan, 1987. [Google Scholar]
  26. Micu, L.M.; Bordeasu, I.; Popoviciu, M.O. A New Model for the Equation Describing the Cavitation Mean Depth Erosion Rate Curve. Chem. J. 2017, 4, 894–898. [Google Scholar] [CrossRef]
  27. Garcia, R. Comprehensive Cavitation Damage Data for Water and Various Liquid Metals Including Correlation with Material and Fluid Properties; Technical Report No. 6; University of Michigan: Ann Arbor, MI, USA, 1966. [Google Scholar]
  28. Hobbs, J.M. Experience With a 20-kc Cavitation Erosion Test. In Erosion by Cavitation or Impingement; ASTM International: West Conshohocken, PA, USA, 1967; pp. 159–185. [Google Scholar]
  29. Jean-Pierre, F.; Jean-Louis, K.; Karimi, A.; Fruman, D.-H.; Fréchou, D.; Briançon-Marjollet, L.; Billard, J.-Y.; Belahadji, B.; Avellan, F.; Michel, J.M. Physical Mechanisms and Industrial Aspects; Presses Universitaires de Grenoble: Grenoble, France, 1995. [Google Scholar]
  30. Bordeasu, I.; Ghera, C.; Istrate, D.; Sălcianu, L.; Ghiban, B.; Băzăvan, D.V.; Micu, L.M.; Stroiţă, D.C.; Suta, A.; Tomoiagă, I. Resistance and Behavior to Cavitation Erosion of Semi-Finished Aluminum Alloy 5083. Hidraul. Mag. 2021, 4, 17–24. [Google Scholar]
Figure 1. Evolution of tensile strength values of the experimental 5083 alloy samples, in different structural state.
Crystals 12 01538 g001
Figure 2. Evolution of yield strength values of the experimental 5083 alloy samples, in different structural states.
Crystals 12 01538 g002
Figure 3. Evolution of elongation values of the experimental 5083 alloy samples, in different structural states.
Crystals 12 01538 g003
Figure 4. Evolution of hardness values of the experimental 5083 alloy samples, in different structural states.
Crystals 12 01538 g004
Figure 5. Evolution of resilience strength values of the experimental 5083 alloy samples, in different structural states.
Crystals 12 01538 g005
Figure 6. Structural analysis of cast experimental samples from aluminum 5083 alloy: (a) Gauge sample (H), (bd) cast + quenched at 350 °C/100 min/air + artificial ageing at 180 °C; (eg) cast + quenched at 450 °C/100 min/air + artificial ageing at 140 °C; (hj) cast + quenched at 450 °C/100 min/air + artificial ageing at 140 °C (b,e,h) 1 h maintaining, (c,f,i) 12 h maintaining, (d,g,j) 24 h maintaining.
Crystals 12 01538 g006aCrystals 12 01538 g006b
Figure 7. Evolution of grain size values of the experimental 5083 alloy samples, in different structural state.
Crystals 12 01538 g007
Figure 8. Appearance of X-ray diffractograms of 5083 aluminum alloy samples after heat treatment at different temperatures and maintenance times.
Crystals 12 01538 g008
Figure 9. Average erosion depth (a,c,ei,k,m,o,q,s) and average erosion rate (b,d,f,h,i,l,n,s,t) versus cavitation exposure time of the experimental samples of aluminum type 5083: (a,b) gauge sample, (ch) after 350 °C/100 min/air + 180 °C, (in) after 450 °C/100 min/air + 140 °C, (ot) after 450 °C/100 min/air + 180 °C, (c,d,i,j,o,p) 1 h maintainig, (e,f,k,l,q,r) 12 h maintaining (g,h,m,n,s,t) 24 h maintaining 200×, (c) 500×, (d) 2000×.
Crystals 12 01538 g009aCrystals 12 01538 g009bCrystals 12 01538 g009c
Figure 10. Appearance of macrostructural surfaces (left front section, parallel to the eroded surface, right in cross section, background optical microscope image, detailed stereomicroscope image) subjected to cavitation erosion of alloy 5083, in cast state.
Crystals 12 01538 g010
Figure 11. Appearance of macrostructural surfaces (left front section, parallel to the eroded surface, right in cross section, background image under an optical microscope, detail image under a stereomicroscope) subjected to cavitation erosion from alloy 5083, poured followed by hardening solution 350 °C/maintenance 100 min/cooling air quietly and subjected to artificial aging at 180 °C and different maintenance times: (a) 1 h; (b) 12 h; (c) 24 h.
Crystals 12 01538 g011
Figure 12. Appearance of macrostructural surfaces (left front section, parallel to the eroded surface, right in cross section, background image under an optical microscope, detail image under a stereomicroscope) subjected to cavitation erosion from alloy 5083, poured followed by hardening solution 450 °C/maintenance 100 min/cooling air quietly and subjected to artificial aging at 180 °C and different maintenance times: (a) 1 h; (b) 12 h; (c) 24 h.
Crystals 12 01538 g012aCrystals 12 01538 g012b
Figure 13. Appearance of macrostructural surfaces (left front section, parallel to the eroded surface, right in cross section, background optical microscope image, detailed stereomicroscope image) subjected to 5083 alloy cavitation erosion, cast followed by solution hardening 450 °C/maintenance 100 min/cooling quiet air and subjected to artificial aging at 140 °C and different maintenance times: (a) 1 h; (b) 12 h; (c) 24 h.
Crystals 12 01538 g013
Figure 14. Scanning electron analysis (SEM) of the eroded surfaces of alloy 5083, in cast state (a,b control sample), and after quenching at 450 °C maintaining 100 min/air cooling and ageing at 180 °C/12 h at different magnification of the microscope (c,d): (a,c) macroscopic aspect, (b,d) microscopic aspect (detail of an image).
Crystals 12 01538 g014
Table 1. Chemical composition of experimental alloy specimens 5083.
SampleChemical Composition, % Rate
SiFeCuMnMgCrZnTiAl
Experimental0.410.290.1060.524.210.120.160.028Rest
SR EN 373- 3Max 0.40Max 0.40Max 0.100.4–1.04.0–4.90.05–0.25Max 0.25Max 0.15Rest
Table 2. Mechanical behavior and grain size of the experimental samples type 5083 in different structural states.
StateMechanical Characteristics
Tensile StrengthYield StrengthElongationHardnessμHVResilience
[MPa]Std
Dev
[MPa]Std
Dev
[%]Std
Dev
[daN]Std
Dev
μHVStd
Dev
[J]Std
Dev
HGauge sample220.63±0.9959118.84±1.0707828.40±0.3413979.80±0.5099276.97±0.8113432.12±1.05334
HAP350 °C/100 min/air + 180 °C/1 h318.58±1.00659151.21±0.768117.11±0.6191776.80±0.869776.89±1.3486731.00±0.7858
HAL350 °C/100 min/air + 180 °C/12 h346.20±1.19915195.70±1.9278714.75±0.5816179.00±0.869679.14±0.8381425.80±0.7305
HAI350 °C/100 min/air + 180 °C/24 h436.30±1.29539356.68±0.9015912.73±0.6654579.00±0.6654580.01±0.5886825.20±0.38525
HNOP450 °C/100 min/air + 140 °C/1 h294.82±0.64895139.57±1.1342923.44±0.7629472.80±0.950874.65±0.7919332.60±0.8542
HNOL450 °C/100 min/air + 140 °C/12 h307.63±1.25037141.66±0.8278121.17±0.7885676.80±1.0106875.30±1.0025822.10±0.69215
HNOI450 °C/100 min/air + 140° C/24 h311.21±0.80242144.55±1.8611919.18±0.9692976.80±1.0334980.67±0.7265218.00±0.73799
HNP450 °C/100 min/air + 180 °C/1 h250.03±0.78143146.50±1.1698612.68±0.662971.80±0.5333778.12±0.5814531.70±0.62006
HNL450 °C/100 min/air + 180 °C/12 h315.16±1.02569149.91±0.8308913.18±0.5417477.90±0.6274278.38±0.8399628.40±0.89793
HNI450 °C/100 min/air + 180 °C/24 h318.34±1.60049158.62±1.0844314.44±0.5455180.70±0.6032279.68±1.0996716.40±0.70432
Table 3. Grain size analysis of the experimental alloy type 5083.
CodeStateParameters of the Statistical Analysis
Grain Size
Minimum
Grain SizeGrain SizeStandard Deviation95% CI
[μm]MaximumMedium [μm] [μm]
[μm] [μm]
HGauge sample120.10653.51255.9594.1720.17
HAP350 °C/100 min/air + 180 °C/1 h10.03317.86185.5877.0827.33
HAL350 °C/100 min/air + 180 °C/12 h41.89302.18164.0552.3416.15
HAI350 °C/100 min/air + 180 °C/24 h36.89272.76149.6951.2114.78
HNOP450 °C/100 min/air + 140 °C/1 h20.10425.23212.2983.0512.17
HNOL450 °C/100 min/air + 140 °C/12 h20.10475.53197.0696.0114.51
HNOI450 °C/100 min/air + 140 °C/24 h20.10426.54190.3897.3813.94
HNP450 °C/100 min/air + 180 °C/1 h21.84564.23245.23108.8319.01
HNL450 °C/100 min/air + 180 °C/12 h49.02418.34225.3143.5718.52
HNI450 °C/100 min/air + 180 °C/24 h103.10371.86215.2136.2816.83
Table 4. Elemental cell parameters and crystallite size of the analyzed samples.
Test CodeCrystallographic PhaseElementary Cell Parameters,
a [Å]
Crystalline Size
D (nm)
HAl0.95Mg0.054.073163.2
HAP4.075150.8
HAL4.074140.3
HAI4.072136.5
HNOP4.073162.2
HNOL4.073145.6
HNOI4.073145.6
HNP4.076158.4
HNL4.075151.2
HNI4.074123.9
Table 5. Parameters of erosion–cavitation process of the experimental 5083 aluminum samples.
Sample M D E R max m M D E R max e x p M D E R s Δ
| M D E R max m M D E R max e x p | | M D E R max m M D E R max s |
μ m / m i n % μ m / m i n %
H0.4290.5890.4130.16370.0165.7
HAP0.1220.1710.1110.049400.0119
HAL0.1040.1120.1120.00880.0088
HAI0.1010.1660.0920.065650.0099
HNOP0.1010.1660.0920.065650.0099
HNOL0.3590.3850.3170.0380.04212
HNOI0.2960.4260.2620.13440.03412
HNP0.2610.3800.2370.109460.0149
HNL0.1090.2820.2090.0733500
HNI0.1930.3750.1770.182950.0.168
Table 6. Maximum depth of penetration of cavitation attack of 5083 aluminum alloy specimens in different heat treatment conditions.
SampleMaximum Penetration Depth of the Cavitation Attack
M D E R m a x   ( μ m ) δ m e a s u r e d ( μ m ) δ M D E R m a x
H60.249436.587
HAP17.928190.0111
HAL15.128162.8711
HAI14.572124.418
HNOP52.115330.266
HNOL43.027291.817
HNOI38.31285.027
HNP29.572278.239
HNL29.471262.49
HNI28.589257.879
Publisher’s Note: MDPI stays neutral with regard to jurisdictional claims in published maps and institutional affiliations.

