Article

Study of the Microstructural, Thermal, and Magnetic Properties of High-Energy Ball-Milled Nanocrystalline Fe(Al)

1
Department of Physics, University of Girona, Campus Montilivi, 17071 Girona, Spain
2
Laboratoire de Chimie Inorganique, UR-11-ES-73, Faculté des Sciences de Sfax, Université de Sfax, BP 1171, Sfax 3018, Tunisia
3
Department of Chemistry, College of Science, Qassim University, Buraidah 51452, Saudi Arabia
*
Author to whom correspondence should be addressed.
Crystals 2022, 12(10), 1430; https://doi.org/10.3390/cryst12101430
Submission received: 16 September 2022 / Revised: 5 October 2022 / Accepted: 7 October 2022 / Published: 10 October 2022
(This article belongs to the Special Issue Emerging Topics on High Performance Alloys)

Abstract

:
In this work, structural, microstructural, thermal, and magnetic properties of a Fe-25at%Al alloy produced by high-energy mechanical milling were investigated by X-ray diffraction (XRD), scanning electron microscopy (SEM), differential scanning calorimetry (DSC), and vibrating sample magnetometry (VSM) techniques. At the early stage of the milling process, three phases, namely, Fe, Al, and Fe(Al), coexist in the milled powder. After 20 h of milling, the results of the refinement of the XRD pattern reveal the formation of the supersaturated bcc-Fe(Al) solid solution with a crystallite size of 10 nm. The DSC curves show several overlapped exothermic peaks associated with the relaxation of the deformed structure and various phase transitions, such as the formation of Al13Fe4 and Fe3Al intermetallic. During milling times, the alloyed samples have a hard-ferromagnetic behavior, where Hc varies from 628 Oe to 746 Oe when the milling time increases from 4 to 40 h. The magnetic properties were related to the microstructural changes.

1. Introduction

Iron aluminide (FeAl) alloys have been widely studied due to their high strength, low density, low production cost, good mechanical properties, and corrosion resistance at high temperatures; such excellent machining characteristics are attractive [1,2,3]. At high temperatures, iron aluminides are about 30% lighter than commercial structural materials such as stainless steel and nickel-based superalloys [4]. In addition, their good high-temperature corrosion resistance in oxidizing and sulfurizing environments [5,6] approves their use in typical industrial applications, namely power generation systems. This is ascribed to the formation of dense and adherent alumina scales on the surface of the material. In addition, Iron aluminide (FeAl) alloys have also been developed to provide a wide range of materials with competitive magnetic properties (high magnetization and low coercivity) to overcome the great and evermore eager demand for high-performance Fe-based soft and soft–hard magnetic materials [7,8,9]. One of the most important methods is mechanical alloying (MA), which is used for the preparation of alloys with good physical properties thanks to their novel nanostructures. MA has attracted much attention in recent years because it has proved to be an ideal tool for the generation of a wide range of systems, including supersaturated solid solutions, dispersion-strengthened materials, intermetallic, and nanocrystalline materials, through complex mechanisms of intermixing, solid-state inter-diffusion and chemical reactions, depending on the various milling parameters [8,9]. To the best of our knowledge, most of the research regarding Fe-Al has focused on the study of microstructural and physical properties during mechanical alloying and investigating their restricted applications, while the study of their thermal stability at high temperatures is still limited; allotropic transformations and intermetallic phases formation (as Fe3Al and Al13Fe4) can occur. The current study was performed to investigate (in an Fe-Al with a relatively low Al content, 20 at.%) three aspects. Firstly, explore the synergistic effect of increasing the alloying time on the refinement of the microstructure. Secondly, study the thermal stability and transformations noted at high temperatures. Finally, examine the magnetic properties of the prepared alloy.

2. Experimental Procedure

The Fe-25at%Al alloy was prepared with high-purity powdered components (99.9% purity Fe, 74 μm size and 99.95% purity Al, powder 75 μm; both from Alpha Aesar) by mechanical alloying using a laboratory planetary ball mill (Type PM400) under an argon atmosphere (99.999 purity). The ball-to-powder weight ratio used was maintained at 12:1, and the milling speed was adjusted to 400 rpm. The milling was performed with hardened stainless-steel balls and vials, with seven balls (10 mm diameter), and to prevent excessive heating, the mill was subjected to cycles (10 min on, 5 min off). The morphology studies were performed via scanning electron microscopy in a DSM960A ZEISS microscope. The structural investigations were conducted by X-ray diffraction (XRD) measurements using a D-500 Siemens equipment with CuKα radiation. The size of the coherently diffracted crystallites, the lattice strains, the lattice parameter, and the percentage of the crystallographic phase were calculated based on the Rietveld method using the X’Pert High Score Plus program. The DSC measurements and annealing processes were performed in a Mettler–Toledo DSC822 apparatus under an argon atmosphere, at a temperature ranging from 50 to 700 °C and at a heating rate of 10 °C/min. Annealing has been performed in the DSC under 20 mL/min Ar flow. The magnetic characterization was carried out by Superconducting Quantum Interference Device from Quantum Design SQUID MPMS-XL at room temperature.

3. Results and Discussion

3.1. Structural and Microstructural Analysis

Figure 1 illustrates the XRD patterns of the Fe3Al powder mixtures in the initial state and after the selected milling times. The XRD patterns of the initial powder mixture (0 h) exhibit the diffraction peaks of pure bcc-Fe (Im-3m; a0 = 2.8667(1) Å) and fcc-Al (Fm-3m; a0 = 4.0478(4) Å). During milling, one can note that the Al peaks disappeared progressively, suggesting that the MA led to the dissolution of Al in the Fe lattice. The XRD profiles of the powder MA for 20 h revealed that the strongest Al peak, (111), disappears completely (Figure 1), indicating that Al was in the Fe lattice to form the supersaturated solid solution bcc-Fe(Al) (Im-3m; a0 = 2.8650(1) Å). Figure 2 shows the histogram of the quantitative evolution of the Fe, Al, and Fe(Al) contents as a function of the milling time. It was observed that the Fe and Al contents gradually decreased until they disappeared after 30 and 20 h of milling, respectively. Moreover, as soon as they form, the Fe(Al) content increases linearly, from a value of 13.7% to a value of 100% after 30 and 40 h of milling (Figure 2). The peak positions of the Fe(Al) solid solution favored by milling are overlapped with the bcc Fe phase (the coexistence of both phases is confirmed by XRD refinement based on the Rietveld method). Fe3Al or oxides have not been detected.
Typical SEM micrographs of the obtained powder (0, 20, and 40 h of milling), given in Figure 3, show that the morphology changes greatly during the mechanical milling. Three stages, that is, severe plastic deformation (SPD), cold welding, and fracture, can be differentiated depending on the milling time. The morphology of the initial powder particles was found to be non-homogeneous, where one can observe particles with different shapes and sizes. After 12 h of milling, the particles were found to be irregular in shape and flattened because of the strong plastic deformation occurring, accompanied by cold particle welding during the first period of the milling. With an increase in milling time up to 20 h, the particles appear in spherical shapes and more uniform size distribution as a result of fracture phenomena after a preliminary cold-welding stage. After prolonging the milling time to 40 h, the particle size gradually decreased, and the particles became roughly spherical due to the hardening of the powder under the effect of the repeated shocks of balls. It is a result of the intense fracture process [10,11].
The EDX spectra of the alloyed samples after 2 h and 20 h are given in Figure 4. Microanalysis confirms that the percentage ratio of the original elements is very close to the nominal values (74.26at%Fe-24.74at%Al), and no oxygen oxide or impurities were detected in the powder mixtures.
On the other hand, one can observe a clear increase in the full width at the middle height (FWHM) of the peaks (Figure 1), which indicates a refinement favored by the decrease in crystallite size and an increase in the lattice strains that occurred during the milling process. Furthermore, due to the severe plastic deformation generated by the MA, a slight peak displacement (to higher or lower values of 2Theta) is associated with lattice parameter distortion.
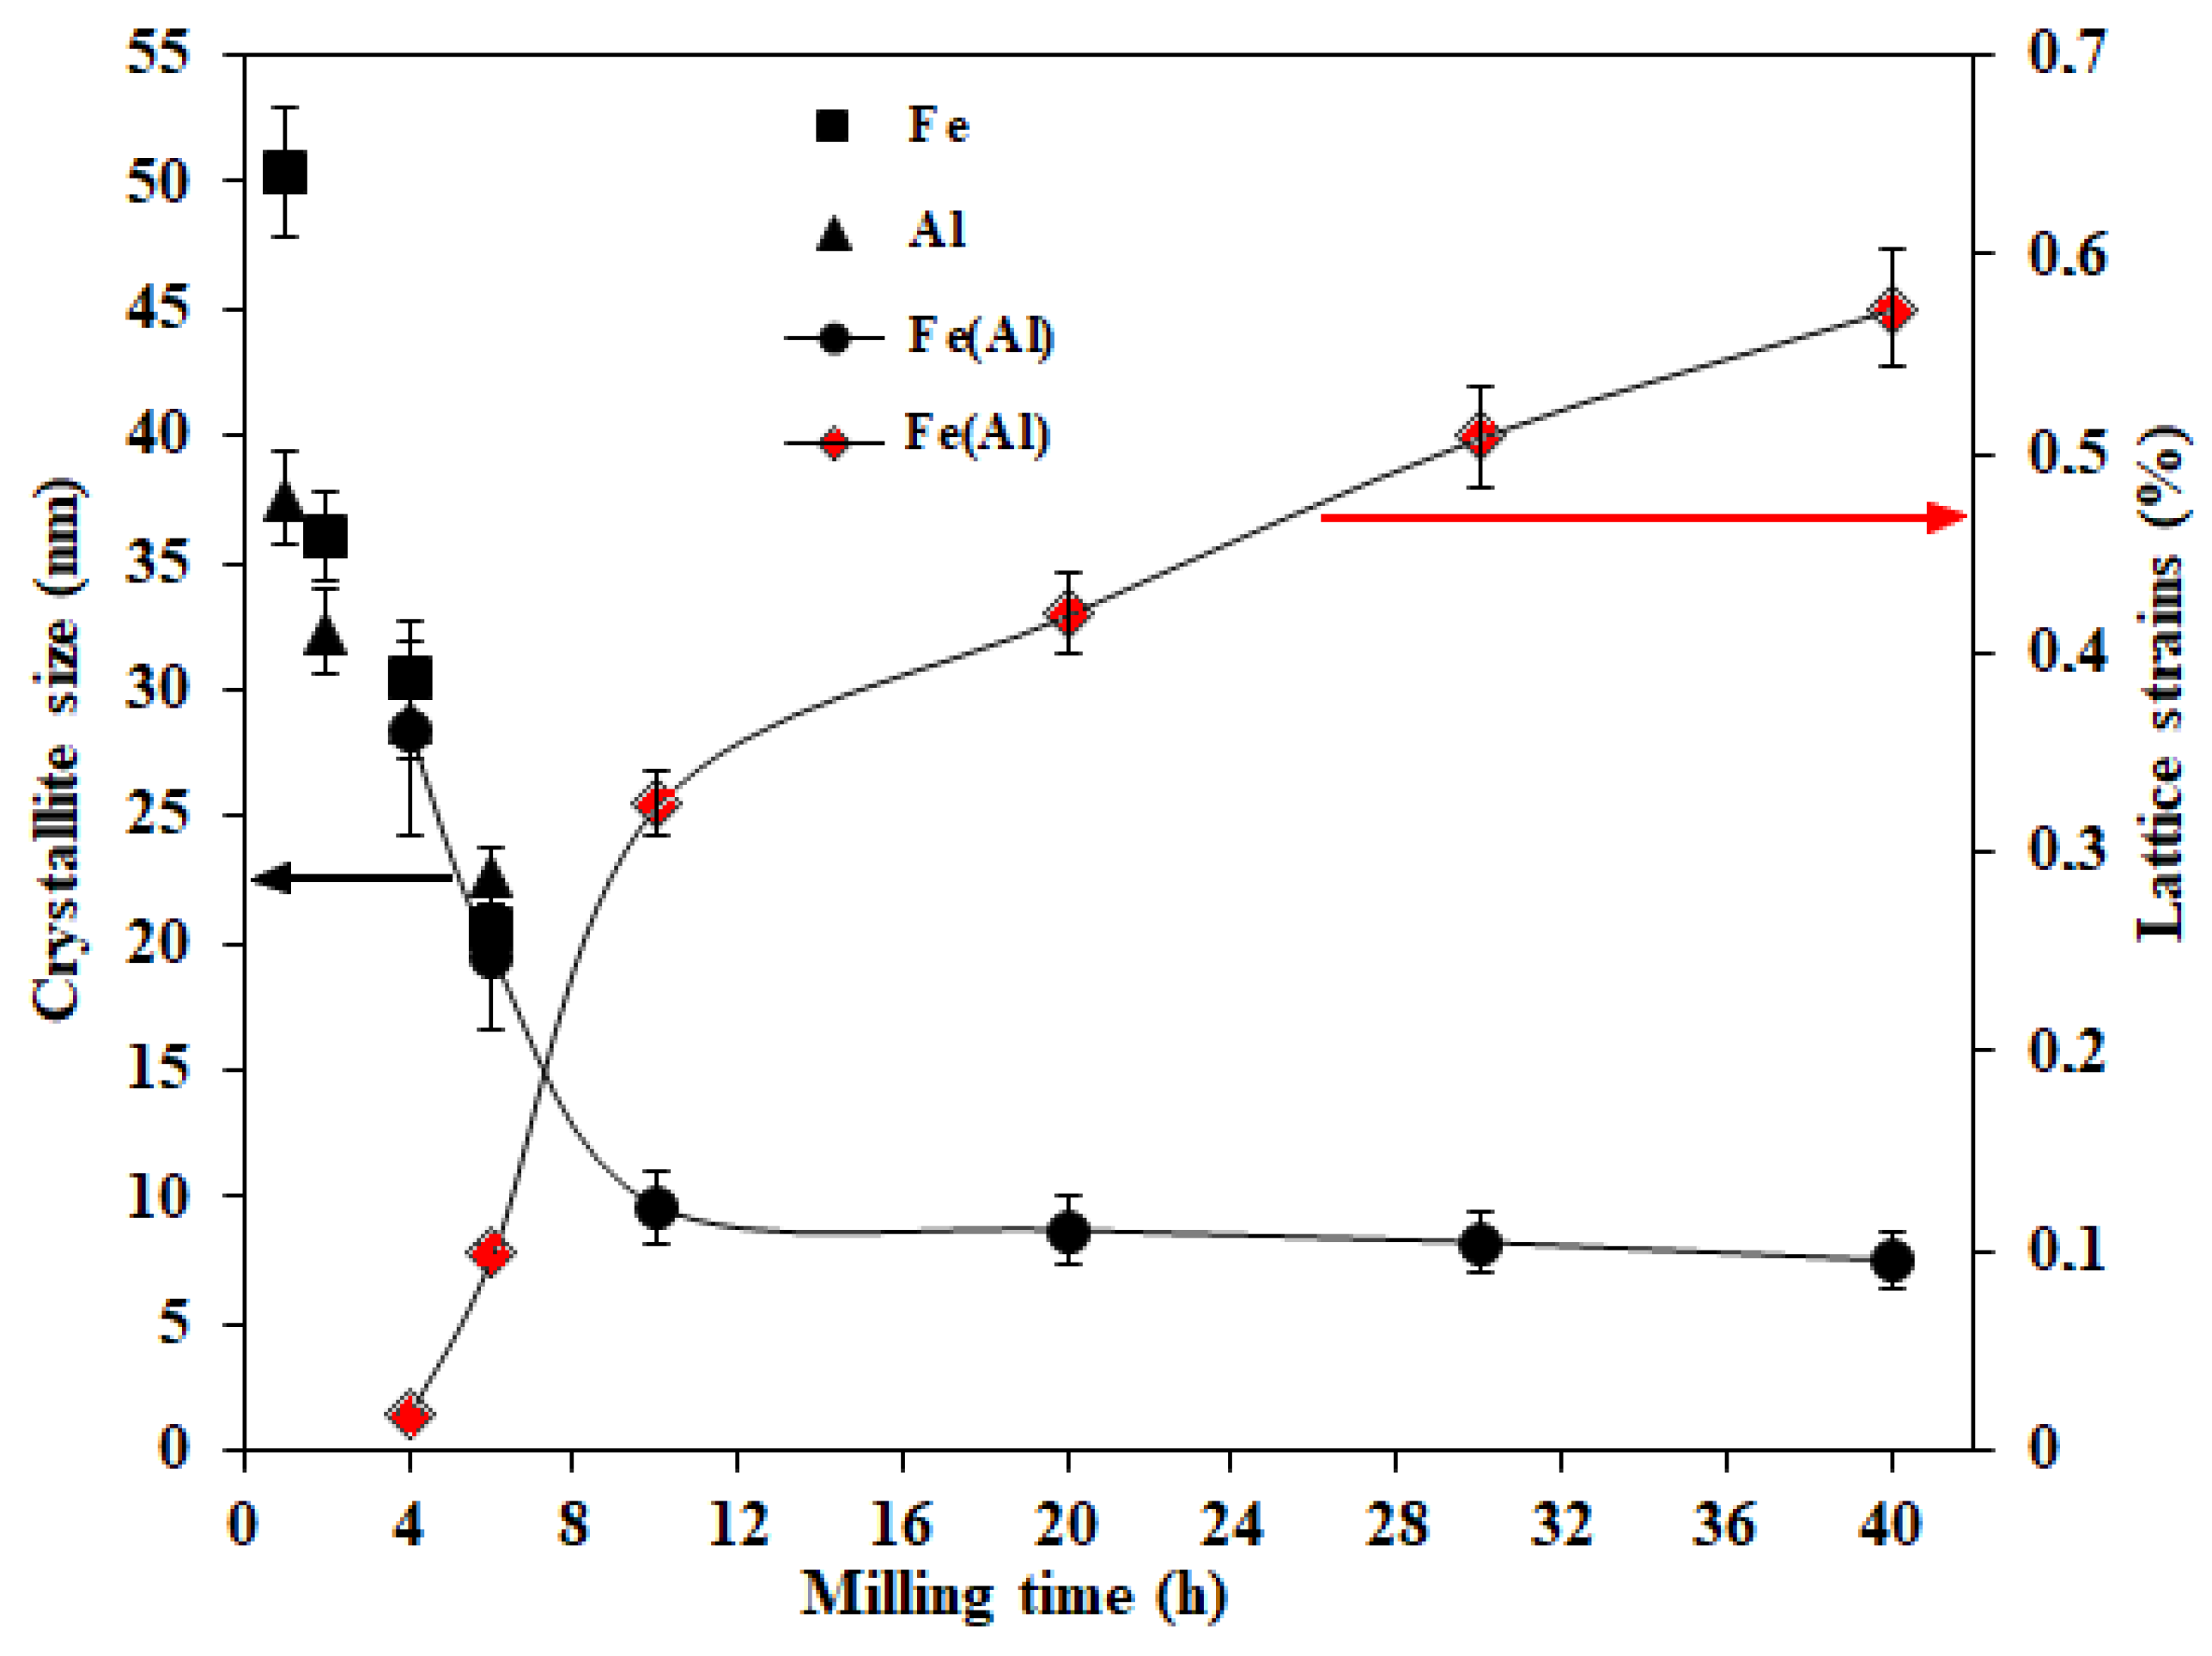
Figure 5 shows the variation of the calculated values of the crystallite size and lattice strains with milling time. By increasing the milling time, the lattice strains have increased while the average crystallite size has decreased. As it can be noted, the crystallite size in the preliminary times of milling abruptly decreased, then, after 10 h of milling, it followed a relatively steady-state behavior. The final average crystallite size and lattice strains refined at 40 h of milling were found to be around 10 nm and 0.6%, respectively. Amorphization has not been detected by the XRD patterns analysis with Rietveld refinement.
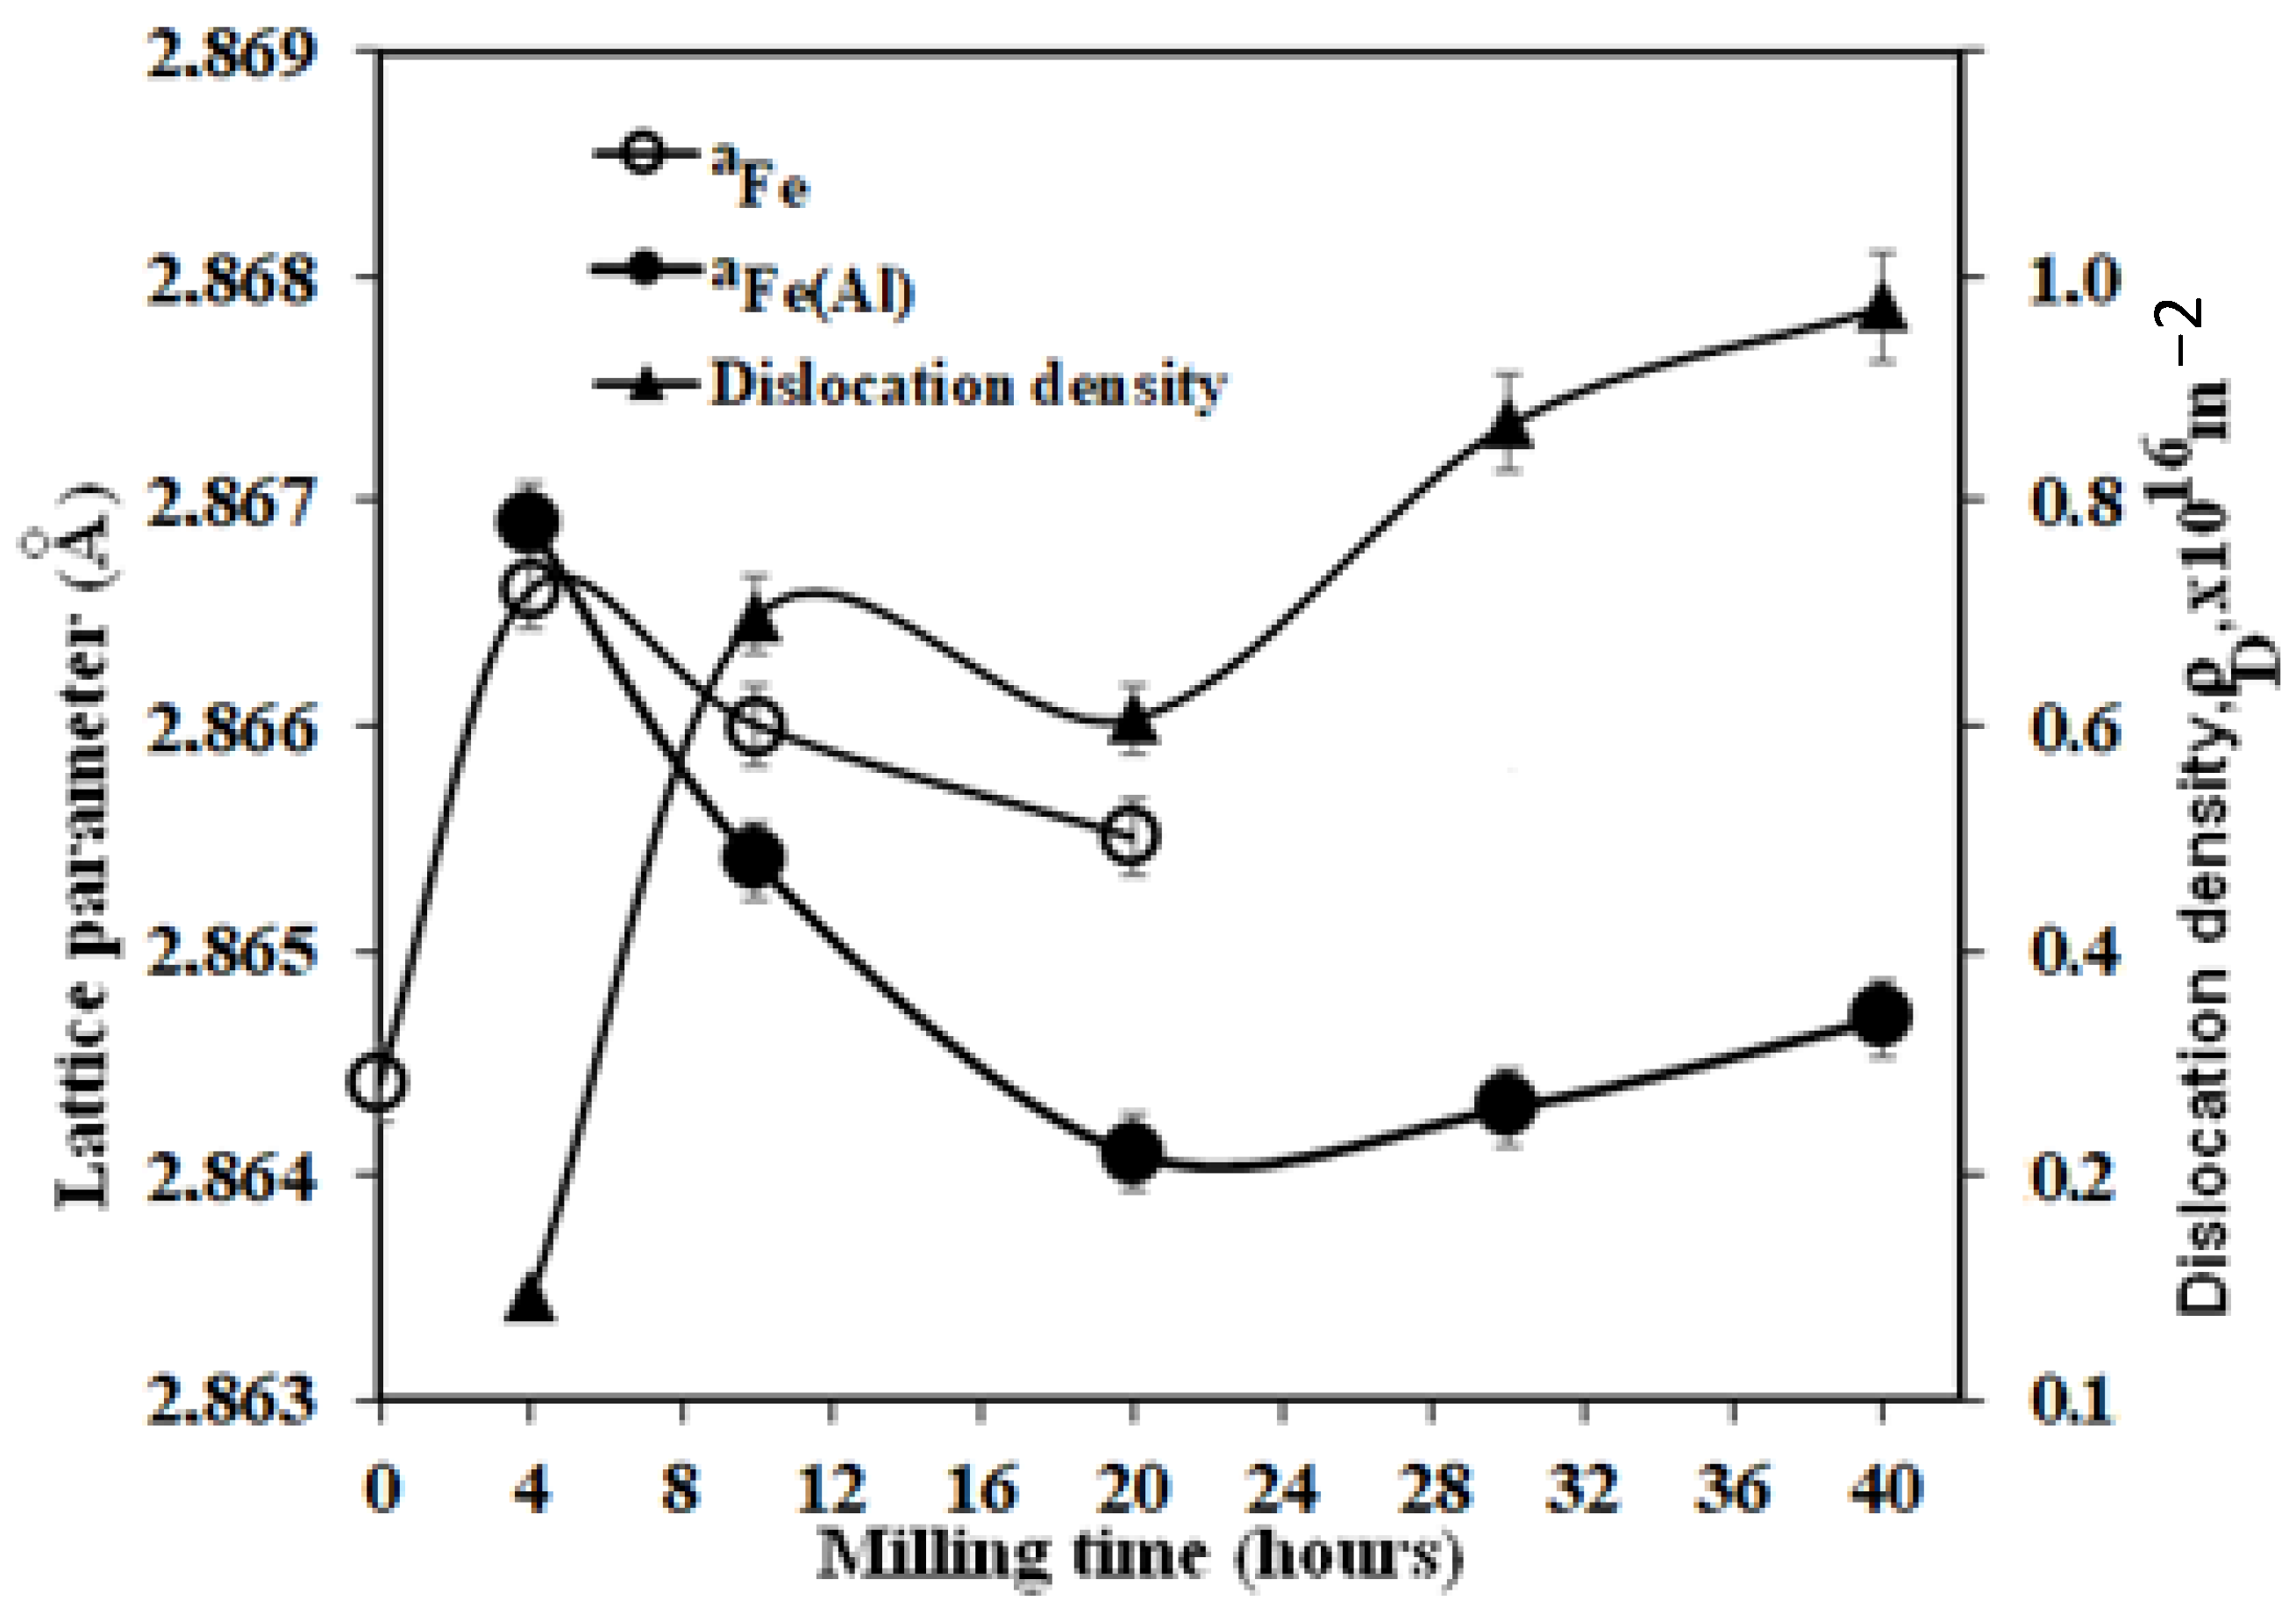
By analyzing the diffraction data using the Rietveld structure refinement method, we were able to follow the evolution of the lattice parameter and density dislocation of the milled powders for different times of milling (Figure 6). For the first 4 h of milling, one can observe an increase in the lattice parameter of Fe from a value of 2.8644(1) to the value of 2.8666(1) Å, indicating the progressive dissolution of Al in the matrix of Fe, and giving rise to the solid solution bcc-Fe(Al), with a lattice parameter of 2.8669 Å. Note that the metallic atomic radius of Al is equal to 1.43 Å, which is greater than that of Fe (1.26 Å). After that, the lattice parameter decreases during the milling up to 20 h, where the pure Fe phase evolves to a solid solution. This cannot be associated with the solid solution of Al in Fe. This decrease is explained by the effect of severe plastic deformation, which can cause the compression of the lattice due to the presence of compressive stress fields within the non-equilibrium grain boundaries inside of the crystallites. For higher milling times, one can observe a slight increase in the lattice parameter from 2.8641 (after 20 h) to 2.8647 Å at the end of milling (after 40 h). This variation may be explained by the increase in the levels of defects as well as the dislocation. Indeed, dislocations were the main source of microstructure refinement in the crystal system near the grain boundaries. The dislocation density, ρs, can be represented in terms of the lattice strains, ε, and the crystallite size, D, using the following relation [12,13,14]:
ρ = 2 3 ( ε 2 ) 1 / 2 D . b
where ε is the lattice strain, D is the crystallite size and the Burgers vector of dislocations, b, equals a bcc 3 2 for the bcc structure. The lattice parameter, abcc, is fitted as a function of the milling time for the bcc structure. The calculated values of the dislocation densities, ρbcc, as a function ofthe milling times are given in Figure 6. One can observe three sections of dislocation density. During the first 10 h of milling, the dislocation density shows a considerable increase to 0.69 × 10¹⁶ m−2. From 10 and 20 h, the dislocation density slightly decreases to 0.606 × 10¹⁶ m−2. This can be explained by partial recrystallization (without grain growth) in structure. Usually, in conventional polycrystalline materials, the grain boundaries, GBs, are thought to be barriers to the dislocation motion. The slight decrease in the dislocation density indicates a relaxation of the grain boundaries. Beyond 20 h of milling, the dislocation density increases and reaches its maximum value of around 1 × 10¹⁶ m−2. This noted tendency of increase noted can be related to accumulating dislocations. In fact, the collision of powder particles between the balls generates severe plastic deformation, so that the dislocations may undergo a climb. So, diffusivity increased with the reduction in crystallite size [15].

3.2. Thermal Analysis

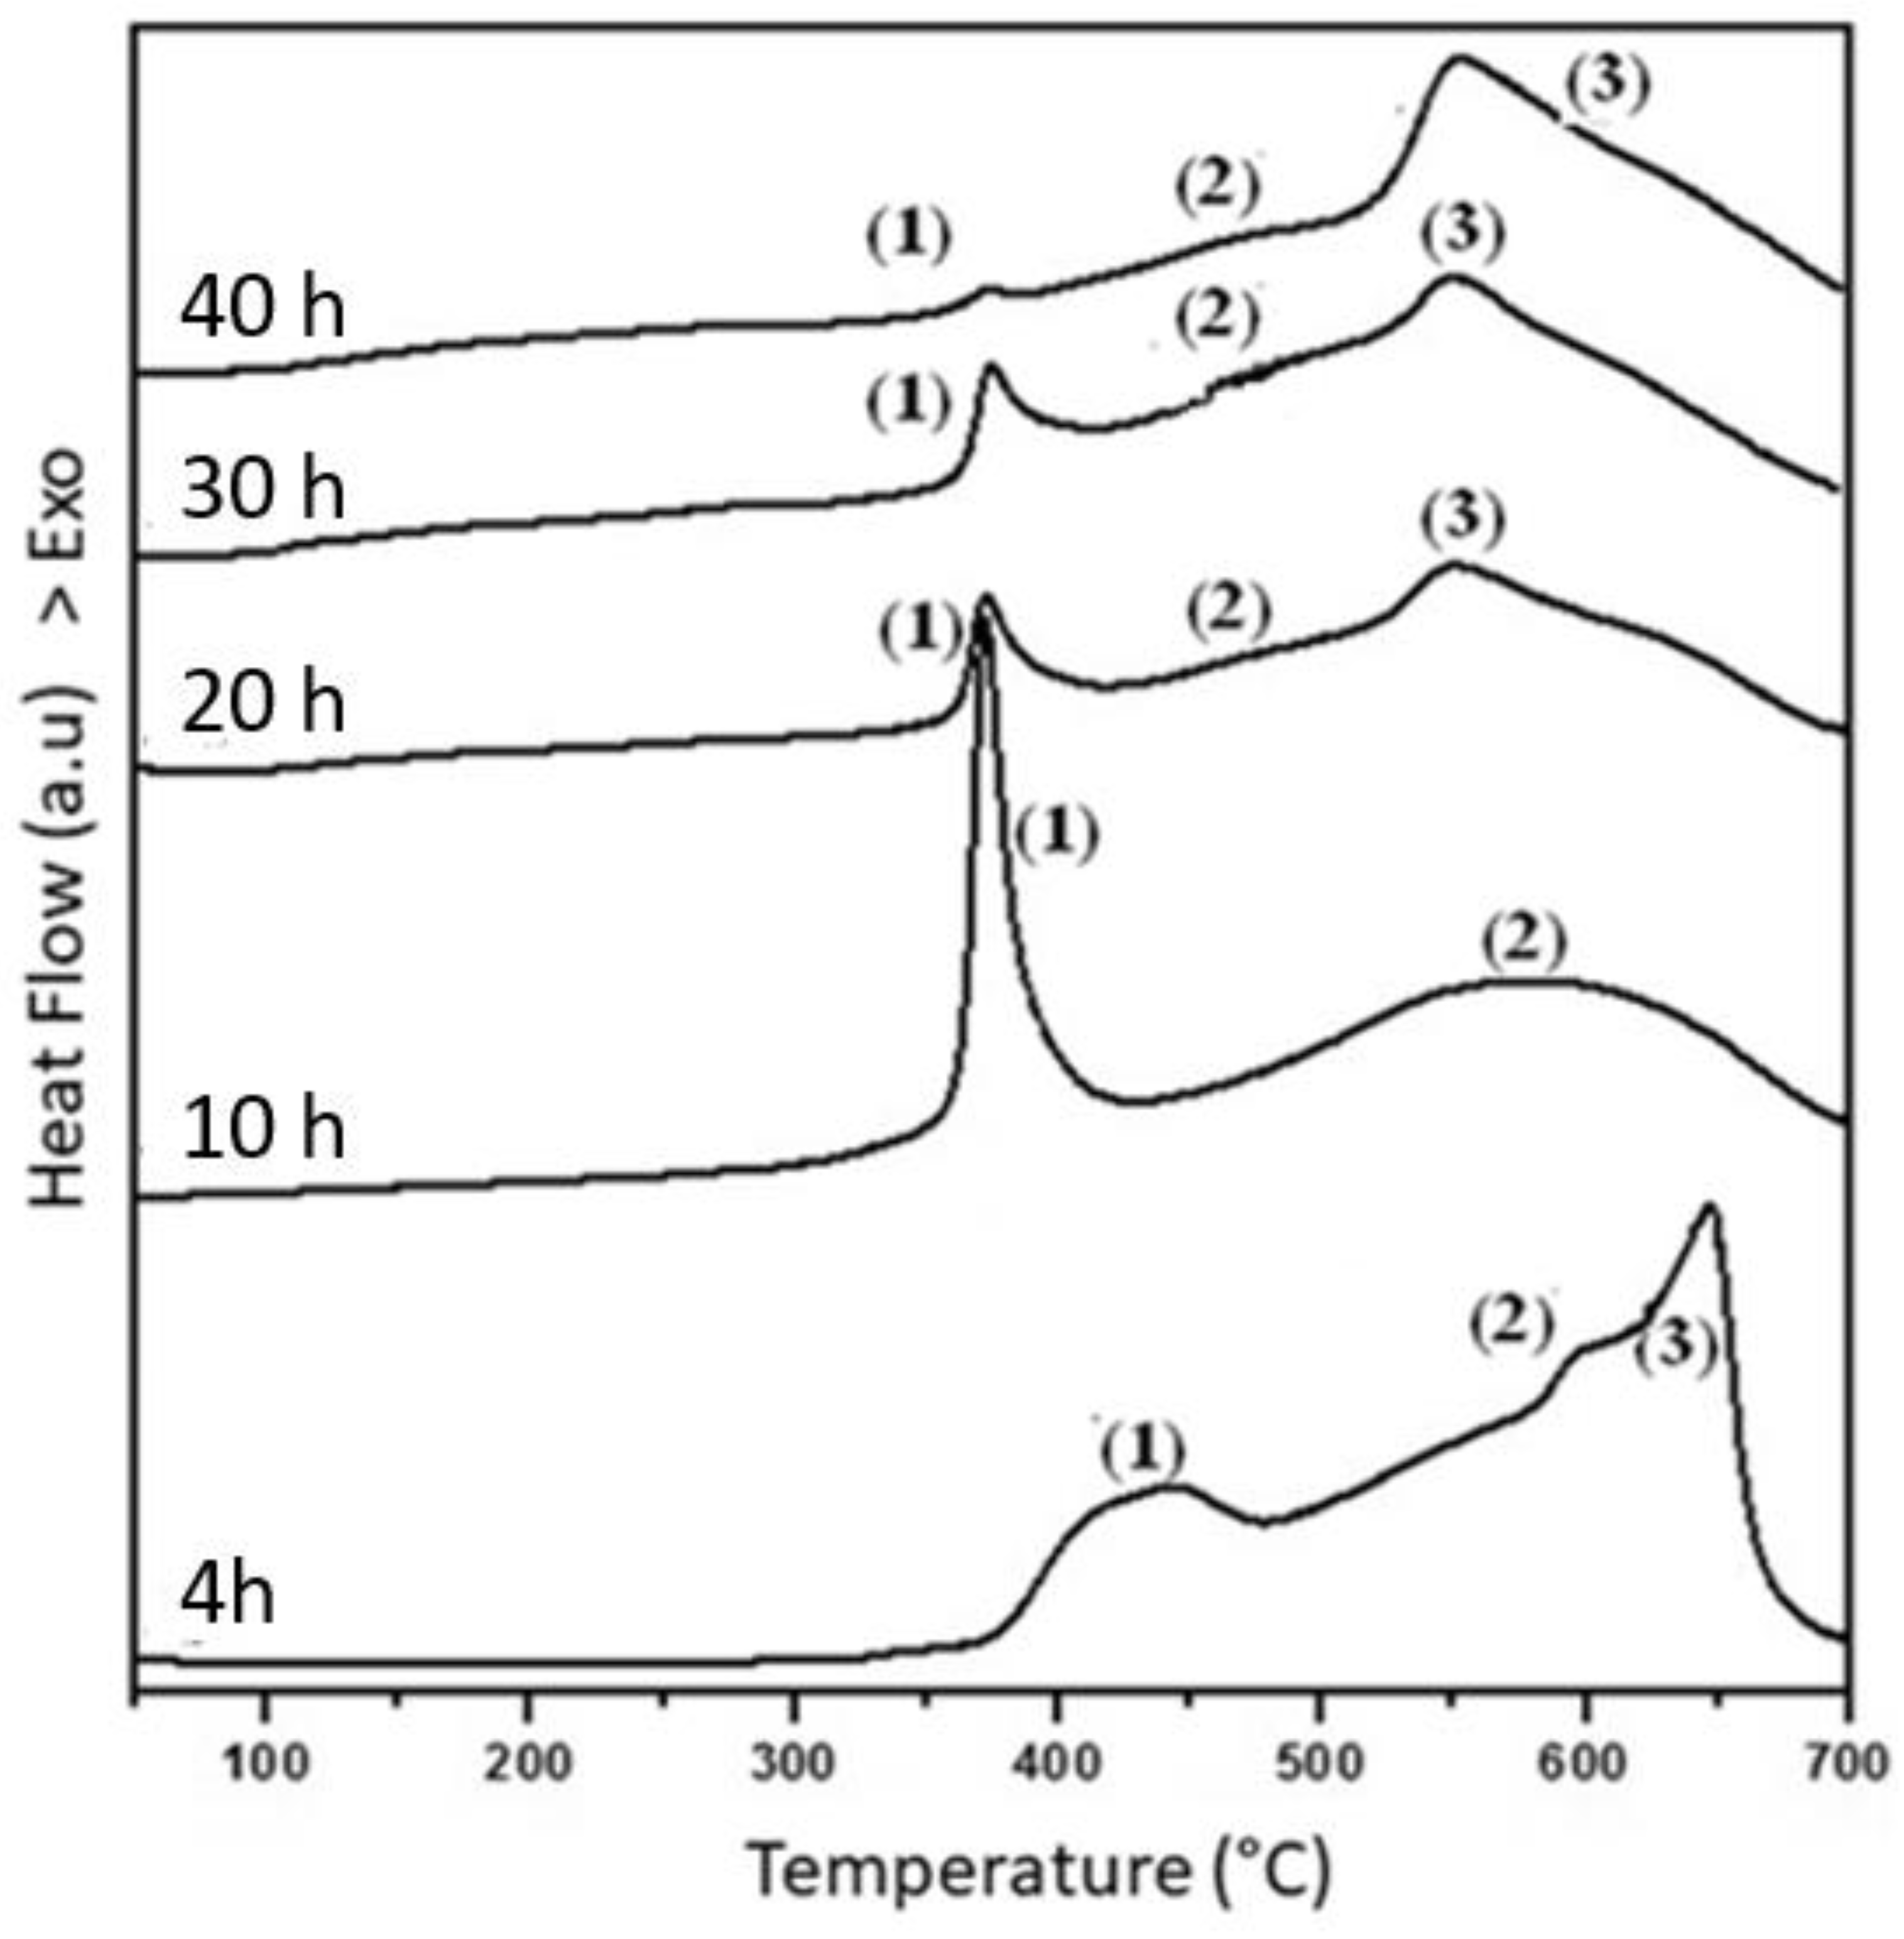
In order to study the thermal stability of the nanocrystalline bcc solid solution formed in the milled powders, DSC was performed at a constant heating rate of 10 °C/min under an argon atmosphere. Figure 7 shows the DSC curves of the mechanically alloyed Fe-25at%Al powders for different milling times. Several overlapping broad exothermic peaks are visible, extended over a wide temperature range (the numbers correspond to the peaks detected in each sample). The two most exothermic peaks are observed at temperatures near 370 and 550 °C. Similarly, the DSC data have been reported and analyzed in detail before [16,17]. According to the reports, the low-temperature peak corresponds to the reaction between the free Fe and Al metals, which are not completely alloyed to form Fe(Al), which is coherent with the XRD observation [18]. The exothermic peak is no longer observed after 20 h since the Fe and Al have been completely alloyed to form the disordered solid solution Fe(Al), which is also consistent with the XRD data. The peak at higher temperatures can be related to the formation of the order phases Al13Fe4. This phase was also detected in a previous work of Fe-40at%Al [19]. Thus, the reduction in the Al content (from 40 to 25 at% does not inhibit the formation of this phase. The endothermic peak observed at 470 °C for the DSC curve of the powder milled for 30 h (encircled one) can be associated with the allotropic transformation A2 + DO3 → DO3 of the Fe(Al) system. This transformation usually appears due to the Al content and is between 21 and 34%. Thus, the milling time favors the increase in the Al content in the solid solution. This transformation temperature corresponds to that of the Curie temperature of the Fe-25at%Al alloy [20].
The refinement of the thermogram of the Fe-25at%Al powder milled for 20 h (Figure 8a) makes it possible to show the different transformations overlapped in peaks. More specifically, it shows four exothermic transformations. The first one is a large transformation at 250 °C, denoted (1), corresponding to the structural relaxation of the disordered solid solution Fe(Al) formed during milling. The second transformation observed at 380 °C (noted (2)) corresponds to the recrystallization of the α-Fe phase. The third transformation observed at 400 °C (noted (3)) can correspond to the formation of the order solid solution Fe(Al). While the last thermal accident found at 550 °C (noted (4)) can be associated with the transformation of Fe(Al) solid solution to the nanostructured Fe3Al intermetallic [21]. Similarly, the refinement of the thermogram of the Fe-25at%Al powder milled for 40 h, presented in Figure 8b, allows for following the thermal stability of the final MA product. It shows five overlapping exothermic transformations: the first broad exothermic process, observed at the temperature of around 250 °C (denoted (1)), may correspond to the restoration and rearrangement of defects introduced in the disordered solid solution Fe(Al) obtained after 40 h milling. The second transformation observed at 400 °C (noted 2) corresponds to the recrystallization of the bcc-Fe(Al) phase. The third exothermic transformation observed at 460 °C (noted (3)) can correspond to the formation of the order solid solution bcc-Fe(Al). The fourth exothermic peak found at 560 °C (noted (4)) can be attributed to the exothermic transformation of supersaturated Fe(Al) solid solution to the nanostructured Fe3Al intermetallic [21]. While the last exothermic reaction found at 600 °C (noted (5)) can correspond to the formation of the Al13Fe4 intermetallic [16,22,23].
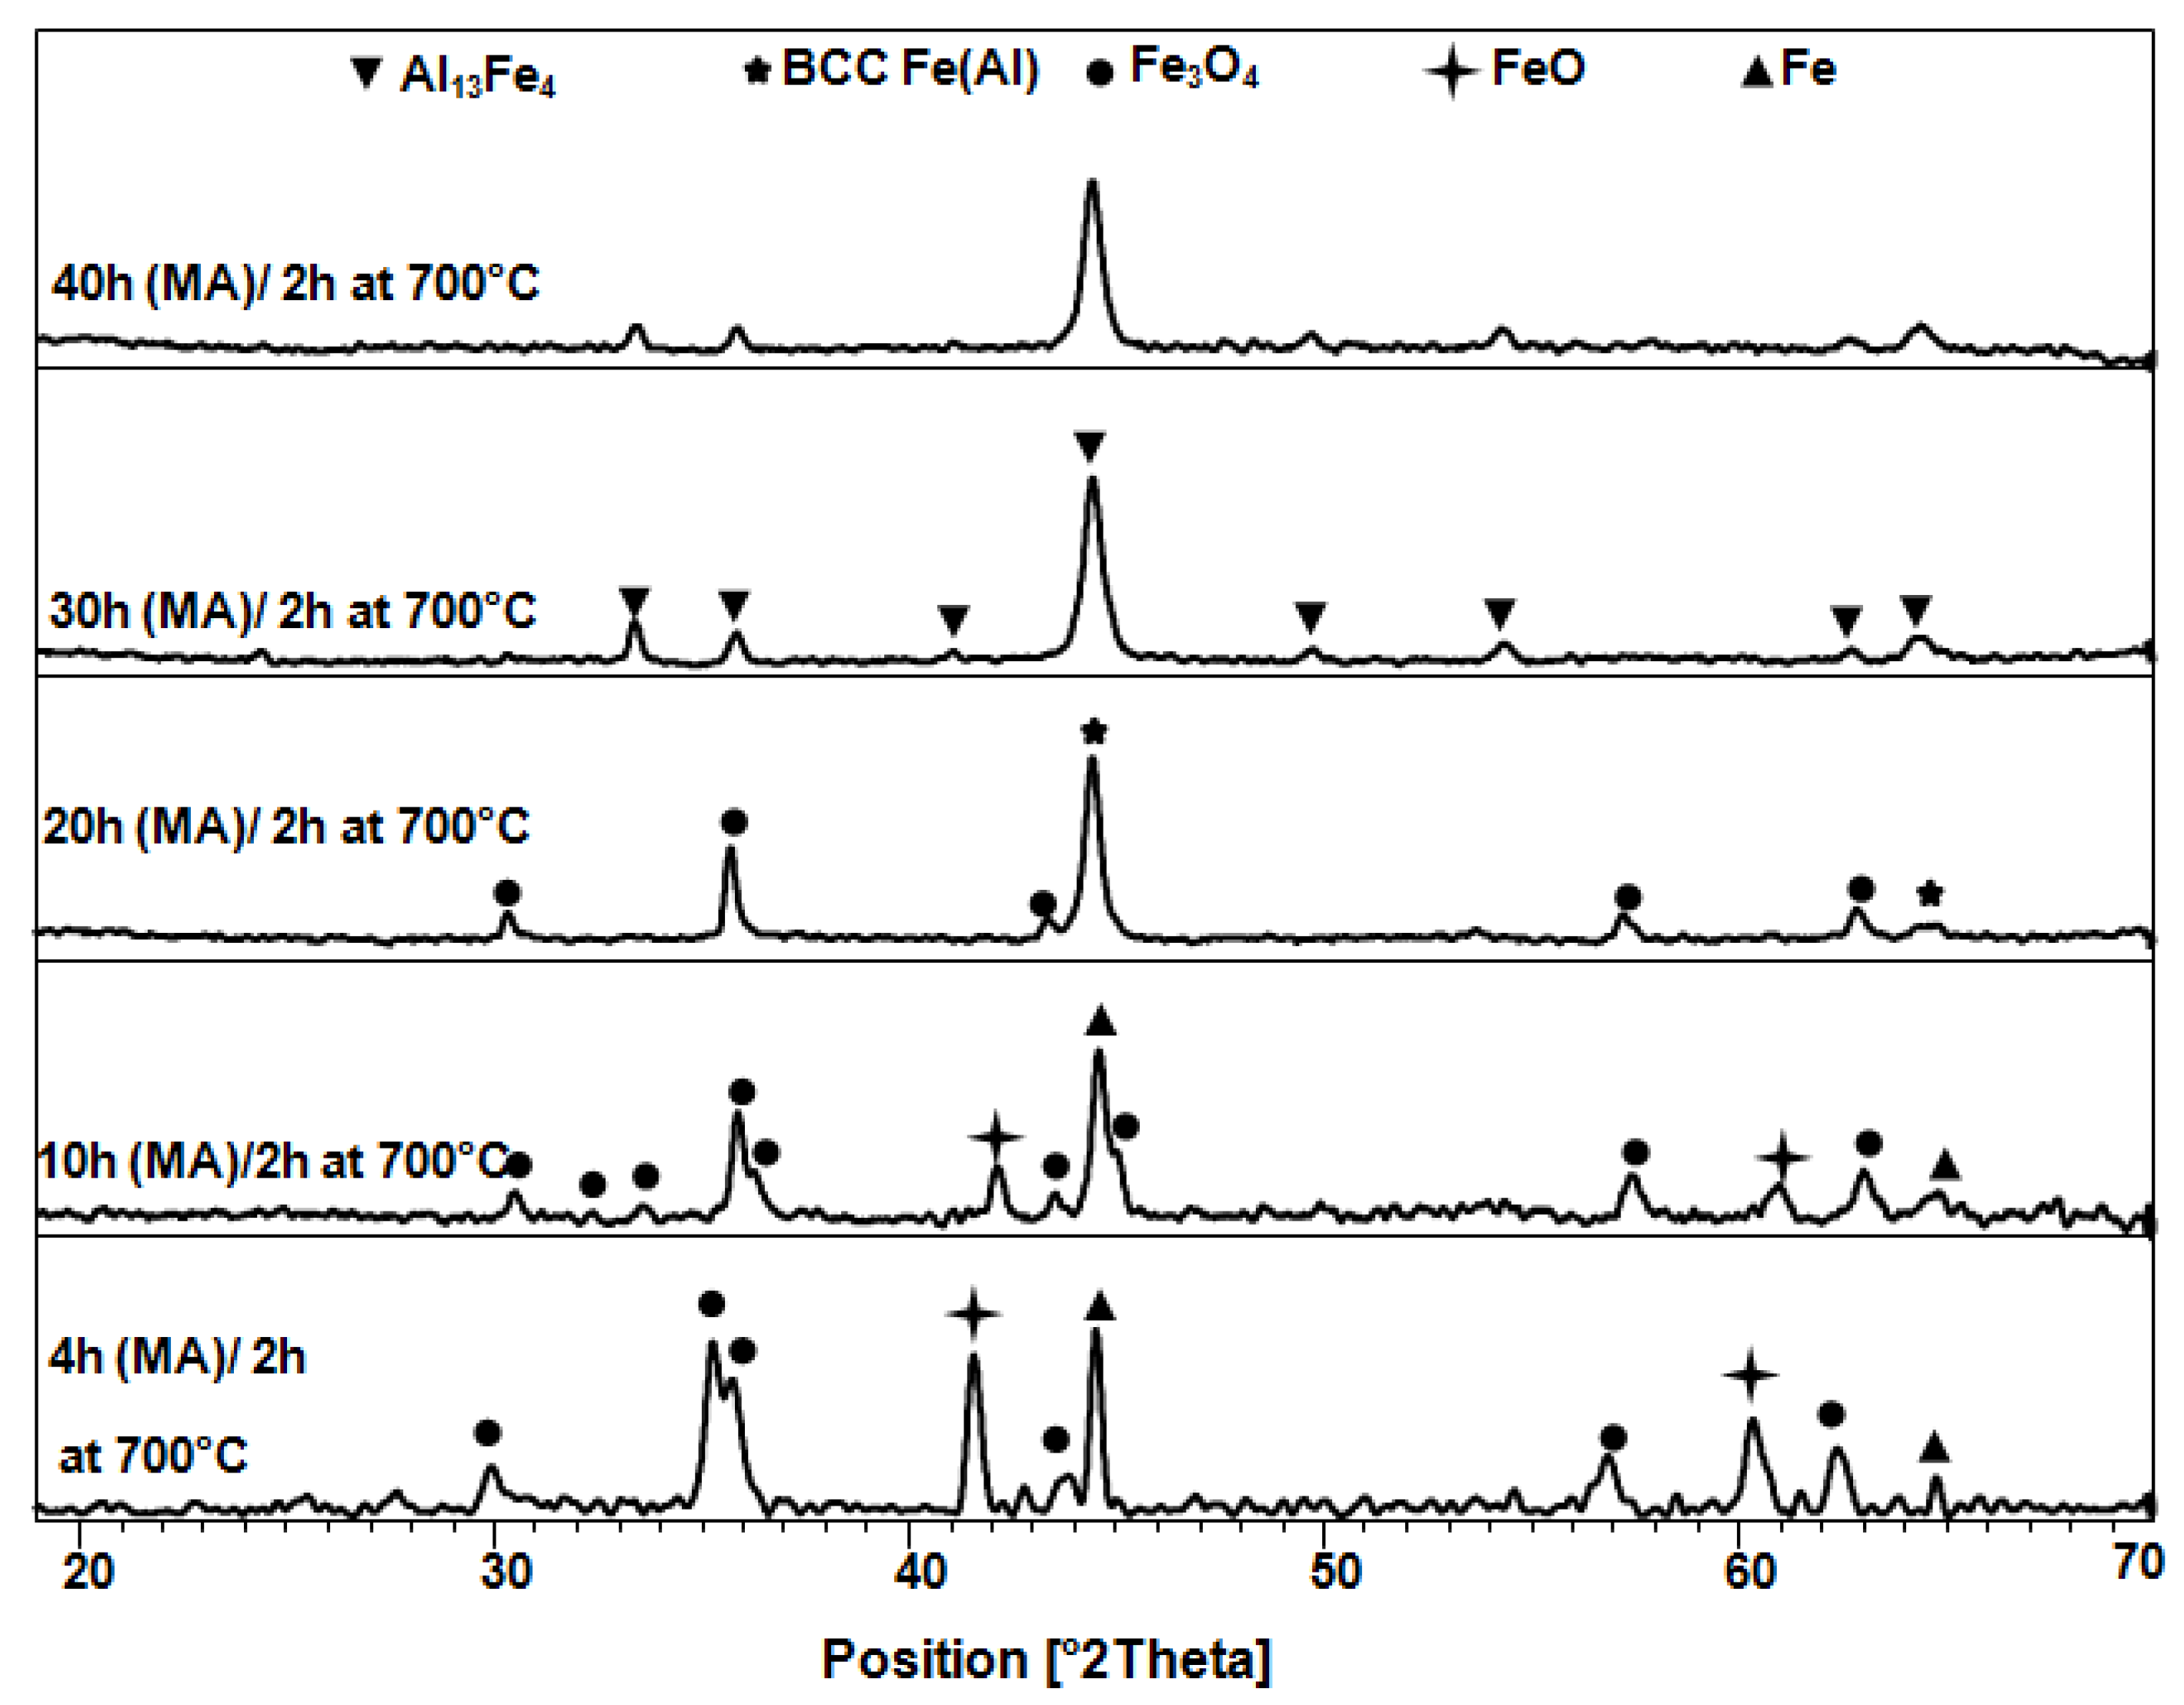
In order to understand more clearly the evolution of the exothermic transformations shown on the DSC trace during milling, the powder samples milled for 4, 10, 20, 30, and 40 h are annealed at 700 °C for 2 h and then analyzed by XRD to investigate the formed phases. The results confirm the formation of to Fe3Al and Al13Fe4 phases suggested in the interpretation of the DSC scans. The obtained XRD patterns are shown in Figure 9. The milled powders for 4 h show a small amount of FeO (Fm-3m, a = 4.33473 Å) [24] and Fe2O3 (Fd-3m, a = 8.55916 Å) [25] oxides formed after heating. In addition, good refinement of the XRD patterns identifies the presence of bcc-Fe3Al intermetallic (Im-3m; a = 2.87977(1) Å). The same phase has been detected in previous work [26]. The formation of iron oxide is associated with the oxygen that is adsorbed at the powder surface particles when exposed to air after heating. The same phases are identified for the milled powders after 10 and 20 h, indicating the ordering of the solid solution Fe(Al) to Fe3Al (Fm-3m, a = 2.8887 Å) [27]. The annealing of the milled powder for 30 h shows the appearance of the intermetallic phase Al13Fe4 (C2/m, a = 15.32 Å, b = 7.98 Å, c = 12.43 Å and β = 107.40) [28] with the presence of the Fe3Al intermetallic. The same results of refinement were determined for the milled powder for 40 h: the coexistence of the two intermetallic phases Fe3Al (Fm-3m, a = 2.8871 Å) and Al13Fe4 (C2/m, a = 15.312 (1) Å, b = 7.975(1) Å, c = 12.392 (1) Å and β = 107.42°).

3.3. Magnetic Analysis

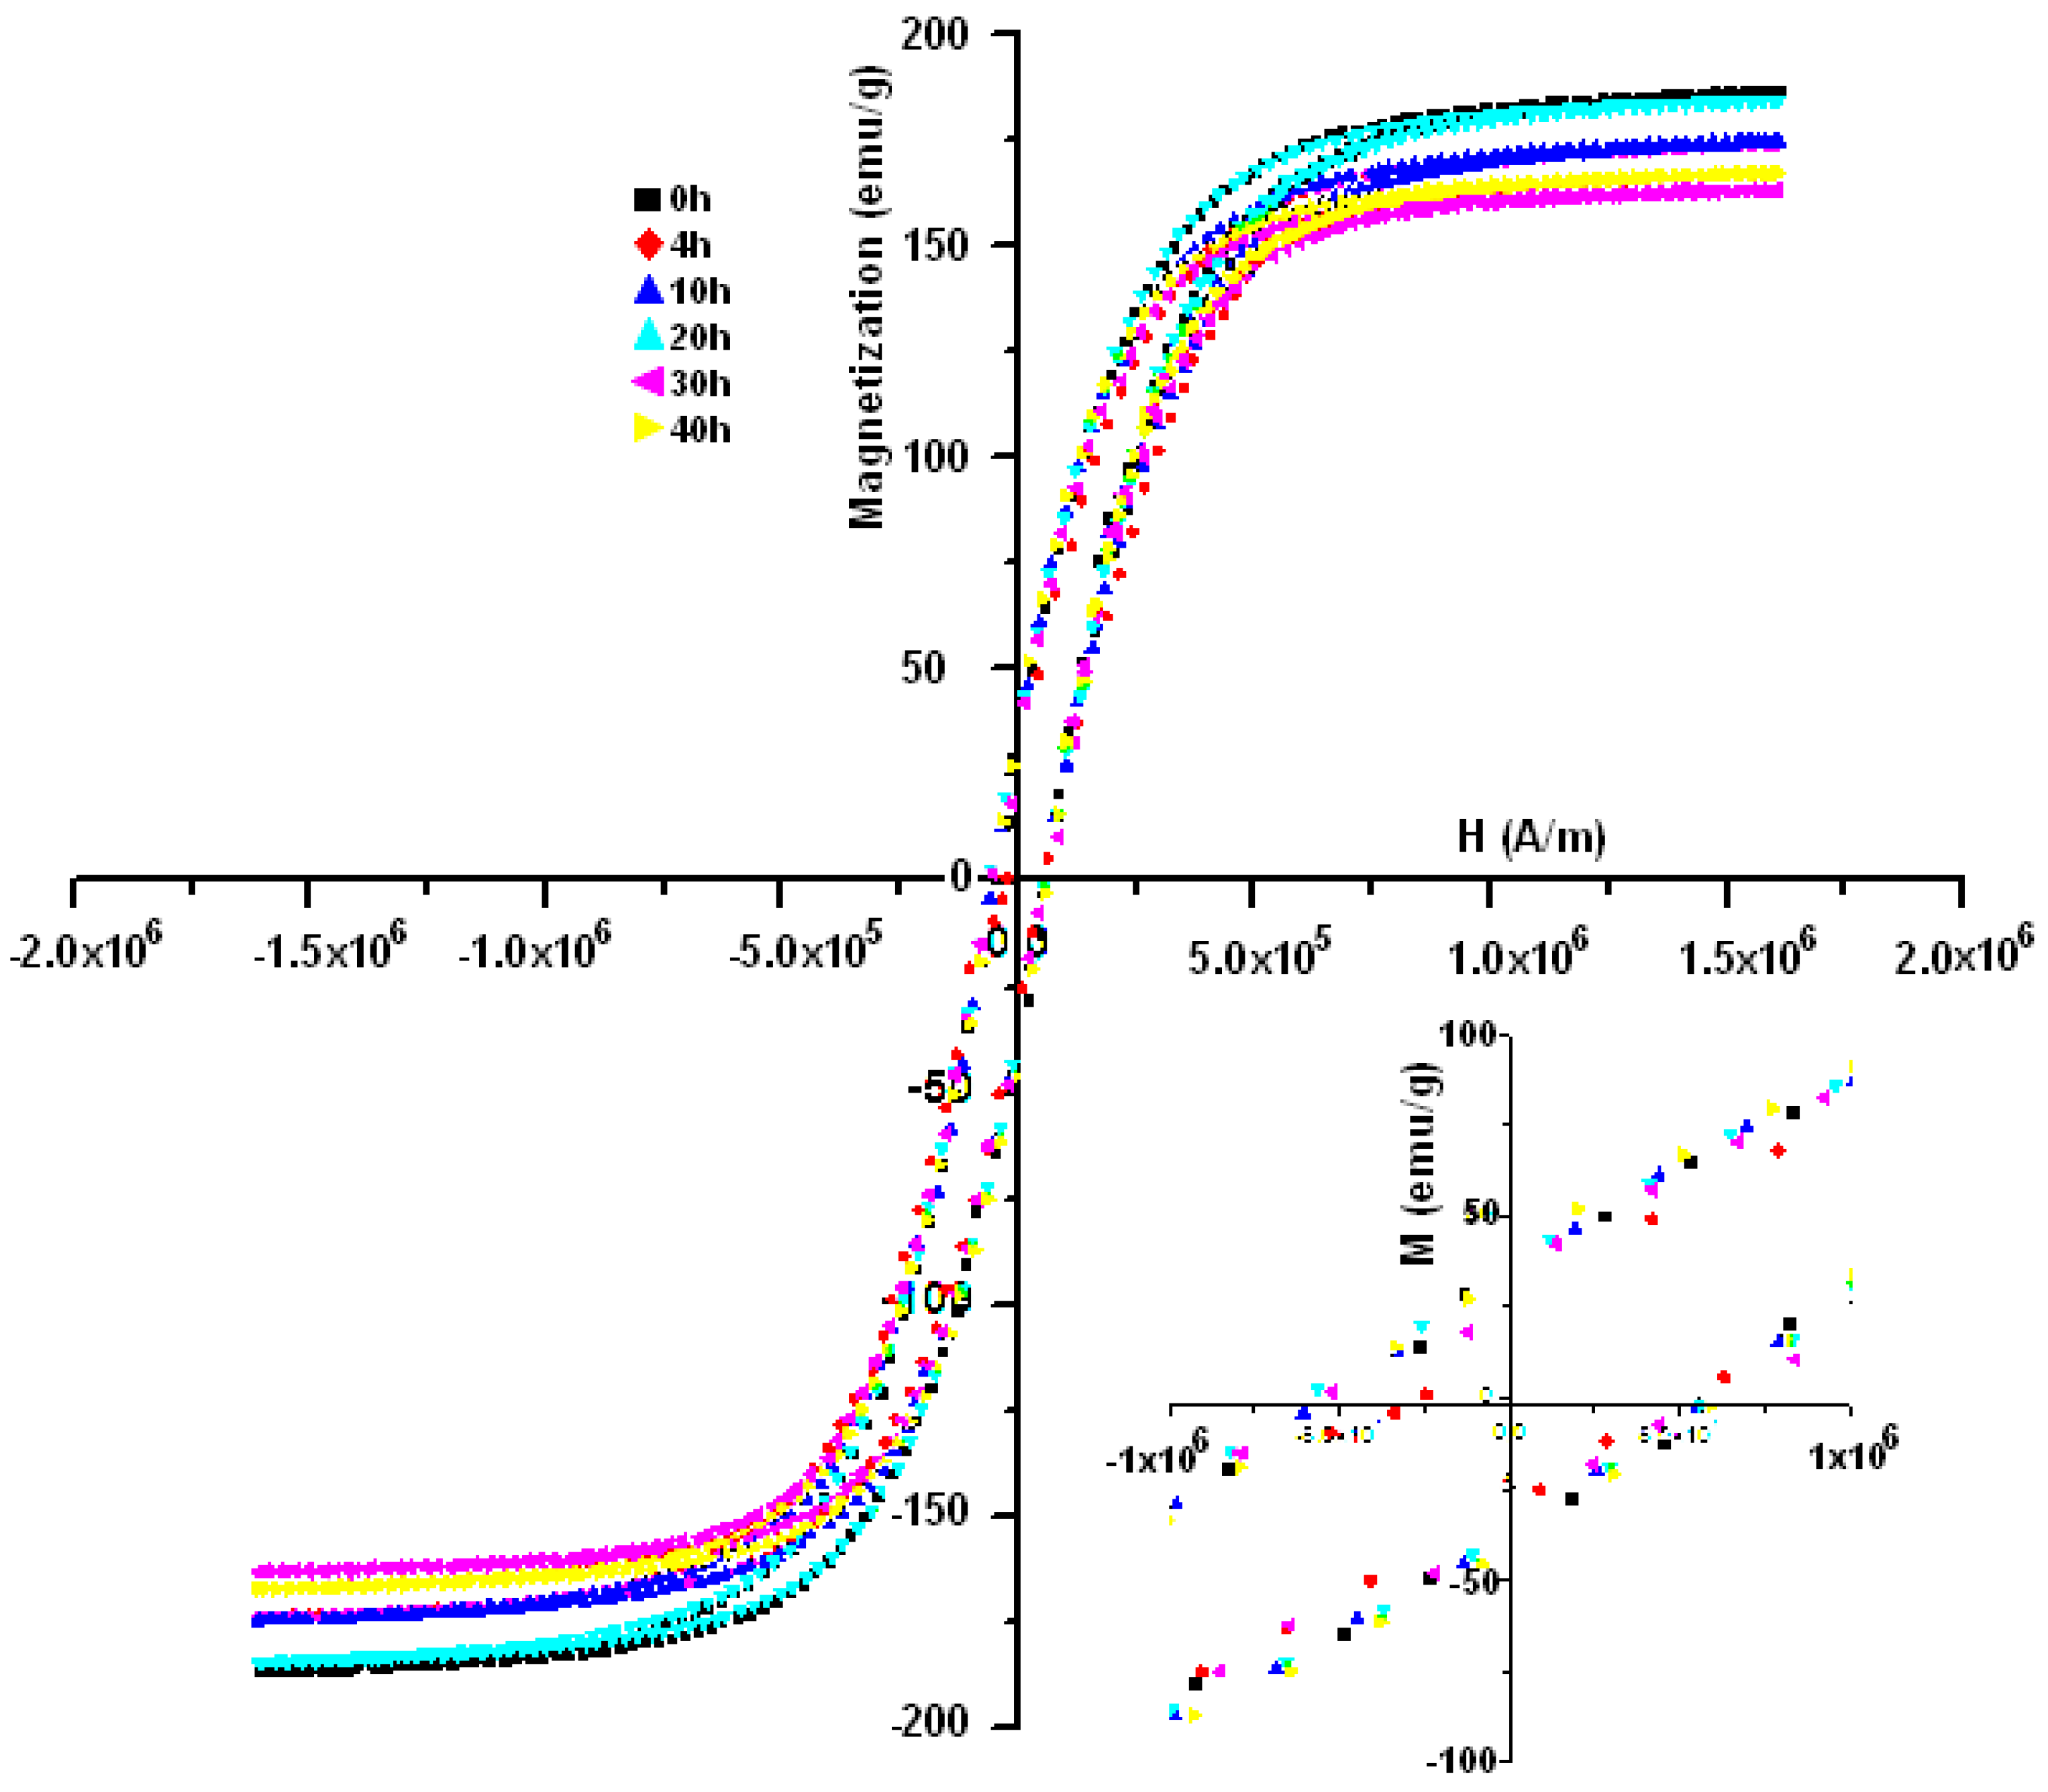
Figure 10 shows the milling time dependence of the hysteresis loops, recorded at room temperature, of the Fe-25at%Al samples. The milled powders exhibit a ferromagnetic behavior with sigmoidal hysteresis curves that are usually observed in nanostructured samples with small magnetic domains [29]. The magnetic properties remain partially stable with the independence of the Fe(Al) solid solution content as determined by XRD analysis. The same effect has been found in previous works [19,26]. Thus the formation of the Fe(Al) phase does not drastically affect magnetic behavior, and the main influence will be related to the Fe atoms’ local environment and to Fe-Fe interatomic distance. Likewise, it is known that the magnetic properties depend strongly on the microstructure evolution, internal stress, particle shape anisotropy, magnetic anisotropy, and the magnetostriction of the materials [30]. All the samples are hard ferromagnetic at room temperature with a value of coercivity, Hc, superior to 125 Oe for all powders (See Table 1 for values of the saturation magnetization and coercivity) [31].
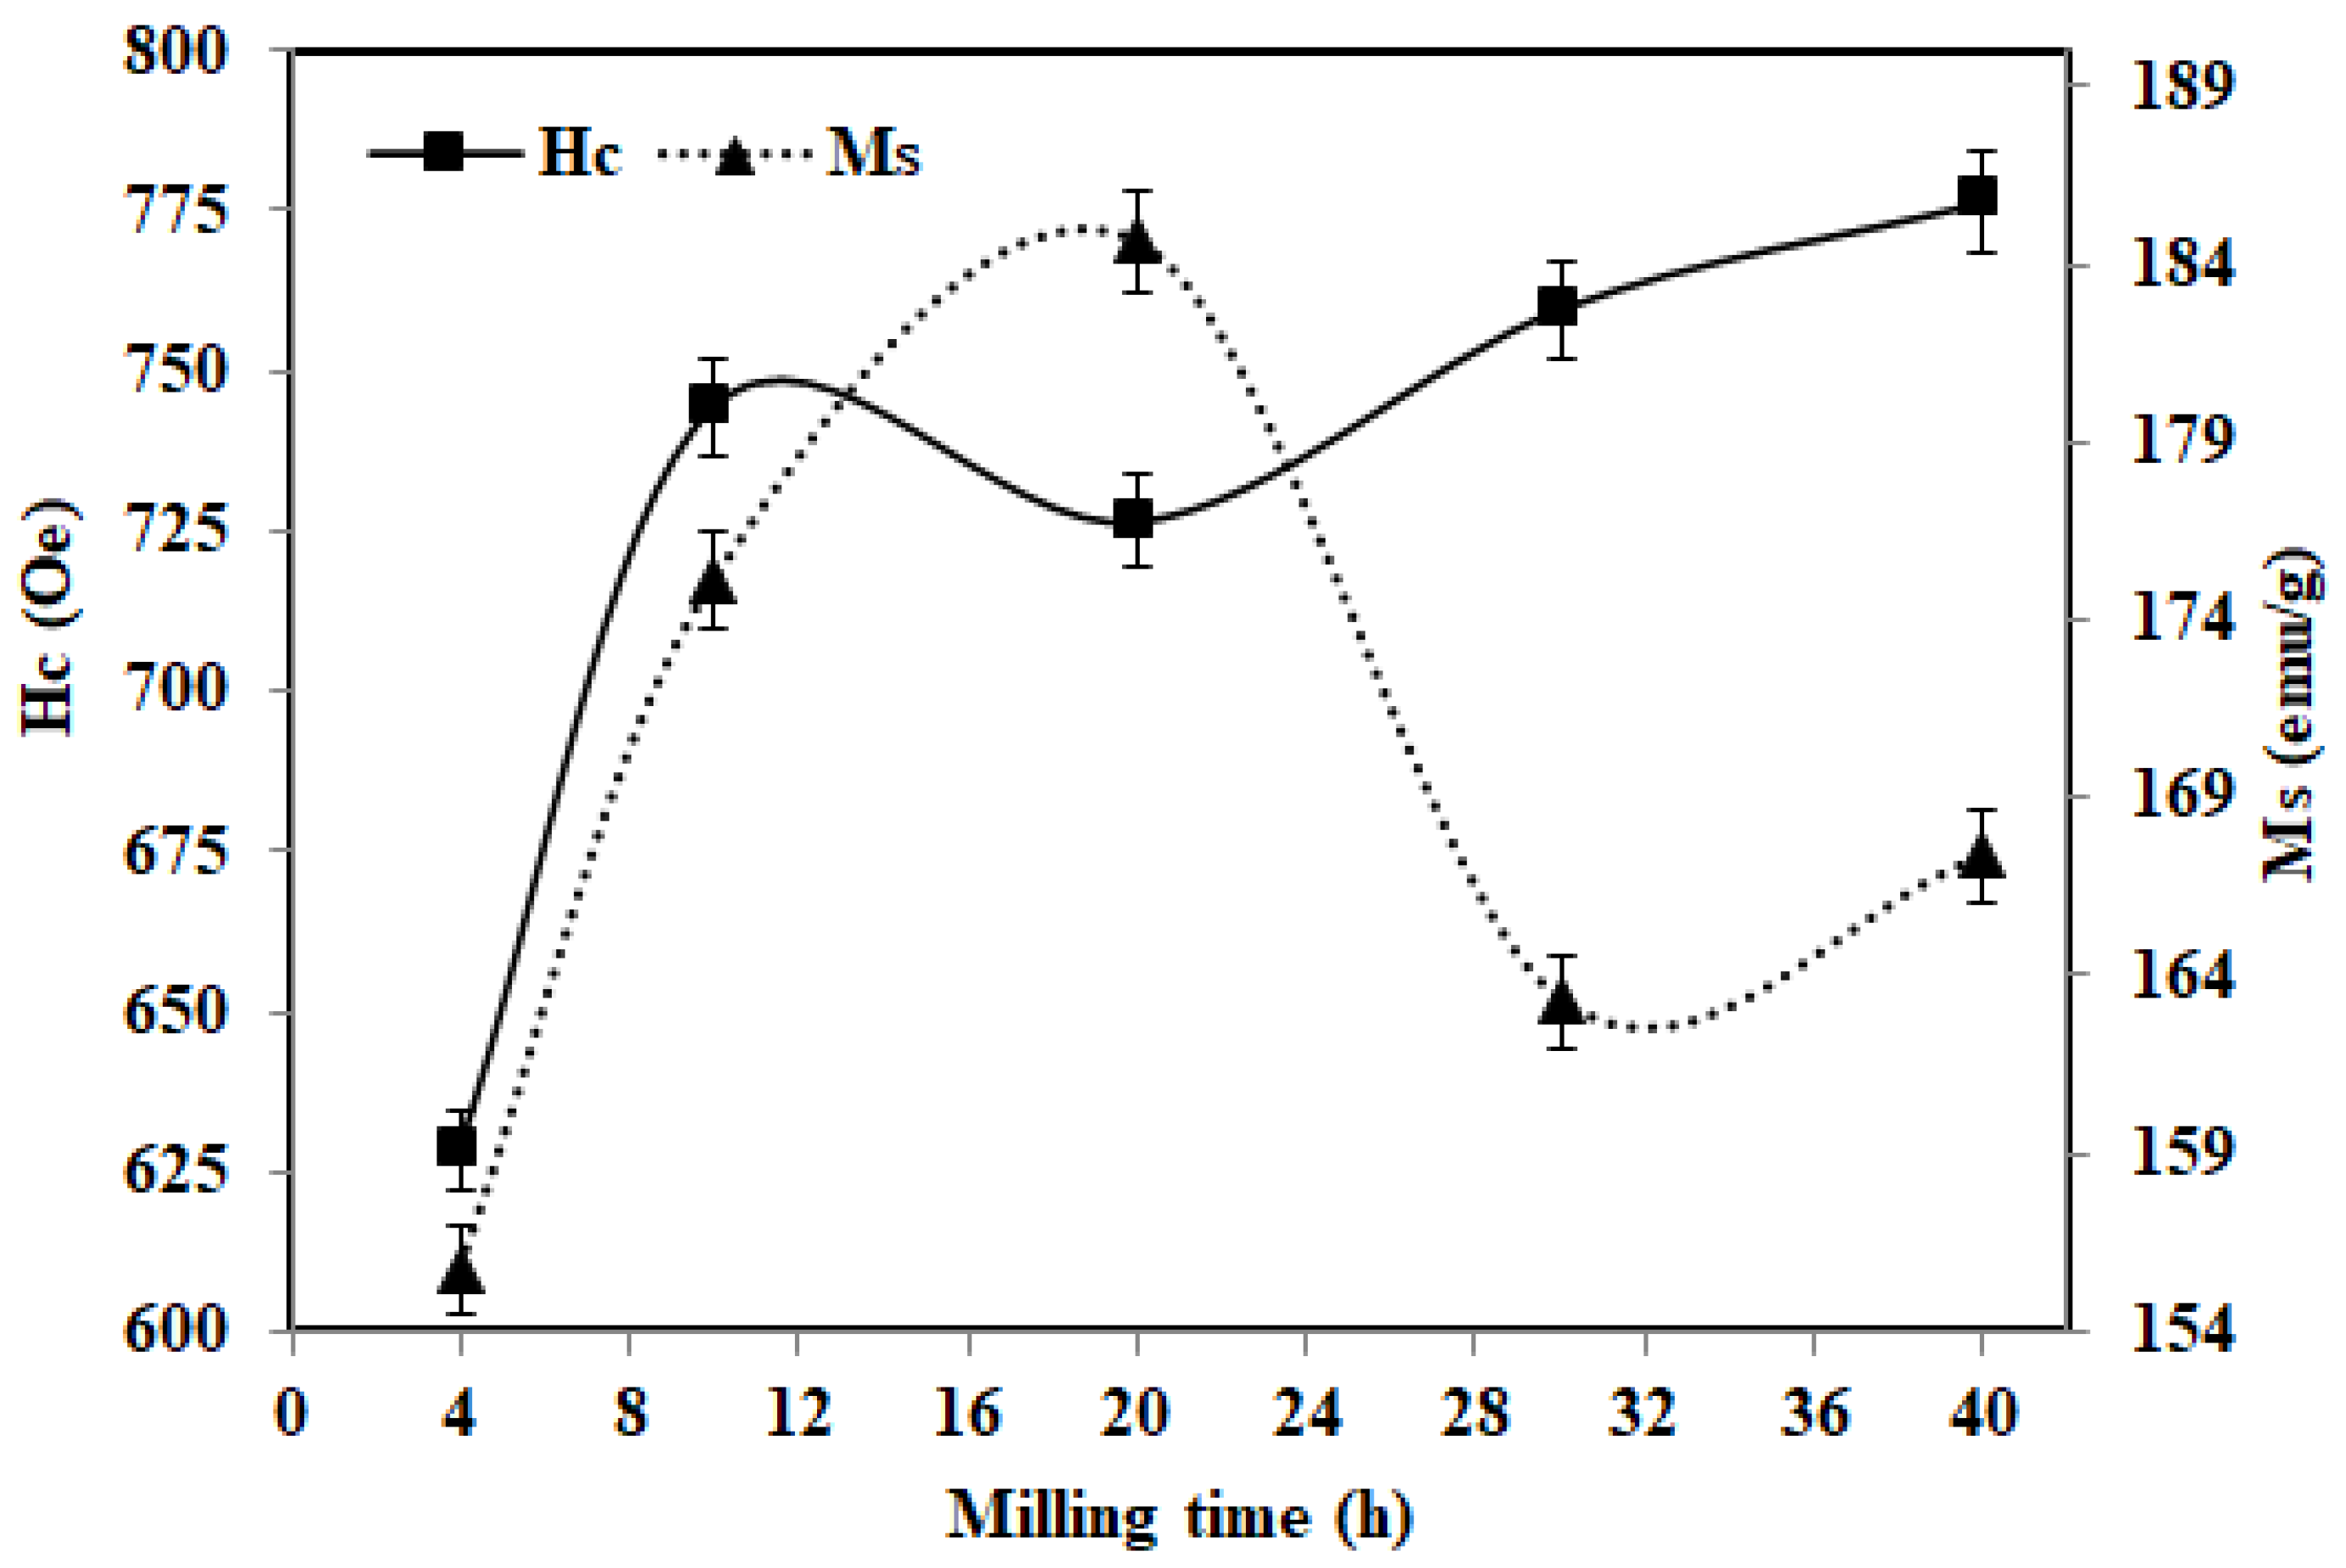
Initially, the Hc increases and attains a value of 744.44 Oe after 10 h of milling (Figure 11), and after 40 h reaches its maximum value of 776 Oe, all of the values were linked to soft–hard behavior. The increase in Hc originate from the residual stress and defects that are introduced during milling [30,32]. Then, the slight decrease after 10 h to the value of 726.4 Oe can be explained by the decrease in the magnetocrystalline anisotropy and stabilization of the crystallite size and lattice strains. At advanced milling times, the grain size is smaller than the magnetic exchange length. We applied the random anisotropy model, Hc depending on D6, because the domain wall effect diminishes, and each grain behaves as a single domain [33,34]. The Ms increased slightly from 155 emu/g to 175 emu/g during the first ten hours. Then, this parameter decreases to 163 emu/g after 20 h. Finally, the state observed at 40 h is with Ms around 167 emu/g. The slight increase in Ms during the first milling times can be attributed to the reaction between Al and Fe for the formation of the Fe(Al) solid solution. This is justified by the XRD pattern of the sample milled for 10 h. In addition, the decrease in Ms is mainly due to the interaction between the Fe atoms, ferromagnetic, and the Al atoms, non-ferromagnetic. The Al atoms decrease the magnetic moment of Fe individual sites due to a decrease in the direct interaction between ferromagnetic Fe-Fe sites and also an anti-ferromagnetic super-exchange interaction between the Fe sites mediated by Al atoms [35,36]. Ms increases beyond 20 h of milling; this can be attributed to the reduction in magnetocrystalline anisotropy due to grain refinement and the rotation of the domain walls that becomes easier. The crystallite sizes are in the nanometer range, and the magnetic grains still have a multi-domain structure. Thus, magnetism cannot be treated as single-domain particles with uniaxial anisotropy by neglecting the influence of magnetic walls [33]. As a consequence, the squareness ratio (Mr/Ms) of these samples is lower than 0.1.

4. Conclusions

A nanocrystalline bcc-Fe(Al) solid solution powder with a crystallite of about 10 nm has been synthesized from the mixture of Fe and Al elemental powders by the high-energy mechanical alloying process for 40 h.
At the early stage of the MA process, three phases, namely, Fe, Al, and Fe(Al), coexist in the milled powder. By increasing the milling time to 20 h, the Al peaks disappeared progressively, suggesting the progressive dissolution of Al in the Fe lattice.
The single phase of bcc-Fe(Al) was formed after the milling time exceeded 20 h. This obtained solid solution is not ordered due to atomic displacement and lattice defects (the dislocation density is around 1 × 10⁻¹⁶ m−2). After annealing at 700 °C for 2 h, ordered Fe3Al, and Al13Fe4 intermetallic are identified.
The DSC curves analysis identifies several overlapping broad exothermic peaks, related to the restoration and rearrangement of defects introduced followed by the recrystallization and the formation of ordered Fe3Al and Al13Fe4 intermetallic.
From the magnetic point of view, there is a correspondence between microstructural evolution and magnetic behavior in the form that decreasing the crystallite size increases coercivity. As a result, a harder ferromagnetic material is obtained.

Author Contributions

Conceptualization, M.K. and J.-J.S.; formal analysis, H.I.G. and M.A.; data curation, M.A.; writing—original draft preparation, M.A. and H.I.G.; writing—review and editing, J.D. and J.-J.S.; supervision—M.K. and J.-J.S. All authors have read and agreed to the published version of the manuscript.

Funding

This research received no external funding.

Institutional Review Board Statement

It is not necessary. This research does not involve humans or animals.

Informed Consent Statement

It is not mandatory/necessary in this research.

Data Availability Statement

Data will be requested to the authors.

Conflicts of Interest

The authors declare no conflict of interest.

References

  1. Stoloff, N.S. Iron aluminides: Present status and future prospects. Mater. Sci. Eng. 1998, A258, 1–14. [Google Scholar] [CrossRef]
  2. Deevi, S.C. Advanced intermetallic iron aluminide coatings for high-temperature application. Prog. Mater. Sci. 2021, 118, 100769. [Google Scholar] [CrossRef]
  3. Durga, P.V.; Nagini, N.; Reddy, A.V.; Bakshi, S.R.; Vijay, R. Effect of grain structure and nano oxide dispersoids on improved strength and ductility of iron aluminide based intermetallics. Metall. Mater. Trans. A Phys. Metall. Mater. Sci. 2022, 53, 1597–1603. [Google Scholar] [CrossRef]
  4. Eggersmann, M.; Mehrer, H. Diffusion in intermetallic phases of the FeAl system. Philos. Mag. 2000, A80, 1219–1244. [Google Scholar] [CrossRef]
  5. Tortorelli, P.F.; DeVan, J.H. Behavior of iron aluminides in oxidizing and oxidizing/sulfidizing environments. Mater. Sci. Eng. 1992, A153, 573–577. [Google Scholar] [CrossRef]
  6. Nair, V.R.; Maiyalagan, T.; Shendage, S.S. Halloysite clay nanotubes with Fe-Al deposits for the oxidation of benzil alcohol. New J. Chem. 2022, 46, 17213–17222. [Google Scholar] [CrossRef]
  7. Zagrebin, M.A.; Matyunina, M.V.; Koshkin, A.B.; Sokolovskiy, V.V.; Sokolovskiy, V.V.; Buchelnikov, V.D.; Vasiliy, D. Structural and magnetic properties of Fer-Al alloys: Ab initio studies. J. Magn. Magnntic Mater. 2022, 557, 169437. [Google Scholar] [CrossRef]
  8. Bormio-Nunes, C.; Dias, M.B.; Ghivelder, L. High magnetostriction of the polycrystalline alloy (Fe0. 8Al0. 2) 97B3. J. Alloy. Compd. 2003, 574, 467–471. [Google Scholar] [CrossRef]
  9. Han, Y.; Kong, F.L.; Han, F.F.; Inoue, A.; Zhu, S.L.; Shalaan, E.; Al-Marzouki, F. New Fe-based soft magnetic amorphous alloys with high saturation magnetization and good corrosion resistance for dust core application. Intermetallics 2016, 76, 18–25. [Google Scholar] [CrossRef]
  10. Avar, B. Structural, thermal and magnetic characterization of nanocrystalline Co65Ti25W5B5 powders prepared by mechanical alloying. J. Non-Cryst. Solids 2016, 432 Pt B, 246–253. [Google Scholar] [CrossRef]
  11. Louidi, S.; Bentayeb, F.Z.; Sunol, J.J.; Escoda, L. Formation study of the ball-milled Cr20Co80 alloy. J. Alloy. Compd. 2010, 493, 110–115. [Google Scholar] [CrossRef]
  12. Noyan, I.C.; Cohen, J.B.; Springer-Verlag New York Inc. Residual Stress Measurement by Diffraction and Interpretation; Ilschner, B., Grant, N.J., Eds.; Springer Series on Materials Research and Engineering; Springer-Verlag: New York, NY, USA; Berlin/Heidelberg, Germany; London, UK; Paris, France; Tokyo, Japan, 1987; 276 Seiten, 160 Bilder, 31 Tabellen, DM 138; ISBN 3-540-96378-2. [Google Scholar]
  13. Williamson, G.K.; Smallman, R.E. Dislocation densities in some annealed and cold-worked metals from measurements on the X-ray Debye-Scherrer spectrum. Phil. Mag. 1956, 1, 34. [Google Scholar] [CrossRef]
  14. Mhadhbi, M.; Khitouni, M.; Escoda, L.; Suñol, J.J.; Dammak, M. Characterization of Mechanically Alloyed Nanocrystalline Fe(Al): Crystallite Size and Dislocation Density. J. Nanomater. 2010, 2010, 712407. [Google Scholar] [CrossRef] [Green Version]
  15. Srivastava, Y.; Srivastava, S. Preparation and properties of Cobalt-based soft magnetic material prepared by novel powder metallurgy. J. Magn. Magn. Mater. 2017, 423, 267–274. [Google Scholar] [CrossRef]
  16. Morris-Munoz, M.A.; Dodge, A.; Morris, D.G. Structure, strength and toughness of nanocrystalline FeAl. Nano Struct. Mater. 1999, 11, 873–885. [Google Scholar] [CrossRef]
  17. Krasnowski, M.; Grabias, A.; Kulik, T. Phase transformations during mechanical alloying of Fe–50% Al and subsequent heating of the milling product. J. Alloy. Compd. 2006, 424, 19–127. [Google Scholar] [CrossRef]
  18. Shi, H.; Guo, D.; Ouyang, Y. Structural evolution of mechanically alloyed nanocrystalline FeAl intermetallics. J. Alloy. Compd. 2008, 455, 207–209. [Google Scholar] [CrossRef]
  19. Mhadhbi, M.; Khitouni, M.; Escoda, L.; Sunol, J.J.; Dammak, M. Microstructure evolution and mechanical properties of nanocrystalline FeAl obtained by mechanical alloying and cold consolidation. J. Alloy. Compd. 2011, 509, 3293–3298. [Google Scholar] [CrossRef]
  20. Ikeda, O.; Onuma, I.; Kainuma, R.; Ishida, K. Phase equilibria and stability of ordered BCC phases in the Fe-rich portion of the Fe–Al system. Intermetallics 2001, 9, 755–761. [Google Scholar] [CrossRef]
  21. Bonetti, E.; Scipione, G.; Valdrf, G.; Enzo, S.; Frattini, R.; Macri, P.P. A study of nanocrystalline iron and aluminium metals and Fe3Al intermetallic by mechanical alloying. J. Mater. Sci. 1995, 30, 2220–2226. [Google Scholar] [CrossRef]
  22. Zhou, F.; Luck, R.; Scheffer, M.; Lang, D.; Lu, K. The crystallization process of amorphous Al80Fe20 alloy powders prepared by ball milling. J. Non-Cryst. Solids 1999, 250, 704–708. [Google Scholar] [CrossRef] [Green Version]
  23. Guillemany, J.M.; Cinca, N.; Casas, L.; Molins, E. Ordering and disordering processes in MA and MM intermetallic iron aluminide powders. J. Mater. Sci. 2009, 44, 2152–2161. [Google Scholar] [CrossRef]
  24. Jette, E.R.; Foote, F. An X-ray Study of the Wüstite (FeO) solid solutions. J. Chem. Phys. 1933, 1, 29. [Google Scholar] [CrossRef]
  25. Hanawalt, J.D.; Rinn, H.W.; Frevel, L.K. Chemical Analysis by X-ray Diffraction. Anal. Chem. 1938, 10, 475. [Google Scholar] [CrossRef]
  26. Ibn Gharsallah, H.; Sehri, A.; Aabou, M.; Escoda, L.; Sunol, J.J.; Khitouni, M. Structural and Thermal Study of Nanocrystalline Fe-Al-B Alloy Prepared by Mechanical Alloying. Metall. Mater. Trans. A 2015, 46, 3696–3704. [Google Scholar] [CrossRef]
  27. Popiel, E.; Tuszynski, M.; Zarek, W.; Rendecki, T. Investigation of Fe3−xVxAl alloys with DO3 type structure by X-ray, magnetostatic and Mössbauer effect methods. J. Less-Common Met. 1989, 146, 127. [Google Scholar] [CrossRef]
  28. Ellner, M.; Mayer, J. X-ray and electron diffraction investigations on the liquid-quenched Fe2Al5. Scripta Metall. Mater. 1992, 26, 501. [Google Scholar] [CrossRef]
  29. Nowroozi, M.A.; Shokrollahi, H. The effects of milling time and heat treatment on the micro-structural and magnetic behavior of Fe42Ni28Zr8Ta2B10C10 synthesized by mechanical alloying. J. Magn. Magn. Mater. 2013, 335, 53–58. [Google Scholar] [CrossRef]
  30. Sharifati, A.; Sharafi, S. Structural and magnetic properties of nanostructured (Fe70Co30)100−xCux alloy prepared by high energy ball milling. Mater. Des. 2012, 41, 8–15. [Google Scholar] [CrossRef]
  31. Krifa, M.; Mhadhbi, M.; Escoda, L.; Saurina, J.; Suñol, J.J.; Llorca-Isern, N.; Artieda-Guzmán, C.; Khitouni, M. Phase transformations during mechanical alloying of Fe–30% Al–20% Cu. Powder Technol. 2013, 246, 117–124. [Google Scholar] [CrossRef]
  32. Chen, C.W. Magnetism and Metallurgy of Soft Magnetic Materials; Elsevier B.V.: Amsterdam, The Netherland, 1977. [Google Scholar]
  33. Herzer, G. Grain size dependence of coercivity and permeability in nanocrystalline ferromagnets. IEEE Trans. Magn. 1990, 26, 1397–1402. [Google Scholar] [CrossRef]
  34. Herzer, G. Nanocrystalline soft magnetic alloys. In Handbook of Magnetic Materials; Buschow, K.H.L., Ed.; Elsevier: Amsterdam, The Netherland, 1997; Volume 10, pp. 415–462. [Google Scholar]
  35. Pearson, W.B. Handbook of Lattice Spacing and Structures of Metals and Alloys; Pergamon: Oxford, UK, 1958. [Google Scholar]
  36. Krifa, M.; Mhadhbi, M.; Escoda, L.; Güell, J.M.; Suñol, J.J.; Llorca-Isern, N.; Artieda-Guzmán, C.; Khitouni, M. Nanocrystalline (Fe60Al40)80Cu20 alloy prepared by mechanical alloying. J. Alloy. Compd. 2013, 554, 51–58. [Google Scholar] [CrossRef]
Figure 1. XRD patterns of the Fe-25at%Al powder mixtures in the initial state and after milling at selected milling times.
Crystals 12 01430 g001
Figure 2. Evolution of phase proportions of the Fe-25at%Al powder mixtures refined as a function of milling time.
Crystals 12 01430 g002
Figure 3. SEM-micrographs of the Fe-25at%Al powder mixtures obtained before (0 h) (a1,a2), and after milling for 12 (b1,b2), 20 (c1,c2), and 40 h (d1,d2).
Crystals 12 01430 g003
Figure 4. EDS spectra of the Fe-25at%Al powder mixtures obtained after 12 h (a) and 40 h (b).
Crystals 12 01430 g004
Figure 5. Variations of crystallite size and lattice strains of the Fe-25at%Al powder mixtures as a function of milling time.
Crystals 12 01430 g005
Figure 6. Variations of lattice parameter and dislocation density of the Fe-25at%Al powder mixtures as a function of milling time.
Crystals 12 01430 g006
Figure 7. DSC curves of the Fe-25at%Al powder mixtures mechanically alloyed at selected times (the numbers correspond to the peaks detected in each sample).
Crystals 12 01430 g007
Figure 8. Typical examples of refined exothermic overlapped reactions in the case of the Fe-25at%Al powder mixtures mechanically alloyed at (a) 20 and (b) 40 h. Numbers correspond to processes explained in the main text.
Crystals 12 01430 g008
Figure 9. X-ray diffraction patterns of the mechanically alloyed Fe-25at%Al powder mixtures at selected milling times and annealed at 700 °C for 2 h.
Crystals 12 01430 g009
Figure 10. Typical hysteresis loops of the mechanically alloyed Fe-25at%Al powder mixtures at selected times obtained at room temperature.
Crystals 12 01430 g010
Figure 11. Variations of the saturation magnetization, Ms, and coercive field, Hc, of the Fe-25at%Al powder mixtures as a function of milling time.
Crystals 12 01430 g011
Table 1. Thermal and magnetic results of the Fe-25at%Al powder mixtures as a function of milling time.
Time (h)PeakT (°C)ΔH (Jg−1)Hc (Oe)Ms (emu/g)Mr (emu/g)
4(1)42375.91628.31155.2924.23
(2)70015.21
(3)65692.5
10(1)377144.5744.44175.336933.08
(2)552295.5
20(1)250155.5726.40184.093316.09
(2)38015.5
(3)40068.5
(4)550295.5
30(1)19516.86759.66163.3129.27
(2)37731.8
(3)575363
40(1)250135.6776.42167.3736.51
(2)40075.9
(3)46025.4
(4)56055.4
(5)600195.5
Publisher’s Note: MDPI stays neutral with regard to jurisdictional claims in published maps and institutional affiliations.