1. Introduction
Layered compounds, i.e., materials that show strong bonding in a plane and weak interaction between layers, are excellent candidates to produce 2D materials. Graphite is a perfect example of this kind of material. Graphene was the first one-atom-thick 2D material obtained. However, we have many examples of materials with weak interaction between layers that are not one-atom-thick, such as halides, chalcogenides, nitrides, carbides, hydrides, etc. Among them, we can find insulators, metals, semimetals, superconductors, and semiconductors. We should mention that the one-layer obtained from these materials is three-dimensional [
1,
2]. The name “ultra-thin 2D materials” is frequently used for them. They show a rhombohedral or hexagonal symmetry [
3,
4,
5]. Among these materials, the transition metal dichalcogenides have attracted much attention in the last few years.
In particular, among the known properties of 2D MoP2, it is frequently used in electrocatalytic hydrogen evolution [
6]. It is a super-hard material used as an abrasive and possible catalyst in crude oil hydroprocessing [
7]. As far as we know, there are no experimental reports on the 2D NbP
2. Thus, we do not know its properties. However, we found empirical work on the structure of bulk NbP
2 written slightly more than fifty-seven years ago [
8] that detailed the calculation of its electronic properties [
9]. We reported in previous work the energy band structure and optical properties of pristine 2D MoP
2 and 2D NbP
2 [
10].
Carbon dioxide and carbon monoxide are dangerous pollutant gases. CO2 is one of the main contributors to the greenhouse effect leading to climate change. The combustion of fossil fuels, fermentation, and the respiration of animals produce this pollutant. It is crucial to capture CO2 molecules from the atmosphere. On the other hand, carbon monoxide is produced mainly from the combustion of organic compounds, and often, CO intoxication is overlooked. It is colorless, tasteless, odorless, and very toxic.
We are interested in exploring new materials to adsorb pollutant molecules in this work. Thus, we explore the possibility of adsorbing carbon monoxide and carbon dioxide on the surface of 2D ultrathin materials such as MoP2 and NbP2 at atmospheric pressure and 300 K, using first-principles molecular dynamics (FPMD).
2. Materials and Methods
We performed our FPMD simulations using DFT with the Quantum ESPRESSO code [
11,
12]. For visualization, we utilized XCrySDen [
13]. We used the norm-conserving Troullier–Martins [
14] pseudopotentials with the Kleinman–Bylander form [
15] and the generalized gradient approximation (GGA) with the PBE approach [
16]. The cut-off in energy was 1300 eV. The threshold energy was 10
−7 eV, and we used the Monkhorst–Pack scheme [
17], with 40 k points. We considered atmospheric pressure and 300 K and used the velocity rescaling approach for temperature control.
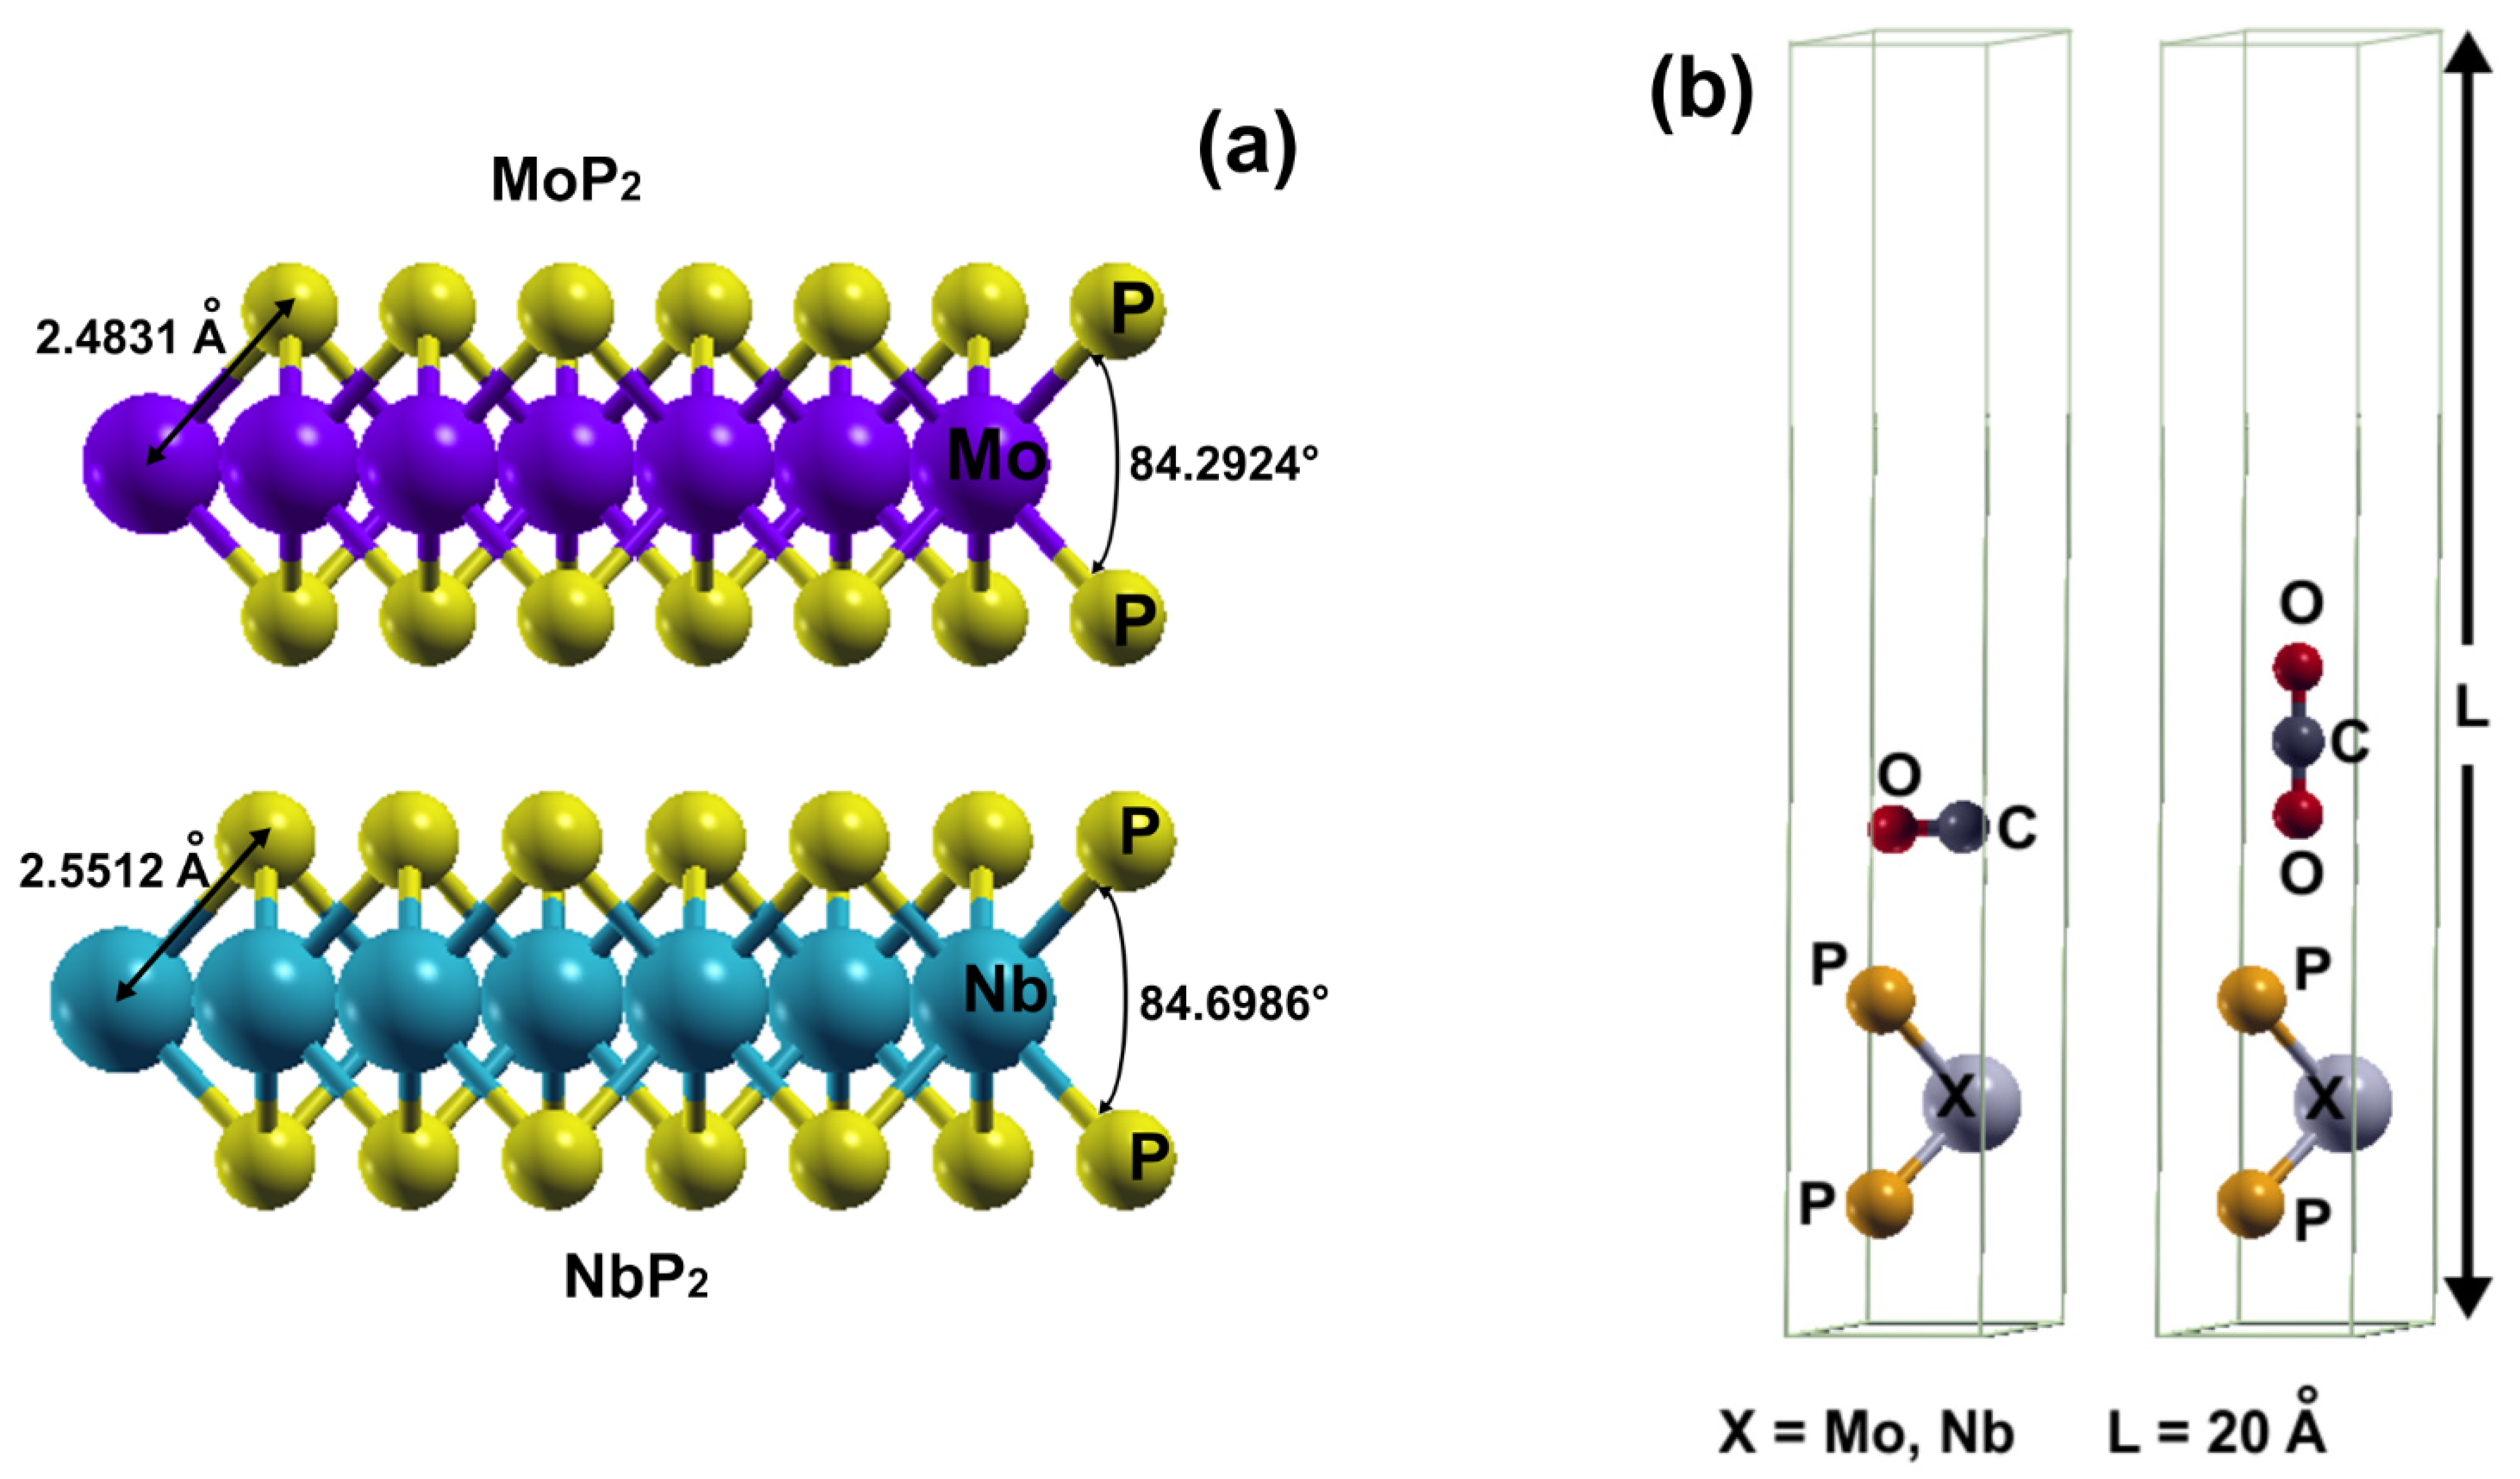
In
Figure 1a, we describe the systems we studied. We considered periodic boundary conditions, with the hexagonal unit cells shown in
Figure 1b. The unit cell contains three atoms plus the carbon monoxide or the carbon dioxide molecule. The size of the unit cell along the z-direction is
c = 20 Å, large enough to avoid spurious interactions among cells. The other dimensions are
a =
b = 3.19 Å. The angle between
a and
b is 120°, and
a and
b are orthogonal to
c.
For the adsorption energies, we used the following expression:
In Equation (1), Eads is the adsorption energy, E(surface + molecule) is the energy of the final configuration, E(surface) is the energy of the 2D material surface alone, and E(molecule) is the energy of the molecule alone. We calculated all these terms with our FPMD simulations.
We integrated the first Brillouin zone using the modified Bloch tetrahedron [
18] and calculated the energy band structure. Afterward, we obtained the dielectric tensor, and then we obtained the optical absorption and reflectivity.
Using the random phase approximation (RPA) [
19], in the limit of the linear optics, the imaginary part of the dielectric tensor is:
In Equation (2), Imεεβ refers to the imaginary part of the dielectric tensor. The Cartesian components of p that define the incident electric field’s polarization are α and β; ω is the frequency of the incident electromagnetic wave, m is the effective mass, and n is the electron density. The symbols ck and νk refer to wave functions corresponding to the conduction band and the valence band states, with crystal wave vector k. The Fermi distribution function for the state c is fc. Finally, we performed the sum of the transitions from occupied to unoccupied states over the first Brillouin zone, and we weighed the probability of a change.
Using Equation (2) and the Kramers–Kronig relations [
20], we obtained:
In Equation (3), Re
εεβ is the real part of the dielectric tensor; the symbol
P refers to taking the principal value of the integral. We considered the incidence of the electromagnetic wave perpendicular to the surface. In this manner, we obtained the reflectivity
Rii and absorption
Aii as follows:
Notice that
n and
k are the refractive index and extinction coefficient, respectively.
and
3. Results
We validated our selected pseudopotentials, calculating the bond lengths from the optimized systems. Thus, in the case of the pseudopotential for carbon and oxygen, we calculated an O-C-O angle of 179.9992° and a C-O bond length of 1.1708 Å in agreement with the experimental values of 1.1630 Å and 180°, respectively [
21]. For the pseudopotentials of Mo and P, we optimized the 2D MoP
2 and obtained 2.4835 Å for the bond length Mo-P. Given that there are no experimental reports of the 2D NbP
2, we validated the pseudopotential for Nb, calculating the Nb-S bond length for NbS
2; we obtained 2.4473 Å that agrees well with the experimental value of 2.4732 Å [
22].
We present the optimization results of MoP
2 and NbP
2 in
Figure 1a.
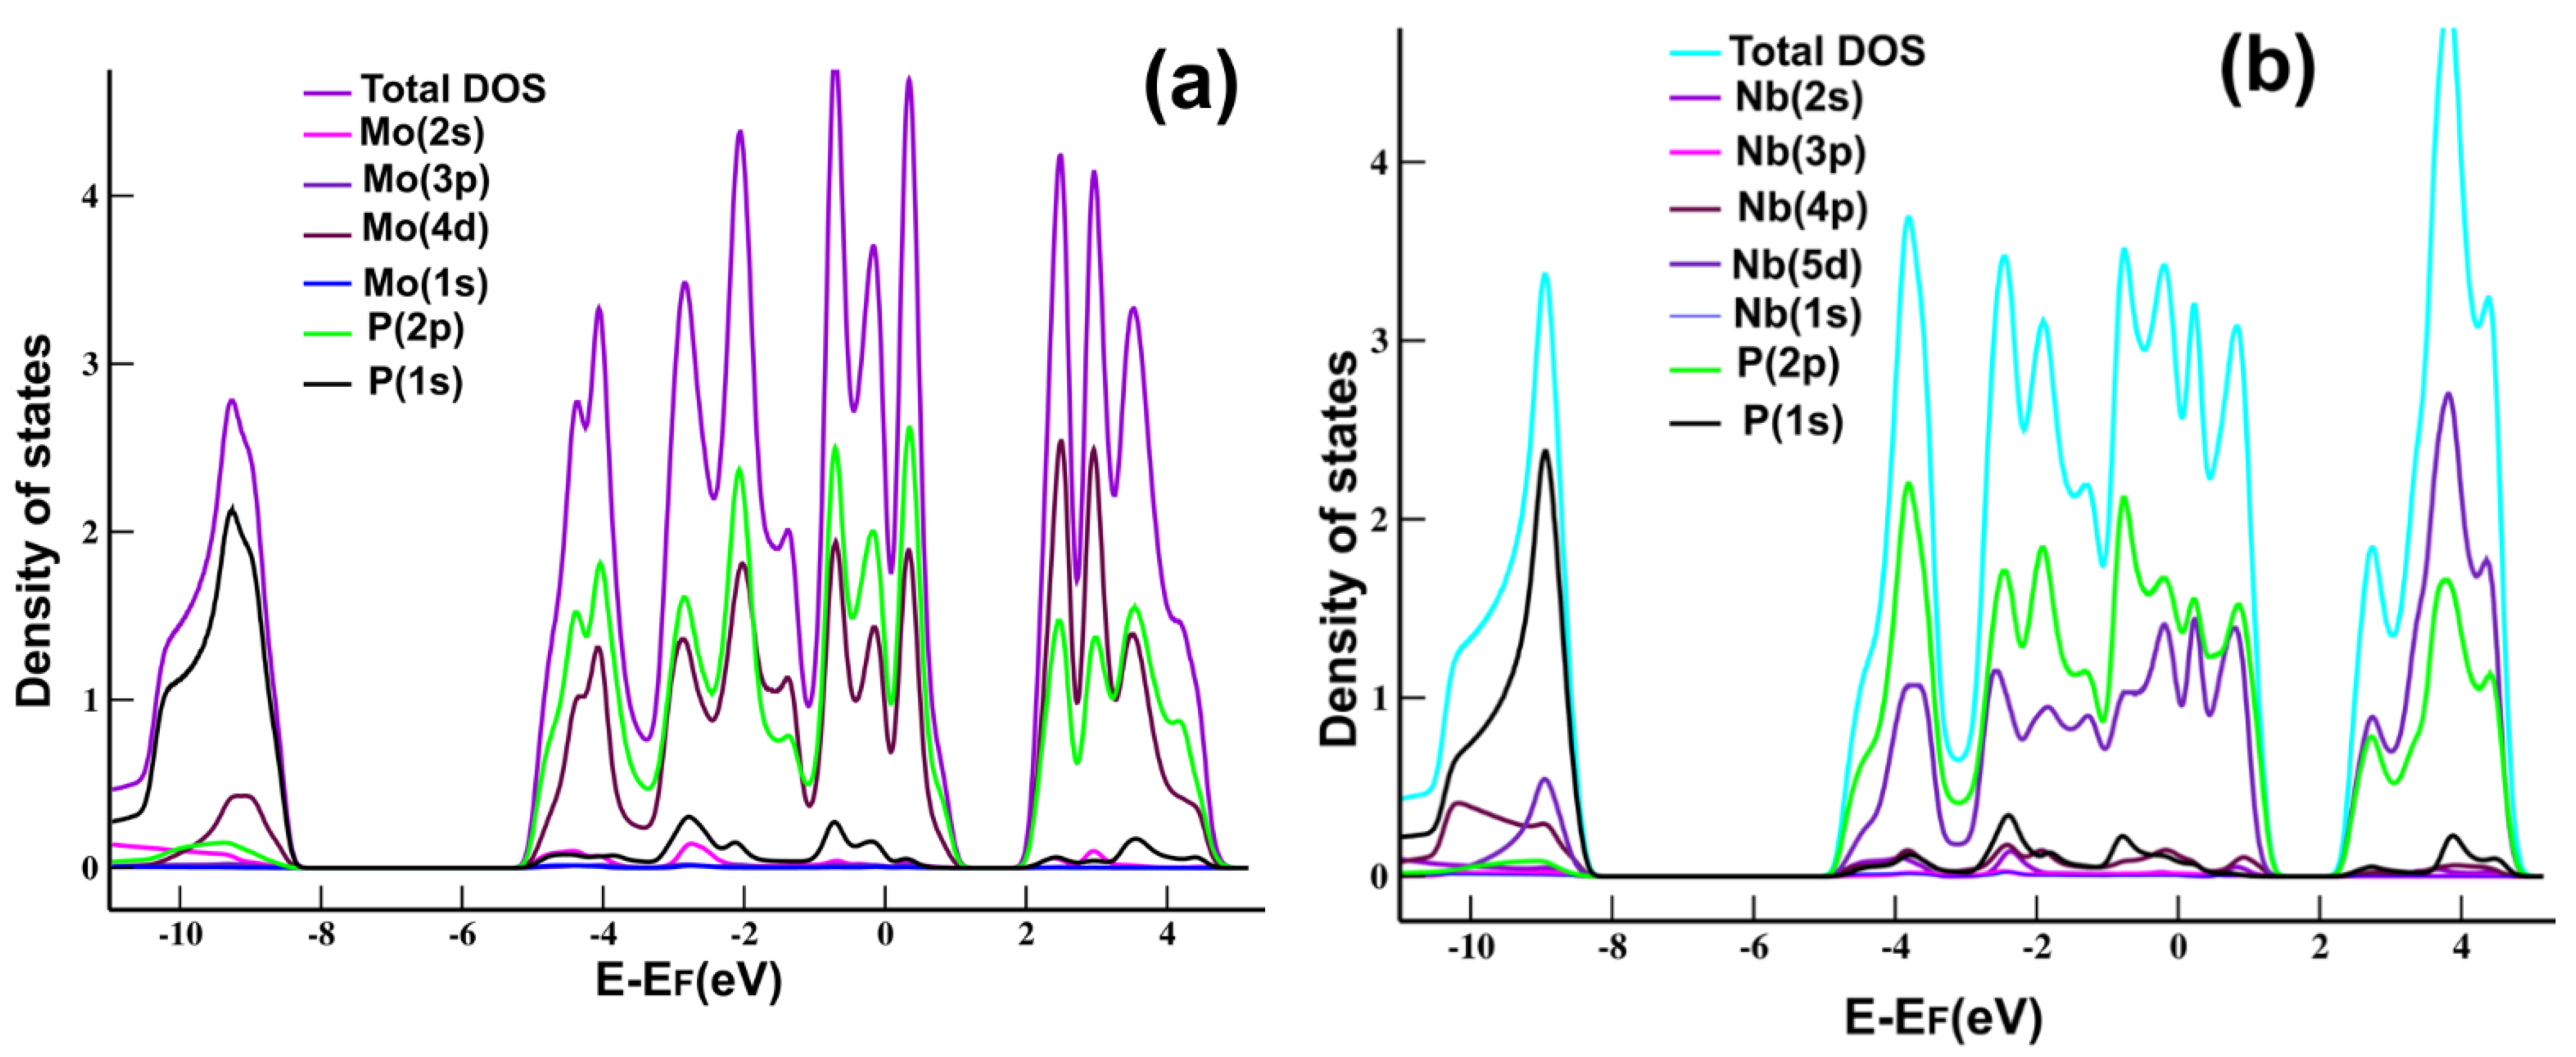
Figure 2a shows the projected density of states (PDOS) and the total density of states (DOS) for MoP
2. We can see the hybridization of states
s and
p of Mo and P, typical in graphene and other 2D materials.
Figure 2b shows the PDOS for NbP
2, where we notice the hybridization of states
s and
p of Nb and P, again, as we have in MoP
2, graphene, and many other 2D materials.
3.1. Interaction of CO and CO2 at 300 K
We performed FPMD simulations at atmospheric pressure and 300 K to cause the interaction of carbon monoxide and carbon dioxide with MoP
2 and NbP
2. We started with the unit cells shown in
Figure 1b; in each case, the initial distance of the oxygen atom to the phosphorus atom on the upper plane was 2.7800 Å. We showed that neither MoP
2 nor NbP
2 adsorbed the carbon dioxide molecule. In contrast, the carbon monoxide molecule was adsorbed by NbP
2 and MoP
2.
3.1.1. Carbon Monoxide Absorption on MoP2
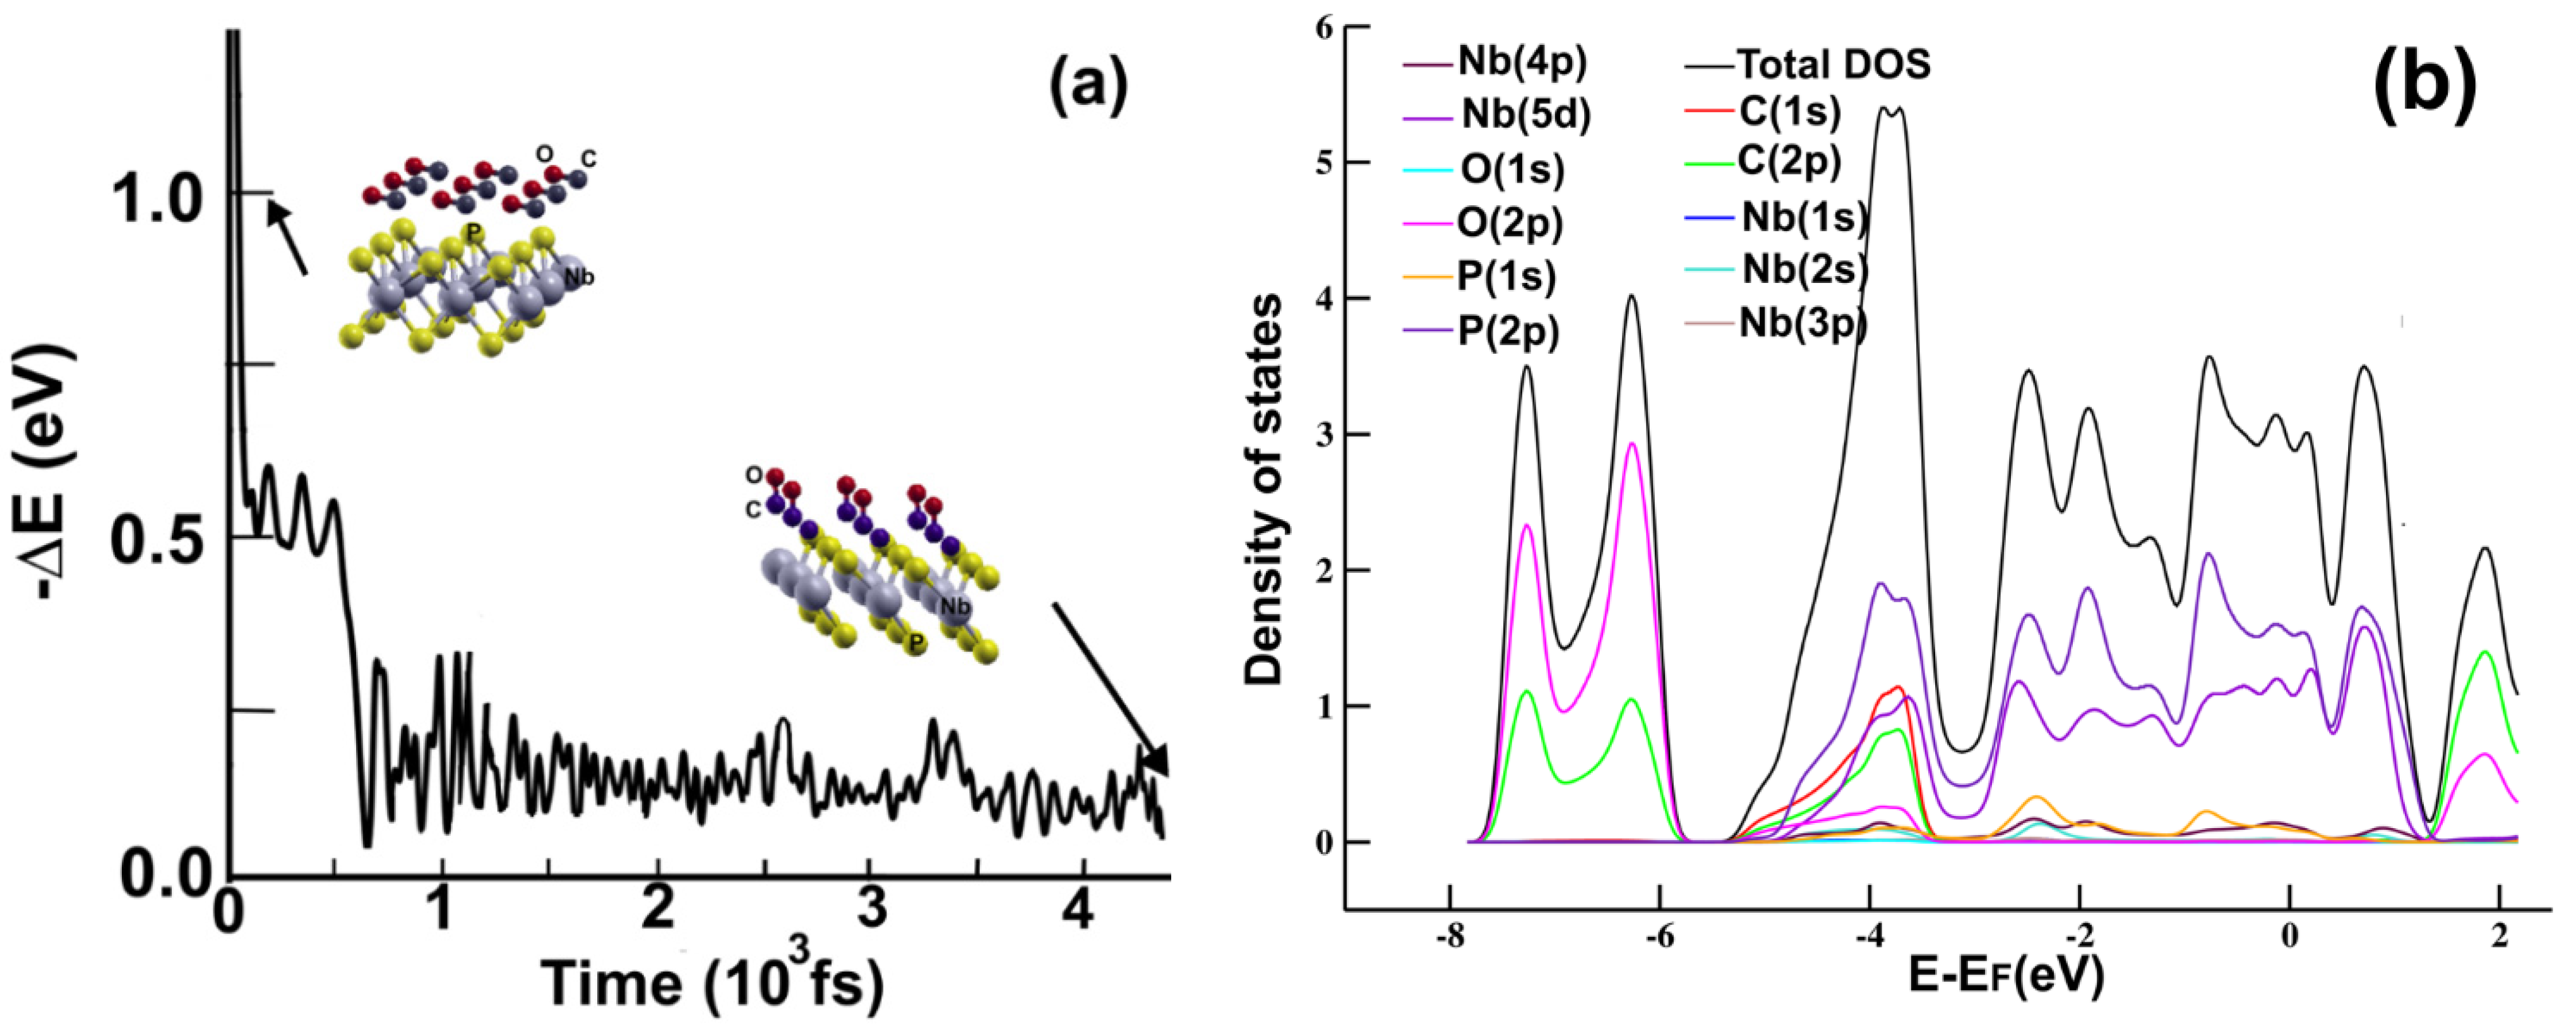
We should mention that the total time we took in our calculation was 4.5 ps. After 2.0 ps, the tendency of the energy evolution remained practically the same. Thus, the process reached statistical equilibrium before 2.2 ps. In
Figure 3a, we show the result of the FPMD calculation for the time evolution of the system’s energy for 4500 fs. We showed that the surface adsorbed the molecule with an adsorption energy of −0.9398 eV. The final distance from the carbon atom to the phosphorous atom of the upper plane is 1.3622 Å. We performed a Löwdin charge analysis and showed that the molecule transfers 0.0993 electrons to the surface. The magnitude of the adsorption energy and the electron transfer reveals strong interaction but with no strong reaction with the atoms on the surface.
Figure 3b shows the PDOS for the carbon monoxide molecule adsorbed on the 2D MoP
2 surface. Notice the hybridization above the Fermi energy of the orbital
p from carbon and the orbital
s from P; the same hybridization occurs (in a weaker manner) around and below the Fermi energy. The hybridizations of these orbitals reflect the adsorption of the carbon atoms with the phosphorus atoms on the surface.
3.1.2. Carbon Monoxide Adsorption on NbP2
Figure 4a displays the evolution of the system’s energy from our FPMD simulation for 4500 fs. Similar to the carbon monoxide adsorption on MoP
2, after 2.0 ps, the tendency of the energy evolution remained the same. Thus, the process reached statistical equilibrium before 2.0 ps. We showed that the final distance from the carbon atom to the phosphorus atom of the upper plane is 1.3277 Å. The 2D material adsorbed the CO molecule with adsorption energy of –0.9017 eV. The molecule transfers 0.1337 electrons to the surface. Again, the magnitude of the adsorption energy and the electron transfer reveals strong interaction but no strong reaction of the carbon monoxide with the atoms on the surface.
Figure 4b displays the PDOS for the adsorption of the carbon monoxide molecule on the 2D NbP
2 surface. Notice the hybridization around the Fermi energy of the orbital
p from oxygen and the orbital
s from P; between −5.5 eV and −3 eV, we notice the hybridization of orbitals
s and
p from carbon with orbitals
s and
p from P. The carbon monoxide adsorption on the surface is reflected in these hybridizations.
3.2. Energy Bands
3.2.1. Energy Bands for MoP2-CO
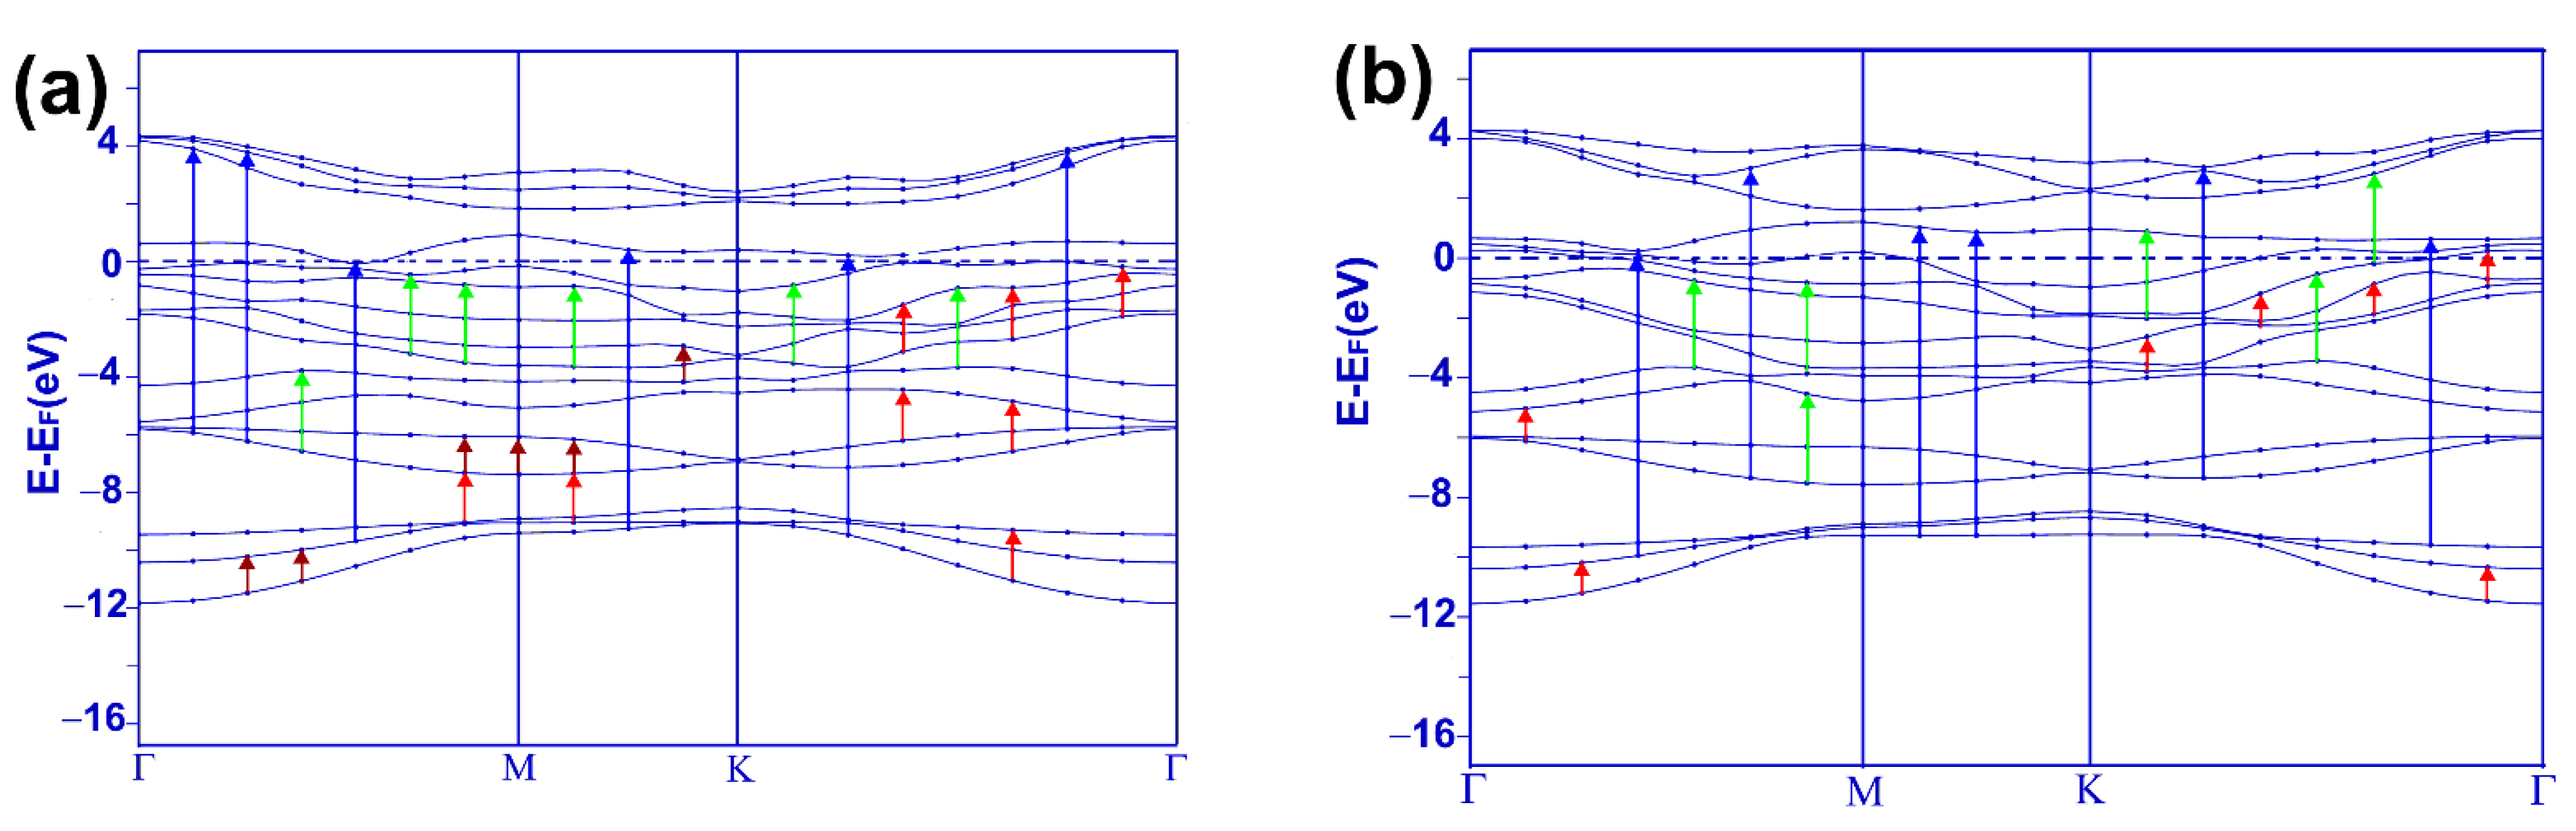
Figure 5a presents our results for the energy band structure for the system MoP
2-CO. The band structure of pristine 2D MoP
2 reveals a metallic material [
10]. With the adsorption of the carbon-monoxide molecule, there were changes in the energy band structure. Note that only one band barely touches the Fermi level from below at a few places. The material almost becomes a semiconductor, but it remains a metal.
3.2.2. Energy Bands for NbP2-CO
Figure 5b presents our results for the energy band structure for the system NbP
2-CO. We know pristine 2D NbP
2 should be a metallic material [
10]. With the adsorption of the carbon monoxide molecule, the system remains a metal, as we can see from the energy band structure calculation. Notice that a band crosses the Fermi level four times, and another strikes it twice.
3.3. Optical Properties
3.3.1. Optical Absorption for MoP2-CO
We present the optical absorption for three different ranges of incident radiation: infrared, visible, and ultraviolet.
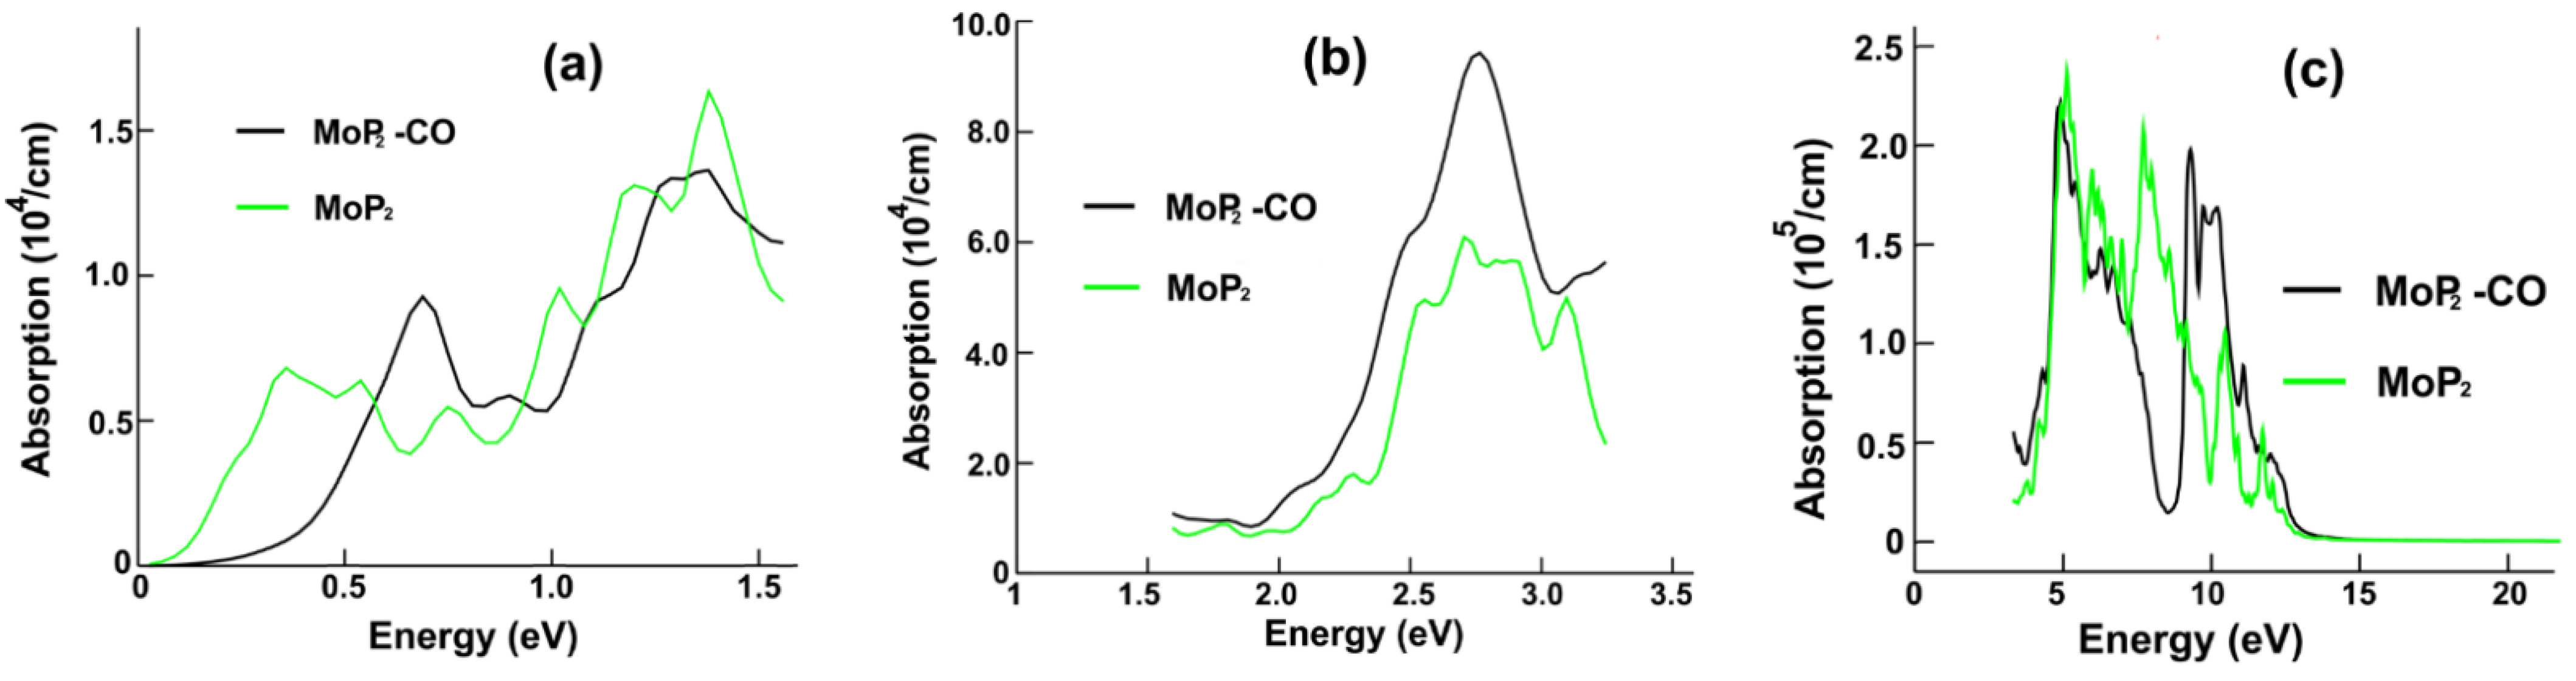
Figure 6a displays the optical absorption for MoP
2 and MoP
2-CO in the infrared range. We notice that the most significant change is for the lowest frequencies of incident radiation, from zero to around 0.5 eV; in this range of frequencies, the absorption decreases strongly after the CO adsorption. From the energy band structure calculation in
Figure 5a, we can see many possible transitions, in dark red, that explain the first peak’s presence in the infrared absorption of the combined system MoP
2-CO. This first maximum is located at 0.69 eV. The red arrows in
Figure 5a show the possible transitions for the most prominent peak (at 1.4 eV) in the infrared.
Figure 6b shows the optical absorption for the visible region. Notice a 30% increase in the central absorption peak. We can see in
Figure 5a the possible transitions (in green) to explain the main height (at 2.63 eV) for the absorption in the visible range. In
Figure 6c, we show the absorption for the ultraviolet region. Here, we obtained the most significant changes. There was a peak, about 8.60 eV, and now there is a valley. Furthermore, there was a valley around 10 eV, and now we have a maximum at around 9.35 eV. From
Figure 5a, we can see the possible transitions (in blue) giving origin to this maximum.
3.3.2. Optical Absorption for NbP2-CO
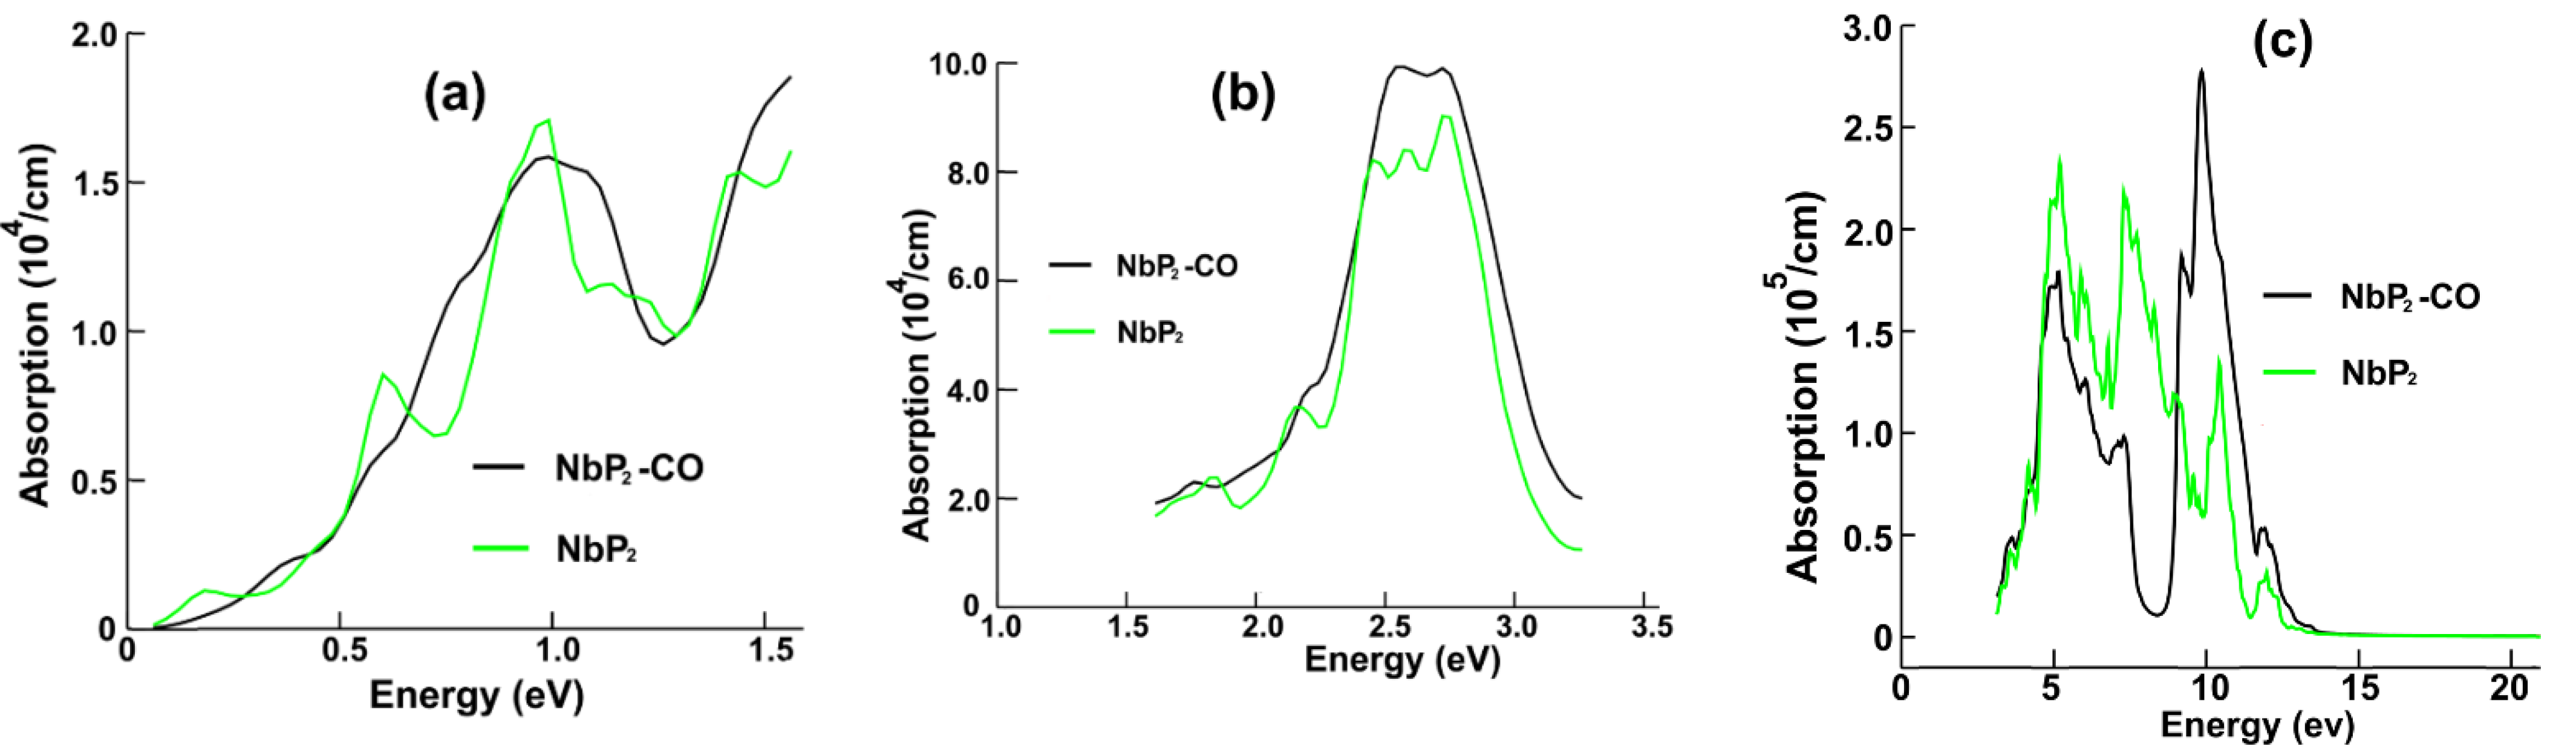
Figure 7a displays the optical absorption for NbP
2 and NbP
2-CO in the infrared region. We notice only minor changes in the optical absorption after carbon monoxide adsorption on the surface. The energy band structure (
Figure 5b) shows the possible transitions (in red) that explain the origin of this maximum located at around 1.0 eV.
In
Figure 7b, we present the optical absorption for the visible range. Again, we notice only slight changes in the absorption. The central peak increases around 20%. From the energy band structure calculation given in
Figure 5b, we can see the possible transitions (in green) explaining the presence of this maximum located at around 2.66 eV.
Figure 7c displays the optical absorption for the ultraviolet range. The most substantial change in the optical absorption occurs here. The original peak at about 7.3 eV becomes a valley with a minimum at 8.3 eV, and the initial maximum around 10.4 eV increases vastly. Again, from
Figure 5b, we can see the possible transitions (in blue) for this maximum optical absorption located at around 10 eV.
3.3.3. Reflectivity for MoP2-CO
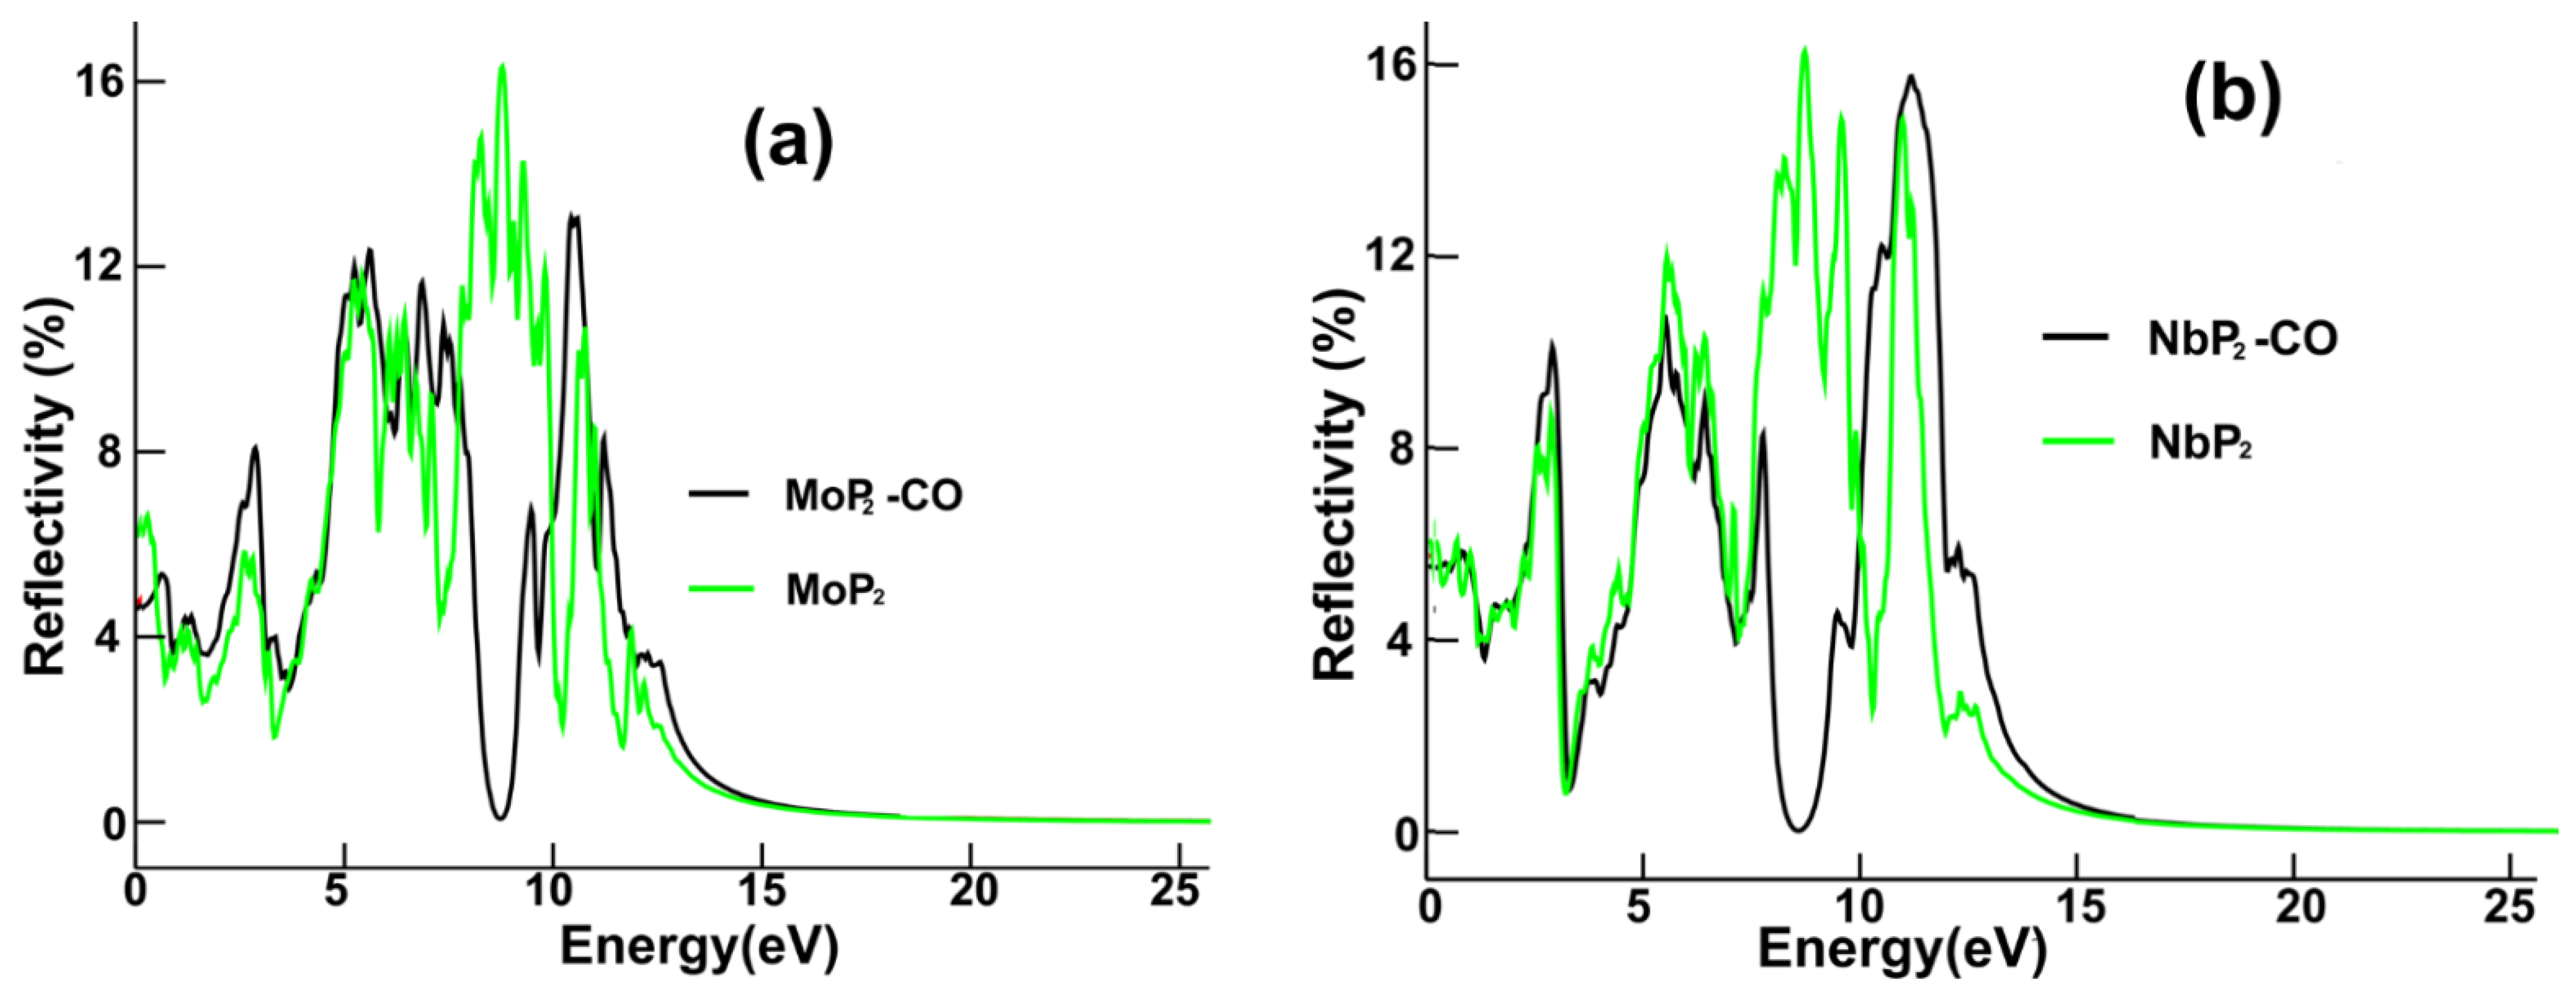
We present in
Figure 8a the reflectivity for pristine MoP
2 and MoP
2-CO. The substantial change is the appearance of a minimum at around 8.7 eV, replacing the maximum at an equal location after carbon monoxide adsorption.
Figure 8b displays the reflectivity for pristine NbP
2 and NbP
2-CO. The most significant change is the minimum located at about 8.5 eV that appears instead of the original peak at 8.6 eV.
4. Discussion
We performed FPMD simulations at atmospheric pressure and 300 K to study the interaction of the carbon monoxide and carbon dioxide molecules with each surface of the 2D materials MoP2 and NbP2. We showed that the 2D materials did not adsorb the CO2 molecule and that both surfaces adsorbed the carbon monoxide molecule. The adsorption energy on MoP2 was −0.9398 eV, and on NbP2, it was −0.9017 eV. For the two cases, the magnitude of the adsorption energy and the electron transfer reveals strong interaction but no strong reaction of the carbon monoxide with the atoms on the surface.
We revealed substantial changes in the optical properties of each 2D material after the CO adsorption. In the case of MoP2, the most significant change in the optical absorption in the infrared range is for the lowest frequencies of incident radiation, from zero to around 0.5 eV; in this range of frequencies, the absorption decreases strongly. In the visible region, there is a 30% increase in the central absorption peak. For the ultraviolet range, we obtained the most significant changes. There was a peak, about 8.60 eV, and now there is a valley. Furthermore, there was a valley around 10 eV, and now we have a maximum at around 9.35 eV. For the reflectivity, the substantial change is the appearance of a minimum at about 8.7 eV, replacing the peak at an equal location after carbon monoxide adsorption.
In the case of NbP2, there are only minor changes in the optical absorption in the infrared region; for the visible range, we noticed only slight differences in the absorption. The central peak increases around 20%. The most substantial change in optical absorption occurs in the ultraviolet range. The original peak at about 7.3 eV becomes a valley with a minimum at 8.3 eV, and the initial maximum around 10.4 eV increases vastly. For the reflectivity, the most significant change is the minimum located at about 8.5 eV that appears instead of the original peak at 8.6 eV.
Author Contributions
Conceptualization, methodology, validation, formal analysis, investigation, O.S., E.G. and L.F.M.; resources, L.F.M.; data curation, O.S. and E.G.; writing—original draft preparation, writing—review and editing, O.S. and L.F.M.; project administration, funding acquisition, L.F.M. All authors have read and agreed to the published version of the manuscript.
Funding
This research was funded by Dirección General de Asuntos del Personal Académico de la Universidad Nacional Autónoma de México, grant number IN113220. The APC was funded by Tecnologico de Monterrey.
Institutional Review Board Statement
Not applicable.
Informed Consent Statement
Not applicable.
Data Availability Statement
Not applicable.
Acknowledgments
We thank Dirección General de Asuntos del Personal Académico de la Universidad Nacional Autónoma de México for their partial financial support by Grant IN113220. We also give thanks for UNAM-Miztli-Super-Computing Center’s technical assistance by the project LANCAD-UNAM-DGTIC-030.
Conflicts of Interest
The authors declare no conflict of interest.
References
- Brivio, J.; Alexander, D.T.L.; Kis, A. Ripples and Layers in Ultrathin MoS2 Membranes. Nano Lett. 2011, 11, 5148–5153. [Google Scholar] [CrossRef] [PubMed]
- Miro, P.; Ghorbani-Asl, M.; Heine, T. Spontaneous Ripple Formation in MoS2 Monolayers: Electronic Structure and Transport Effects. Adv. Mater. 2013, 25, 5473–5475. [Google Scholar] [CrossRef]
- Miró, P.; Audiffred, M.; Heine, T. An atlas of two-dimensional materials. Chem. Soc. Rev. 2014, 43, 6537–6554. [Google Scholar] [CrossRef] [PubMed]
- Ganatra, R.; Zhang, Q. Few-Layer MoS2: A Promising Layered Semiconductor. ACS Nano 2014, 8, 4074–4099. [Google Scholar] [CrossRef] [PubMed]
- Das, S.; Robinson, J.A.; Dubey, M.; Terrones, H.; Terrones, M. Beyond Graphene: Progress in Novel Two-Dimensional Materials and van der Waals Solids. Annu. Rev. Mater. Sci. 2015, 45, 1–27. [Google Scholar] [CrossRef]
- Soto, V.; Knorr, K.; Ehm, L.; Baehtz, C.; Winkler, B.; Avalos-Borja, M. High-pressure and high-temperature powder diffraction on molybdenum diphosphide, MoP2. Z. Kristallogr. 2004, 219, 309–313. [Google Scholar] [CrossRef]
- Gao, Y.; Zhang, M.; Ding, J.; Hong, S.; Masa, J.; Liu, S.; Sun, Z. Simple synthesis of two-dimensional MoP2 nanosheets for efficient electrocatalytic hydrogen evolution. Electrochem. Commun. 2017, 97, 27–31. [Google Scholar] [CrossRef]
- Hullinger, F. New Representatives of the NbAs2 and ZrAs2 Structures. Nature 1964, 204, 775. [Google Scholar] [CrossRef]
- Rugut, E.K. Numerical Simulation of Structural, Electronic, and Optical Properties of Transition Metal Chalcogenides. Master’s Thesis, University of the Witwatersrand, Johannesburg, South Africa, 2017. [Google Scholar]
- Garcés, E.; Salas, O.; Magaña, L.F. Optical Absorption and Reflectivity of Four 2D Materials: MoS2, MoP2, NbS2, and NbP2. Front. Mater. 2021, 8, 720768. [Google Scholar] [CrossRef]
- Giannozzi, P.; Baroni, S.; Bonini, N.; Calandra, M.; Car, R.; Cavazzoni, C.; Ceresoli, D.; Chiarotti, G.L.; Cococcioni, M.; Dabo, I.; et al. QUANTUM ESPRESSO: A Modular and Open-Source Software Project for Quantum Simulations of Materials. J. Phys. Condens. Matter 2009, 21, 395502. [Google Scholar] [CrossRef] [PubMed]
- Giannozzi, P.; Andreussi, O.; Brumme, T.; Bunau, O.; Buongiorno Nardelli, M.; Calandra, M.; Car, R.; Cavazzoni, C.; Ceresoli, D.; Cococcioni, M.; et al. Advanced Capabilities for Materials Modelling with Quantum ESPRESSO. J. Phys. Condens. Matter 2017, 29, 465901. [Google Scholar] [CrossRef] [PubMed] [Green Version]
- Kokalj, A. XCrySDen—A New Program for Displaying Crystalline Structures and Electron Densities. J. Mol. Graph. Model. 1999, 17, 176–179. [Google Scholar] [CrossRef]
- Troullier, N.; Martins, J.L. Efficient Pseudopotentials for Plane-Wave Calculations. Phys. Rev. B 1991, 43, 1993–2006. [Google Scholar] [CrossRef] [PubMed]
- Kleinman, L.; Bylander, D.M. Efficacious Form for Model Pseudopotentials. Phys. Rev. Lett. 1982, 48, 1425–1428. [Google Scholar] [CrossRef]
- Perdew, J.P.; Burke, K.; Ernzerhof, M. Generalized Gradient Approximation Made Simple. Phys. Rev. Lett. 1996, 77, 3865–3868. [Google Scholar] [CrossRef] [Green Version]
- Monkhorst, H.J.; Pack, J.D. Special Points for Brillouin-Zone Integrations. Phys. Rev. B 1976, 13, 5188–5192. [Google Scholar] [CrossRef]
- Blöch, P.E.; Jepsen, O.; Andersen, O.K. Improved tetrahedron method for Brillouin-zone integrations. Phys. Rev. B 1994, 49, 16223. [Google Scholar] [CrossRef] [PubMed]
- Kumar, S.; Maurya, T.K.; Auluck, S. Electronic and optical properties of ordered BexZn 1-xSe alloys by the FPLAPW method. J. Phys. Condens. Matter 2008, 20, 075205. [Google Scholar] [CrossRef]
- Kittel, C. Introduction to Solid State Physics, 3rd ed.; John Wiley: New York, NY, USA, 1966; p. 648. [Google Scholar]
- Lide, D.R. CRC Handbook of Chemistry and Physics: A Ready-Reference Book of Chemical and Physical Data, 81st ed.; CRC Press: Boca Raton, FL, USA, 2000; pp. 2000–2001. ISBN 978-0-8493-0481-1. [Google Scholar]
- Morosin, B. Structure refinement on NbS2. Acta Cryst. 1974, B30, 551–552. [Google Scholar] [CrossRef]
| Publisher’s Note: MDPI stays neutral with regard to jurisdictional claims in published maps and institutional affiliations. |
© 2021 by the authors. Licensee MDPI, Basel, Switzerland. This article is an open access article distributed under the terms and conditions of the Creative Commons Attribution (CC BY) license (https://creativecommons.org/licenses/by/4.0/).


