Article

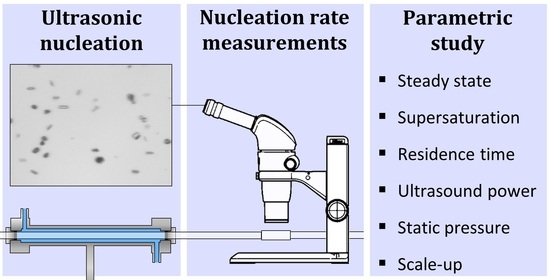
Ultrasound in Continuous Tubular Crystallizers: Parameters Affecting the Nucleation Rate

1
Research Unit CIPT, Sustainable Chemical Process Technology TC, Department of Chemical Engineering, Diepenbeek Campus, KU Leuven, Agoralaan Gebouw B, 3590 Diepenbeek, Belgium
2
Research Unit ProcESS, Sustainable Chemical Process Technology TC, Department of Chemical Engineering, KU Leuven, Celestijnenlaan 200F Box 2424, 3001 Leuven, Belgium
*
Authors to whom correspondence should be addressed.
Crystals 2021, 11(9), 1054; https://doi.org/10.3390/cryst11091054
Submission received: 16 July 2021 / Revised: 24 August 2021 / Accepted: 25 August 2021 / Published: 1 September 2021
(This article belongs to the Special Issue Pharmaceutical Crystallization)

Abstract

:
Ultrasound has proven to be an important tool for controlling nucleation in continuous tubular crystallizers. However, insufficient information is available about the parameters controlling the nucleation rate in a continuous ultrasonic process. Previous research has studied parameters related to the nucleation rate, but has not measured the nucleation rate directly or continuously. In this work, the nucleation rate is measured continuously and inline to solve this problem and achieve a better process understanding. The results indicate that the ultrasound-assisted nucleation process is presumably dominated by secondary nucleation. Additionally, the supersaturation, residence time and flow rate have a strong influence on the nucleation rate. On the other hand, the influence of the ultrasonic power is crucial but levels off once a certain amount of power is reached. The static pressure in the system determines the effective ultrasonic power and is therefore also important for the nucleation rate. Finally, maintaining an equal power per unit of volume and an equal residence time by increasing the tubing diameter seems to be a good scale-up method. These results will improve understanding of ultrasonic tubular crystallizers and how to control them.

Graphical Abstract

1. Introduction

Crystallization of active pharmaceutical ingredients (API) is an important unit operation for the pharmaceutical industry that impacts downstream processes and the bioavailability of the API. Crystallization research has been focusing on the transition from batch to continuous processing in order to reduce production costs and improve product quality. Within this transition, an important goal control over the particle size distribution during the crystallization without the need for subsequent milling operations to reduce the crystal size. Continuous tubular crystallizers are ideal for fast processes and therefore obtaining small particle sizes with a narrow particle size distribution. A generally accepted design strategy for continuous crystallizers is to decouple nucleation from growth [1,2,3,4,5]. In the nucleation stage, or nucleator, the nuclei are generated and the number of nuclei generated will determine the required growth time and the final particle size after the growth stage, assuming no secondary nucleation or agglomeration occurs. Therefore, controlling the nucleation stage is crucial for the final particle size distribution. While continuous seeding is an interesting alternative for continuous nucleators, the usage of seeds results in particles larger than the seeds, which limits particle size control [5].
The most straightforward method of inducing nucleation is by working at high supersaturations; however, high supersaturations also lead to fouling and agglomeration [1]. On top of that, complex pharmaceutical compounds generally have low nucleation rates, which is challenging for the relatively short residence times of tubular crystallizers [6]. Therefore, external energy sources are regularly used to boost nucleation rates such as ultrasound [7,8,9,10], lasers [11] and high shear induced by rotor-stator mixers [2,6,12] or narrow restrictions [13,14]. Ultrasound has proven to increase nucleation rates with orders of magnitude [15]. While the mechanism behind this nucleation enhancement is unclear, it is mostly attributed to acoustic cavitation [16]. On top of that, ultrasound is known to prevent fouling and clogging, making it ideal to use in combination with tubular crystallizers, in which also the heat generated by the acoustic cavitation can be easily removed [17,18].
In the ultrasonic nucleation zone of a tubular crystallizer, the main challenge is to control the nucleation rate, which is the number of particles formed per unit of volume per unit of time. Reducing the nucleation rate is fairly straightforward and can be accomplished by reducing the supersaturation or by bypassing a portion of the solution over the nucleation zone [19]. The main challenge lies in maximizing the nucleation rate in order to obtain very small particles and short growth times. There are many parameters that might affect the nucleation rate including the supersaturation, the residence time which is coupled to the flow rate and the nucleator volume, and finally the cavitation activity which is coupled to the ultrasonic amplitude, static pressure, frequency, reactor geometry, solvent and dissolved gas content. However, it is not clear how these parameters will affect the nucleation rate in a continuous tubular crystallizer. It is also unclear which parameter is the most important in controlling the nucleation rate. Additionally, most research performed in tubular crystallizers evaluates the particle size after a long growth time to study the nucleation; however, the particle size can be difficult to relate to the nucleation rate, since yield data is often unavailable and since crystallization is a complex process in which numerous phenomena can influence the particle size [4,19,20].
Recently, Jordens et al. showed a strong influence of the supersaturation on the nucleation rate during the continuous ultrasonic nucleation of paracetamol. An increased supersaturation corresponded to a decreased particle size after growth, suggesting an increase in nucleation rate [20]. Rossi studied the tubular ultrasonic nucleator of adipic acid without the growth zone and found that the yield increased strongly when increasing supersaturations whilst the particle size remained relatively constant [21]. This also points towards an increased nucleation rate and the constant size would be due to an equal growth time in the nucleation zone.
The influence of the residence time in an ultrasonic tubular nucleator is less understood and is also coupled to the flow rate and volume of the nucleator. Rossi investigated the influence of the residence time by varying the flow rate in their 20 kHz ultrasonic nucleator. They found larger crystals and also higher yields at longer residence times, and thus lower flow rates, in the ultrasonic nucleator. The larger crystal sizes could be due to longer residence times and therefore longer growth times and it is uncertain to what degree this influences the higher yields. It is therefore unclear what the influence on the nucleation rate is. Rossi also found a constant particle size at different nucleator diameters with a constant residence time; however, the yield reduced with increasing diameters. It is unclear if this last effect is due to reduced power at larger diameters or due to another effect; however, it shows a reduction in nucleation rate with increasing diameters, which is important for scale-up [21]. Valitov et al. achieved similar results; however, they also took into account the flow pattern when increasing the tube diameter and noted recirculation streams at 20 kHz due to acoustic streaming at the higher tube diameters. These recirculation streams create residence time distribution, causing some parts of the fluid to have very short residence times under the ultrasound probe, which could be another explanation for the reduced yields [22].
Acoustic cavitation is also critical and depends on several other parameters. In the first place, the ultrasonic amplitude will influence the cavitation, and therefore the nucleation rate. However, there are conflicting results in the literature regarding the influence of the ultrasonic power on the nucleation rate. Jiang et al. saw a decrease in particle size of 60% after growth by increasing the ultrasonic amplitude from 20% to 60% using a 750 W probe; however, further increasing the amplitude did not decrease the particle size, which was attributed to excessive heating [4]. On the other hand, Jordens et al. did not find this decrease in particle size after growth when increasing the calorimetric ultrasonic power from 4 to 11 W [20]. Jamshidi increased the duty cycle, which is the time the ultrasonic transducer is on in a given interval, and noted decreasing particles sizes and increasing yields with increasing duty cycles, which suggests higher nucleation rates [15]. Earlier work by our group in a mixed-suspension mixed-product removal (MSMPR) flow cell found a decrease in induction time with increasing ultrasonic power, which indicates an increased nucleation rate; however, an effect on the particle size of the power was also expected but was not seen [6]. The induction time is determined without the presence of crystals, and thus by the primary nucleation, whilst the particle size is determined by nucleation in the presence of crystals, and thus the secondary nucleation rate. This might indicate a different effect of the ultrasonic power on the primary and secondary nucleation rate [6]. Secondly, the frequency also has an influence on the cavitation, where transient cavitation, which occurs more at lower frequencies, generally promotes nucleation [15,16,23]. However, the frequency is device-specific and is therefore difficult to vary. Additionally, sometimes no effect is seen and in some cases particles have even been observed to be smaller at higher frequencies of 140 kHz than at 22 kHz [16,24,25]. The third parameter that influences the cavitation is the static pressure. It has been shown that higher static pressures result in more powerful cavitation implosions, and thus a higher cavitation intensity [26]. On the other hand, higher static pressures also increase the rarefactional pressure that is necessary for initiating cavitation, and this raises the cavitation threshold and reduces the cavitation activity [26]. Therefore, it is unclear which of these two effects is more important for the overall ultrasonic power dissipated in the liquid and the nucleation rate. Next, the solvent also plays an important role for acoustic cavitation. It is known that solvents with a low viscosity and a low surface tension will have a higher cavitation activity [16]. Solvents with a higher vapor pressure will also have a higher cavitation activity; however, they will also implode less powerfully and have a lower cavitation intensity, similar to the effect of the static pressure [27]. Increasing the temperature also generally increases the cavitation activity, which is attributed to changes in the surface tension, viscosity and vapor pressure; however, due to the increased vapor pressure the cavitation intensity might also drop [16,27]. Finally, the presence of solid impurities, microbubbles and the dissolved gas content will increase the cavitation activity [28].
The goal of this research is to better understand how various parameters influence the nucleation rate in a tubular ultrasonic nucleator. The nucleation rates are monitored directly and continuously by counting the number of particles coming out of the nucleator after the nucleation zone. The influence of the supersaturation, residence time, ultrasonic power and static pressure are studied and the relative importance of each parameter is evaluated. On top of that, it is investigated whether a scale-up of the ultrasonic nucleator can be achieved by keeping the ultrasonic power/volume constant and increasing the diameter of the tube to keep the residence time constant.

2. Materials and Methods

2.1. Chemicals

Adipic acid (Alfa Aesar, 99%, Haverhill, MA, USA) in deionized water is used as a model system for the crystallization experiments. Prior to the experiments, the solutions were prepared by dissolving the crystals in 2 L of water at 50 °C. The solutions were shaken until complete dissolution and were then held at 40 °C. The concentrations of the solutions were varied from 25.0 g/L to 40.0 g/L with the solubility at 22 °C being 20.0 g/L as interpolated from the data of Gaivoronskii et al. [29]. Additionally, saturated dilution solutions at 22 °C were prepared by either adding 125 g of adipic acid to 5 L of water or by reusing the crystallized solutions at the end of the experiments. In both cases, the solutions were allowed to equilibrate for at least 18 h at 22 °C, were checked visually on the presence of crystals to ensure complete saturation and were filtered before usage.

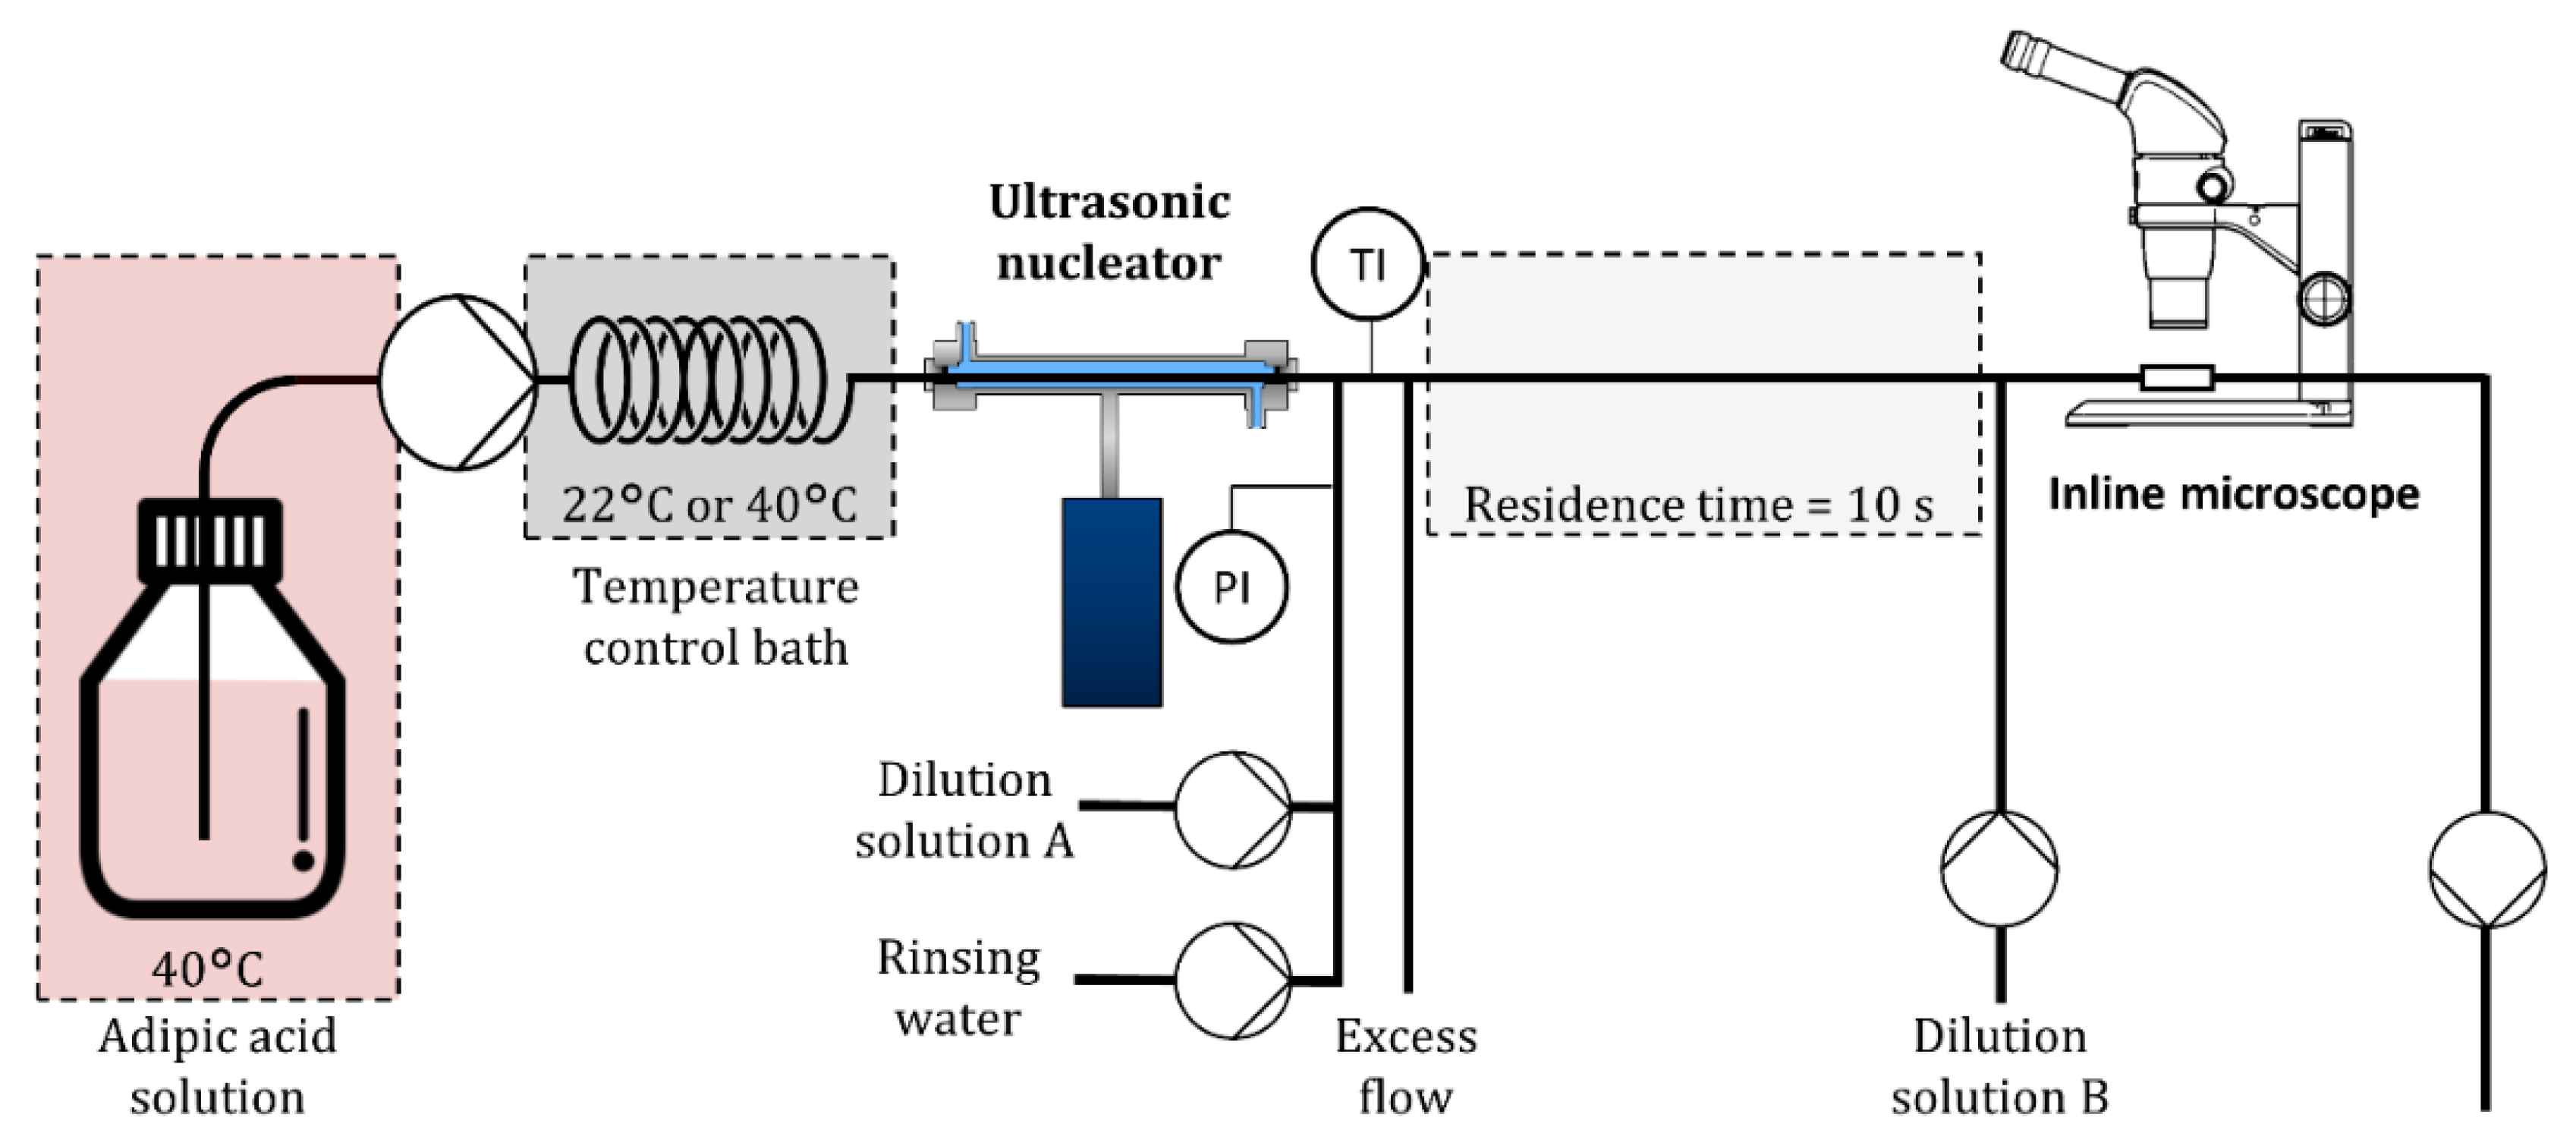
2.2. Experimental Setup

The setup is shown in Figure 1 and is designed to evaluate the influence of multiple parameters on the nucleation rate in an ultrasonic nucleator. The adipic acid solution at 40 °C is pumped using a peristaltic pump (Medorex, Model TU, Nörten-Hardenberg, Germany) through a thermostatic bath to the ultrasonic nucleator. All tubes are PFA (polyfluor, Breda, Netherlands) with an internal diameter (ID) of 1.6 mm and an outer diameter (OD) of 3.2 mm, except for the tubing in the peristaltic pump which is 4.8 mm (OD), 1.6 mm (ID) santoprene tubing and the tubing in the thermostatic bath, which is 5 m of 6 mm (OD), 4 mm (ID) PFA tubing. The thermostatic bath is set at 20 °C for all the experiments, except for the experiments were the supersaturation is varied, in which the temperature of the bath is 40 °C and the cooling is performed inside the ultrasonic nucleator. The ultrasonic nucleator is a GDmini2 ultrasonic flow cell (200W, Hielscher, Teltow, Germany) which can be fitted with various tubes and has a cooling liquid flowing around this tube. The cooling system is pressurized using a booster pump (Standex—Procon, C013754, Irishtown, Ireland) to avoid cavitation and is controlled using a thermostatic bath (Lauda, Ecosilver RE 415, Delran, NJ, USA). The tube in the ultrasonic nucleator is placed horizontally. After the ultrasonic zone is a T junction in which either dilution solution or rinsing water is added. The dilution solution is saturated at room temperature and is used to lower the supersaturation in the tubes towards the microscope to avoid undesired agglomeration, secondary nucleation and fouling. The rinsing water is used to clean the tubes after the ultrasonic zones to prevent clogging. This does not affect the nucleation process in the ultrasonic zone and is only there to periodically clean the tube channels after the ultrasonic zone. After the T junction is a K-type thermocouple to measure the temperature. Next, there is another T-junction in which part of the flow is removed and which ensures quasi-atmospheric pressure in the system. Only 43 mL/min goes to the microscope, which corresponds to a residence time of 10 s. This flow rate is controlled with another peristaltic pump after the microscope. Before the microscope, an additional dilution step is implemented to reduce the number of particles under the microscope so that the particles can be counted quantitively. The microscope has a flow cell (ibidi, µ-slide, 80176, Gräfelfing, Germany) with a height of 400 µm and a pulsating light source (pyro optic, custom made, Kirke Saaby, Denmark) in order to make images of the moving particles. The size of the pixels in these images is 1.5 µm, which is also the detection limit of the microscope. The images were analyzed using the open source software imageJ [30] using a custom algorithm (https://github.com/ArneVancleef/ImageJ-Particle-detection-and-analysis (accessed on 23 August 2021)) that is described elsewhere, along with the details of the microscope setup [31]. The parameters used for the image analysis can be found in the Table S4 in the Supplementary Information. Temperatures were logged using a TC-08 picologger (Pico technology, St Neots, UK) and pressures were measured using a ATM.1ST (STS, Sirnach, Switzerland) pressure transmitter and logged using Labview. Further details about the characterization of the ultrasonic field of the nucleator are described in Appendix A.

2.3. Nucleation Rate Measurements

The number of particles exiting the nucleator was continuously monitored by capturing a video using the microscope at one frame per second to monitor the nucleation rate. Equation (1) gives the calculation of the nucleation rate. The nucleation rate ( J ) is the number of nuclei that are formed per unit of time per unit of volume and is measured by counting the number of particles ( N ) in the known volume ( V ) of the flow-through cell under the microscope. The time is the residence time of the nucleator ( τ ). Additionally, since dilution solutions are used to allow correct image analysis without overlapping particles, a dilution factor ( f ) is taken into account. This method assumes that there is no aggregation, secondary nucleation or particle deposition in the tube towards the microscope. The full details of image analysis and calculations are discussed elsewhere [31].
J = N V · τ · f
The nucleation rate was calculated based on the average nucleation rate from 10 to 20 min for the supersaturation, residence time and scale-up experiments. For the ultrasonic power experiments, the nucleation rate was determined based on the average between 4 and 10 min after changing the ultrasonic amplitude. Measurements during and up to 25 s after the rinsing were discarded for the calculations of the nucleation rate.

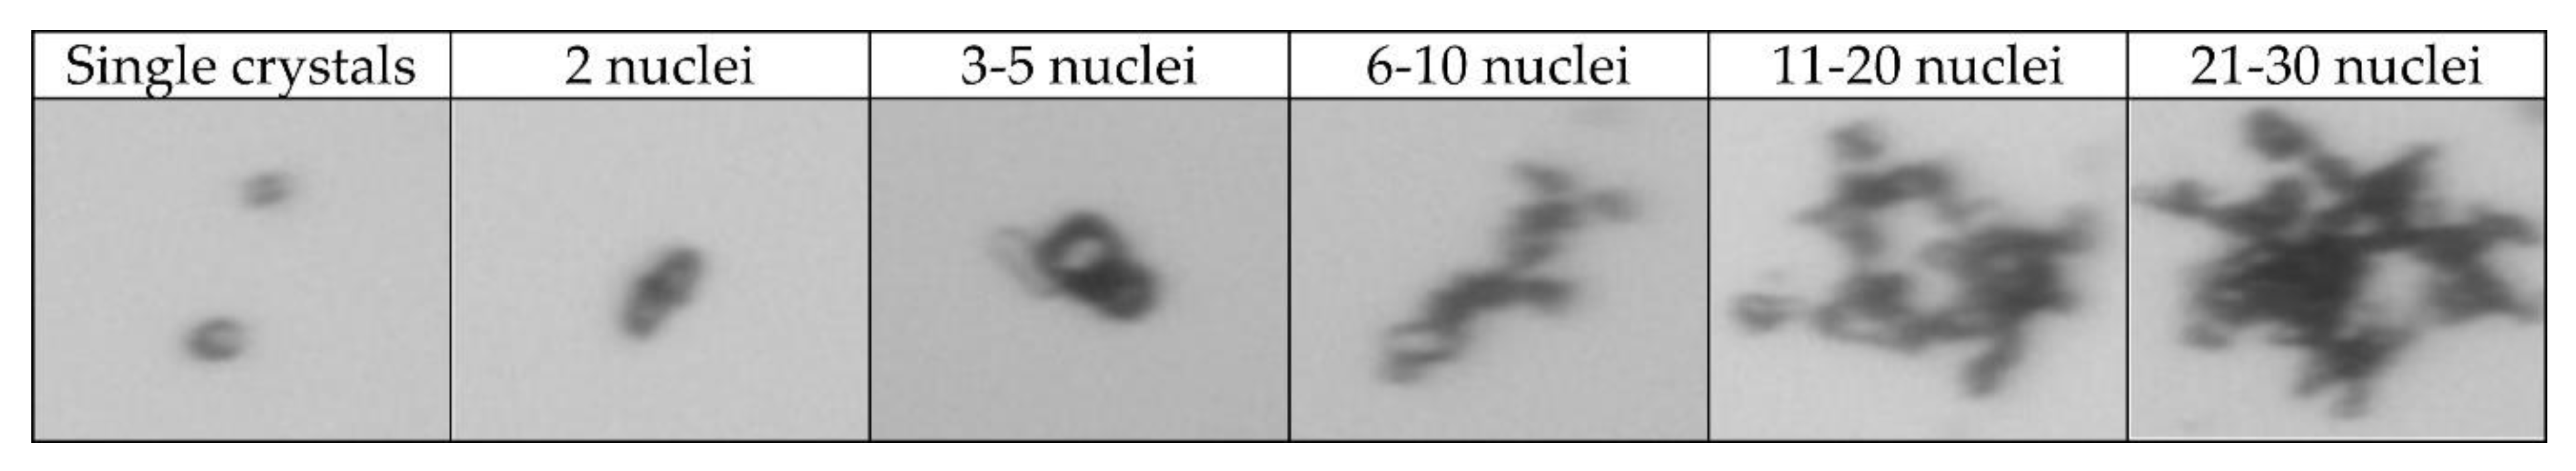
2.4. Aggregation Degree

Aggregates influence the measured nucleation rate since these particles are counted as single particles while they consists of multiple nuclei. To correctly determine the nucleation rate, each detected particle is given an aggregation degree, which stands for the number of nuclei that were incorporated in a detected particle. This value is determined from the circularity and the solidity which are both shape parameters which indicate how round a particle is and how much smaller a particle is than its convex hull, respectively. Additionally, the area of the particles is a third parameter that is used to determine the aggregation degree. The calibration of these parameters for the agglomeration degree is carried out by taking 216 particles at random from the experiments where the supersaturation is varied, and classifying them into categories of single crystals, 2, 3–5, 6–10, 11–20 and 21–30 nuclei per particle. Particles with more than 30 nuclei per particle were not found in the images. Examples of these particles are given in Figure 2. From each category, the mean value and standard deviation of the solidity, circularity and area are determined. These can be found in Table S1, in the Supplementary Information. The proximity (P) of a particle to a category is calculated according to Equation (2) which compares the parameters of that particle to that of the category. The lower this value is, the more similar the particle is to that category and the particle will be categorized in the category with the lowest proximity value.
P = ( s o l p a r t i c l e s o l m e a n ) 2 s o l s t d e v 2 · ( c i r c p a r t i c l e c i r c m e a n ) 2 c i r c s t d e v 2 · ( a r e a p a r t i c l e a r e a m e a n ) 2 a r e a s t d e v 2
The aggregation degree is then defined as the number nuclei per detected particle as indicated by Equation (3).
A g g = # n u c l e i # d e t e c t e d   p a r t i c l e s
The aggregation degree can then be used to more accurately calculate the nucleation rate. Table 1 gives an overview of how the method would classify the training set. Even though a lot of particles are misclassified because of the narrow categories, these particles are often classified in the neighboring categories, minimizing the error on the aggregation degree. This is indicated by the aggregation degree of the training set, which is 5.5 according to the manual classification, and was determined to be 6.1 according to the described method, making the overall error only 12% on the aggregation degree for the calibration images.

2.5. Nucleation Rate Experiments

The influence of the supersaturation, the residence time and the ultrasonic power on the nucleation rate at steady state were investigated. The exact conditions can be found in Table 2. After start up the process was given 10 min to reach steady before the actual measurements. The ultrasonic power experiments all started at 100% amplitude for the first 10 min after which the amplitude was set to a different amplitude. Generally, the adipic acid solution was cooled from the saturation temperature of 40 °C to the supersaturation temperature of 22 °C before the ultrasonic nucleator. This was carried out to keep the temperature profile and the supersaturation profile in the ultrasonic nucleator constant for the experiments where the flow rates and ultrasonic power was varied. Only in the experiments where the supersaturation was varied, the solution was cooled in the ultrasonic nucleator by employing a temperature of 2 °C in the cooling system of the nucleator. In this way fouling and clogging before the ultrasonic nucleator at high supersaturations was prevented as there was no supersaturation here. The supersaturations were calculated based on the temperature at the exit of the ultrasonic nucleator assuming no crystallization took place. For the experiments where cooling was performed before the ultrasonic nucleator, the temperature in the ultrasonic zone was kept constant by removing the heat from the ultrasound by the cooling system of the ultrasonic nucleator. The supersaturation (S) was calculated according to Equation (4):
S = c c 0
with c the concentration in g/L and c 0 the solubility in g/L. The ratio of the dilution solution A and B, which are added directly after the nucleator and directly before the microscope, respectively, are relative to the flow rate of the adipic acid solution.
Furthermore, a scale-up method is proposed by keeping the ultrasonic power/volume and the residence time constant by increasing the diameter of the tube to allow a higher flowrate. The details of experiments are shown in Table 3. The scaled up experiment is repeated in twofold and the nucleation rate value of the experiment at the original scale is interpolated from the residence time experiments. The power that can be dissipated in the big tube is higher. Therefore, in the scaled up experiment, the ultrasonic amplitude was also reduced to 61% to keep the calorimetric ultrasonic power per unit of volume constant. In both experiments, the temperature at the inlet and outlet of the ultrasonic nucleator was 22 °C. To ensure a temperature of 22 °C at the inlet, the tubing in the cooling bath was extended by 15 m. In addition, the temperature of the cooling system in the ultrasonic nucleator was reduced to 16 °C to make sure the temperature at the exit of the nucleator was still 22 °C.
Additionally, the transient state and the influence of the static pressure are investigated without the use of dilution solution. Both experiments are performed at a flow rate of 21 mL/min, a supersaturation of 1.43 with cooling being performed before the ultrasonic nucleator. The transient state experiment is performed in a tube with an inner diameter of 2.15 mm and an amplitude of 100%. The pressure experiment is performed in a glass tube of 4.8 mm and an amplitude of 50% to minimize heating. Here, a valve is placed after the microscope to control the pressure. The experiment is started at ambient pressure and after 10 min the pressure is increased using the valve. The pumps provide a constant flow rate at the used pressures. Before the valve, a 5 m coil of PFA 1.6 × 0.8 mm PFA tubing is placed in a dissolution bath at 40 °C to dissolve the particles prevent clogging of the valve. The rinsing water is added after the microscope when the microscope is not being rinsed to keep the pressure constant in the ultrasound zone.
Prior to each experiment, the setup was rinsed with water which was removed afterwards with air. At the beginning of an experiment all pumps are started. The rinsing pump is turned off the moment the adipic acid solution enters the ultrasonic nucleator, and after 25 s the ultrasound was turned on, as well as the video recording. Every 100 s the system is periodically rinsed for 15 s to clean the flow cell under the microscope.

2.6. Calorimetric Measurements

Calorimetric measurements were performed to gain a better insight on the effective ultrasonic power in the nucleation zone. The method assumes that all effective ultrasonic power is dissipated as heat in the ultrasonic nucleator. This heat is measured and expressed as the calorimetric ultrasonic power. The heat is measured using K-type thermocouples at the inlet and outlet of the ultrasonic nucleator and the inlet and outlet of the cooling system of the ultrasonic nucleator. A blank measurement is subtracted from the measurements and no ultrasonic power is dissipated in the cooling system as it is pressurized at 8 bar. This was verified by filling the ultrasonic nucleator with air and measuring the ultrasonic power, which was zero, indicating that there was no energy being dissipated in the cooling system. The calorimetric ultrasonic power ( P c a l ) is calculated using Equation (5).
P c a l = ( m ˙ · c p · Δ T ) U S + ( m ˙ · c p · Δ T ) U S   c o o l i n g
where m ˙ is the mass flow rate of the water, c p is the heat capacity, Δ T the temperature difference between inlet and outlet. US and US cooling denote the ultrasonic nucleator and the cooling system of the ultrasonic nucleator, respectively. The experiments were performed with water. Measurements were also performed at various static pressures by using a peristaltic pump after the nucleator to reduce the pressure and by closing a needle valve after the nucleator to increase the pressure. The electrical power of the nucleator was measured using an electrical power meter (Energy-Logger 4000 FR, Voltcraft)

3. Results and Discussion
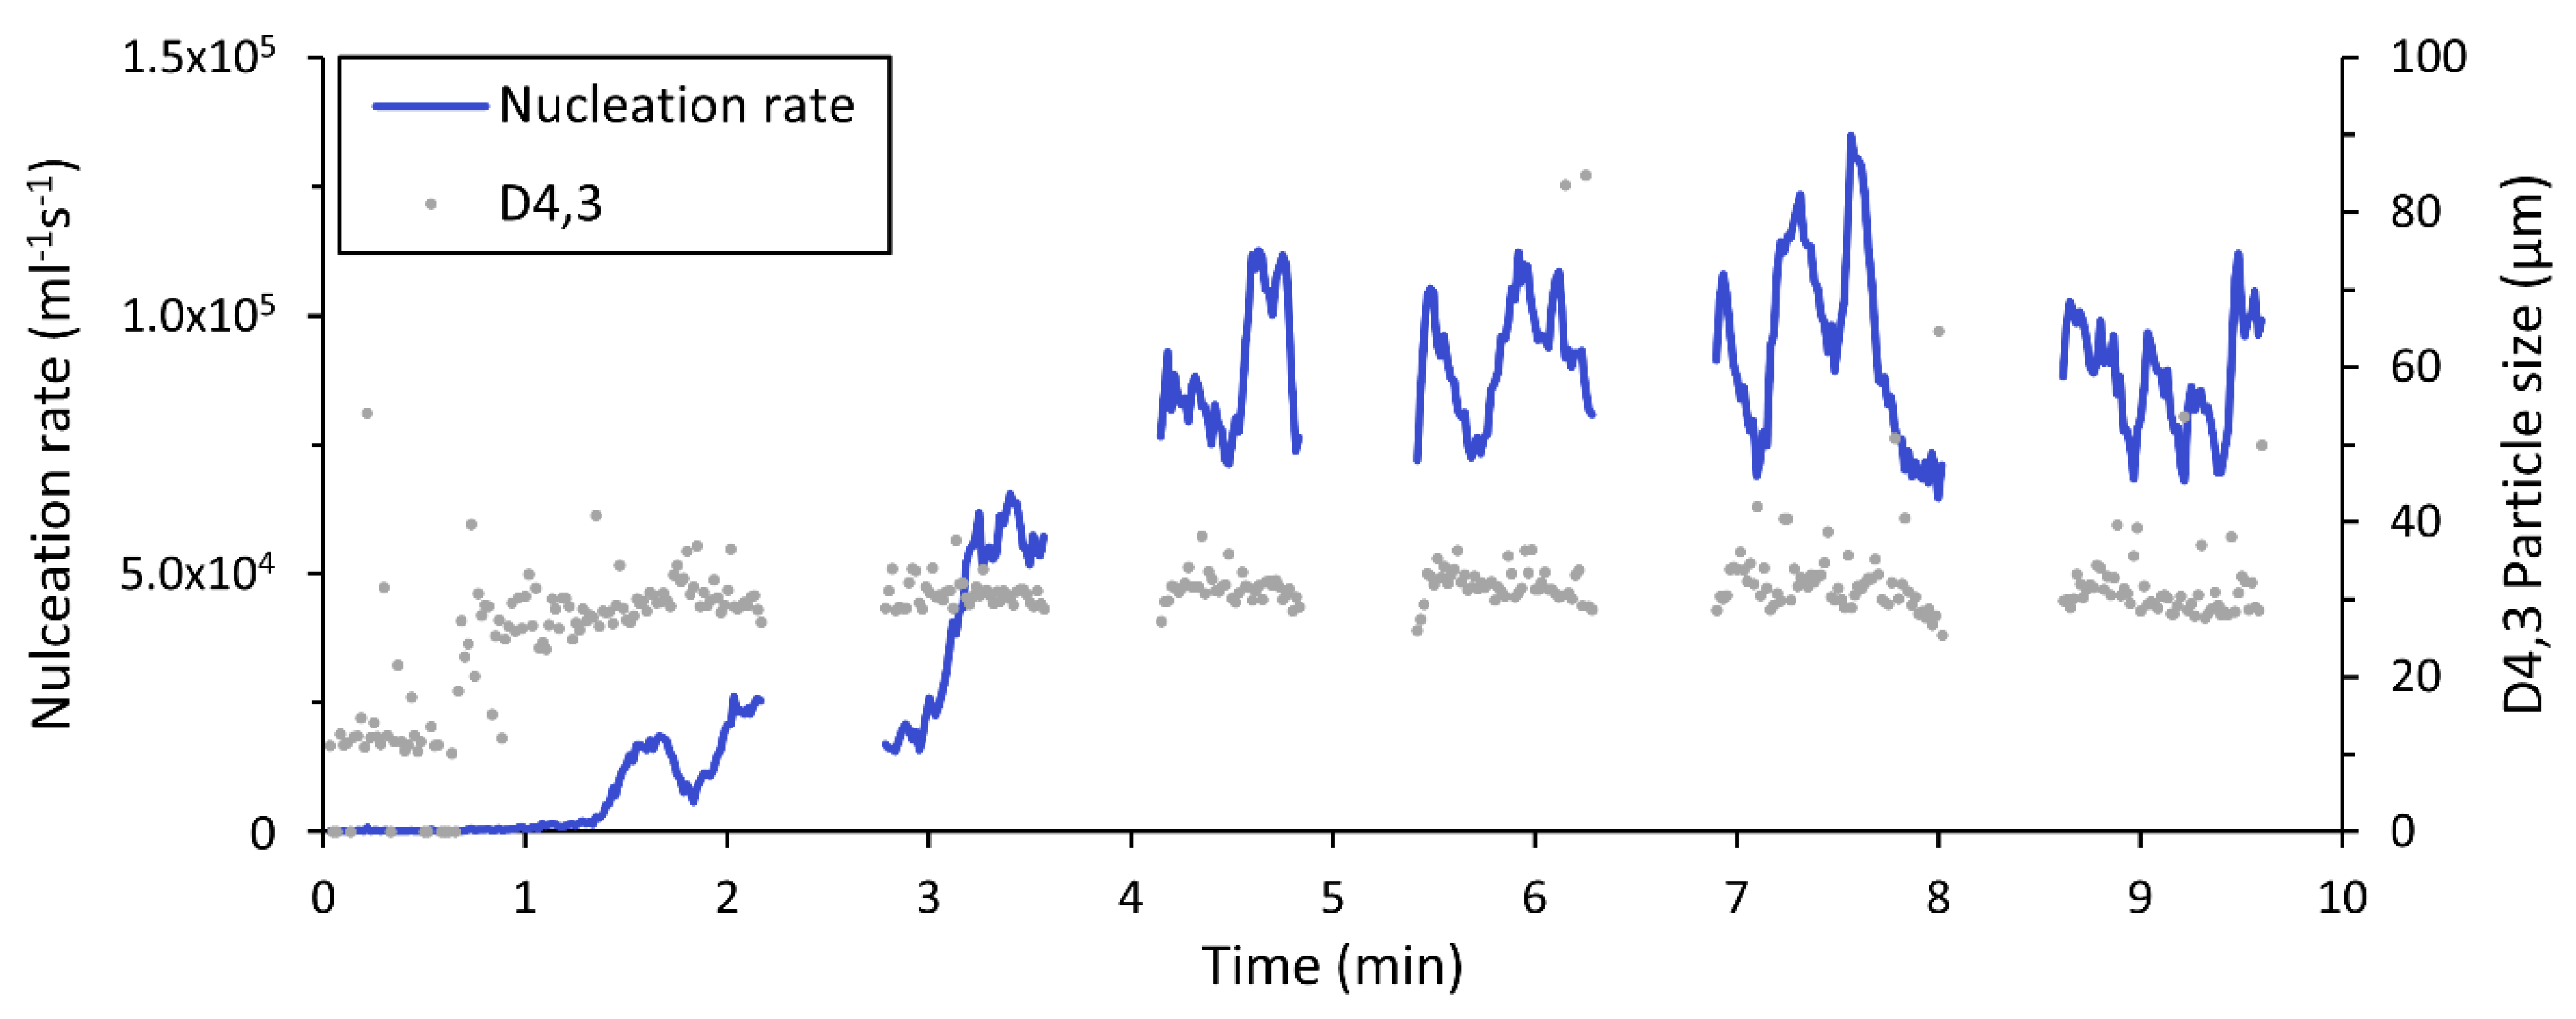
3.1. Steady State

Figure 3 shows how the nucleation rate and the volume based particle size change over time after starting the sonication. First, there is a short induction time of approximately a minute before the nucleation rate starts to increase. Then, it takes several minutes for the nucleation rate to finally reach a steady state. This transient state, which is the time it takes to reach the steady state, is remarkably long for a continuous process in a tubular crystallizer. Since the residence time in the ultrasonic zone is only 2.6 s, this would make the number of residence times needed to reach steady state more than 100, which is very high. Even MSMPR-type crystallizers, which typically need the longest time to reach steady state, only need 10–15 residence times to reach a steady state [32]. However, the particle size remains constant over time, which indicates that the crystals exiting the nucleator all had the same residence time and that there is no hold up, as this would cause a size increase in the particles exiting the nucleator. To our knowledge, the phenomenon described here has not been documented before, and we have three hypotheses that could explain this behavior. The first hypothesis involves the formation of a crystal layer on the tube wall, which would promote secondary nucleation. In the second hypothesis, it could be that the formed nuclei in the ultrasonic zone promote secondary nucleation, which is a process that could continue until desaturation would inhibit the further increase in the nucleation rate. This process might be aided by recirculation streams in the ultrasound zone as seen by Valitov [22], sedimentation in the sonication zone or particles focusing in the nodes of the waves by means of an acoustophoretic focusing effect. In the third and final hypothesis, the formed crystals facilitate the formation of more acoustic cavitation bubbles, which would then again cause more nucleation. This process could also explain the long transient state and it is known that particles can enhance acoustic cavitation [28]. It is unclear which of the three hypotheses is the one responsible for the long transient state, and it might even be a combination of the three mechanisms. In each of these three cases, primary nucleation would not be the mechanism dominating the nucleation process, which was not expected in a tubular crystallizer. The nucleation process seems to require the presence of other crystals, and is therefore likely dominated by secondary nucleation. The induction time could then be explained by the time needed for primary nucleation.
Figure 4 shows the volume-based particle size distribution of the crystals exiting the nucleator during the first 10 min of the experiment and an image of these crystals. The particles have a volume based D50 of 28 µm and a D10 and D90 of 18 and 46 µm, respectively. This results in a span of 1.0, indicating a narrow particle size distribution. This can also be seen from the image, as all particles are similar in size and most of the particles are single particles, as desired. More information regarding the particle sizes can be found in Table S3 in the Supplementary Information.

3.2. Influence of Supersaturation

Figure 5a shows the influence of the supersaturation on the nucleation rate with and without taking the aggregation degree into account. The change in the aggregation in function of the supersaturation is shown in Figure 5b. The aggregation distributions at different supersaturations can be found in Figure S2 in the Supplementary Information. The aggregation degree and the nucleation rate remain constant and low at the two lowest supersaturations and start to increase from a supersaturation of 1.6. This is expected, as it is known that agglomeration and nucleation rates increase at higher supersaturations [33,34]. The nucleation rate is multiplied by the aggregation degree to take aggregation into account. Taking this into account, the nucleation rate increases 45 times from a supersaturation of 1.25 to a supersaturation of 2. Since clogging in the ultrasound zone was not observed, it should be possible to further increase the supersaturation and achieve even higher nucleation rates. However, it remains unclear whether the aggregates are loosely connected or not and whether they can be deaggregated easily after the ultrasonic nucleator.

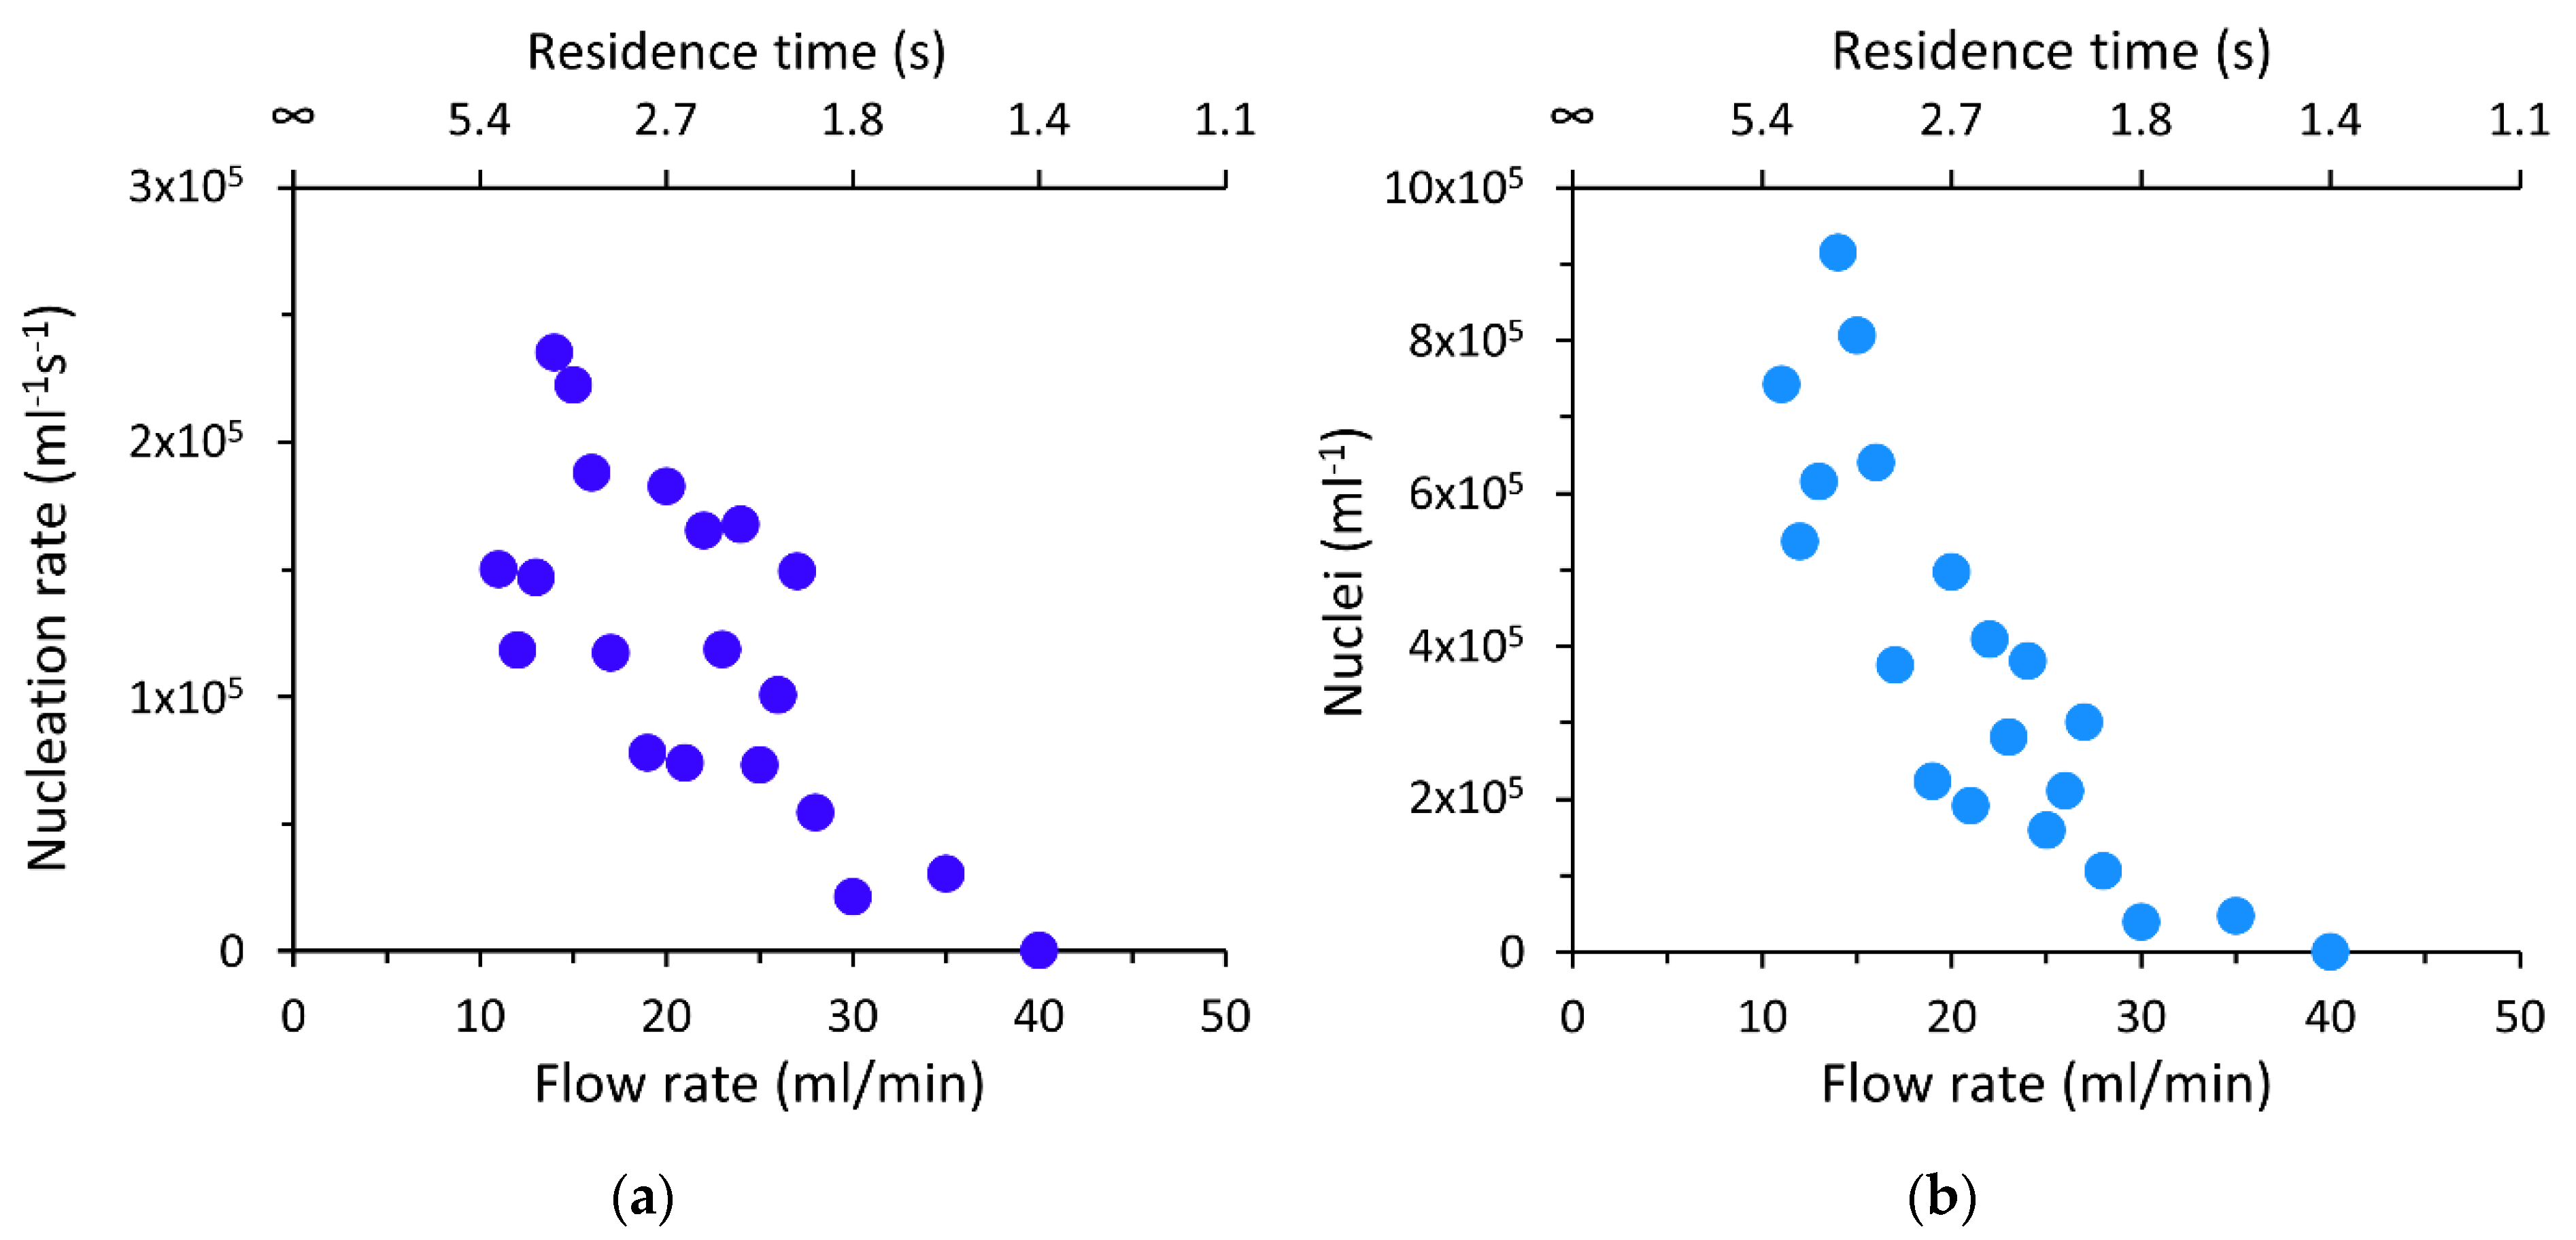
3.3. Influence of Flow Rate and Residence Time

Figure 6a shows how the nucleation rate is influenced by the flow rate and the residence time, which is inversely proportional to the flow rate, in the ultrasound-irradiated zone. In Figure 6b the same information can be found for the total number of nuclei that are formed in the ultrasound zone, which is the nucleation rate times the residence time. The nucleation rate and the number of nuclei decrease strongly with increasing flow rates and decreasing residence times. At a flow rate of 40 mL/min and a residence time of 1.4 s the nucleation rate reaches zero and no crystals exit the nucleator. Why the nucleation rate drops so quickly with increasing flow rates is not exactly clear. A possible explanation would be that a minimum residence time in the ultrasonic zone is necessary for nucleation. Additionally, it might be that at these high flow rates and low residence times the secondary nucleation process as described in Section 3.1 might not be able to sustain itself, in this case, the linear speed of the fluid in the nucleator might be crucial. These data are important as it means that ultrasonic nucleators will be more effective at lower flowrates and higher residence times. Additionally, it determines that there is a minimum residence time, maximum flow rate or maximum linear speed, which is in this case approximately 1.6 s or 35 mL/min, which corresponds to a linear speed of 16 cm/s. This value is likely to change for other conditions, such as with other components, other tube diameters or other supersaturations; however, it is expected that a maximum allowable flow rate will remain if the process is determined by secondary nucleation. Overall, this means that the flow rate and residence time have a strong and important influence on the nucleation rate; however, more insight into the mechanisms that dominate the nucleation rate at different flow rates and residence times is necessary. Finally, when designing a tubular crystallizer, it has to be taken into account that the flow rate is also coupled to other factors such as the production rate, temperature profile and sedimentation.

3.4. Influence of Ultrasonic Power

Figure 7 shows how the nucleation rate is influenced by the ultrasonic amplitude and the calorimetric ultrasonic power. The nucleation rate shows an increase with increasing ultrasonic amplitude and ultrasonic power, as expected. The nucleation rate is zero when no ultrasound is used, highlighting the capabilities of ultrasound to control the nucleation in continuous tubular crystallizers. It also has to be noted that at an amplitude of 50%, clogging has occurred in the ultrasonic nucleator, which did not occur at an amplitude of 100% in runs of 4 h. Above 50%, the influence of the ultrasonic amplitude on the nucleation rate is rather small, with it not even doubling from 60% to 100%. These results correlate well with the results from Jiang et al., who saw a decrease in particle size with increasing amplitudes up to a certain amplitude, indicating an increase in nucleation rate [4]. Jordens et al. did not see an influence of the calorimetric ultrasonic power; however, they worked at significantly higher calorimetric ultrasonic powers from 4 to 11 W and in a larger tube diameter. Overall, increasing the ultrasonic power does seem to increase the nucleation rate; however, the gains are rather small once a certain power is reached and are likely to be offset by an increase in temperature.

3.5. Scale-Up Parameter

Scale-up is investigated by keeping the residence time and the calorimetric ultrasonic power/volume constant while the nucleator volume is increased by increasing the diameter of the tube. Table 4 shows the results of the scale-up experiments. The results show that the nucleation rate has the same order of magnitude in the scaled-up experiment. This indicates that a good basis for a scale-up parameters has been found. The nucleation rate does have a threefold increase when scaling up with a factor of five; however, the reason for this increase is difficult to pinpoint as there are a multitude of possible explanations such as a volume factor, changing hydrodynamics [22] and the measurement deviations on the calorimetric ultrasonic powers. Additionally, it has to be noted that the surface of the tube in the scaled up experiment was rougher due to cavitation erosion, as can be seen in Figure A2, in Appendix A. Nevertheless, higher nucleation rates are generally desired. Valitov et al. and Rossi also investigated the influence of the tube diameter at a constant residence time and saw a reduction in yield, which can be linked to a reduction in the nucleation rate, with increasing tube diameters. This could be explained by a reducing ultrasonic power/volume as they did not keep it constant [21,22]. While the proposed scale-up method is promising, further scale-up experiments will be needed to verify it and map any additional effects. Additionally, heat transfer will be an important consideration during scale-up as the heat generated by dissipation of ultrasound energy will have to be removed and the solution has to be cooled to the required supersaturation.

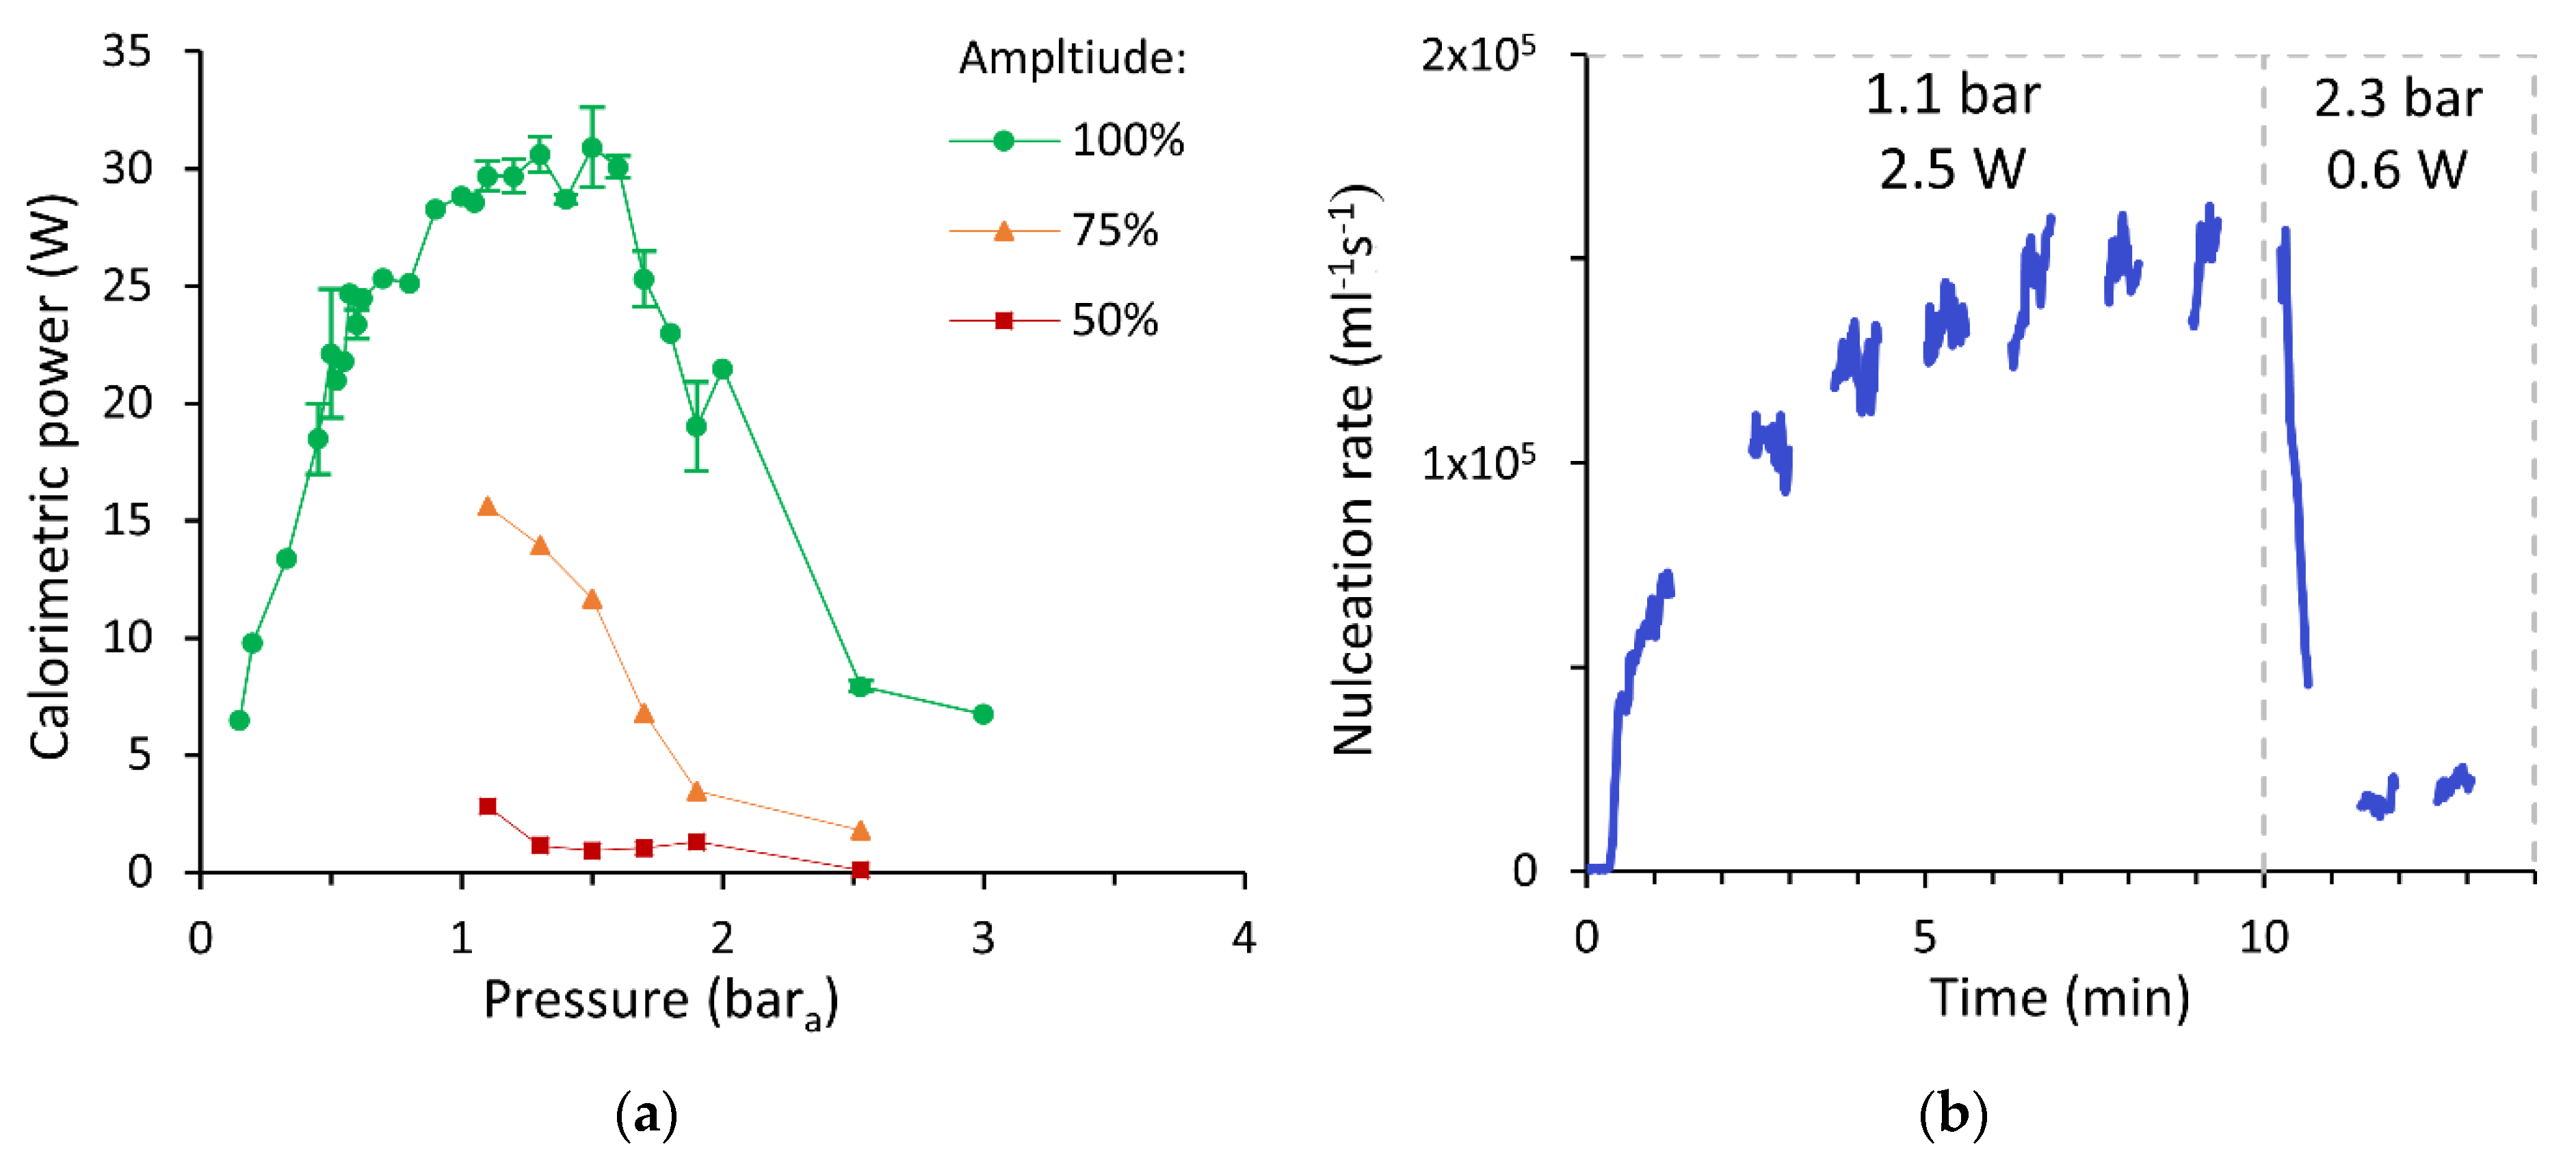
3.6. Influence of Static Pressure

Figure 8a shows the influence of the static pressure in the ultrasonic zone on the measured calorimetric ultrasonic power at different ultrasonic amplitudes. The calorimetric ultrasonic power reaches an optimum between 1.1 and 1.6 bar at the highest amplitude of 100%. For the lower amplitudes the obtained power is lower and a decrease in power is already seen above 1.1 bar, indicating that at lower amplitudes the optimum situates at lower static pressures. The optimum can be explained by the two opposing effects of the cavitation implosion intensity and the cavitation activity that increase and decrease, respectively, at higher static pressures. At high static pressures, the cavitation threshold is too high to allow for a sufficient number of cavitation events, while at low static pressures, the intensity of the cavitation events is insufficient [26]. The decrease in optimum static pressure for lower amplitudes is explained by the cavitation threshold that increases with the static pressure and that needs to be exceeded by the acoustic amplitude to allow cavitation to occur. The optimum static pressure is therefore dependent on the amplitude of the ultrasonic system for a given liquid. It is even expected to be dependent on the presence of solid particles as these will influence the cavitation activity [28].
The relation between the calorimetric ultrasonic power and the nucleation rate has been discussed in Section 3.4. Figure 8b shows how the nucleation rate changes during an experiment where the pressure was increased from ambient pressure to 2.3 bar during the experiment. The increase in pressure causes a rapid drop in nucleation. This was expected as the increase in pressure also decreases the calorimetric ultrasonic power from 2.5 W to 0.6 W. However, it remains unclear whether the change in calorimetric ultrasonic power due to the change in static pressure can be directly coupled to the nucleation rate as the nature of the cavitation events might also change with the static pressure. The experiment eventually ends in clogging due the ultrasonic power being insufficient, as expected. Overall, this information is important for designing continuous crystallizers.

4. Conclusions

As ultrasonic nucleation becomes increasingly important for continuous tubular crystallizers, it is important to understand how these nucleators operate and how they can be used to control the nucleation rate. By monitoring the nucleation rate continuously at the exit of an ultrasonic tubular nucleator, it was established that a long time is needed to reach a steady state; at least 5 min, which corresponds to 100 residence times. This likely means that the primary nucleation is not the dominating mechanism for the nucleation and that the presence of other crystals enhances the nucleation rate. Additionally, the influence of the supersaturation, residence time and ultrasonic power on the nucleation rate was determined. The supersaturation has a large influence on the nucleation rate, with a 45-fold increase in the nucleation ratio from a supersaturation of 1.25 to a supersaturation of 2. It is therefore probably the most important parameter to control the nucleation rate. The residence time and flow rate also have a big influence, with a 10 times increase in nucleation rate when increasing the residence time from 1.6 s to 5.4 s and reducing the flow rate from 35 mL/min to 11 mL/min. Additionally, a minimum residence time, or a maximum linear speed, was found. An increase in ultrasonic power also increases the nucleation rate; however, above a certain power, the increase is minor, with the nucleation rate only doubling while increasing the amplitude from 60% to 100%, which corresponds to an increase in calorimetric ultrasonic power from 0.6 W to 2.3 W. On top of that, a good basis for a scale-up was found by keeping the ultrasonic power/volume constant and by increasing the tube diameter to keep the residence time constant. Finally, it was established that the ultrasonic nucleator has an optimal working pressure. These findings are crucial in the design of ultrasonic tubular nucleators and will help in the transition towards continuous crystallization. Future research into ultrasonic tubular nucleators should focus on better understanding the nucleation mechanism. Furthermore, a better understanding of the interaction between parameters, especially the supersaturation and the residence time, is needed. It is expected that the minimum residence time might change at higher supersaturations and it might also influence the nucleation mechanism.

Supplementary Materials

The following are available online at https://www.mdpi.com/article/10.3390/cryst11091054/s1: Table S1: Values used to calculate the proximity of a particle to a category. Figure S2: Influence of the supersaturation on the aggregation distribution. Table S3: Equivalent spherical sizes of the particles coming out of the nucleator during the first 10 min of the experiment. Table S4: Parameters used for the image analysis.

Author Contributions

Conceptualization: A.V. and L.B.; Funding acquisition, L.C.J.T. and L.B.; Investigation, A.V.; Methodology, A.V.; Project administration, A.V. and L.B.; Software, A.V.; Supervision, L.B.; Validation, A.V.; Visualization, A.V.; Writing—original draft, A.V.; Writing—review and editing, T.V.G., L.C.J.T. and L.B. All authors have read and agreed to the published version of the manuscript.

Funding

This research was funded by the Agency for Innovation and Entrepreneurship (VLAIO) and Catalisti grant number PIF HBC.2017.0442 and MMICAS HBC.2020.2627.

Acknowledgments

The authors thank Nicky Van Baars, Muhammet Gücyetmez, Andries Hermans and Andrej Andjelic for their help in the experimental work.

Conflicts of Interest

The authors declare no conflict of interest.

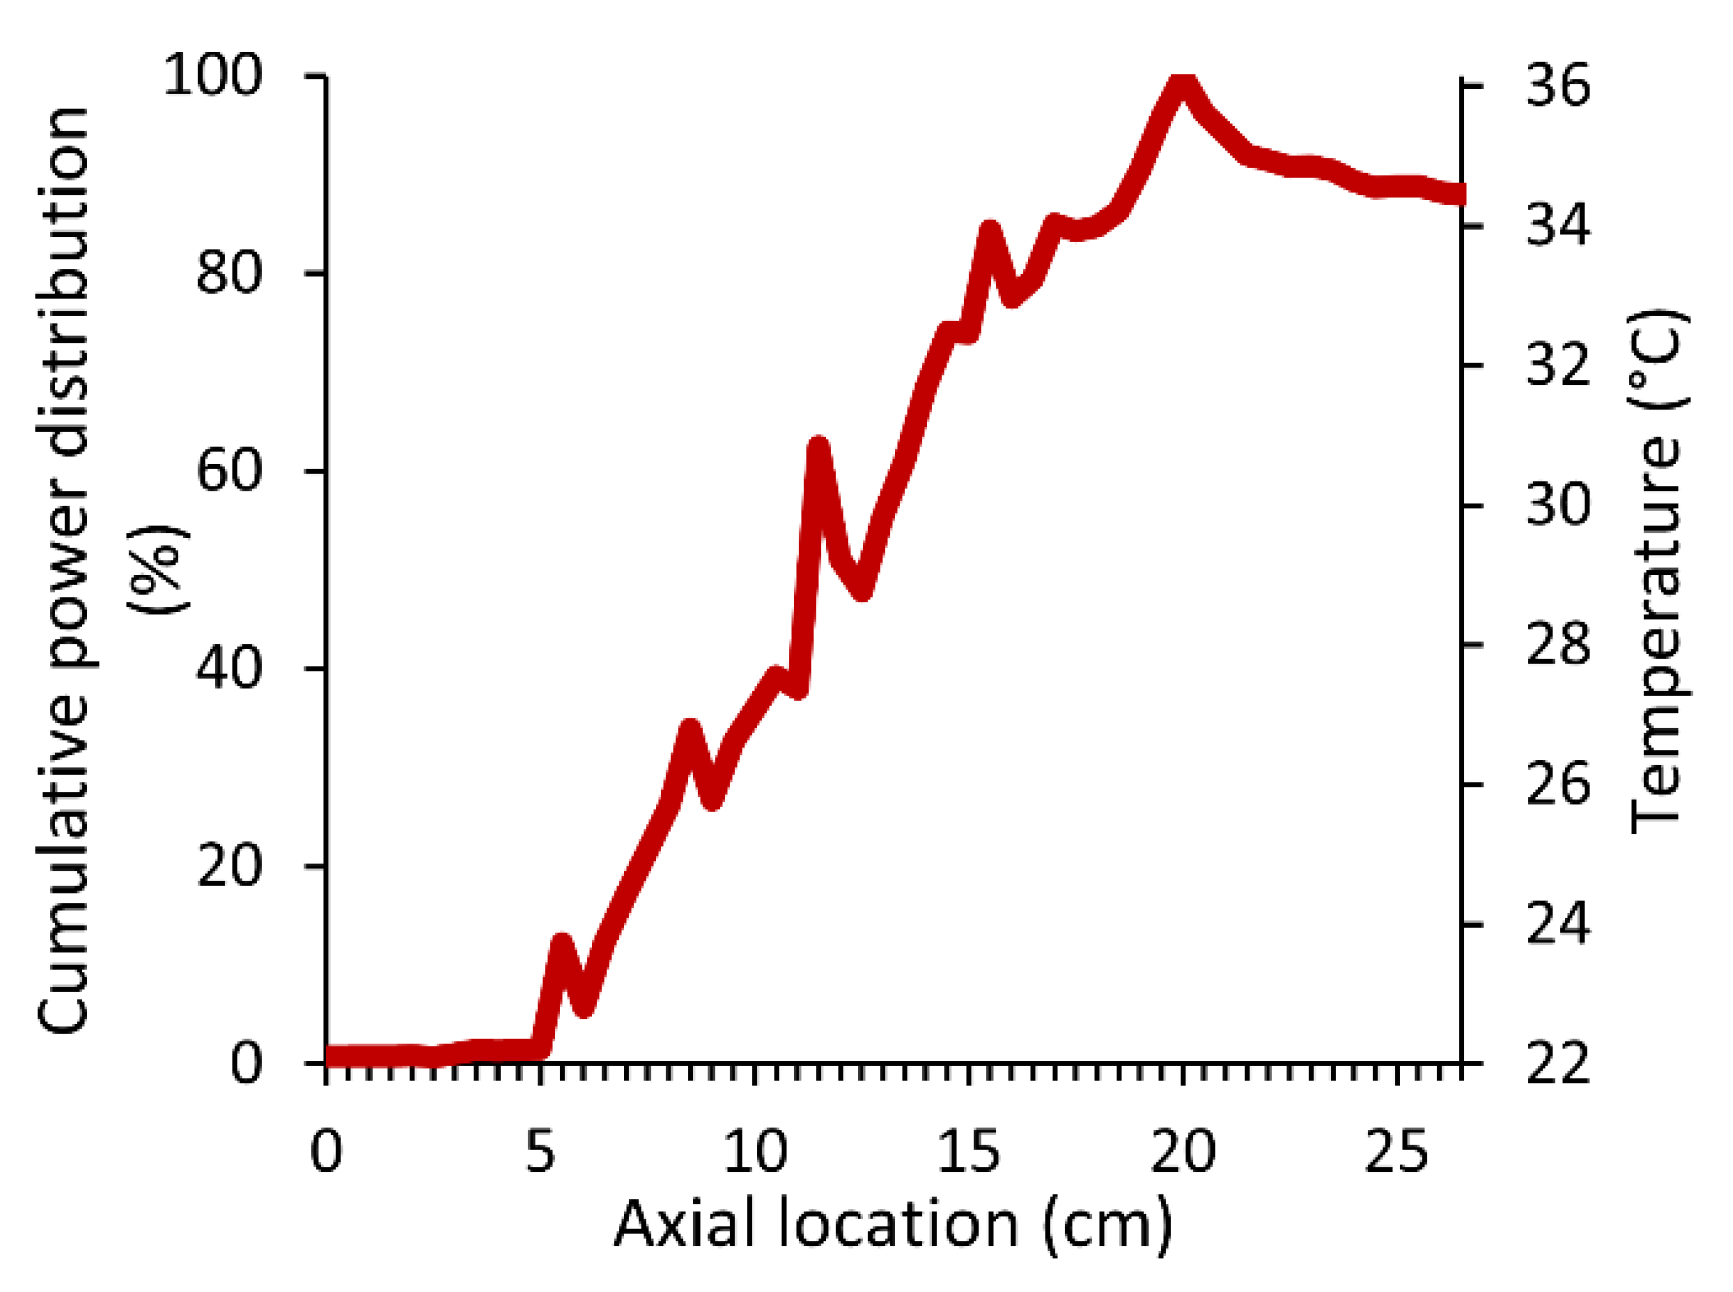
Appendix A. Characterization of the Ultrasonic Field

The ultrasonic nucleator was characterized using three methods to determine the location of the nodes and antinodes of the wave along the length of the nucleator. First, the characterization was performed calorimetrically by moving a TC-08 thermocouple along the length of the tube in steps of 0.5 mm. The temperature increase along the length is proportional to the ultrasonic power. The second method was a verification method based on the erosion of aluminum foil. Aluminum foil was placed in the nucleator and sonicated for 10 min, then afterwards the erosion spots were compared to the calorimetric method and verified the results. The third method was by evaluating the erosion damage on a 4.8 × 1.1 mm glass tube. The first two characterization methods were performed in a 4.0 × 1.0 mm PFA tube. In the actual experiments, glass was always used, as in preliminary experiments clogging always occurred at the entrance or exit of the nucleator when working with PFA. This was established for three diameters: 1.6 × 0.8 mm, 2.0 × 1.0 mm and 3.0 × 1.5 mm.
Figure A1 shows where the ultrasonic power is mostly dissipated along the length of the nucleator according to the calorimetric method. Most of the power is dissipated in a 15 cm long zone in the center of the nucleator. In this zone, five small zones, which are likely the antinodes of the ultrasonic wave, are responsible for most of the power dissipation as most of the heat is generated here. In some zones, there is little energy being dissipated and the heat transfer with the cooling system of the nucleator, which was set at 22 °C, exceeded this energy, resulting in a temperature decrease. These observations were also verified based on the aluminum erosion method and also the erosion on the glass tube, which can be seen in Figure A2, corresponds with these zones. It is unclear whether these zones are responsible for the long time to reach a steady state. Other researchers such as Valitov et al. and Rossi worked with a tube under an ultrasonic probe and only found one zone [22,35].
Figure A1. The cumulative ultrasonic power distribution along the length of the ultrasonic nucleator. The power distribution is derived from the temperature increase and the nucleator is 26.5 cm long from the left to right.
Crystals 11 01054 g0a1
Figure A2. Erosion on the inside of a 4.8 mm (ID) × 7 mm (OD) glass tube after being exposed to the highest amplitude for 2–4 h. The white zones show erosion of glass. Smaller tubes (4 mm OD) hardly showed any erosion.
Crystals 11 01054 g0a2

References

  1. Jiang, M.; Zhu, Z.; Jimenez, E.; Papageorgiou, C.D.; Waetzig, J.; Hardy, A.; Langston, M.; Braatz, R.D. Continuous-flow tubular crystallization in slugs spontaneously induced by hydrodynamics. Cryst. Growth Des. 2014, 14, 851–860. [Google Scholar] [CrossRef]
  2. Yang, Y.; Song, L.; Zhang, Y.; Nagy, Z.K. Application of wet milling-based automated direct nucleation control in continuous cooling crystallization processes. Ind. Eng. Chem. Res. 2016, 55, 4987–4996. [Google Scholar] [CrossRef]
  3. Shim, J.U.; Cristobal, G.; Link, D.R.; Thorsen, T.; Fraden, S. Using microfluidics to decouple nucleation and growth of protein crystals. Cryst. Growth Des. 2007, 7, 2192–2194. [Google Scholar] [CrossRef] [PubMed] [Green Version]
  4. Jiang, M.; Papageorgiou, C.D.; Waetzig, J.; Hardy, A.; Langston, M.; Braatz, R.D. Indirect ultrasonication in continuous slug-flow crystallization. Cryst. Growth Des. 2015, 15, 2486–2492. [Google Scholar] [CrossRef]
  5. Yazdanpanah, N.; Nagy, Z.K. Handbook of Continuous Crystallization; Royal Society of Chemistry: London, UK, 2019; Volume 53, ISBN 9788578110796. [Google Scholar]
  6. Vancleef, A.; Seurs, S.; Jordens, J.; Van Gerven, T.; Thomassen, L.C.J.; Braeken, L. Reducing the Induction Time Using Ultrasound and High-Shear Mixing in a Continuous Crystallization Process. Crystals 2018, 8, 326. [Google Scholar] [CrossRef] [Green Version]
  7. Hussain, M.N.; Jordens, J.; John, J.J.; Braeken, L.; Van Gerven, T. Enhancing pharmaceutical crystallization in a flow crystallizer with ultrasound: Anti-solvent crystallization. Ultrason. Sonochem. 2019, 59, 104743. [Google Scholar] [CrossRef]
  8. Ezeanowi, N.; Pajari, H.; Laitinen, A.; Koiranen, T. Monitoring the Dynamics of a Continuous Sonicated Tubular Cooling Crystallizer. Cryst. Growth Des. 2020, 20, 1458–1466. [Google Scholar] [CrossRef]
  9. Dennehy, R.D. Particle Engineering Using Power Ultrasound. Org. Process Res. Dev. 2003, 7, 1002–1006. [Google Scholar] [CrossRef]
  10. Narducci, O.; Jones, A.G.; Kougoulos, E. Continuous crystallization of adipic acid with ultrasound. Chem. Eng. Sci. 2011, 66, 1069–1076. [Google Scholar] [CrossRef]
  11. Liu, Y.; Van Den Berg, M.H.; Alexander, A.J. Supersaturation dependence of glycine polymorphism using laser-induced nucleation, sonocrystallization and nucleation by mechanical shock. Phys. Chem. Chem. Phys. 2017, 19, 19386–19392. [Google Scholar] [CrossRef] [Green Version]
  12. Yang, Y.; Song, L.; Gao, T.; Nagy, Z.K. Integrated Upstream and Downstream Application of Wet Milling with Continuous Mixed Suspension Mixed Product Removal Crystallization. Cryst. Growth Des. 2015, 15, 5879–5885. [Google Scholar] [CrossRef]
  13. Rimez, B.; Debuysschère, R.; Scheid, B. On the effect of flow restrictions on the nucleation behavior of molecules in tubular flow Nucleators. J. Flow Chem. 2020, 10, 241–249. [Google Scholar] [CrossRef]
  14. Conte, J.; Lecomte-norrant, E.; Gourdon, C.; Rimez, B.; Debuyssche, R.; Cognet, P.; Scheid, B. Continuous-Flow Tubular Crystallization To Discriminate between Two Competing Crystal Polymorphs. 1. Cooling Crystallization. Cryst. Growth Des. 2018, 18, 6431–6439. [Google Scholar] [CrossRef]
  15. Jamshidi, R.; Rossi, D.; Saffari, N.; Gavriilidis, A.; Mazzei, L. Investigation of the Effect of Ultrasound Parameters on Continuous Sonocrystallization in a Millifluidic Device. Cryst. Growth Des. 2016, 16, 4607–4619. [Google Scholar] [CrossRef]
  16. Jordens, J.; Gielen, B.; Xiouras, C.; Hussain, M.N.; Stefanidis, G.D.; Thomassen, L.C.J.; Braeken, L.; Van Gerven, T. Sonocrystallisation: Observations, theories and guidelines. Chem. Eng. Process.-Process Intensif. 2019, 139, 130–154. [Google Scholar] [CrossRef]
  17. Kudo, S.; Takiyama, H. Production of fine organic crystalline particles by using milli segmented flow crystallizer. J. Chem. Eng. Jpn. 2012, 45, 305–309. [Google Scholar] [CrossRef]
  18. Furuta, M.; Mukai, K.; Cork, D.; Mae, K. Continuous crystallization using a sonicated tubular system for controlling particle size in an API manufacturing process. Chem. Eng. Process. Process Intensif. 2016, 102, 210–218. [Google Scholar] [CrossRef]
  19. Eder, R.J.P.; Schrank, S.; Besenhard, M.O.; Roblegg, E.; Gruber-Woelfler, H.; Khinast, J.G. Continuous sonocrystallization of acetylsalicylic acid (ASA): Control of crystal size. Cryst. Growth Des. 2012, 12, 4733–4738. [Google Scholar] [CrossRef]
  20. Jordens, J.; Canini, E.; Gielen, B.; Van Gerven, T.; Braeken, L. Ultrasound Assisted Particle Size Control by Continuous Seed Generation and Batch Growth. Crystals 2017, 7, 195. [Google Scholar] [CrossRef]
  21. Rossi, D. Adipic Acid Sonocrystallization in Continuous Flow Microchannels; Universtiy Colledge London: London, UK, 2017. [Google Scholar]
  22. Valitov, G.; Jamshidi, R.; Rossi, D.; Gavriilidis, A.; Mazzei, L. Effect of acoustic streaming on continuous flow sonocrystallization in millifluidic channels. Chem. Eng. J. 2020, 379, 122221. [Google Scholar] [CrossRef]
  23. Jordens, J.; Gielen, B.; Braeken, L.; Van Gerven, T. Determination of the effect of the ultrasonic frequency on the cooling crystallization of paracetamol. Chem. Eng. Process.-Process Intensif. 2014, 84, 38–44. [Google Scholar] [CrossRef] [Green Version]
  24. Lee, J.; Ashokkumar, M.; Kentish, S.E. Influence of mixing and ultrasound frequency on antisolvent crystallisation of sodium chloride. Ultrason. Sonochem. 2014, 21, 60–68. [Google Scholar] [CrossRef] [PubMed]
  25. Kaur Bhangu, S.; Ashokkumar, M.; Lee, J. Ultrasound Assisted Crystallization of Paracetamol: Crystal Size Distribution and Polymorph Control. Cryst. Growth Des. 2016, 16, 1934–1941. [Google Scholar] [CrossRef]
  26. Pishchalnikov, Y.A.; Gutierrez, J.; Dunbar, W.W.; Philpott, R.W. Intense cavitation at extreme static pressure. Ultrasonics 2016, 65, 380–389. [Google Scholar] [CrossRef] [PubMed] [Green Version]
  27. Shah, Y.T.; Pandit, A.B.; Moholkar, V.S. Factors Affecting Cavitation Behavior. In Cavitation Reaction Engineering; Springer: Boston, MA, USA, 1999; pp. 55–83. [Google Scholar] [CrossRef]
  28. Apfel, R.E. The role of impurities in cavitation-threshold determination. J. Acoust. Soc. Am. 1970, 48, 1179–1186. [Google Scholar] [CrossRef]
  29. Gaivoronskii, A.N.; Granzhan, V.A. Physicochemical Studies of Systems and Processes Solubility of Adipic Acid in Organic Solvents and Water. Russ. J. Appl. Chem. 2005, 78, 404–408. [Google Scholar] [CrossRef]
  30. Schindelin, J.; Arganda-Carreras, I.; Frise, E.; Kaynig, V.; Longair, M.; Pietzsch, T.; Preibisch, S.; Rueden, C.; Saalfeld, S.; Schmid, B.; et al. Fiji: An open-source platform for biological-image analysis. Nat. Methods 2012, 9, 676–682. [Google Scholar] [CrossRef] [Green Version]
  31. Vancleef, A.; Maes, D.; Van Gerven, T.; Thomassena, L.C.J.; Braeken, L. Flow-through microscopy and image analysis for crystallization processes. Chem. Eng. Sci. 2020. accepted. [Google Scholar]
  32. Randolph, A.D.; Larson, M.A. Theory of Particulate Processes: Analysis and Techniques of Continuous Crystallisation; Elsevier: Amsterdam, The Netherlands, 1971. [Google Scholar]
  33. Gielen, B.; Jordens, J.; Thomassen, L.; Braeken, L.; Van Gerven, T. Agglomeration Control during Ultrasonic Crystallization of an Active Pharmaceutical Ingredient. Crystals 2017, 7, 40. [Google Scholar] [CrossRef] [Green Version]
  34. Jiang, S.; Ter Horst, J.H. Crystal nucleation rates from probability distributions of induction times. Cryst. Growth Des. 2011, 11, 256–261. [Google Scholar] [CrossRef]
  35. Rossi, D.; Jamshidi, R.; Saffari, N.; Kuhn, S.; Gavriilidis, A.; Mazzei, L. Continuous-Flow Sonocrystallization in Droplet-Based Microfluidics. Cryst. Growth Des. 2015, 15, 5519–5529. [Google Scholar] [CrossRef]
Figure 1. Experimental setup for the evaluation of the nucleation rate in an ultrasonic nucleator.
Crystals 11 01054 g001
Figure 2. Particles used to calibrate the aggregation degree. The images are all 153 µm wide.
Crystals 11 01054 g002
Figure 3. Nucleation rate and particle size over time after starting sonication (at time 0), (residence time = 2.6 s).
Crystals 11 01054 g003
Figure 4. (a) Particle size distribution of the particles exiting the nucleator during the first 10 min of the experiment; (b) microscope image of particles exiting the nucleator using the inline microscope.
Crystals 11 01054 g004
Figure 5. Influence of the supersaturation on (a) the nucleation rate, and (b) the aggregation degree.
Crystals 11 01054 g005
Figure 6. Influence of the flow rate and the residence time on the nucleation rate (a), and the total number of formed nuclei in the ultrasound-irradiated zone (b).
Crystals 11 01054 g006
Figure 7. Nucleation rate in function of (a) the ultrasonic amplitude, and (b) the calorimetric ultrasonic power.
Crystals 11 01054 g007
Figure 8. (a) Influence of the static pressure on the calorimetric ultrasonic power at different ultrasonic amplitudes. Error bars indicate the standard deviation on multiple measurements; (b) Nucleation rate experiment where the static pressure in the ultrasonic nucleator was adjusted to 2.2 bar after 10 min.
Crystals 11 01054 g008
Table 1. Classification of the particles into different categories according to the proposed method.
InputClassification Output
CategoriesNumberSingle Crystals2 Nuclei3–5 Nuclei6–11
Nuclei
11–20 Nuclei21–30 Nuclei
Single crystals11195132100
2 nuclei433188671
3–5 nuclei19015733
6–10 nuclei20014780
11–20 nuclei20014780
21–30 nuclei210100713
Table 2. Experimental setup for the evaluation of the nucleation rate in an ultrasonic nucleator. The dilution ratio and the sample size for the supersaturation experiments correspond with their respective supersaturation experiment.
Supersaturation ExperimentsResidence Time ExperimentsUltrasonic Power
Experiments
Supersaturation (-)1.25–1.43–1.6–1.8–2.01.431.43
Flow rate (mL/min)2111 → 28 (steps of 1)–
30–35–40
21
Ultrasound amplitude (%)10010020 → 100 (steps of 10)
Cooling methodIn nucleatorBefore nucleatorBefore nucleator
Thermostatic bath temperature (°C)402222
Nucleator cooling system temperature (°C)221.621.6
Nucleator outlet temperature (°C)222222
Static pressure (bara)111
Dilution solution A ratio0–0.72–1.4–2.2–3.011
Dilution solution B ratio111
n (sample size)3–3–2–2–31 for each experiment1 for each experiment
Table 3. Relevant parameters for the scale-up experiment.
Scale-Up Factor15
Flow rate (mL/min)21104
Residence time (s)2.62.6
Diameter glass tube (mm)2.154.8
Ultrasonic Amplitude (%)10061
Calorimetric ultrasonic power (W)2.210.4
Calorimetric power per unit of volume (W/mL)0.40.4
Electrical power (W)33.435.5
Table 4. Scale-up experiments at a constant ultrasonic power/volume and residence time.
Scale-Up Factor15
Flow rate (mL/min)21104
Nucleation rate (mL−1s−1)1.3 × 1053.8 × 105
Nuclei (mL−1)3.3 × 1059.8 × 105
Publisher’s Note: MDPI stays neutral with regard to jurisdictional claims in published maps and institutional affiliations.

