Article

Energy Transfer and Cross-Relaxation Induced Efficient 2.78 μm Emission in Er3+/Tm3+: PbF2 mid-Infrared Laser Crystal

1
Guangdong Provincial Key Laboratory of Optical Fiber Sensing and Communications, Guangzhou 510630, China
2
Guangdong Provincial Engineering Research Center of Crystal and Laser Technology, Guangzhou 510632, China
3
Department of Optoelectronic Engineering, Jinan University, Guangzhou 510632, China
4
Key Laboratory of High Power Laser Materials, Shanghai Institute of Optics and Fine Mechanics, Chinese Academy of Sciences, Shanghai 201800, China
5
Guangdong Provincial Key Laboratory of Industrial Ultrashort Pulse Laser Technology, Shenzhen 518055, China
*
Author to whom correspondence should be addressed.
These authors contribute equally to this work.
Crystals 2021, 11(9), 1024; https://doi.org/10.3390/cryst11091024
Submission received: 22 July 2021 / Revised: 15 August 2021 / Accepted: 24 August 2021 / Published: 26 August 2021
(This article belongs to the Special Issue Advances in Middle Infrared Laser Crystals and Its Applications)

Abstract

:
An efficient enhancement of 2.78 μm emission from the transition of Er3+: 4I11/24I13/2 by Tm3+ introduction in the Er/Tm: PbF2 crystal was grown by the Bridgman technique for the first time. The spectroscopic properties, energy transfer mechanism, and first-principles calculations of as-grown crystals were investigated in detail. The co-doped Tm3+ ion can offer an appropriate sensitization and deactivation effect for Er3+ ion at the same time in PbF2 crystal under the pump of conventional 800 nm laser diodes (LDs). With the introduction of Tm3+ ion into the Er3+: PbF2 crystal, the Er/Tm: PbF2 crystal exhibited an enhancing 2.78 μm mid-infrared (MIR) emission. Furthermore, the cyclic energy transfer mechanism that contains several energy transfer processes and cross-relaxation processes was proposed, which would well achieve the population inversion between the Er3+: 4I11/2 and Er3+: 4I13/2 levels. First-principles calculations were performed to find that good performance originates from the uniform distribution of Er3+ and Tm3+ ions in PbF2 crystal. This work will provide an avenue to design MIR laser materials with good performance.

1. Introduction

Over the past several decades, mid-infrared (MIR) solid-state lasers operating around 2.7–3 μm have received extensive attention for numerous applications in medicine surgery, communications, remote sensing, pollution monitoring, and military countermeasures, etc. [1,2,3,4,5]. Additionally, 2.7–3 μm lasers are suitable pump sources for longer wavelength mid-infrared or long-infrared (8–12 μm) laser applications utilizing the optical parametric oscillators [6,7].
Up to now, many kinds of rare-earth ions in favorable ~3 µm MIR emissions have been analyzed, such as erbium ion (Er3+): 4I11/24I13/2 [8], holmium ion (Ho3+): 5I65I7 [9], and dysprosium ion (Dy3+): 6H13/26H15/2 [10]. Among them, the Er3+ ion-doped single crystal has been deemed as the effective source for ~3 µm laser operation, benefiting from its abundant energy levels, such as GSGG [11], YSGG [12], YAP [13], Lu2O3 [14], GdScO3 [15], SrF2 crystals [16], NdVO4 [17], InVO4 crystals [18], etc. As investigated, the Er3+ ion can be directly pumped utilizing 808 or 980 nm commercial laser diodes (LDs) corresponding to Er3+ ion absorption transitions from ground state 4I15/2 to 4I9/2, 4I11/2 levels, respectively. To take further advantage of this, a co-doping suitable sensitization ion having strong absorption around 980 nm or 800 nm would improve the absorption efficiency, such as Yb3+, Nd3+, or Tm3+ ions [19,20,21]. However, the fluorescence lifetime of the 4I11/2 level (the upper) is fairly shorter than that of the 4I13/2 level (the lower) of Er3+ ion, causing the possible termination of 2.7 μm mid-infrared emissions [22]. Therefore, the shortcoming of the intrinsic self-terminating “bottleneck” effect of Er3+ ion is important to consider. On one hand, the self-terminating “bottleneck” effect can be restrained by the energy transfer up-conversion (UC) process: 2 4I13/24I15/2 + 4I9/2, which needs heavy doping of Er3+ ion (>30 at.% ). The UC process can simultaneously depopulate the 4I13/2 level and populate the 4I11/2 level via non-radiative transition from 4I9/2 to 4I11/2 levels. However, excessive Er3+ doping concentrations will generate the inclusion defects in as-grown crystal and degenerate the crystal quality and thermal performance, which is not conducive to laser output efficiency [23,24]. On the other hand, we can focus attention on co-doping a suitable deactivation ion for Er3+ ion to suppress the self-terminating effect, such as Pr3+, Ho3+, Dy3+, or Tm3+ ions [25,26,27,28]. These deactivation ions can dramatically reduce the population of lower Er3+: 4I13/2 levels, thereby achieving efficient 2.7 μm mid-infrared emission. Based on the above investigation, it is noteworthy that Tm3+ ion can simultaneously serve as sensitization and deactivation effects for Er3+ ion [29,30].
In recent years, fluoride crystals have attracted numerous attention in the field of mid-infrared lasers, such as the β-PbF2 crystal [31]. The PbF2 crystal exhibits its intrinsic advantages. The PbF2 crystal has lower phonon energy (257 cm−1), compared with GdLiF4 (432 cm−1), LiYF4 (442 cm−1), LuLiF4 (400 cm−1) and BaY2F8 (415 cm−1) crystals [32,33,34]. Such low phonon energy is conducive to reducing the non-radiative transition probability and enhancing the spontaneous radiation transition probability between 4I11/2 and 4I13/2 levels of Er3+ ion [35]. Moreover, the PbF2 crystal is optically transparent in the region of 0.25–15 μm, which is broader than other fluoride crystals, such as LiYF4 (0.12–8.0 μm), BaY2F8 (0.2–9.5 μm), and KYF4 (0.15–9.0 μm). Additionally, another issue to consider is the physical properties of the material. Some fluoride crystals have low thermal conductivity, such as CaF2 and SrF2. The PbF2 crystal has high thermal conductivity (28 W/m/K) and stable mechanical and chemical properties [36,37]. Consequently, with these favorable characteristics, the PbF2 crystal may be selected as a promising host material.
In this paper, Er: PbF2, Tm: PbF2, Er/Tm: PbF2 crystals were successfully prepared by the Bridgman technique. The spectroscopic properties of prepared crystals were analyzed based on absorption spectra, emission spectra, and fluorescence decay curves. Compared with the Er: PbF2 crystal, the Er/Tm co-doped PbF2 crystal presents a larger 2.78 μm fluorescence emission intensity and higher fluorescence branching ratio. Moreover, theoretical calculations were performed to discover that the co-doping of the Tm3+ ion can make the Er3+ and Tm3+ ions more evenly distributed in PbF2 crystals, which can effectively break the local clusters of the Er3+ in Er: PbF2 crystal, thus ensuring efficient energy transfer between Er3+ and Tm3+ ions, and resulting in the enhancement of 2.78 μm MIR fluorescence emission.

2. Experimental Section

The 1.0 at.% Er: PbF2, 0.5 at.% Tm: PbF2, and 1.0 at.% Er/0.5 at.% Tm: PbF2 crystals were grown by the conventional Bridgman method in an atmosphere of N2 with intermediate molybdenum heating. The fluoride powders of the PbF2 (99.999%), ErF3 (99.999%), and TmF3 (99.999%) were all raw materials. The raw materials were weighed and thoroughly mixed. The process of crystal growth was similar to our previous work [37]. The melt was homogenized in a covered graphite crucible in a high-temperature zone at 1000 °C for 8 h, and the crystal growth process was driven by lowering the graphite crucible at a speed of 0.5 mm/h. After the growth process was completed, the cooling rate of the crystal was 30 °C/cm–40 °C/h. The actual concentration of Er3+ and Tm3+ ions in the grown samples were measured utilizing inductively coupled plasma atomic emission spectrometry (ICP-AES). The concentrations of Er3+ and Tm3+ ions in dual-doped Er/Tm: PbF2 crystal were 1.15 at.%, and 0.58 at.%, respectively. The concentration of Er3+ ion in the Er: PbF2 crystal was 1.15 at.%, and the concentration of Tm3+ ion in the Tm: PbF2 crystal was 0.59 at.%.
The crystalline structure of as-grown samples was observed utilizing D/max2550 X-ray diffraction (XRD) with Cu Kα radiation. The Perkin–Elmer UV-VIS-NIR spectrometer (Lambda 900) with a resolution of 1 nm was used to detect the absorption spectra of prepared samples in the range of 400–2200 nm. The emission spectra, up-conversion fluorescence spectra, and fluorescence decay curves were detected and recorded using the Edinburgh Instruments FLS920 and FSP920 spectrophotometers. The repetition frequency of the excitation pulse for measuring the fluorescence decay curves was set to 20 Hz, and the duration of the excitation pulses was 30s. All the measurements were performed at room temperature.

3. Calculation Method

In the framework of density functional theory, VASP codes and the plane-wave basis set method were used for calculation [38,39]. The mutual interactions were described by the projector augmented-wave pseudopotential with an exchange-correlation function (Perdew–Burke–Ernzerhof form) [40,41]. The cut-off was set at 550 eV and a 1 × 1 × 1 Gamma k-grid was used to guarantee the relaxation accuracy of 10−5 eV and 0.01 eVÅ−1 within a 2 × 2 × 2 supercell, respectively. The spin polarization was included in the calculations. According to the method reported previously [42], the formation energy (∆E) and cluster symbols were obtained. It is pointed that the energy correction of the PbF2 crystal was different from that of CaF2, SrF2, and BaF2 crystals. For a 2 × 2 × 2 supercell with a net charge, the calculated value in PbF2 crystal was 0.069 eV.

4. Results and Discussion

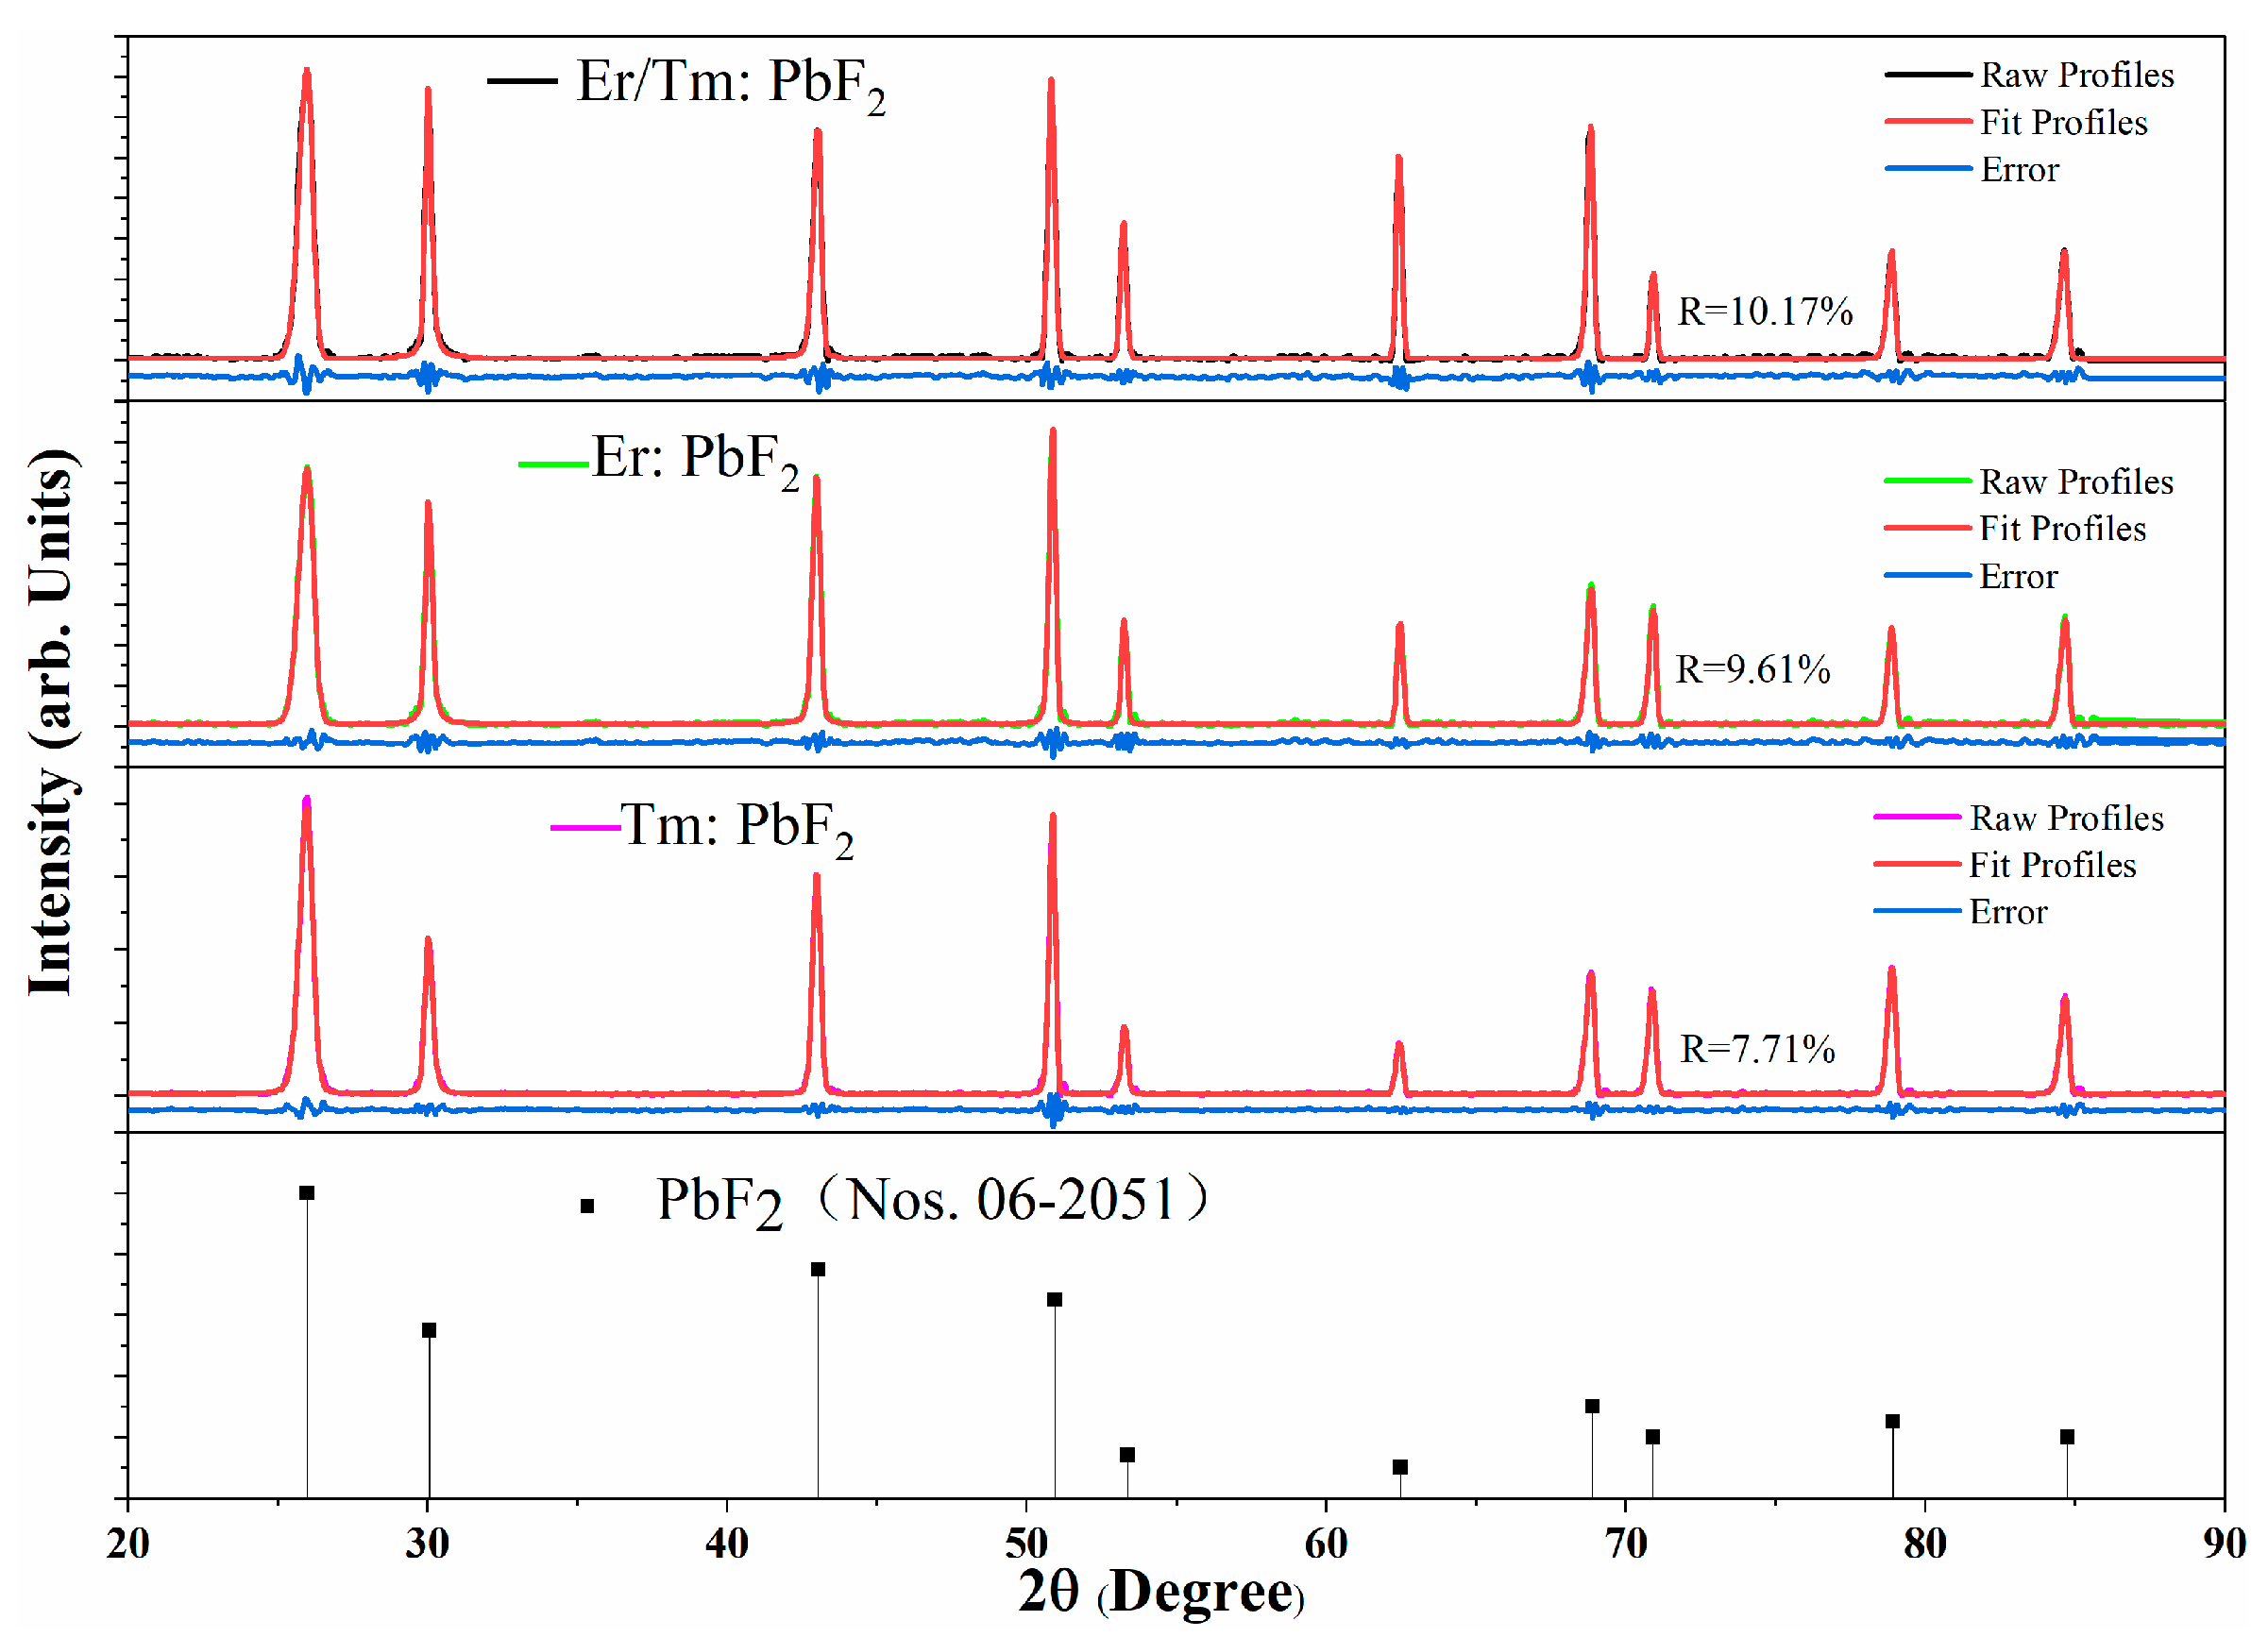
4.1. Crystal Structure Analysis

Figure 1 shows the XRD patterns and refined XRD patterns of the Er: PbF2, Tm: PbF2, Er/Tm: PbF2 crystals, and the JCPDS standard card of the PbF2 crystal (nos. 06-2051) [37]. The residuals of refinements (fit profiles shown in Figure 1) of Er: PbF2, Tm: PbF2, Er/Tm: PbF2 crystals were 9.61%, 7.71%, 10.17%, respectively. It is obvious that no clear shift in the phase diffraction peaks was observed and all XRD curves were well matched with the standard card of the β-PbF2 crystalline phase (nos. 06-2051). The results demonstrate successful co-doping of Er3+ and Tm3+ ions in PbF2 crystal without phase transitions.

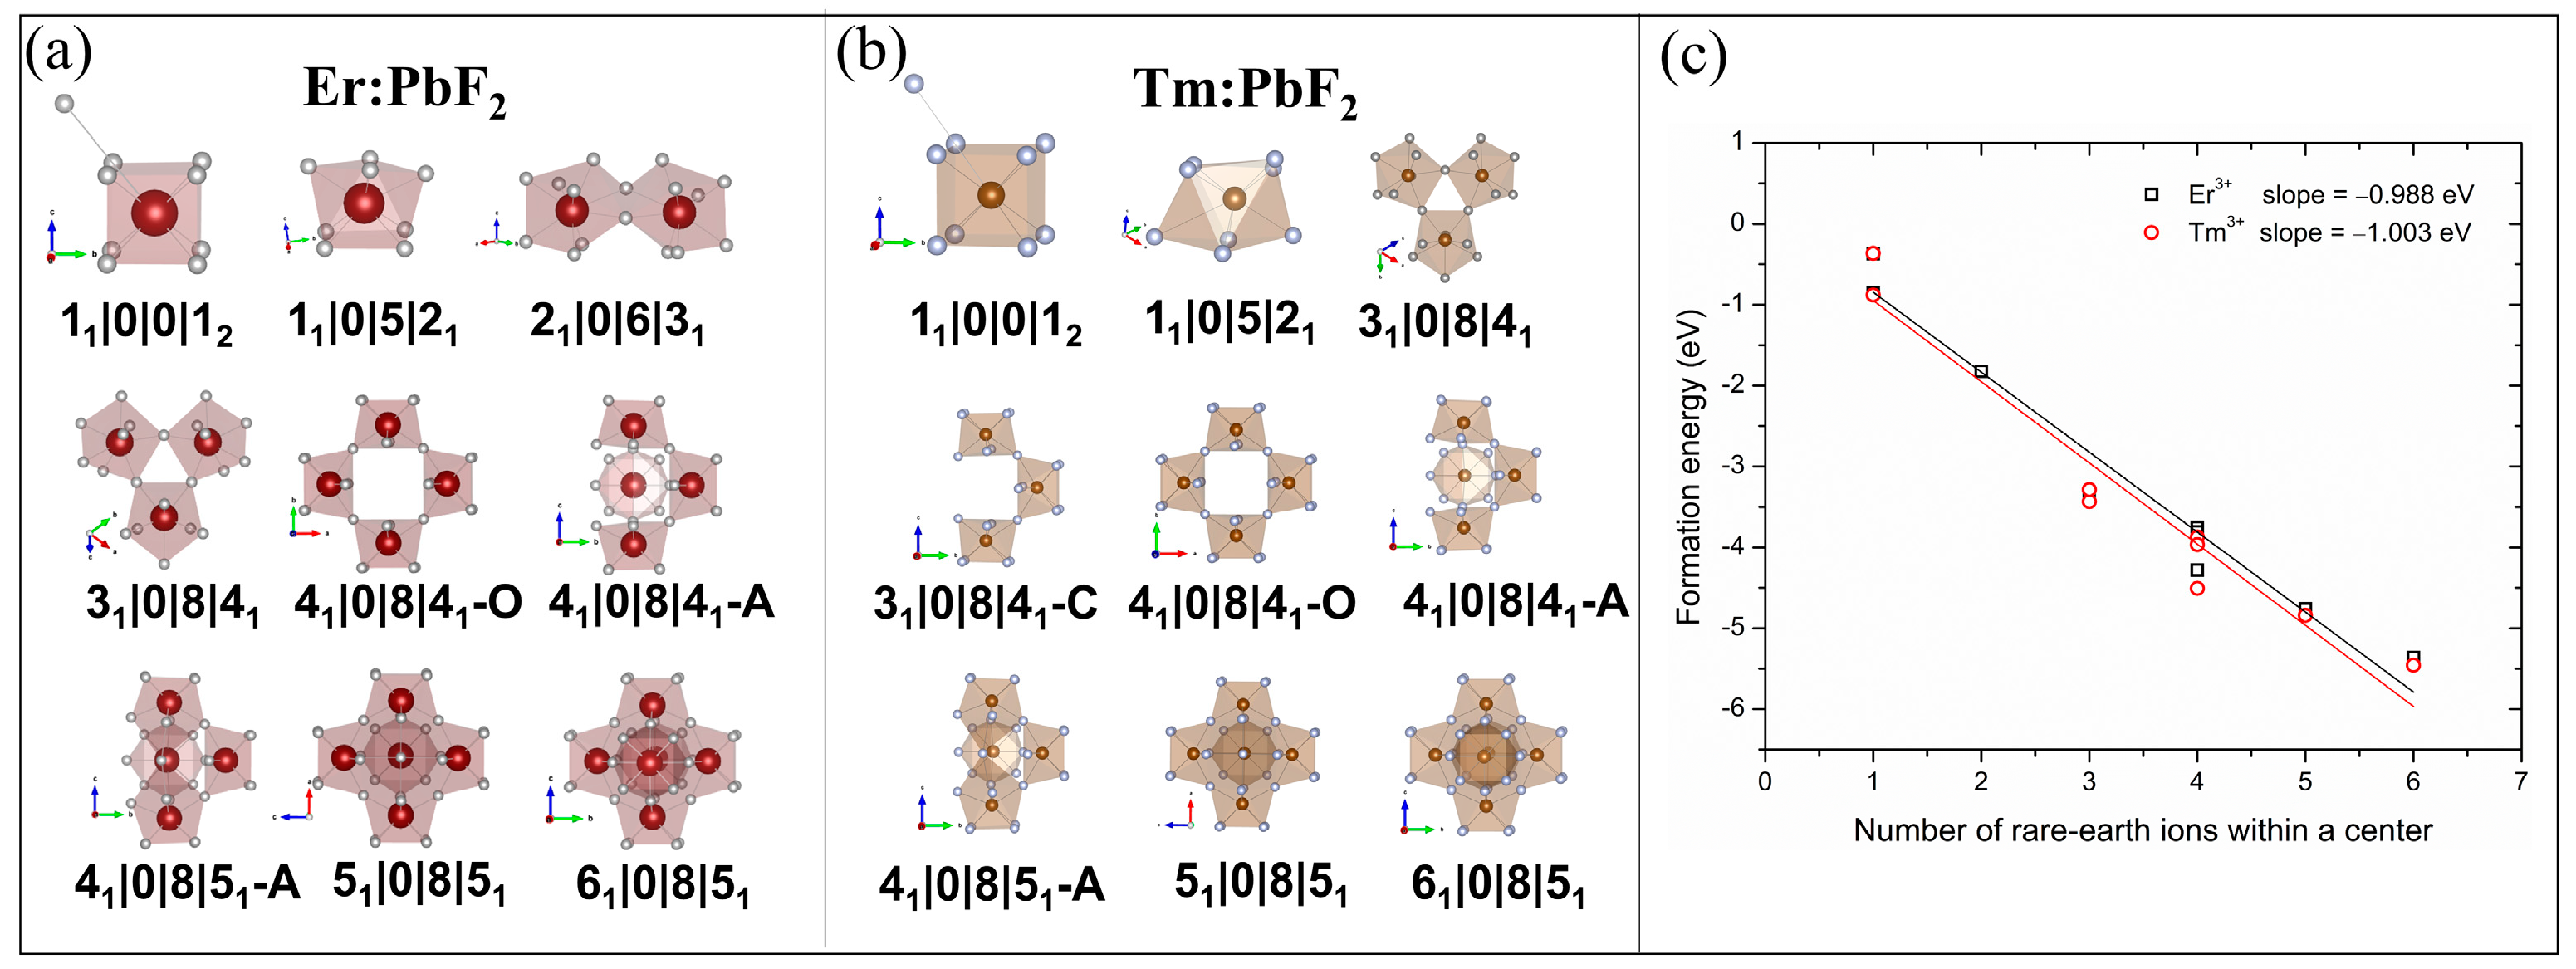
4.2. First-Principles Calculations

Based on the first-principal calculations, the cluster structure of Tm3+ and Er3+ ions were simulated to research the change of local structures of doping ions in PbF2 crystal. The possible thermodynamically stable Er3+ and Tm3+ centers in PbF2 crystals are shown in Figure 2a,b. It is clear to see that there are 9 different types of centers in each Tm: PbF2 and Er: PbF2 crystals. In particular, only the 31|0|8|41-C center in the Tm: PbF2 crystal varies from the 21|0|6|31 center in the Er: PbF2 crystal, and the other eight different types of centers in the Tm: PbF2 crystal are the same as the Er: PbF2 crystal. Moreover, Figure 2c shows the formation energy of Er3+ and Tm3+ versus the number of Er3+ and Tm3+ ions within a cluster, respectively. It can be seen that the slope of Er3+ clusters in PbF2 crystal is −0.988 eV, which is almost the same as the slope of Tm3+ clusters in the PbF2 crystal (−1.003 eV). These results indicate that the clustering characteristics of Er3+ and Tm3+ ions in PbF2 crystal are almost consistent. This phenomenon agreed well with the approximately equal segregator coefficients of Er3+ (1.15) and Tm3+ (1.16) in the Er/Tm: PbF2 crystal mentioned above, which may be owing to the slightly different ion radii between Er3+ (88.1 pm) and Tm3+ (86.9 pm) ions. That is to say, it can be considered that the Er3+ and Tm3+ ions replace Pb2+ ions with equal probability when they are co-doped in PbF2 crystal, which makes the Er3+ and Tm3+ ions more evenly distributed in the PbF2 crystal. The results suggest that the efficient energy transfer between Er3+ and Tm3+ ions can be guaranteed due to the uniform distribution of Er3+ and Tm3+ ions, and result in the enhancing of 2.78 μm MIR fluorescence emission in the ensuing discussion.

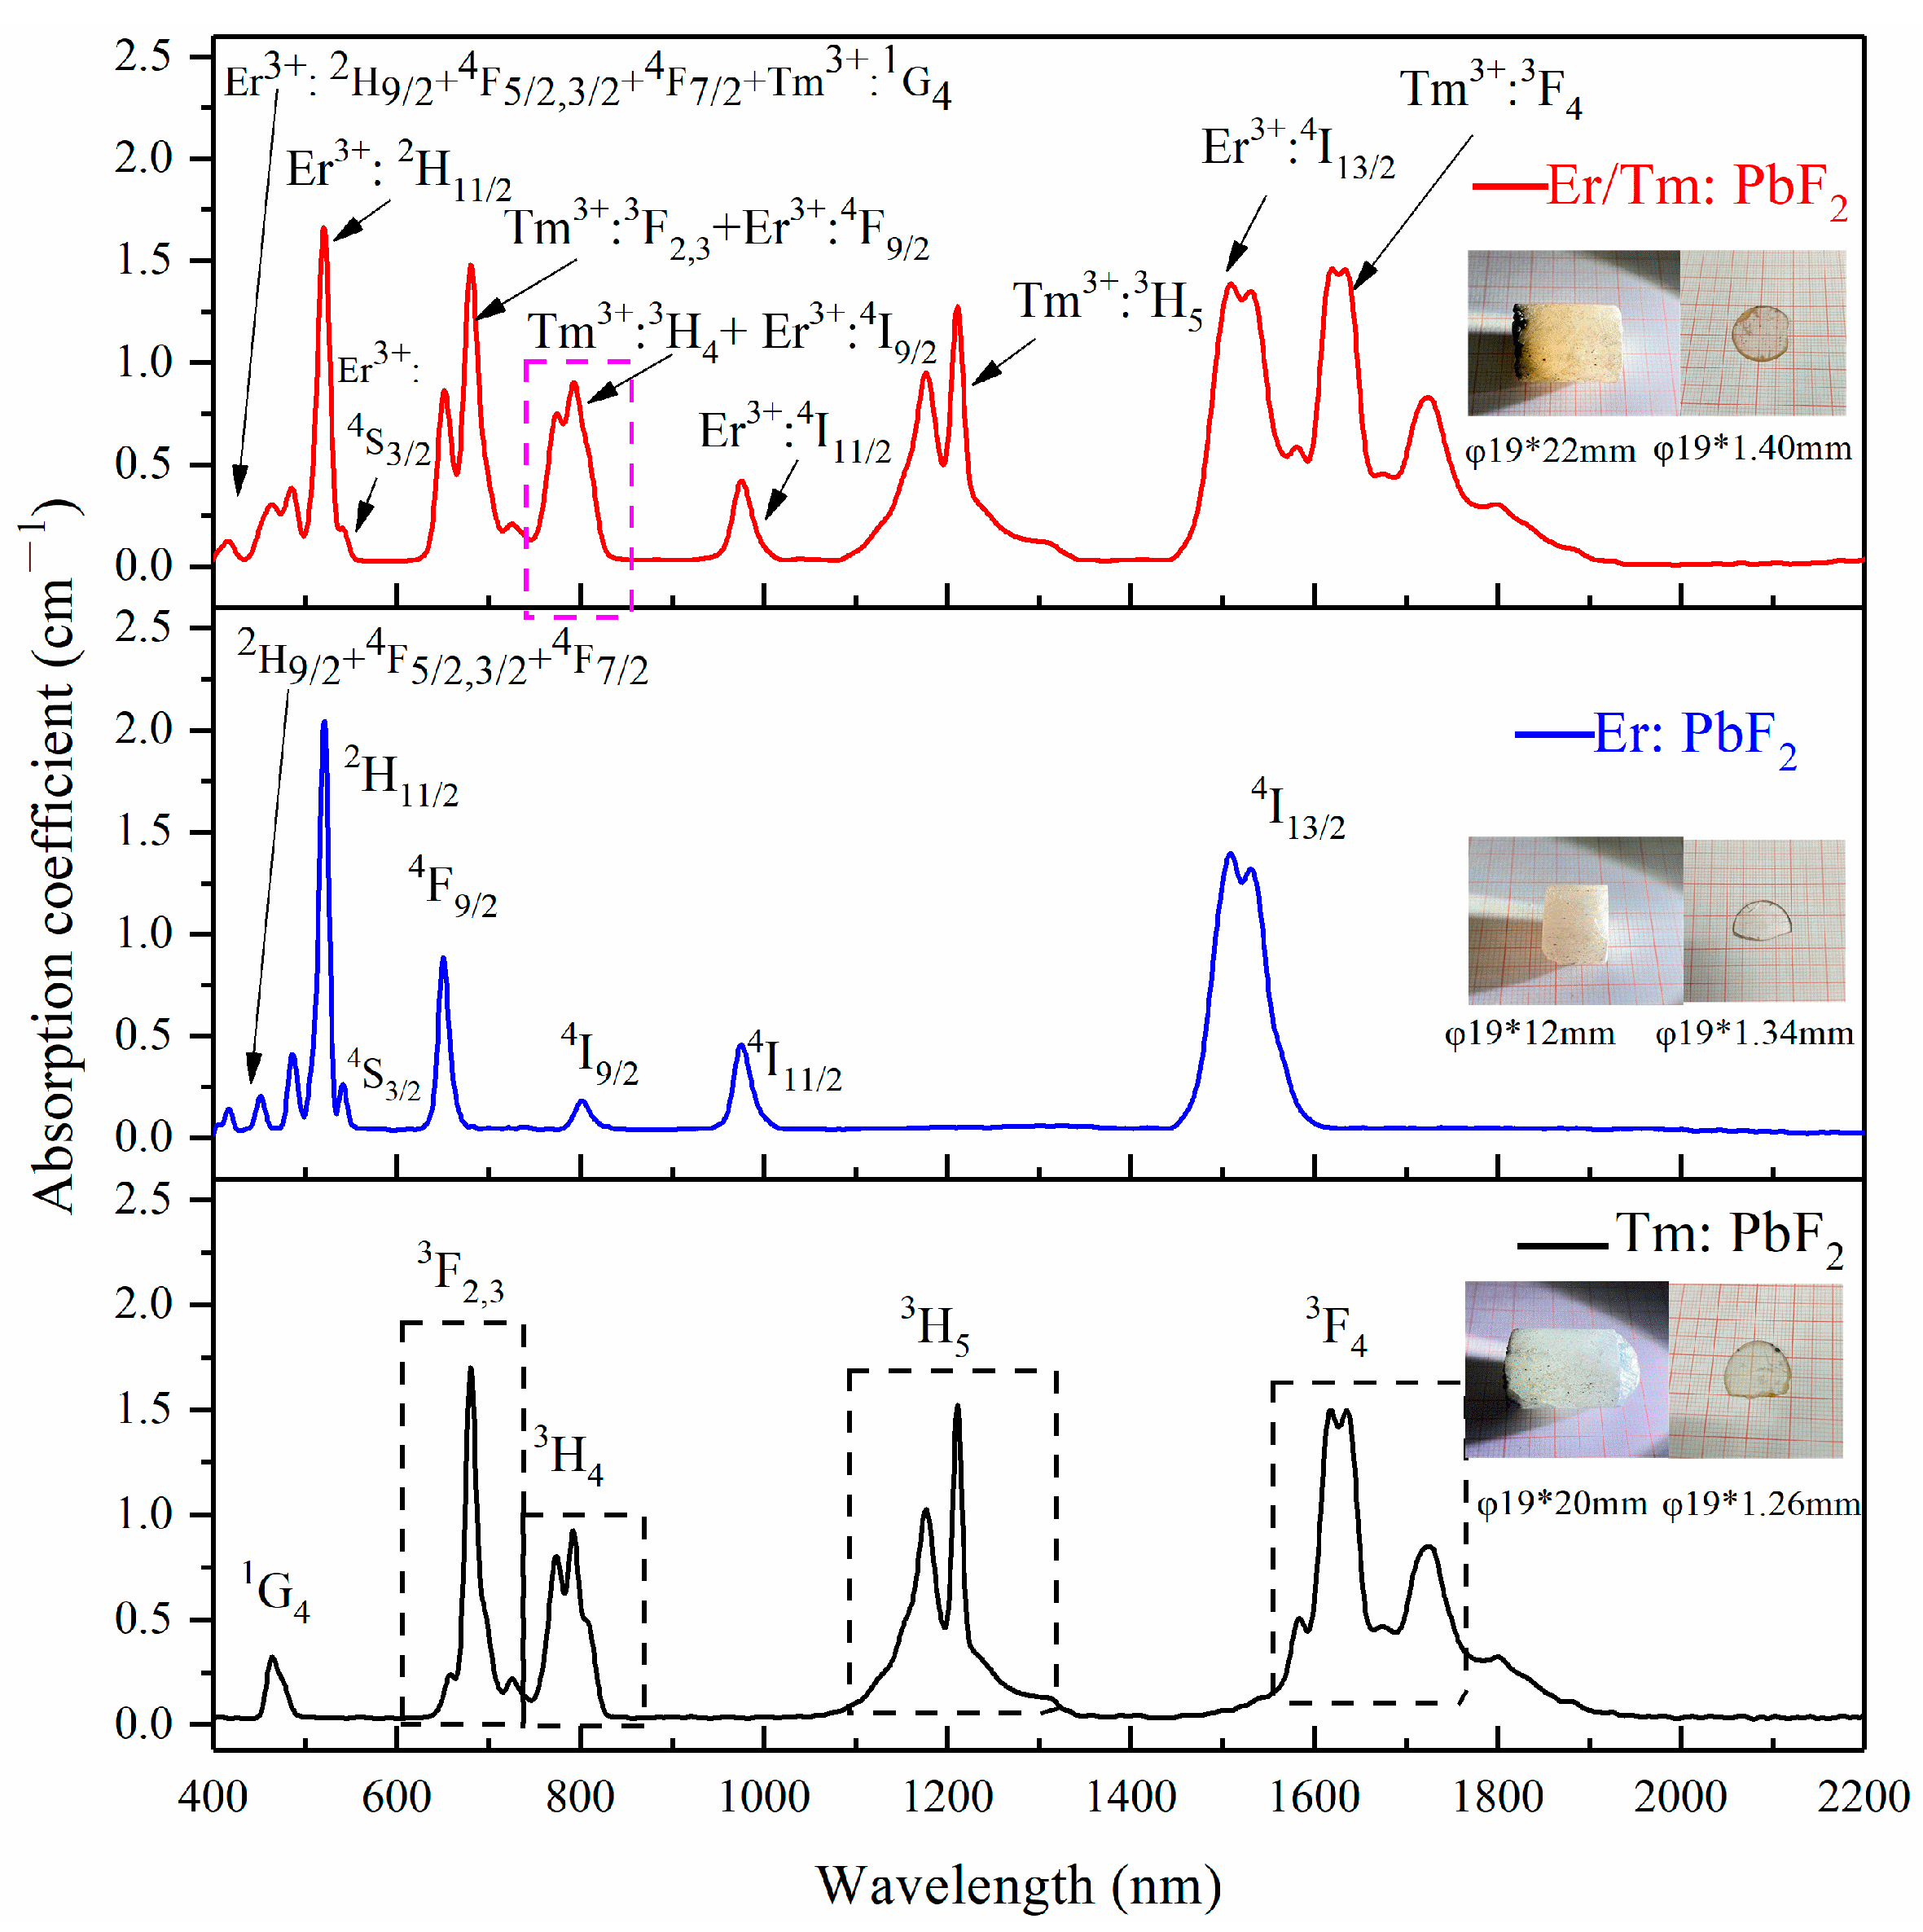
4.3. Absorption Spectroscopy

The illustrations in Figure 3 shows the photos of Er/Tm: PbF2, Er: PbF2, Tm: PbF2 crystals and their cut and polished crystal pieces; their sizes are also marked, respectively. It can be seen that all the crystal pieces are transparent and have no inclusions. Figure 3 illustrates the room temperature absorption spectra of Er: PbF2, Tm: PbF2, and Er/Tm: PbF2 crystals ranging from 400 nm to 2200 nm. Clearly, the typical absorption bands centered at approximately 417, 451, 486, 521, 541, 650, 802, 975, and 1509 nm in the Er: PbF2 crystal originated from the transitions from the ground state 4I15/2 level to upper-lying 2H9/2, 4F5/2,3/2, 4F7/2, 2H11/2, 4S3/2, 4F9/2, 4I9/2, 4I11/2 and 4I13/2 levels of Er3+ ion, respectively [37]. While in the Tm: PbF2 crystal mainly five absorption bands of Tm3+ ion are labeled, the absorption peaks centered at round 464, 680, 792, 1211, and 1618 nm are in accord with the transitions from ground state 3H6 level to upper-lying 1G4, 3F2,3, 3H4, 3H5 and 3F4 levels, respectively. Obviously, the huge absorption band centered at around 792 nm in the range of 750–830 nm corresponding to Tm3+: 3H63H4 transition well coincides with the wavelength of 808 nm AlGaAs LD pumping. The absorption bands in the Er/Tm: PbF2 crystal are altogether composed of the transitions of Er3+ and Tm3+ ions discussed above, indicating the successful introduction of both Er3+ and Tm3+ ions. Strong overlap between the Tm3+: 3H63H4 absorption transition and the Er3+: 4I15/24I9/2 absorption transition can be seen in the Er/Tm: PbF2 crystal. The absorption overlap indicates that a possible nonradiative energy transfer process Tm3+: 3H4 → Er3+: 4I9/2 would effectively occur for enhancing the absorption efficiency of Er3+ ion ~800 nm. Therefore, benefiting from the broad absorption band of Tm3+ ion centered at around LD pump wavelength and the possibility for energy transfer, the Tm3+ ion can act as a suitable sensitizer for Er3+ ion in the Er/Tm dual-doped PbF2 crystal.
For demonstrating the sensitization effect of Tm3+ ion for Er3+ ion via the Tm3+: 3H4 → Er3+: 4I9/2 energy transfer transition, the lifetimes of Tm3+: 3H4 level in the Tm3+ single-doped and Er/Tm dual-doped PbF2 crystals were measured and shown in Figure 4a,b, respectively. The decay curves were measured under the condition of 1.47 μm emission (Tm3+: 3H43F4) and 800 nm excitation (Tm3+: 3H63H4) and were all well fitted by single-exponential behavior. As shown in Figure 4a, the measured lifetime of the Tm3+: 3H4 manifold is 1.67 ms in the Tm: PbF2 crystal, while the lifetime is 0.54 ms in the Er/Tm: PbF2 crystal shown in Figure 4b. The remarkable decreasing lifetime in the Er/Tm: PbF2 crystal indicates the effective sensitization effect of the Tm3+ ion. The energy transfer efficiency from Tm3+: 3H4 to Er3+: 4I9/2 level can be calculated by the following equation: ηET1 = 1 − τEr/Tm/τTm, where τEr/Tm and τTm are the lifetimes of Tm3+: 3H4 level in Tm: PbF2, Er/Tm: PbF2 crystals, respectively. The high value of ηET1 (67.66%) confirms that the Tm3+ ion has a significant influence on Er3+: 4I9/2 level in PbF2 crystal, and can effectively act as a sensitizer for Er3+ ion for enhancing ~2.7 μm MIR emission.

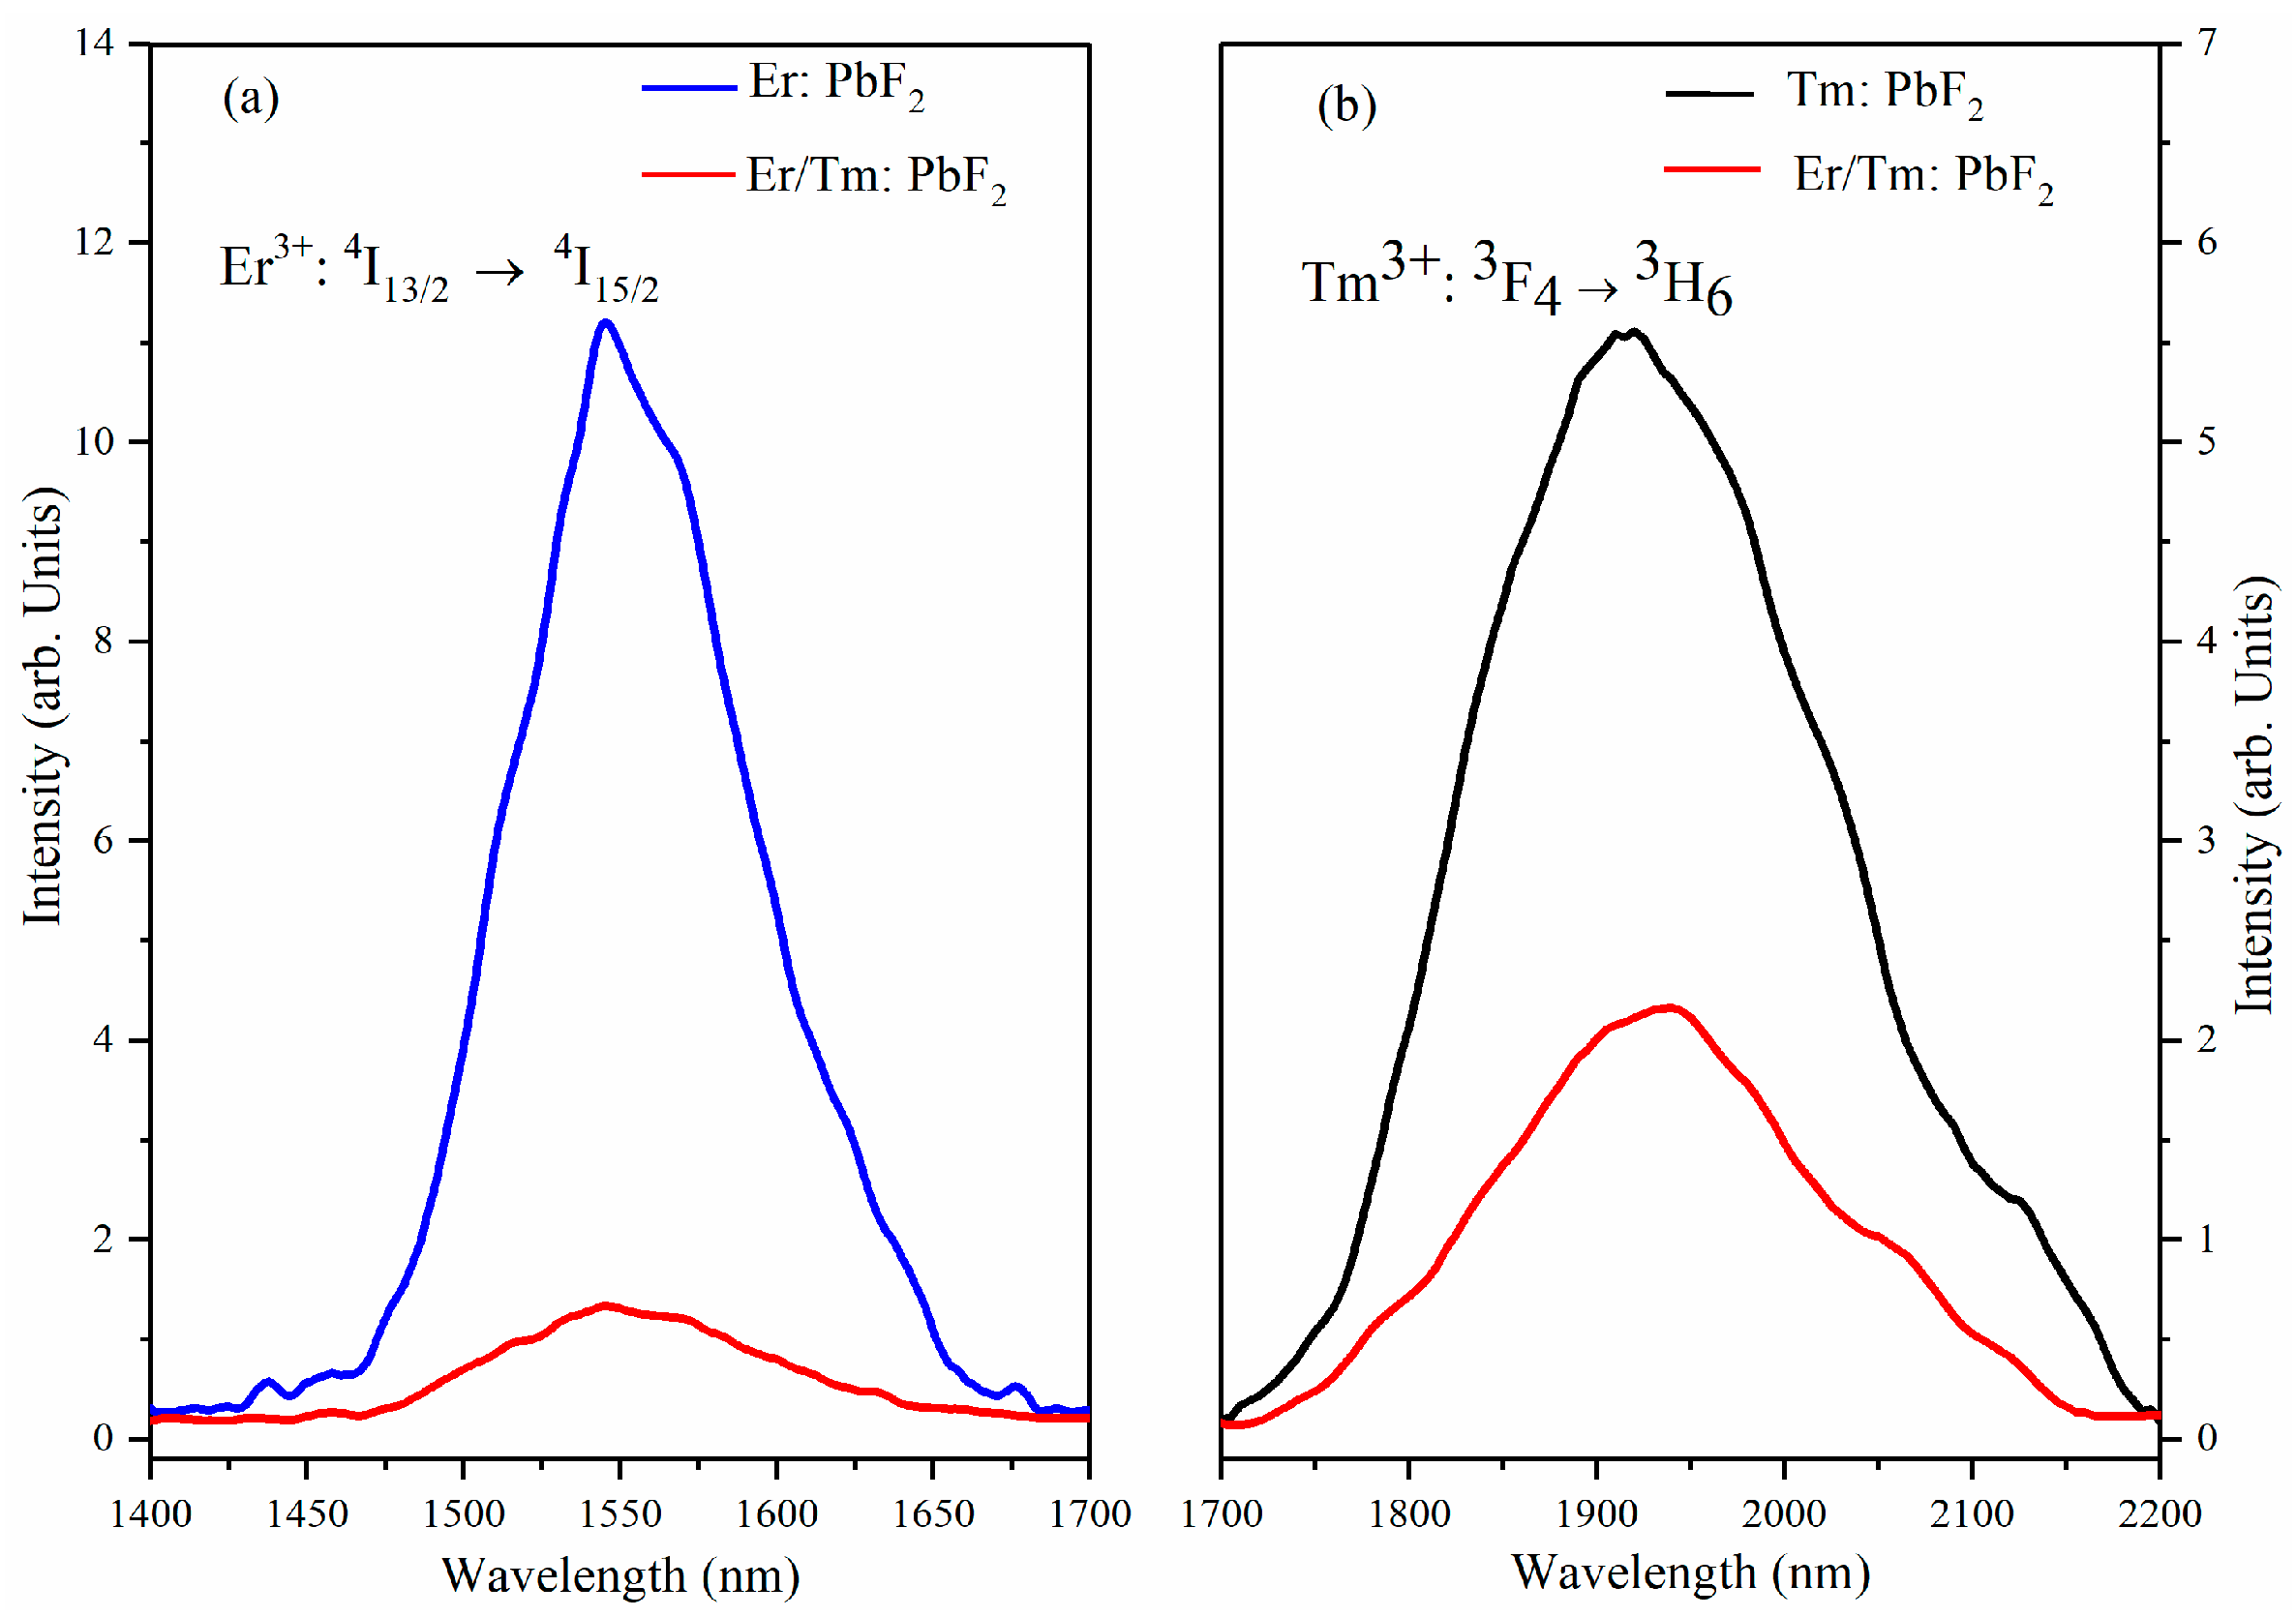
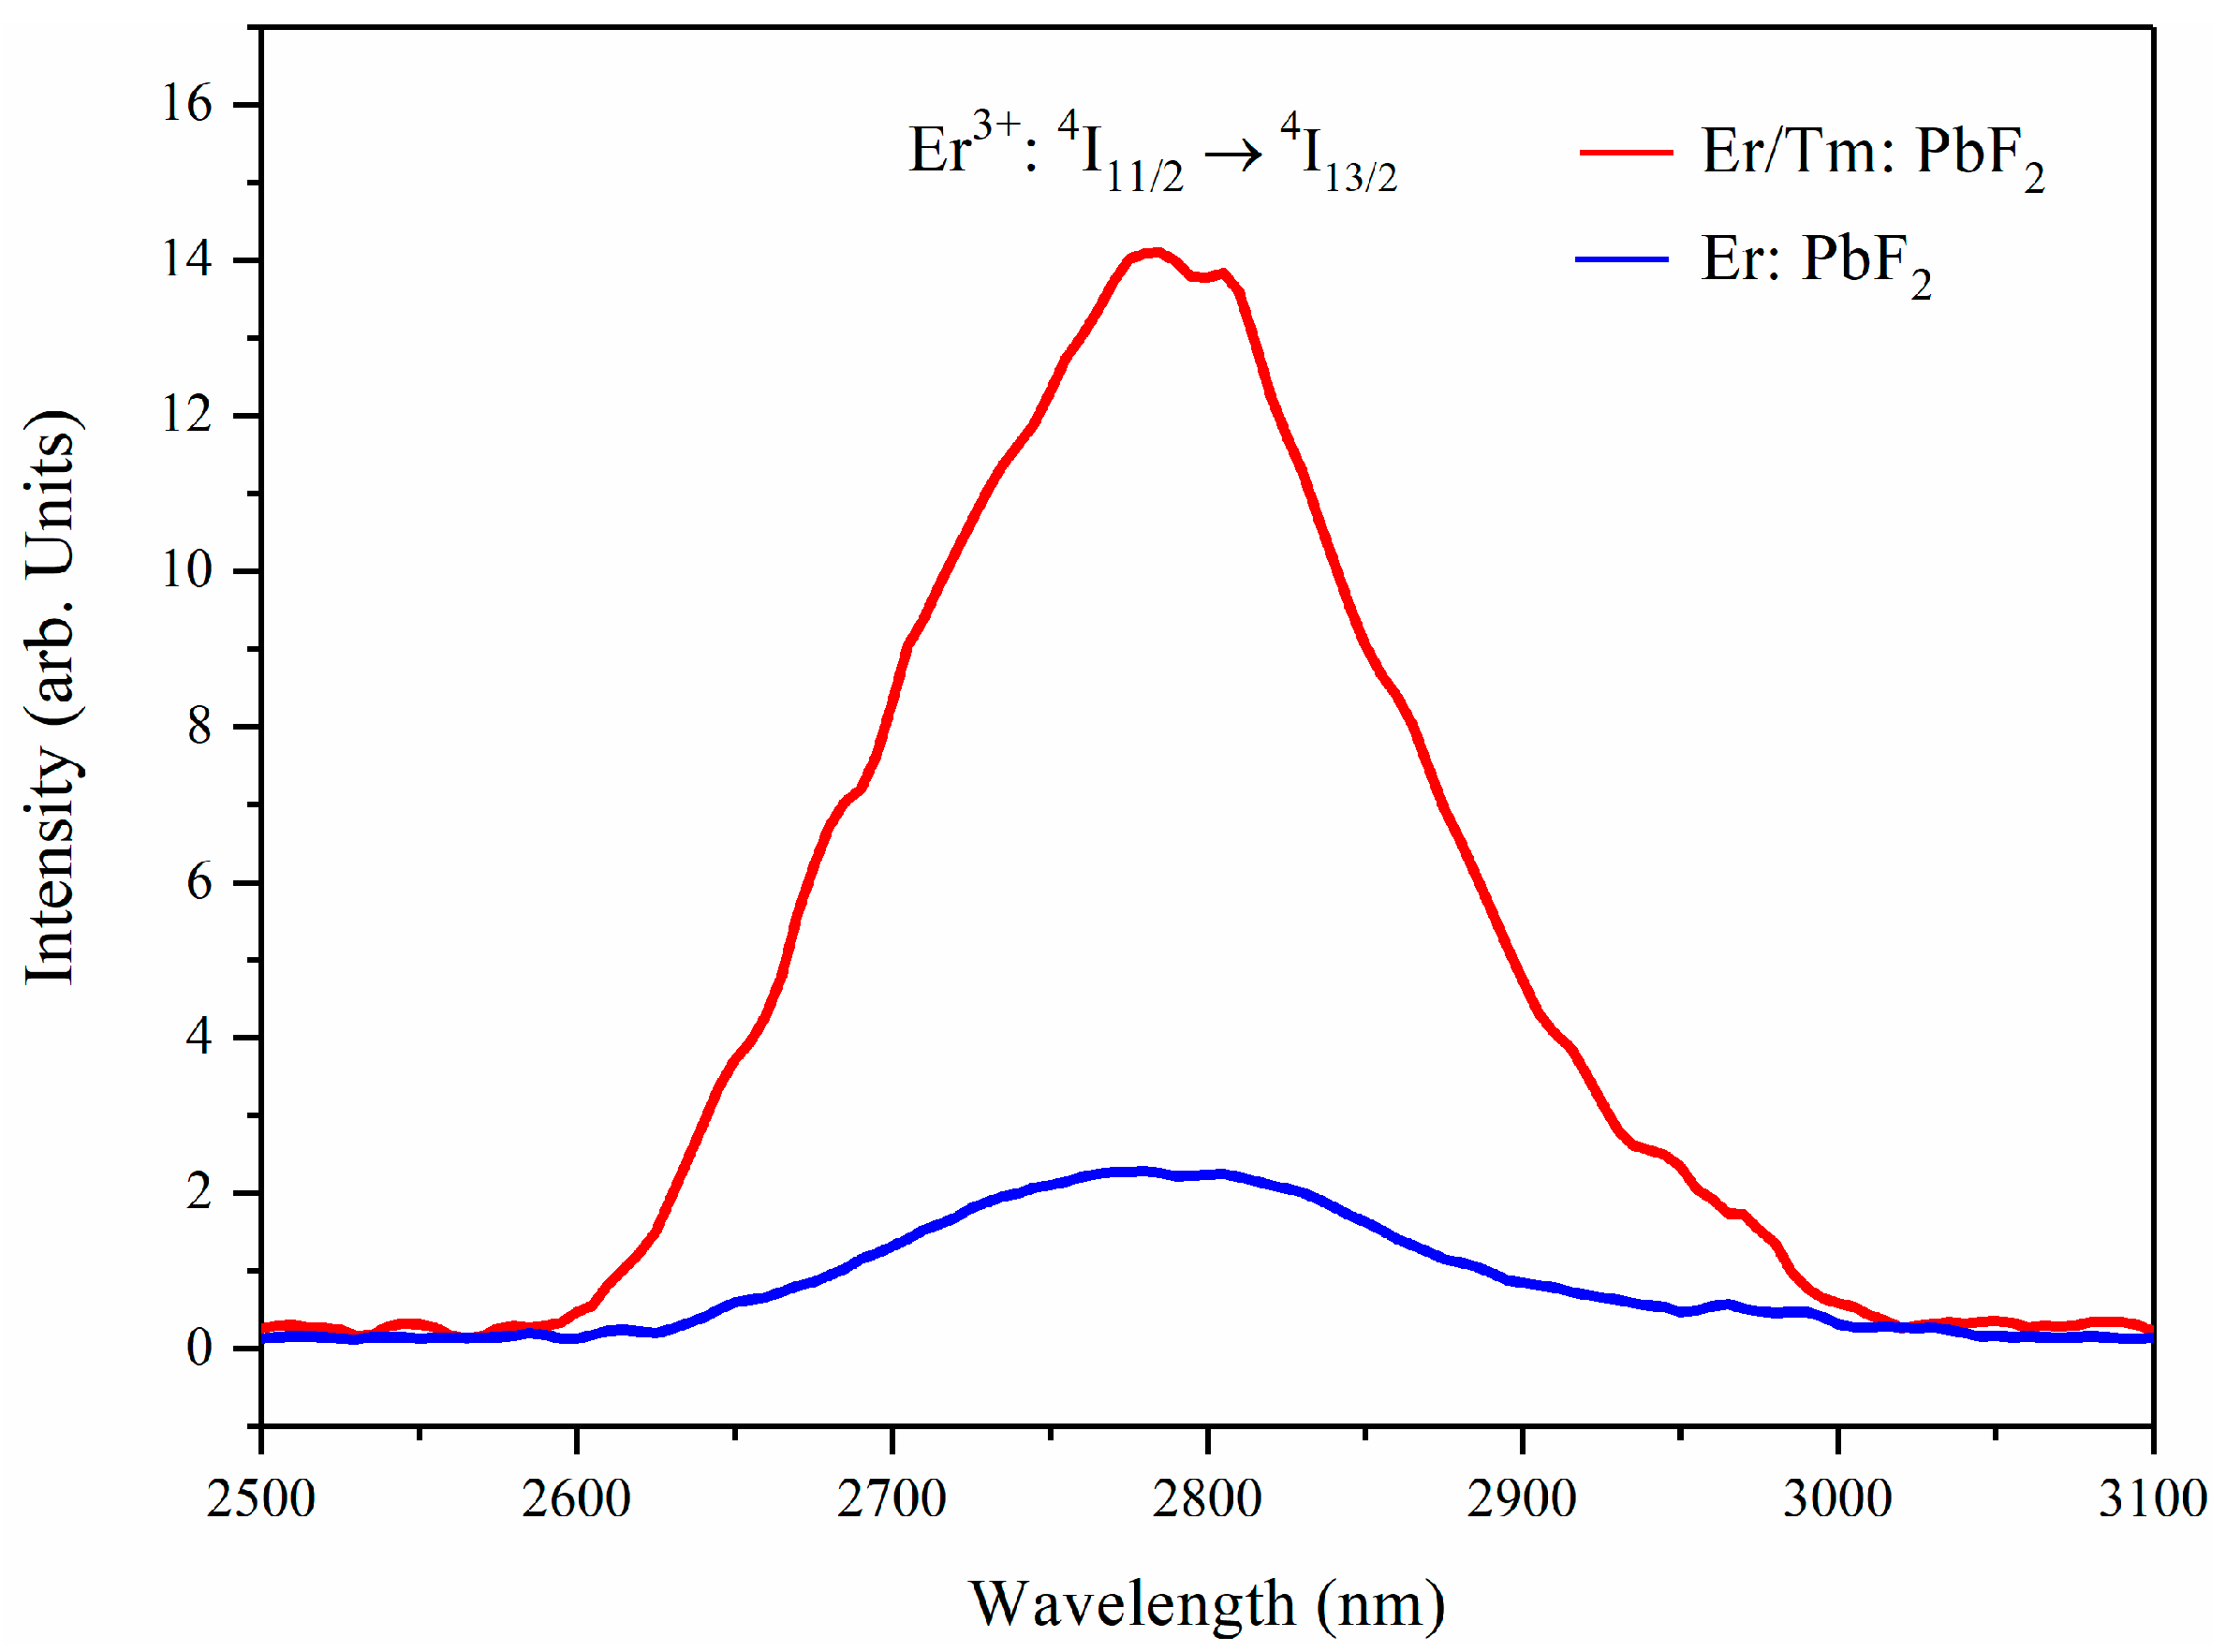
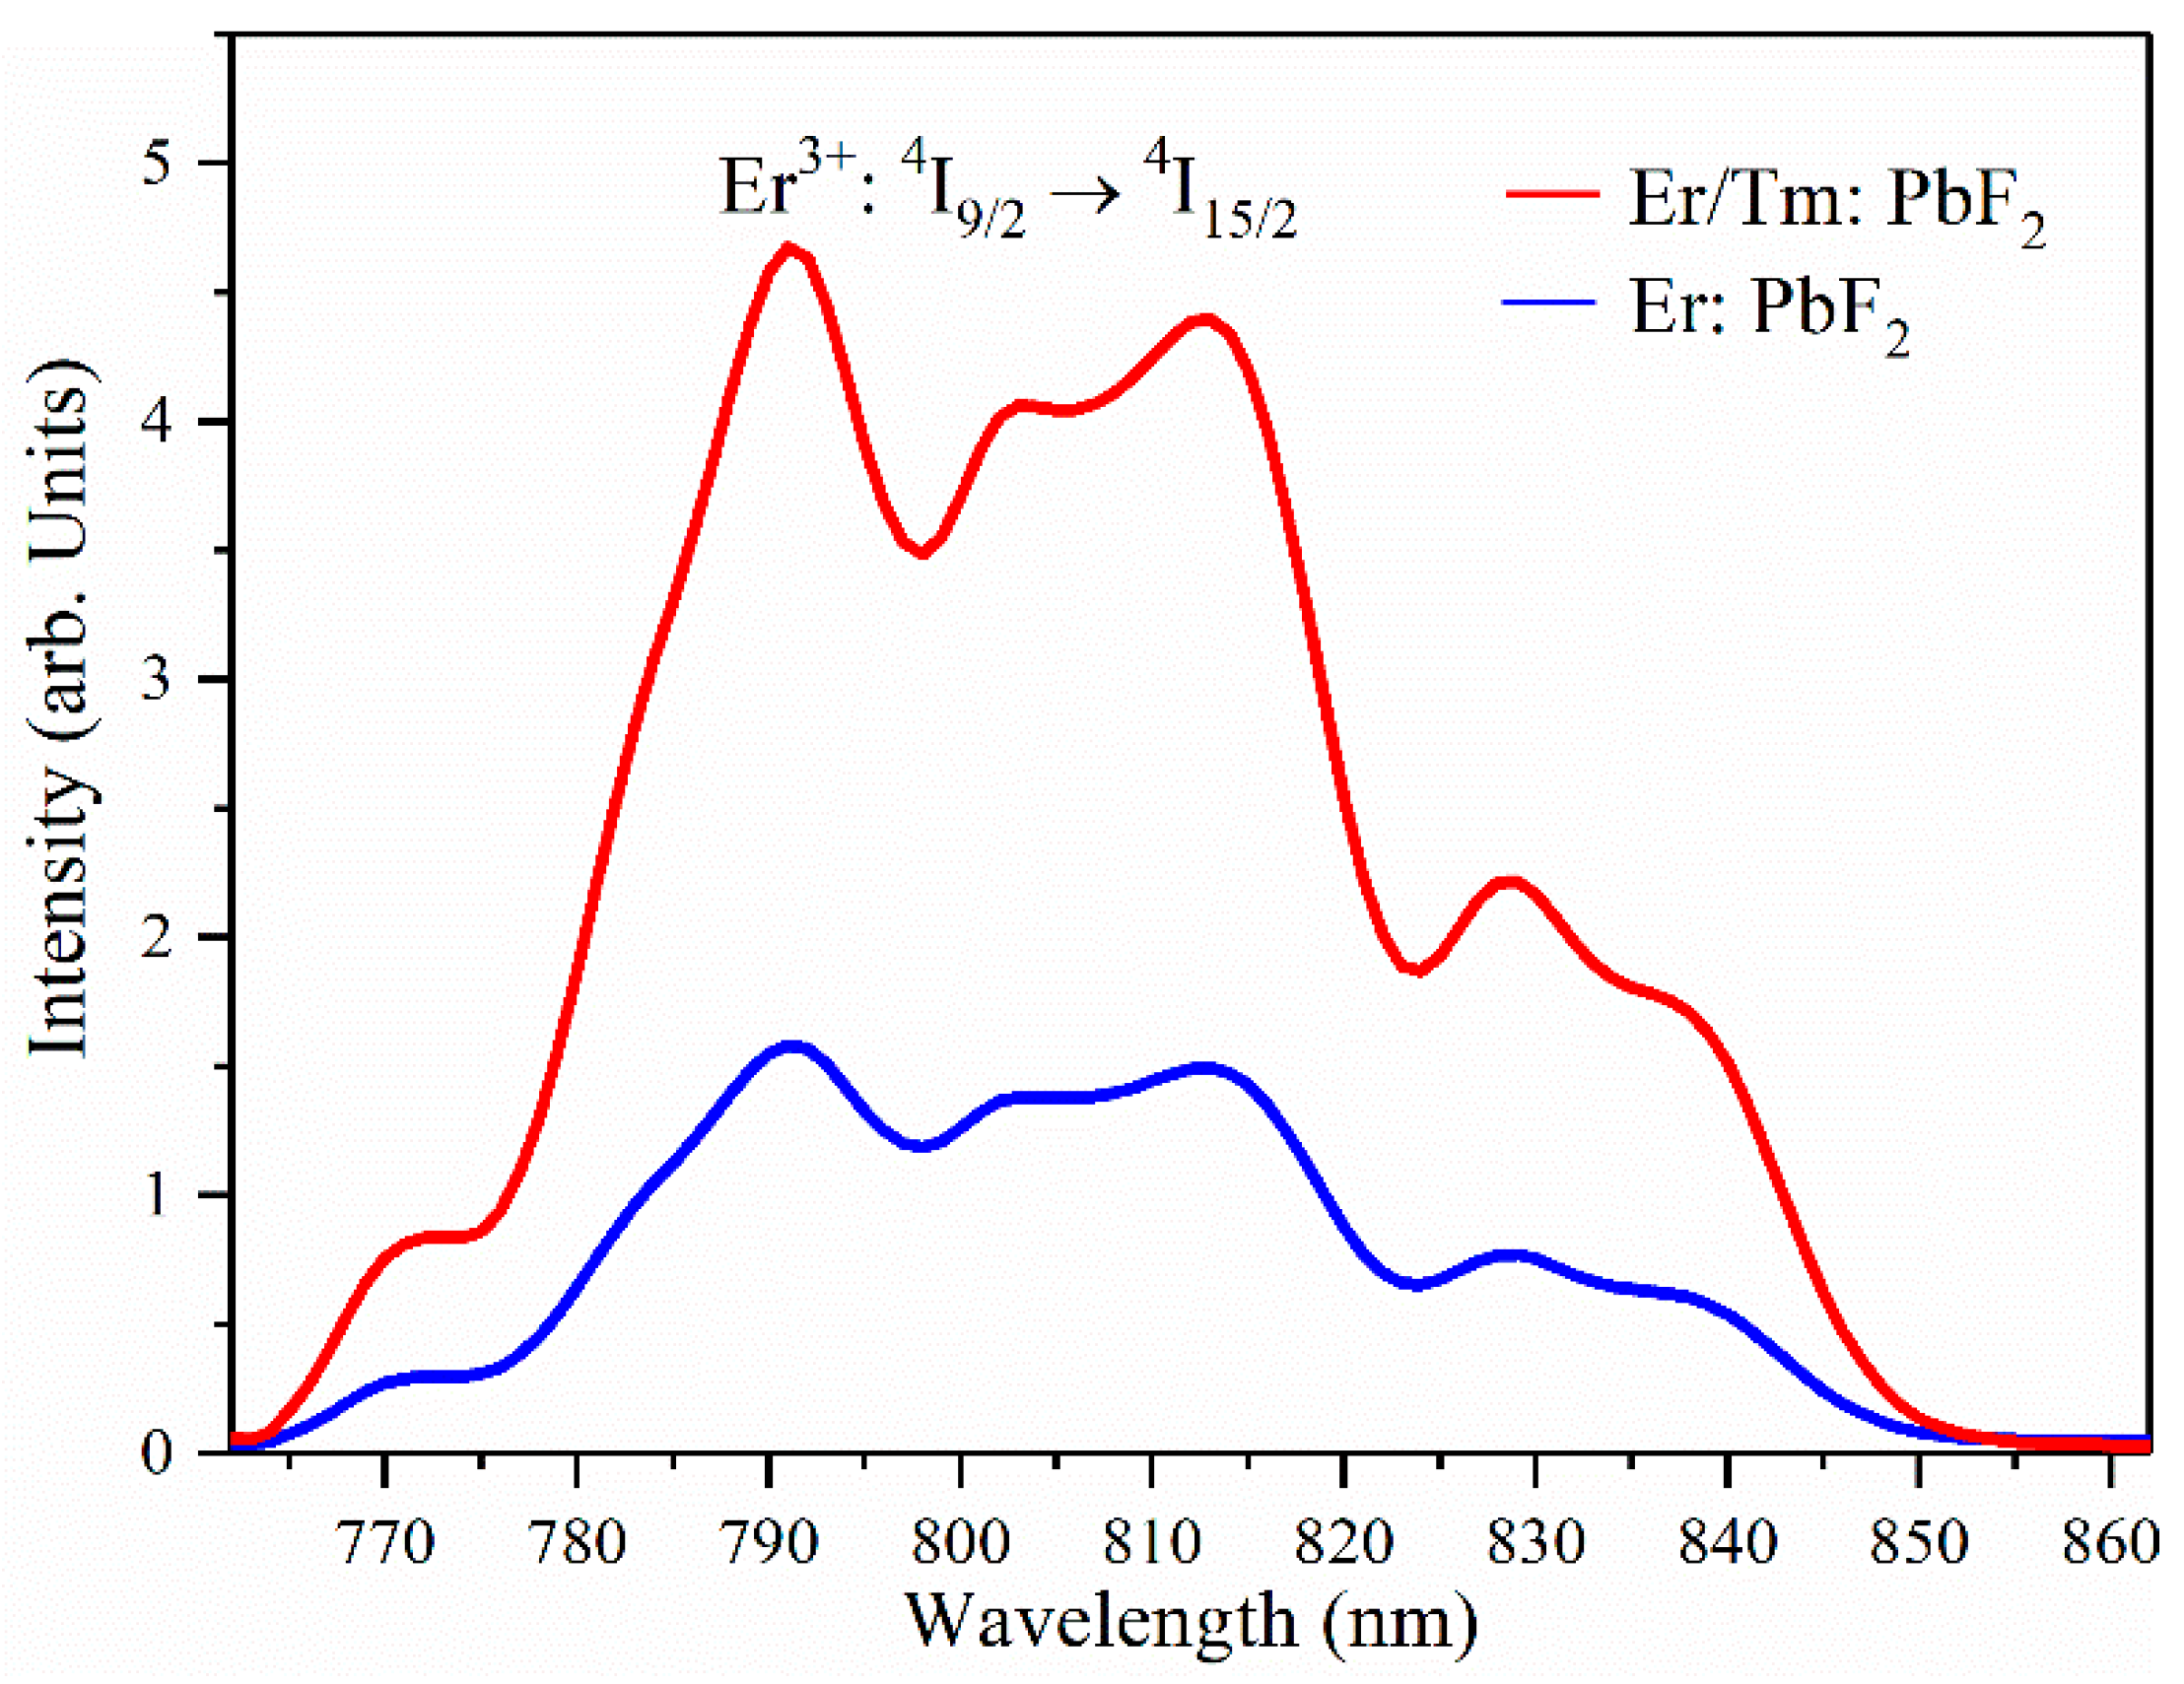
4.4. Emission Spectra and Emission Cross-Sections

For further clarifying the energy transfer mechanism between Tm3+ and Er3+ ions, the emission spectra of Er/Tm: PbF2, Er: PbF2 samples in the range of 1400–1700 nm, and Er/Tm: PbF2, Tm: PbF2 samples in the 1700–2200 nm region are shown in Figure 5a,b, respectively. The test parameters of the luminescence performance of the prepared samples, such as pump power and slits, are uniformed. As shown in Figure 5a, compared with the Er: PbF2 crystal the emission intensity centered at around 1.55 μm corresponding to the Er3+: 4I13/24I15/2 transition in the Er/Tm: PbF2 crystal weakened sharply, at almost ten times lower. The result shows that the introduction of Tm3+ ion would significantly reduce the population of the Er3+: 4I13/2 energy level, thereby enhancing the ~2.7 μm mid-infrared emission and reversely weakening the 1.55 μm infrared emission. This depopulation of Er3+: 4I13/2 energy level is mainly attributed to the deactivation effect of Tm3+ ions via energy transfer process: Er3+: 4I13/2 → Tm3+: 3F4 in Er/Tm: PbF2 crystal. As the deactivation energy transfer process occurs, the population on the Tm3+: 3F4 level would increase, thereby enhancing the 1.91 μm emission (Tm3+: 3F43H6 transition) in the Er/Tm: PbF2 crystal, but it is actually weakened (shown in Figure 5b). The 1.91 μm emission intensity of the Tm3+ ion in Er/Tm: PbF2 crystal is nearly three times lower than that in the Tm3+ single doped PbF2 crystal. This result is mainly assigned to the cross-relaxation (CR) process between Tm3+ and Er3+ ions (Tm3+: 3F4 + Er3+: 4I13/2 → Tm3+: 3H4 + Er3+: 4I15/2), bringing about the depopulation of the Tm3+: 3F4 level and Er3+: 4I13/2 level. Therefore, the reduced emission intensity of 1.55 μm of Er3+ ion and 1.91 μm of Tm3+ ion both would depopulate the ions on the Er3+: 4I13/2 level, which is beneficial to enhance ~2.7 μm MIR emission. More importantly, as shown in Figure 6, the emission intensity of the Er/Tm: PbF2 crystal centered at around 2.7 μm in the 2500–3100 nm region is remarkably larger than that of the Er: PbF2 crystal, confirming that the efficient enhanced ~2.7 μm emission is achieved in the Er/Tm: PbF2 designed crystal. To further confirm the prospects of Er: PbF2, Er/Tm: PbF2 crystals as the mid-infrared luminescent material in laser applications, the 2.78 μm emission cross-sections are subsequently calculated according to the Fuchtbauere–Ladenburg theory [43]:
σ em ( λ ) = A β λ 5 I ( λ ) 8 π c n 2 λ I ( λ ) d λ
where λ denotes the wavelength of fluorescence spectrum, I (λ) is the intensity of emission spectrum at λ, I ( λ ) / λ I ( λ ) d λ is the normalized line shape function of the emission spectrum of prepared crystal, n is the refractive index of PbF2 crystal, c is the speed of light in a vacuum, β is the fluorescence branching ratio of 4I11/24I13/2 transition, and A is the spontaneous emission probability. The value of β for ~2.7 μm mid-infrared emission in Er: PbF2 is calculated to be 14.9%, and in the Er/Tm: PbF2 crystal is calculated to be 20.24%. The maximum emission cross-section of the Er/Tm: PbF2 crystal is calculated to be 0.63 × 10⁻²⁰ cm2 at 2780 nm, which is almost twice that of the Er: PbF2 crystal (0.32 × 10⁻²⁰ cm2). Moreover, as shown in Table 1, this higher stimulated emission cross-section in the Er/Tm: PbF2 crystal possibly coincides well with the higher fluorescence branching ratio β (20.24%) of the Er3+: 4I11/24I13/2 transition. A higher emission cross-section is more favorable in achieving high performance of MIR laser operation. These results are related to the more uniform distribution of Er3+ and Tm3+ ions in PbF2 crystal after the co-doping of Tm3+ ions, which is consistent with the theoretical calculation results. Furthermore, it is pointed out that the enhancing of 2.78 μm MIR fluorescence emission is more dependent on the efficient energy transfer between Er3+ and Tm3+ ions, which comes from the uniform distribution of doped ions.

4.5. Energy Transfer Mechanism between Tm3+ and Er3+ Ions

Based on spectroscopic results discussed above, the simplified energy level scheme and electron transitions of the Er3+/Tm3+ co-doped PbF2 crystal are presented in Figure 7. The cyclic related processes of the Tm3+ and Er3+ ions in the crystal under optical excitation are as follows: cross-relaxation, energy transfer between Tm3+ and Er3+ ions, and multiphonon relaxation. The main two ET (namely ET1, ET2) and three CR (namely CR1, CR2, CR3) processes are listed as follows:
ET 1: Tm3+: 3H4 + Er3+: 4I15/2 → Tm3+: 3H6 + Er3+: 4I9/2;
ET 2: Er3+: 4I13/2 + Tm3+: 3H6 → Er3+: 4I15/2 + Tm3+: 3F4;
CR 1: Tm3+: 3F4 + Er3+: 4I13/2 → Tm3+: 3H6 + Er3+: 4I9/2;
CR 2: Tm3+: 3F4 + Er3+: 4I13/2 → Tm3+: 3H4 + Er3+: 4I15/2;
CR 3: 2Er3+: 4I13/2 → Er3+: 4I15/2 + Er3+: 4I9/2.
As discussed, the Tm3+: 3H43H6 transition is resonant with the Er3+: 4I15/24I9/2 transition in the Er/Tm: PbF2 crystal. Therefore, after the crystal is excited to the Tm3+: 3H4 level by a pump of 800 nm LD, ET1 process Tm3+: 3H4 → Er3+: 4I9/2 would occur. Ions in the Er3+: 4I9/2 level decay non-radiatively to the lower Er3+: 4I11/2 level, and then decay radiatively to the Er3+: 4I13/2 level and emit 2.78 μm mid-infrared light. Ions in the Er3+: 4I13/2 level continue to decay radiatively to the ground state Er3+: 4I15/2 level and emit 1.55 μm infrared light. Similarly, the Er3+: 4I13/24I15/2 transition is resonant with the Tm3+: 3H63F4 transition, and the ET2 process from Er3+: 4I13/2 to Tm3+: 3F4 level takes place. The ET2 process would reduce the population of the lower level of Er3+: 4I13/2, thereby enhancing the 2.78 μm emission and weakening the 1.55 μm emission, as shown in Figure 5a and Figure 6. Meantime, the energy transfer up-conversion (UC) CR3 process (Er3+: 24I13/24I15/2 + 4I9/2) in the crystal can also populate the Er3+: 4I11/2 level and depopulate the Er3+: 4I13/2 level. Additionally, ions in the Tm3+: 3F4 level decay radiatively to the 3H6 level and emit 1.91 μm emission. The subsequent CR1 populates the Er3+: 4I9/2 level, and then the Er3+: 4I11/2 level is populated through the nonradiative decay from the 4I9/2 level to the 4I11/2 level, increasing the population ratio of 4I11/2/4I13/2 levels. Moreover, the ions in the Tm3+: 3F4 energy level will also absorb energy and jump to the upper Tm3+: 3H4 energy level due to Stark level splitting, and then the CR2 process described above occurs. The CR2 process can simultaneously reduce the population Er3+: 4I13/2, Tm3+: 3F4 levels, to achieve 2.78 μm emission enhancement and 1.91 μm emission reduction, as shown in Figure 5b and Figure 6. The CR2 process also brings about the increasing population of the Tm3+: 3H4 level. Besides emitting 1.47 μm light via the Tm3+: 3H43F4 transition, ions in the Tm3+: 3H4 level can populate the Er3+: 4I9/2 level via ET1 process, resulting in further enhancement of the sensitization effect. To prove the CR2 process, the UC emission spectra of Er: PbF2 and Er/Tm: PbF2 crystals are shown in Figure 8 under 980 nm excitation. Clearly, as shown in Figure 7, under 980 nm NIR light excitation, the electrons in the ground level 4I15/2 can be excited to the intermediate level 4I11/2, and the electrons in the 4I11/2 level sequentially populate the 4F7/2 level (4I15/24I11/24F7/2). Additionally, then, the multiple nonradiative multi-phonon relaxation in the 4F7/2 state in turn populate the lower 2H11/2, 4S3/2, 4F9/2, and 4I9/2 levels, which would produce 800 nm light via the process: 4I9/24I15/2. It is clear to see that the UC emission intensity of the Er/Tm: PbF2 crystal is at least two times larger than that of the Er: PbF2 crystal at around 800 nm. Obviously, Tm3+ ions have no absorption band matching the 980 nm excitation (shown in Figure 3). This enhancing UC emissions phenomenon is possibly assigned to the CR2 and ET1 mechanism processes illustrated in Figure 7. To summarize, the ET1, ET2, CR1, CR2, CR3 processes all have significant effects on narrowing the lifetime gap of upper-lying Er3+: 4I11/2 and lower-lying Er3+: 4I13/2 levels or even achieving population conversion of these two levels, thereby obtaining efficient enhanced 2.78 μm emission.

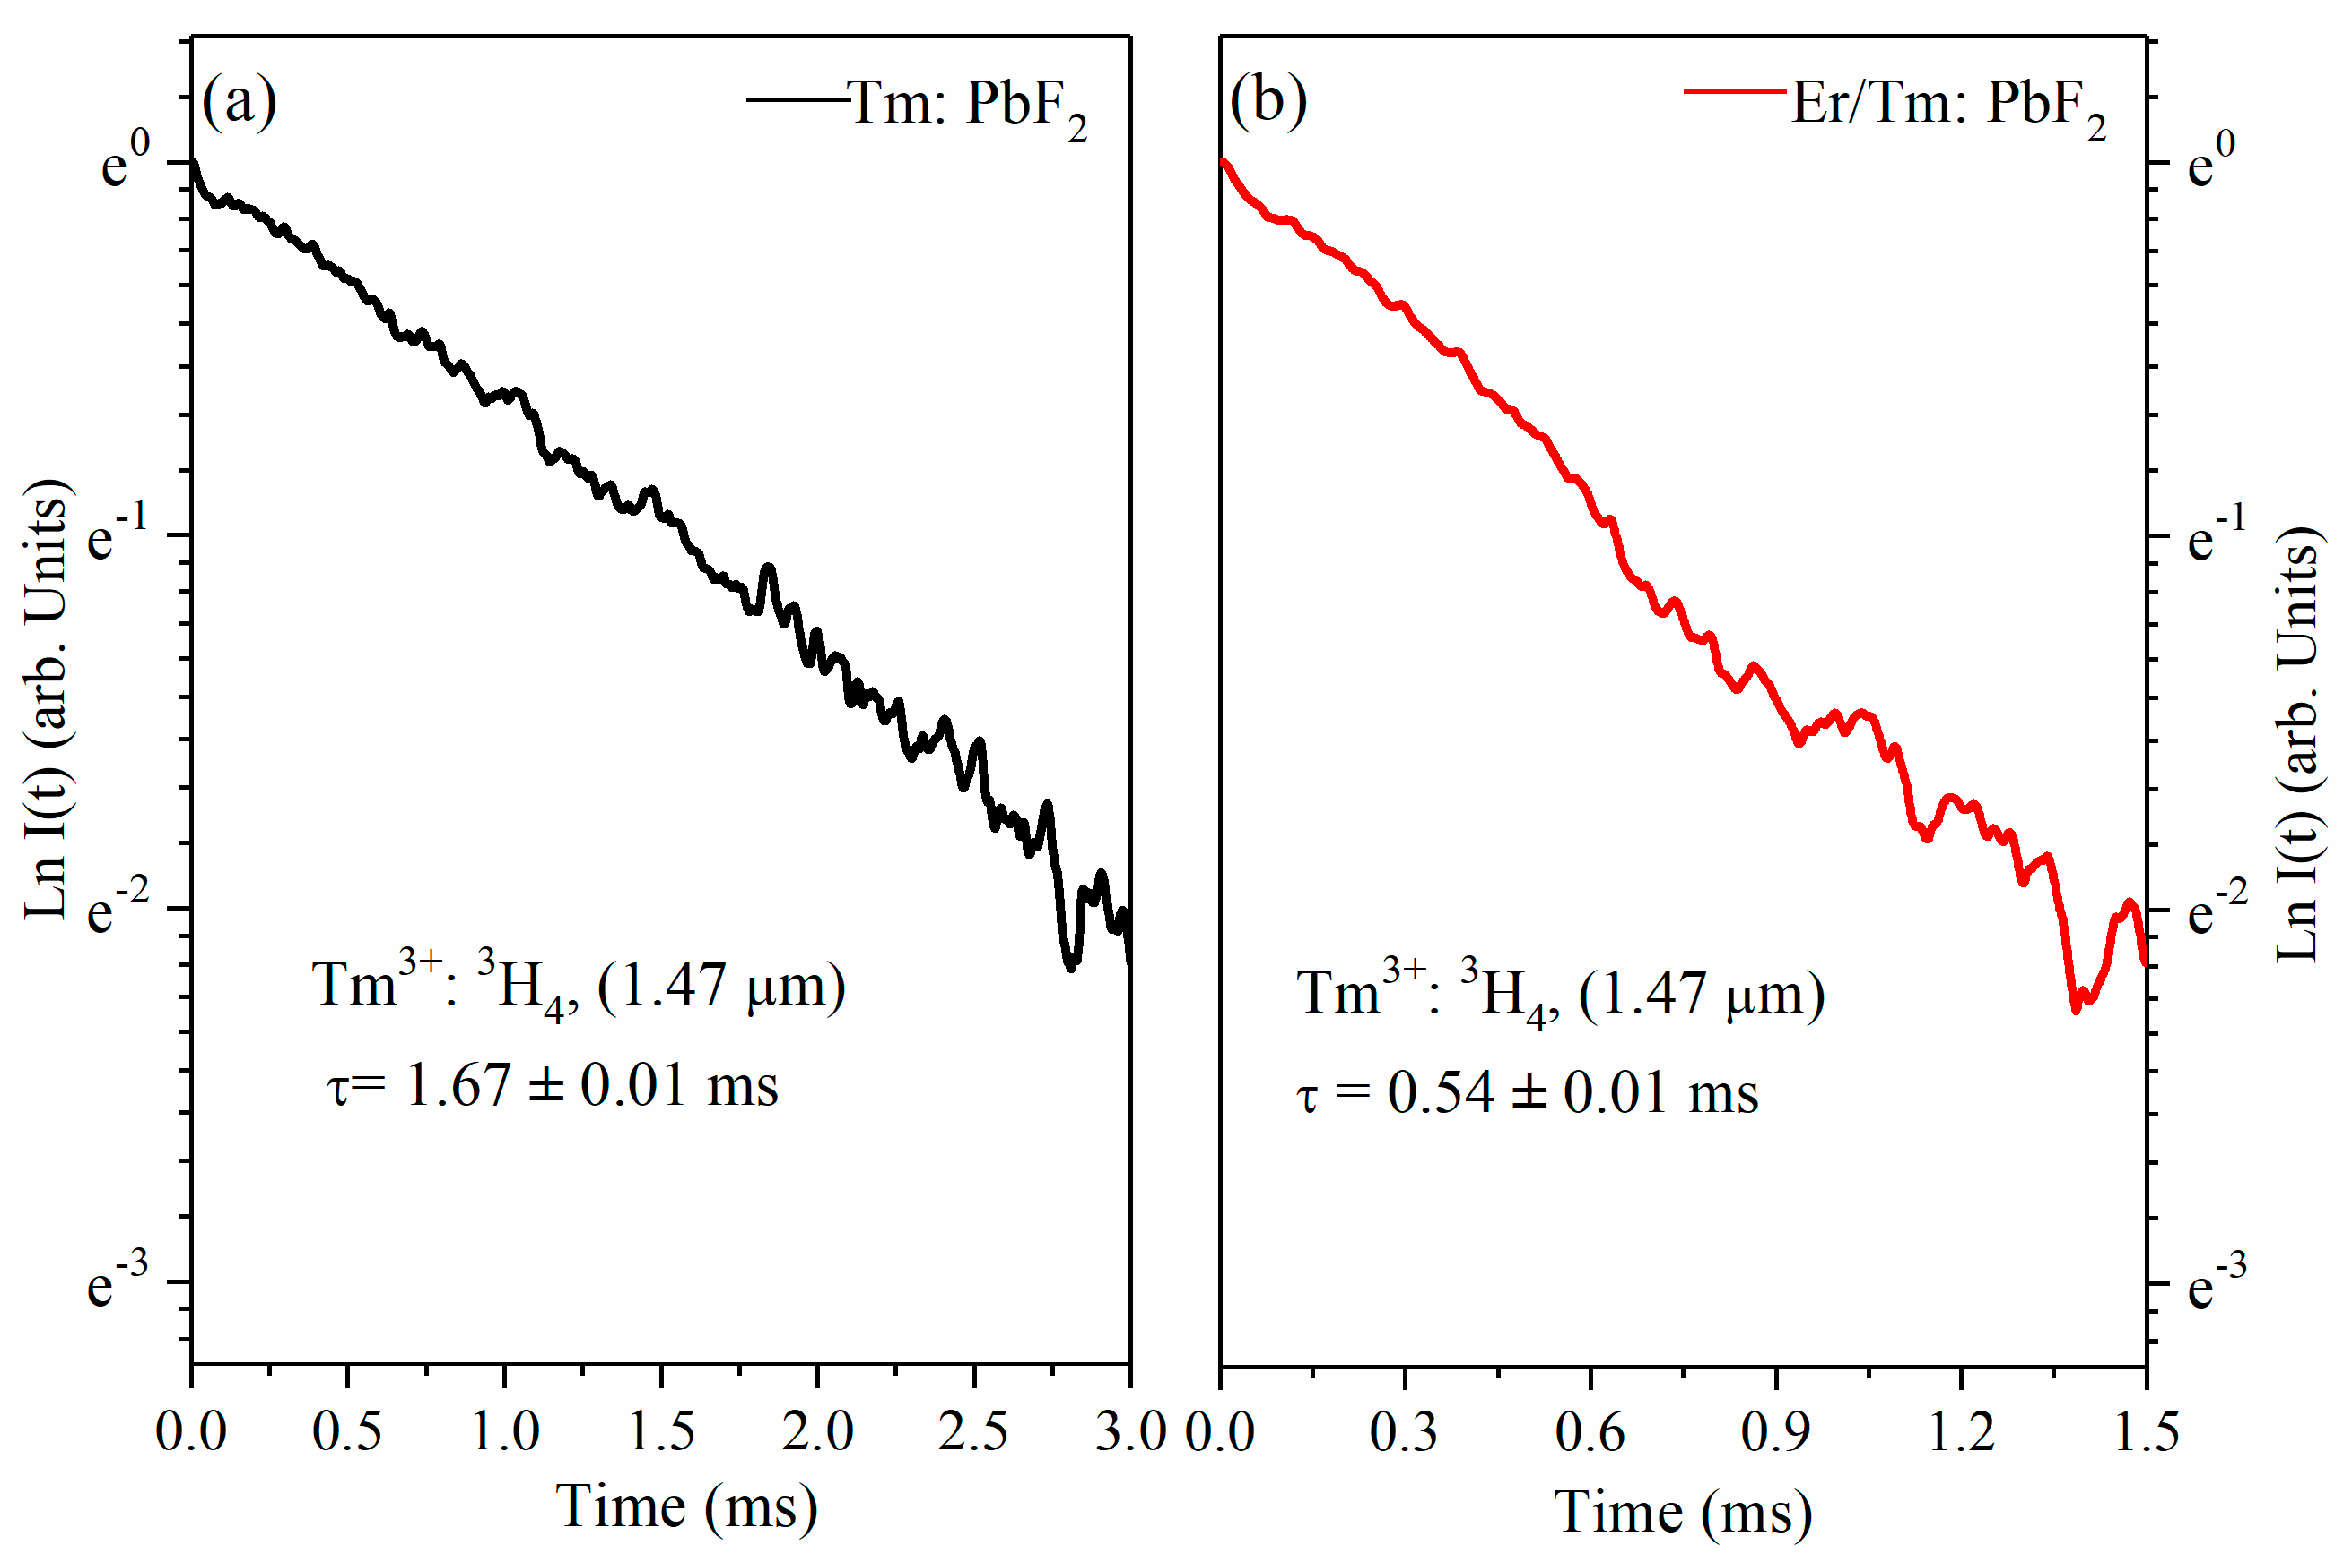
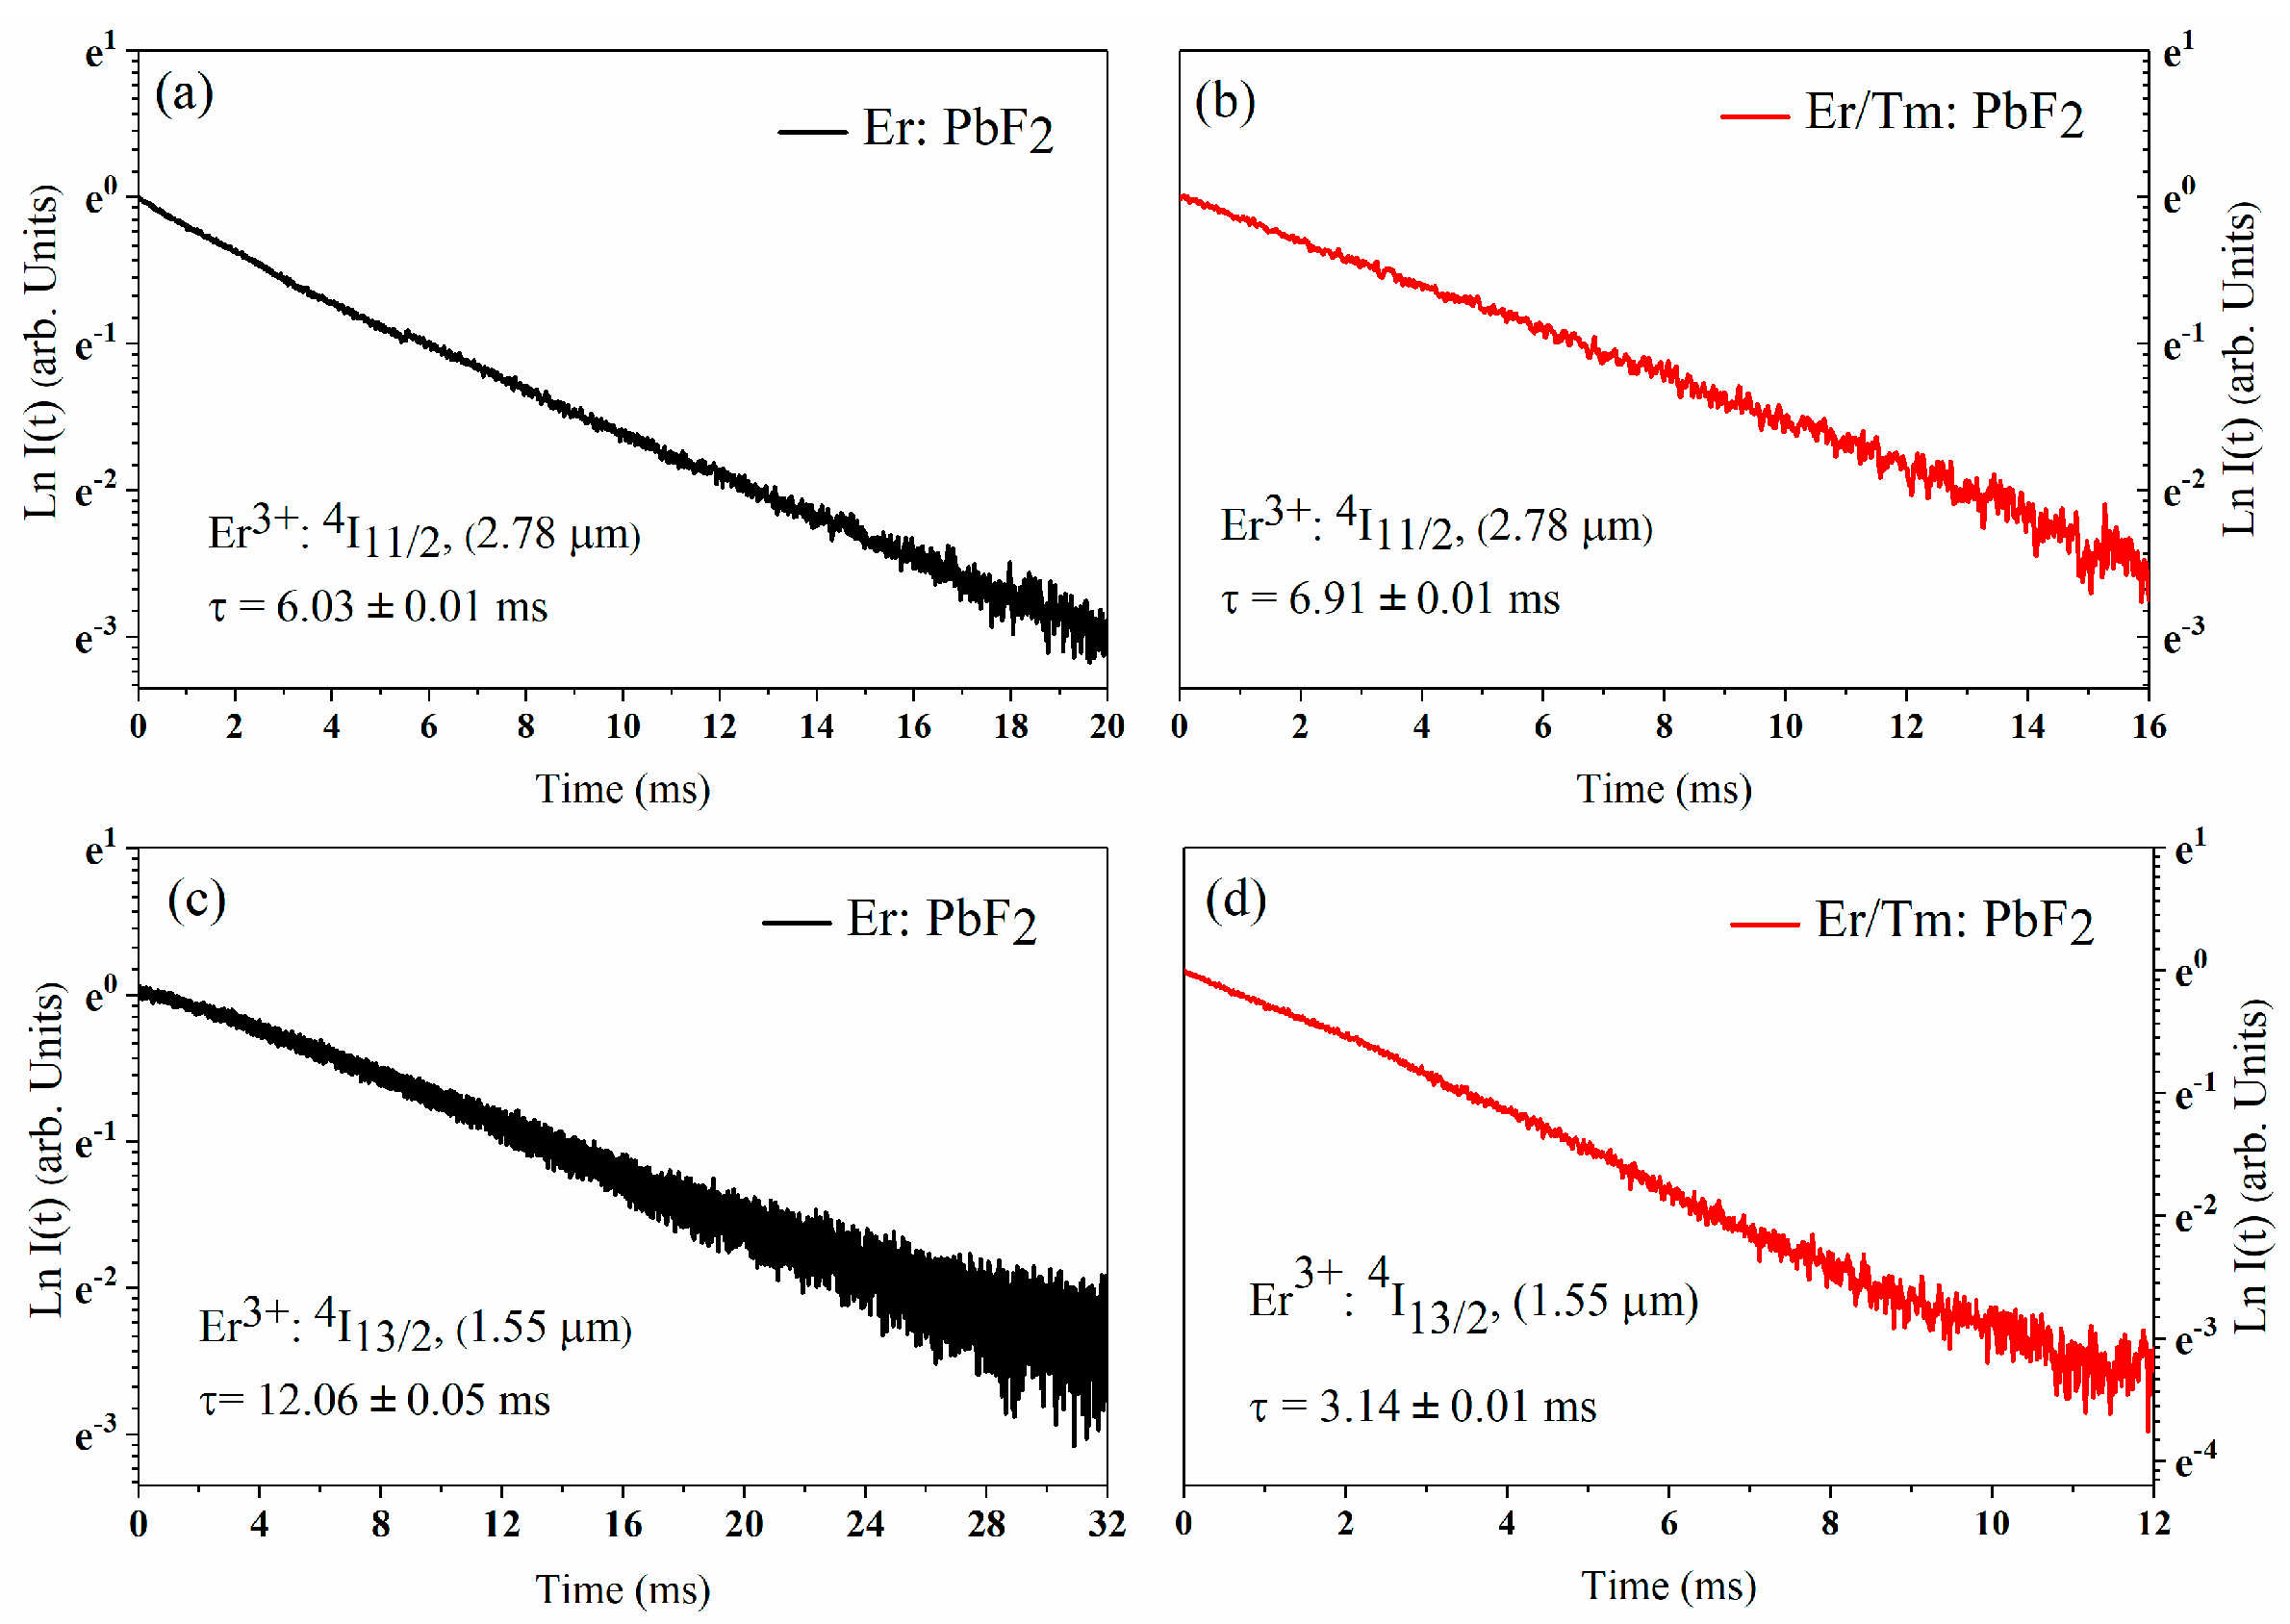
4.6. Fluorescence Decay Curves and Fluorescence Lifetimes

For further demonstrating the energy interaction mechanism between Er3+ and Tm3+ ions, the time-resolved decay curves of the Er3+ ion 2.78 μm (4I11/24I13/2) and 1.55 μm (4I13/24I13/2) fluorescence emission for the Er/Tm: PbF2 and Er: PbF2 crystals were measured and shown in Figure 9. The lifetimes of 4I13/2 levels were measured under the conditions of 1.55 μm emission (4I13/24I15/2) and 1.49 μm excitation (4I15/24I13/2). The decay curves of the Er3+: 4I11/2 and Er3+: 4I13/2 levels are well fitted with single-exponential behavior. As shown in Figure 9a,b, the measured lifetime of the upper-lying 4I11/2 level in the Er/Tm: PbF2 crystal (6.91 ms) is 14.6% longer compared with the Er: PbF2 crystal (6.03 ms), which is assigned to the sensitization effect of the Tm3+ ion on the upper-lying Er3+: 4I11/2 level. Moreover, as shown in Figure 9c,d, the measured lifetime of the lower-lying 4I13/2 level in the Er/Tm: PbF2 crystal is 3.14 ms, which is 73.96% shorter compared with the Er: PbF2 crystal (12.06 ms). This remarkable decrease of the lifetime of lower-lying 4I13/2 level denotes that Tm3+ ions can dramatically depopulate the Er3+: 4I13/2 level via ET2, CR1, CR2, CR3 processes, thereby enhancing the 2.78 μm emission in PbF2 crystals. The ET2, CR1, CR2, CR3 processes all have significant effects on narrowing the lifetime gap of upper-lying Er3+: 4I11/2 and lower-lying Er3+: 4I13/2 levels or even achieving population conversion of these two levels. Besides, the energy transfer efficiency ηET2 was calculated to be 73.96%, confirming the efficient deactivation effect of the Tm3+ ion for the Er3+ ion. Furthermore, Table 1 shows the lifetimes of 4I11/2, 4I13/ 2 levels of Er/Tm: PbF2, Er: PbF2 crystals, and other Er3+ doped laser crystals. The shorter fluorescence lifetime of 4I13/2 lower level induces the longer fluorescence lifetime ratio τ(4I11/2)/τ(4I13/2). The fluorescence lifetime ratio τ(4I11/2)/τ(4I13/2) in Er/Tm: PbF2 crystal is 220.06%, which is dramatically larger than that of the Er: PbF2 crystal (50.00%) and other Er3+ doped crystals. The remarkably enhanced τ(4I11/2)/τ(4I13/2) ratio in Er/Tm: PbF2 crystal is favorable for achieving efficient laser operation ~2.7 µm. As a consequence, the introduction of Tm3+ ions can simultaneously act as sensitization and deactivation ions for the Er3+ ion, thereby enhancing 2.78 μm mid-infrared emission and reducing the laser threshold of 2.78 μm luminescence.

5. Conclusions

In summary, Er3+: PbF2, Tm3+: PbF2, and Er3+/Tm3+: PbF2 crystals were prepared successfully by the Bridgman technique. An efficient enhanced 2.78 μm emission was obtained in the Er/Tm: PbF2 crystal for the first time, and the proposed energy transfer mechanism of the Er/Tm: PbF2 crystal was systematically investigated. The theoretical calculations were performed to discover that the co-doping of Tm3+ ions can make the Er3+ and Tm3+ ions more evenly distributed in PbF2 crystals, which can effectively break the local clusters of Er3+ in Er: PbF2 crystal, thus ensuring efficient energy transfer between Er3+ and Tm3+ ions, and resulting in the enhancing of 2.78 μm MIR fluorescence emission. The cyclic energy transfer mechanism contains several energy transfer processes and cross-relaxation processes, which all have significant effects on narrowing the lifetime gap of upper-lying Er3+: 4I11/2 and lower-lying Er3+: 4I13/2 levels or even achieving population conversion of these two levels. As proved, the Tm3+ ion can simultaneously act as an appropriate sensitized and deactivated ion for the Er3+ ion in the PbF2 crystal. Compared with the Er3+ single-doped crystal, the Er3+/Tm3+ co-doped PbF2 crystal has the larger 2.78 μm mid-infrared fluorescence emission intensity, higher fluorescence branching ratio (20.24%), and higher stimulated emission cross-section (0.63 ×10⁻²⁰ cm2), corresponding to Er3+: 4I11/24I13/2 transition. Therefore, the introduction of Tm3+ ions is favorable for achieving efficient enhanced 2.78 μm emission in the Er/Tm: PbF2 crystal, which can become a promising material for low threshold, and high-efficiency mid-infrared laser applications under the pump of a conventional 800 nm LD.

Author Contributions

Conceptualization, P.Z.; methodology, J.L. and Q.C.; software, F.M.; validation, Y.H.; formal analysis, S.Z.; investigation, J.L., H.T. and Q.Y.; resources, Y.H.; and Z.L.; data curation, J.L. and Q.C.; writing—original draft preparation, J.L. and X.N.; writing—review and editing, P.Z.; visualization, Q.C.; supervision, Z.C.; project administration, Z.C.; funding acquisition, Y.H. and Z.L. All authors have read and agreed to the published version of the manuscript.

Funding

This work was supported by the National Natural Science Foundation of China (NSFC) (51972149, 51872307, 61935010, 51702124); Key-Area Research and Development Program of Guangdong Province (2020B090922006); Guangdong Project of Science and Technology Grants (2018B030323017, 2018B010114002); Guangzhou science and technology project (201904010385, 201903010042); The Fundamental Research Funds for the Central Universities (21620445).

Institutional Review Board Statement

Not applicable.

Informed Consent Statement

Not applicable.

Data Availability Statement

The data presented in this study are available on request from the corresponding author.

Conflicts of Interest

The authors declare no conflict of interest.

References

  1. Popov, A.; Sherstnev, V.; Yakovlev, Y.P.; Baranov, A.; Alibert, C. Powerful Mid-Infrared Light Emitting Diodes for Pollution Monitoring. Electron. Lett. 1997, 33, 86–88. [Google Scholar] [CrossRef]
  2. Bekman, H.T.; Van Den Heuvel, J.; Van Putten, F.; Schleijpen, R. Development of a Mid-Infrared Laser for Study of Infrared Countermeasures Techniques. In Proceedings of the Technologies for Optical Countermeasures, London, UK, 26–27 October 2004; Volume 5615, pp. 27–38. [Google Scholar]
  3. Hu, T.; Dong, B.; Luo, X.; Liow, T.Y.; Song, J.; Lee, C.; Lo, G.Q. Silicon Photonic Platforms for Mid-Infrared Applications. Photonics Res. 2017, 5, 417–430. [Google Scholar] [CrossRef] [Green Version]
  4. Walsh, B.M.; Lee, H.R.; Barnes, N.P. Mid Infrared Lasers for Remote Sensing Applications. J. Lumin. 2016, 169, 400–405. [Google Scholar] [CrossRef]
  5. Urich, A.; Maier, R.R.J.; Yu, F.; Knight, J.C.; Hand, D.P. Silica Hollow Core Microstructured Fibres for Mid-Infrared Surgical Applications. J. Non-Cryst. Solids 2013, 377, 236–239. [Google Scholar] [CrossRef] [Green Version]
  6. Godard, A. Infrared (2–12 Μm) Solid-State Laser Sources: A Review. Comptes Rendus Phys. 2007, 8, 1100–1128. [Google Scholar] [CrossRef]
  7. Vodopyanov, K.; Ganikhanov, F.; Maffetone, J.; Zwieback, I.; Ruderman, W. ZnGeP2 Optical Parametric Oscillator with 3.8–12.4-µm Tunability. Opt. Lett. 2000, 25, 841–843. [Google Scholar] [CrossRef]
  8. Zhang, T.; Feng, G.; Zhang, H.; Yang, X.; Dai, S.; Zhou, S. 2.78 μm Passively Q-Switched Er3+-Doped Zblan Fiber Laser Based on PLD-Fe2+: Znse Film. Laser Phys. Lett. 2016, 13, 075102. [Google Scholar] [CrossRef]
  9. Zhang, C.; Hao, Q.; Zu, Y.; Zong, M.; Guo, J.; Zhang, F.; Ge, Y.; Liu, J. Graphdiyne Saturable Absorber for Passively Q-Switched Ho3+-Doped Laser. Nanomaterials 2020, 10, 1848. [Google Scholar] [CrossRef]
  10. Pajewski, L.; Sójka, L.; Lamrini, S.; Benson, T.M.; Seddon, A.B.; Sujecki, S. Gain-Switched Dy3+: Zblan Fiber Laser Operating around 3 μm. J. Phys. Photonics 2019, 2, 014003. [Google Scholar] [CrossRef]
  11. Wu, Z.; Sun, D.; Wang, S.; Luo, J.; Li, X.; Huang, L.; Hu, A.; Tang, Y.; Guo, Q. Performance of a 967 nm Cw Diode End-Pumped Er: GSGG Laser at 2.79 μm. Laser Phys. 2013, 23, 055801. [Google Scholar] [CrossRef] [Green Version]
  12. Arbabzadah, E.; Chard, S.; Amrania, H.; Phillips, C.; Damzen, M. Comparison of a Diode Pumped Er: YSGG and Er: YAG Laser in the Bounce Geometry at the 3 μm Transition. Opt. Express 2011, 19, 25860–25865. [Google Scholar] [CrossRef]
  13. Kawase, H.; Yasuhara, R. 2.92-µm High-Efficiency Continuous-Wave Laser Operation of Diode-Pumped Er: YAP Crystal at Room Temperature. Opt. Express 2019, 27, 12213–12220. [Google Scholar] [CrossRef]
  14. Li, T.; Beil, K.; Kränkel, C.; Huber, G. Efficient High-Power Continuous Wave Er: Lu2O3 Laser at 2.85 μm. Opt. Lett. 2012, 37, 2568–2570. [Google Scholar] [CrossRef] [PubMed]
  15. Hou, W.; Zhao, H.; Qin, Z.; Liu, J.; Wang, D.; Xue, Y.; Wang, Q.; Xie, G.; Xu, X.; Xu, J. Spectroscopic and Continuous-Wave Laser Properties of Er: GdScO3 Crystal at 2.7 µm. Opt. Mater. Express 2020, 10, 2730–2737. [Google Scholar] [CrossRef]
  16. Ma, W.; Qian, X.; Wang, J.; Liu, J.; Fan, X.; Liu, J.; Su, L.; Xu, J. Highly Efficient Dual-Wavelength Mid-Infrared Cw Laser in Diode End-Pumped Er: SrF2 Single Crystals. Sci. Rep. 2016, 6, 1–7. [Google Scholar]
  17. Bandiello, E.; Sánchez-Martín, J.; Errandonea, D.; Bettinelli, M. Pressure effects on the optical properties of NdVO4. Crystals 2019, 9, 237. [Google Scholar] [CrossRef] [Green Version]
  18. Botella, P.; Enrichi, F.; Vomiero, A.; Munõz-Santiuste, J.E.; Garg, A.B.; Arvind, A.; Manjón, F.J.; Segura, A.; Errandonea, D. Investigation on the Luminescence Properties of InMO4 (M = V5+, Nb5+, Ta5+) Crystals Doped with Tb3+ or Yb3+ Rare Earth Ions. ACS Omega 2020, 5, 2148–2158. [Google Scholar] [CrossRef] [PubMed] [Green Version]
  19. Zhang, P.; Chen, Z.; Hang, Y.; Li, Z.; Yin, H.; Zhu, S.; Fu, S.; Li, A. Enhanced 2.7 μm Mid-Infrared Emissions of Er3+ Via Pr3+ Deactivation and Yb3+ Sensitization in LiNbO3 Crystal. Opt. Express 2016, 24, 25202–25210. [Google Scholar] [CrossRef]
  20. Li, S.; Zhang, L.; Zhang, P.; Hang, Y. Nd3+ as Effective Sensitization and Deactivation Ions in Nd, Er: LaF3 Crystal for the 2.7 μm Lasers. J. Alloy. Compd. 2020, 827, 154268. [Google Scholar] [CrossRef]
  21. Li, M.; Liu, X.; Guo, Y.; Hao, W.; Hu, L.; Zhang, J. ~2 μm Fluorescence Radiative Dynamics and Energy Transfer between Er3+ and Tm3+ Ions in Silicate Glass. Mater. Res. Bull. 2014, 51, 263–270. [Google Scholar] [CrossRef]
  22. Sandrock, T.; Diening, A.; Huber, G. Laser Emission of Erbium-Doped Fluoride Bulk Glasses in the Spectral Range from 2.7 to 2.8 μm. Opt. Lett. 1999, 24, 382–384. [Google Scholar] [CrossRef] [PubMed]
  23. Wang, J.; Cheng, T.; Wang, L.; Yang, J.; Sun, D.; Yin, S.; Wu, X.; Jiang, H. Compensation of Strong Thermal Lensing in an LD Side-Pumped High-Power Er: YSGG Laser. Laser Phys. Lett. 2015, 12, 105004. [Google Scholar] [CrossRef]
  24. Gao, S.; Chen, T.; Hu, M.; Xu, S.; Xiong, Y.; Cheng, S.; Zhang, W.; Wang, Y.; Yang, W. Effects of Er3+ Concentration on the Optical Properties of Er3+: SrGdGa3O7 Single Crystals. Opt. Mater. 2019, 98, 109502. [Google Scholar] [CrossRef]
  25. Quan, C.; Sun, D.; Luo, J.; Zhang, H.; Fang, Z.; Zhao, X.; Hu, L.; Cheng, M.; Zhang, Q.; Yin, S. Growth, Structure and Spectroscopic Properties of Er, Pr: YAP Laser Crystal. Opt. Mater. 2018, 84, 59–65. [Google Scholar] [CrossRef]
  26. Kang, S.; Yu, H.; Ouyang, T.; Chen, Q.; Huang, X.; Chen, Z.; Qiu, J.; Dong, G. Novel Er3+/Ho3+-Codoped Glass-Ceramic Fibers for Broadband Tunable Mid-Infrared Fiber Lasers. J. Am. Ceram. Soc. 2018, 101, 3956–3967. [Google Scholar] [CrossRef]
  27. Wang, T.; Huang, F.; Ren, G.; Cao, W.; Tian, Y.; Lei, R.; Zhang, J.; Xu, S. Broadband 2.9 μm Emission and High Energy Transfer Efficiency in Er3+/Dy3+ Co-Doped Fluoroaluminate Glass. Opt. Mater. 2018, 75, 875–879. [Google Scholar] [CrossRef]
  28. Tian, Y.; Li, B.; Wang, J.; Liu, Q.; Chen, Y.; Zhang, J.; Xu, S. The Mid-Infrared Emission Properties and Energy Transfer of Tm3+/Er3+ Co-Doped Tellurite Glass Pumped by 808/980 nm Laser Diodes. J. Lumin. 2019, 214, 116586. [Google Scholar] [CrossRef]
  29. Chai, G.; Dong, G.; Qiu, J.; Zhang, Q.; Yang, Z. 2.7 μm Emission from Transparent Er3+, Tm3+ Codoped Yttrium Aluminum Garnet (Y3Al5O12) Nanocrystals–Tellurate Glass Composites by Novel Comelting Technology. J. Phys. Chem. C 2012, 116, 19941–19950. [Google Scholar] [CrossRef]
  30. Tian, Y.; Xu, R.; Hu, L.; Zhang, J. 2.7 μm Fluorescence Radiative Dynamics and Energy Transfer between Er3+ and Tm3+ Ions in Fluoride Glass under 800 Nm and 980 Nm Excitation. J. Quant. Spectrosc. Radiat. 2012, 113, 87–95. [Google Scholar] [CrossRef]
  31. Cazorla, C.; Errandonea, D. Superionicity and polymorphism in calcium fluoride at high pressure. Phys. Rev. Lett. 2014, 113, 235902. [Google Scholar] [CrossRef] [Green Version]
  32. Zhang, X.; Schulte, A.; Chai, B. Raman Spectroscopic Evidence for Isomorphous Structure of GdLiF4 and YLiF4 Laser Crystals. Solid State Commun. 1994, 89, 181–184. [Google Scholar] [CrossRef]
  33. Zhao, C.; Hang, Y.; Zhang, L.; Yin, J.; Hu, P.; Ma, E. Polarized Spectroscopic Properties of Ho3+-Doped LuLiF4 Single Crystal for 2 μm and 2.9 μm Lasers. Opt. Mater. 2011, 33, 1610–1615. [Google Scholar] [CrossRef]
  34. Toncelli, A.; Tonelli, M.; Cassanho, A.; Jenssen, H. Spectroscopy and Dynamic Measurements of a Tm, Dy: BaY2F8 Crystal. J. Lumin. 1999, 82, 291–298. [Google Scholar] [CrossRef]
  35. Cornacchia, F.; Toncelli, A.; Tonelli, M. 2-μm Lasers with Fluoride Crystals: Research and Development. Prog. Quantum Electron. 2009, 33, 61–109. [Google Scholar] [CrossRef]
  36. Zhang, P.; Yin, J.; Zhang, B.; Zhang, L.; Hong, J.; He, J.; Hang, Y. Intense 2.8 μm Emission of Ho3+ Doped PbF2 Single Crystal. Opt. Lett. 2014, 39, 3942–3945. [Google Scholar] [CrossRef] [PubMed]
  37. Huang, X.; Wang, Y.; Zhang, P.; Su, Z.; Xu, J.; Xin, K.; Hang, Y.; Zhu, S.; Yin, H.; Li, Z. Efficiently Strengthen and Broaden 3 μm Fluorescence in PbF2 Crystal by Er3+/Ho3+ as Co-Luminescence Centers and Pr3+ Deactivation. J. Alloy. Compd. 2019, 811, 152027. [Google Scholar] [CrossRef]
  38. Kresse, G.; Hafner, J. Ab Initio Molecular Dynamics for Liquid Metals. Phys. Rev. B 1993, 47, 558. [Google Scholar] [CrossRef] [PubMed]
  39. Kresse, G.; Furthmüller, J. Efficiency of Ab-Initio Total Energy Calculations for Metals and Semiconductors Using a Plane-Wave Basis Set. Comp. Mater. Sci. 1996, 6, 15–50. [Google Scholar] [CrossRef]
  40. Blöchl, P.E. Projector Augmented-Wave Method. Phys. Rev. B 1994, 50, 17953. [Google Scholar] [CrossRef] [PubMed] [Green Version]
  41. Perdew, J.P.; Burke, K.; Ernzerhof, M. Generalized Gradient Approximation Made Simple. Phys. Rev. Lett. 1996, 77, 3865. [Google Scholar] [CrossRef] [Green Version]
  42. Ma, F.; Su, F.; Zhou, R.; Ou, Y.; Xie, L.; Liu, C.; Jiang, D.; Zhang, Z.; Wu, Q.; Su, L. The Defect Aggregation of Re3+ (Re = Y, La ~ Lu) in MF2 (M = Ca, Sr, Ba) Fluorites. Mater. Res. Bull. 2020, 125, 110788. [Google Scholar] [CrossRef]
  43. Aull, B.; Jenssen, H. Vibronic Interactions in Nd: YAG Resulting in Nonreciprocity of Absorption and Stimulated Emission Cross Sections. IEEE J. Quantum Electron. 1982, 18, 925–930. [Google Scholar] [CrossRef]
  44. Zhang, W.; Wang, Y.; Li, J.F.; Zhu, Z.J.; You, Z.Y.; Tu, C.Y. Spectroscopic Properties and Rate Equation Model of Er Doped BaLaGa3O7 Crystals. Mater. Res. Bull. 2018, 106, 282–287. [Google Scholar] [CrossRef]
  45. Liu, Y.; Wang, Y.; You, Z.; Li, J.; Zhu, Z.; Tu, C. Growth, Structure and Spectroscopic Properties of Melilite Er: CaLaGa3O7 Crystal for Use in Mid-Infrared Laser. J. Alloy. Compd. 2017, 706, 387–394. [Google Scholar] [CrossRef]
  46. Zhang, J.Y.; Han, S.J.; Liu, L.T.; Yao, Q.; Dong, W.M.; Li, J. Crystal Structure and Judd–Ofelt Analysis of Er3+ Doped LuAl3 (BO3)4 Crystal. Chin. Phys. Lett. 2018, 35, 096101. [Google Scholar] [CrossRef]
  47. Hou, W.; Xu, Z.; Zhao, H.; Xue, Y.; Wang, Q.; Xu, X.; Xu, J. Spectroscopic Analysis of Er: Y2O3 Crystal at 2.7 μm Mid-IR Laser. Opt. Mater. 2020, 107, 110017. [Google Scholar] [CrossRef]
Figure 1. XRD patterns and refined XRD patterns of the Er/Tm: PbF2, Er: PbF2, Tm: PbF2 crystals and PbF2 crystal standard card.
Crystals 11 01024 g001
Figure 2. (a) Thermodynamically stable Er3+ centers in PbF2 crystal; (b) Thermodynamically stable Tm3+ centers in PbF2 crystal; (c) Formation energy of Er3+ and Tm3+ versus the number of rare-earth ions within a cluster.
Crystals 11 01024 g002
Figure 3. Absorption spectra of Tm: PbF2, Er: PbF2, and Er/Tm: PbF2 crystals ranging from 400 to 2200 nm at room temperature. (Illustration: the photos of Er/Tm: PbF2, Er: PbF2, Tm: PbF2 crystals and their cut and polished crystal pieces, respectively.)
Crystals 11 01024 g003
Figure 4. (a) Fluorescence decay curves of the Tm3+: 3H4 energy level of Tm: PbF2 crystal; (b) fluorescence decay curves of the Tm3+: 3H4 energy level of Er/ Tm: PbF2 crystal (λex = 800 nm, λem = 1470 nm).
Crystals 11 01024 g004
Figure 5. (a) Emission spectra of the Er: PbF2, Er/Tm: PbF2 crystals in the range of 1400–1700 nm (λex = 800nm); (b) emission spectra of Tm: PbF2, Er/Tm: PbF2 crystals in the range of 1700–2200 nm (λex = 800nm).
Crystals 11 01024 g005
Figure 6. Emission spectra of the Er: PbF2, Er/Tm: PbF2 crystals in the range of 2500–3100 nm (λex = 800 nm).
Crystals 11 01024 g006
Figure 7. Simplified energy level scheme and electron transitions of Er3+/Tm3+ co-doped system.
Crystals 11 01024 g007
Figure 8. Up-conversion emissions of Er: PbF2, and Er/Tm: PbF2 crystals in the range of 760–860 nm (λex = 980nm).
Crystals 11 01024 g008
Figure 9. (a) Fluorescence decay curves of the Er3+: 4I11/2 energy level of Er: PbF2 crystal (λex = 800 nm, λem = 2780 nm); (b) Er3+: 4I11/2 energy level of Er/Tm: PbF2 crystal (λex = 800 nm, λem = 2780 nm); (c) Er3+: 4I13/2 energy level of Er: PbF2 crystal (λex = 1490 nm, λem=1550 nm); (d) Er3+: 4I13/2 energy level of Er/Tm: PbF2 crystal (λex = 1490 nm, λem = 1550 nm).
Crystals 11 01024 g009
Table 1. MIR emission cross-sections σem, and lifetimes of 4I11/2, 4I13/ 2 levels of Er/Tm: PbF2, Er: PbF2 crystals compared with other Er3+-doped crystals.
Crystalσemτ(4I11/2)τ(4I13/2)τ(4I11/2)/τ(4I13/2)Ref.
(10−20 cm2)(ms)(ms)(%)
1.0 at.% /0.5 at.% Er/Tm: PbF20.63@2780nm6.91 ± 0.013.14 ± 0.01220.06[This work]
1 at.% Er: PbF20.32@2780nm6.03 ± 0.0112.06 ± 0.0550.00[This work]
10 at.% Er:BaLaGa3O77.34@2714nm0.727.999.01[44]
10 at.% Er:CaLaGa3O717.9@2702nm0.778.419.16[45]
8 at.%Er:LuAl3(BO3)48.60@3170nm2.102.5482.68[46]
7 at.% Er:Y2O31.41@2723nm2.9517.5716.79[47]
10 at.% Er:SrGdGa3O7[email protected]μm1.104.4824.55[24]
5at.% Er:YAP9.00@2792nm0.857.3011.64[13]
7 at.% Er:Lu2O31.10@2730nm1.104.3025.58[14]
5 at.% Er:GdScO30.93@2720nm2.244.5749.02[15]
4 at.% Er:SrF20.78@2727nm9.5615.0663.48[16]
4 at.% Er:CaF20.65@2720nm5.989.9460.16
Publisher’s Note: MDPI stays neutral with regard to jurisdictional claims in published maps and institutional affiliations.

