Article

A Study of the Characteristics of Plasma Generated by Infrared Pulse Laser-Induced Fused Silica

Jilin Key Laboratory of Solid-State Laser Technology and Application, Changchun University of Science and Technology, Changchun 130022, China
*
Author to whom correspondence should be addressed.
Crystals 2021, 11(8), 1009; https://doi.org/10.3390/cryst11081009
Submission received: 2 August 2021 / Revised: 16 August 2021 / Accepted: 18 August 2021 / Published: 23 August 2021
(This article belongs to the Special Issue Advances in Middle Infrared Laser Crystals and Its Applications)

Abstract

:
When high energy infrared laser pulses are incident on fused silica, the surface of the fused silica is damaged and a laser-induced plasma is produced. Based on the theory of fluid mechanics and gas dynamics, a two-dimensional axisymmetric gas dynamic model was established to simulate the plasma generation process of fused silica induced by a millisecond pulse laser. The results show that the temperature of the central region irradiated by the laser is the highest, and the plasma is first produced in this region. When the laser energy density is 1.0 × 10⁴ J/cm2 and the pulse width is 0.2 ms, the maximum expansion velocity of the laser-induced plasma is 17.7 m/s. Under the same experimental conditions, the results of the simulation and experiment are in good agreement. With an increase in pulse width, the plasma expansion rate gradually decreases.

1. Introduction

With the popularization and application of a strong laser in various fields [1,2,3,4], optical elements as indispensable components of the laser system have received extensive attention. Because fused silica material has good light transmittance [5], it is widely used as an optical element in high power laser systems [6].
Fused silica material is one of the weakest components in a high power laser system. Its damage resistance directly affects the output performance of the laser. Even if there are subtle flaws, the performance of the laser will decrease. Therefore, it is of great significance to study the damage process of the interaction between the laser and fused silica [7,8]. R.W. Hopper et al. [9] established a theoretical model of laser damage induced by defects and studied the thermal stress damage caused by impurity defects in the target. F. Bolmeau et al. [10,11] used numerical simulation to study the laser energy deposition process caused by defects in fused silica.
The process of the interaction between the laser and fused silica is not only limited to material damage but also causes a series of processes such as phase transition, ablation, splashing, and plasma expansion. As a followup phenomenon of fused silica damage, plasma expansion has a high research value. However, the research on millisecond pulse laser-induced plasma generation of fused silica is quite scarce. Therefore, it is necessary to carry out related research on the plasma generation of fused silica induced by an infrared millisecond pulse laser.
As a high efficiency and commonly used numerical calculation method, the finite element analysis method is widely used in the treatment of various complex physical problems. M. Courtois et al. [12] used the finite element analysis method to numerically simulate and analyze the coupled heat transfer, fluid heat transfer, and thermal–mechanical coupling processes in laser welding. In this paper, the finite element method is used to simulate the plasma generation process of fused silica induced by the infrared millisecond pulse laser; the results of the simulation and experiment are in good agreement, and the results have good convergence.

2. Materials and Methods

In the process of laser heating the target, the state of the material changed from solid to liquid and then changed to a gaseous state. The laser interacted with the ejected gaseous material, the atoms were ionized, the plasma was formed, and ablation craters appeared in the laser-irradiated target area. The condensed target material spontaneously splashed into the action of atmosphere under the high pressure generated by the high temperature, which was the physical process of plasma expansion.
In the simulation process, considering plasma generation and wave propagation at geometric junctions, we used free triangular meshes to divide the computational domain. We refined the grids in the handover area and the upper area. The maximum cell size of the grid in the dense area was 0.02 mm, the smallest cell was 1.5 × 10⁻⁴ mm, the maximum cell growth rate was 1.08, and the curvature factor was 0.25. The time step used was the range of 0, 0.001, and 2, and the unit was millisecond.
Figure 1 is a schematic diagram of the numerical simulation of the laser-induced plasma. The initial plasma was generated on the surface of the target and propagated against the direction of the laser under the action of the laser.
The whole physical process of plasma generation and expansion satisfies conservation of mass, conservation of momentum, and conservation of energy. In the numerical simulation, the parameters of plasma changed with temperature T (where the units of T are K ) are shown in Table 1.
The following needed to be clear during the simulation: (1) The propagation velocity of the plasma is much lower than the speed of sound, which can be regarded as subsonic laminar flow. (2) Plasma generation and expansion during a small span of time without heat exchange with the outside and inside is a local thermal equilibrium.
Throughout the physical process, the total mass of matter remained unchanged, which satisfied the law of conservation of mass:
( ρ u ) = 0
In the formula: u is the fluid velocity, ρ is the density.
Momentum conservation equation:
ρ ( u t + u ( u ) ) = ( p + μ ( u + ( u ) T ) )
In the formula: p is the pressure, μ is the material viscosity.
Energy conservation equation:
ρ C P T t + ρ u C P T = ( k T ) + ( Q L a s e r Q L o s s )
In the formula: C P is the specific heat capacity, K is the thermal conductivity, Q L a s e r is the laser heat source, and Q L o s s is the heat source that maintains the plasma expansion loss.
In the energy conservation equation, Q L a s e r is one of the source terms of the laser heat source; it is simplified to the Gaussian surface heat source distribution that varies with radius and temperature:
Q L = A ( T ) 2 I 0 π r 0 2 exp ( 2 r 2 r 0 2 ) τ ( t )
where I 0 is the power density, r 0 is the laser spot radius, and A ( T ) is the dynamic absorption rate.
τ ( t ) is the time distribution function of the laser pulse width; the expression is as follows:
τ ( t ) = { 1 , t τ P 0 , t τ P
τ P is the laser pulse width.
The vaporization and expansion process included the vapor evaporation process of the material leaving the target surface and the process of spraying outwards under continued heating. The mass loss of the surface layer of the fused silica material during the outward spraying led to the further formation of molten pits and continued to induce plasma. The quantity that affects the quality loss is the mass mobility [12]:
m 0 = M S i O 2 2 π k B P s a t ( T ) T β
where β is the diffusion coefficient, the value is assumed to be 1 at the beginning of the evaporation, and the value is 0 when it is stabilized, k B is Boltzmann’s constant, P s a t ( T ) is the saturated vapor pressure of the target steam [12,13], and the expression is:
P s a t ( T ) = P a m b exp ( L v M S i O 2 k B T ( T T v 1 ) )
where P a m b is the atmospheric pressure, L v is the latent heat of evaporation, T v is the evaporation temperature, and M S i O 2 is the molar mass of the fused silica.
In Equation (3), the expression of Q L o s s is:
Q L o s s = L V v r ρ l + k T n
ρ l is the density of the material after melting, L V is the latent heat of vaporization, v r is the expansion speed of the plasma, and k is the energy loss rate in the system.
Computational domain boundary conditions:
k T ( r , z , t ) z | z = h , z = b = 0

3. Principle of the Experiment

The experimental measurement principle diagram of the plasma expansion of fused silica induced by the millisecond pulse laser is shown in Figure 2.
In order to analyze the expansion law of the plasma generated by laser-induced fused silica, the high-time-resolution optical shadow method was used to monitor the evolution of the laser-induced plasma flow field. The time delay between the high-speed camera and the laser system was adjusted by using the DG645 digital delay generator. The high-speed camera received the image. By analyzing the optical shadow images under different time series conditions, the expansion and propagation process of the laser-induced plasma was obtained.

4. Results and Discussion

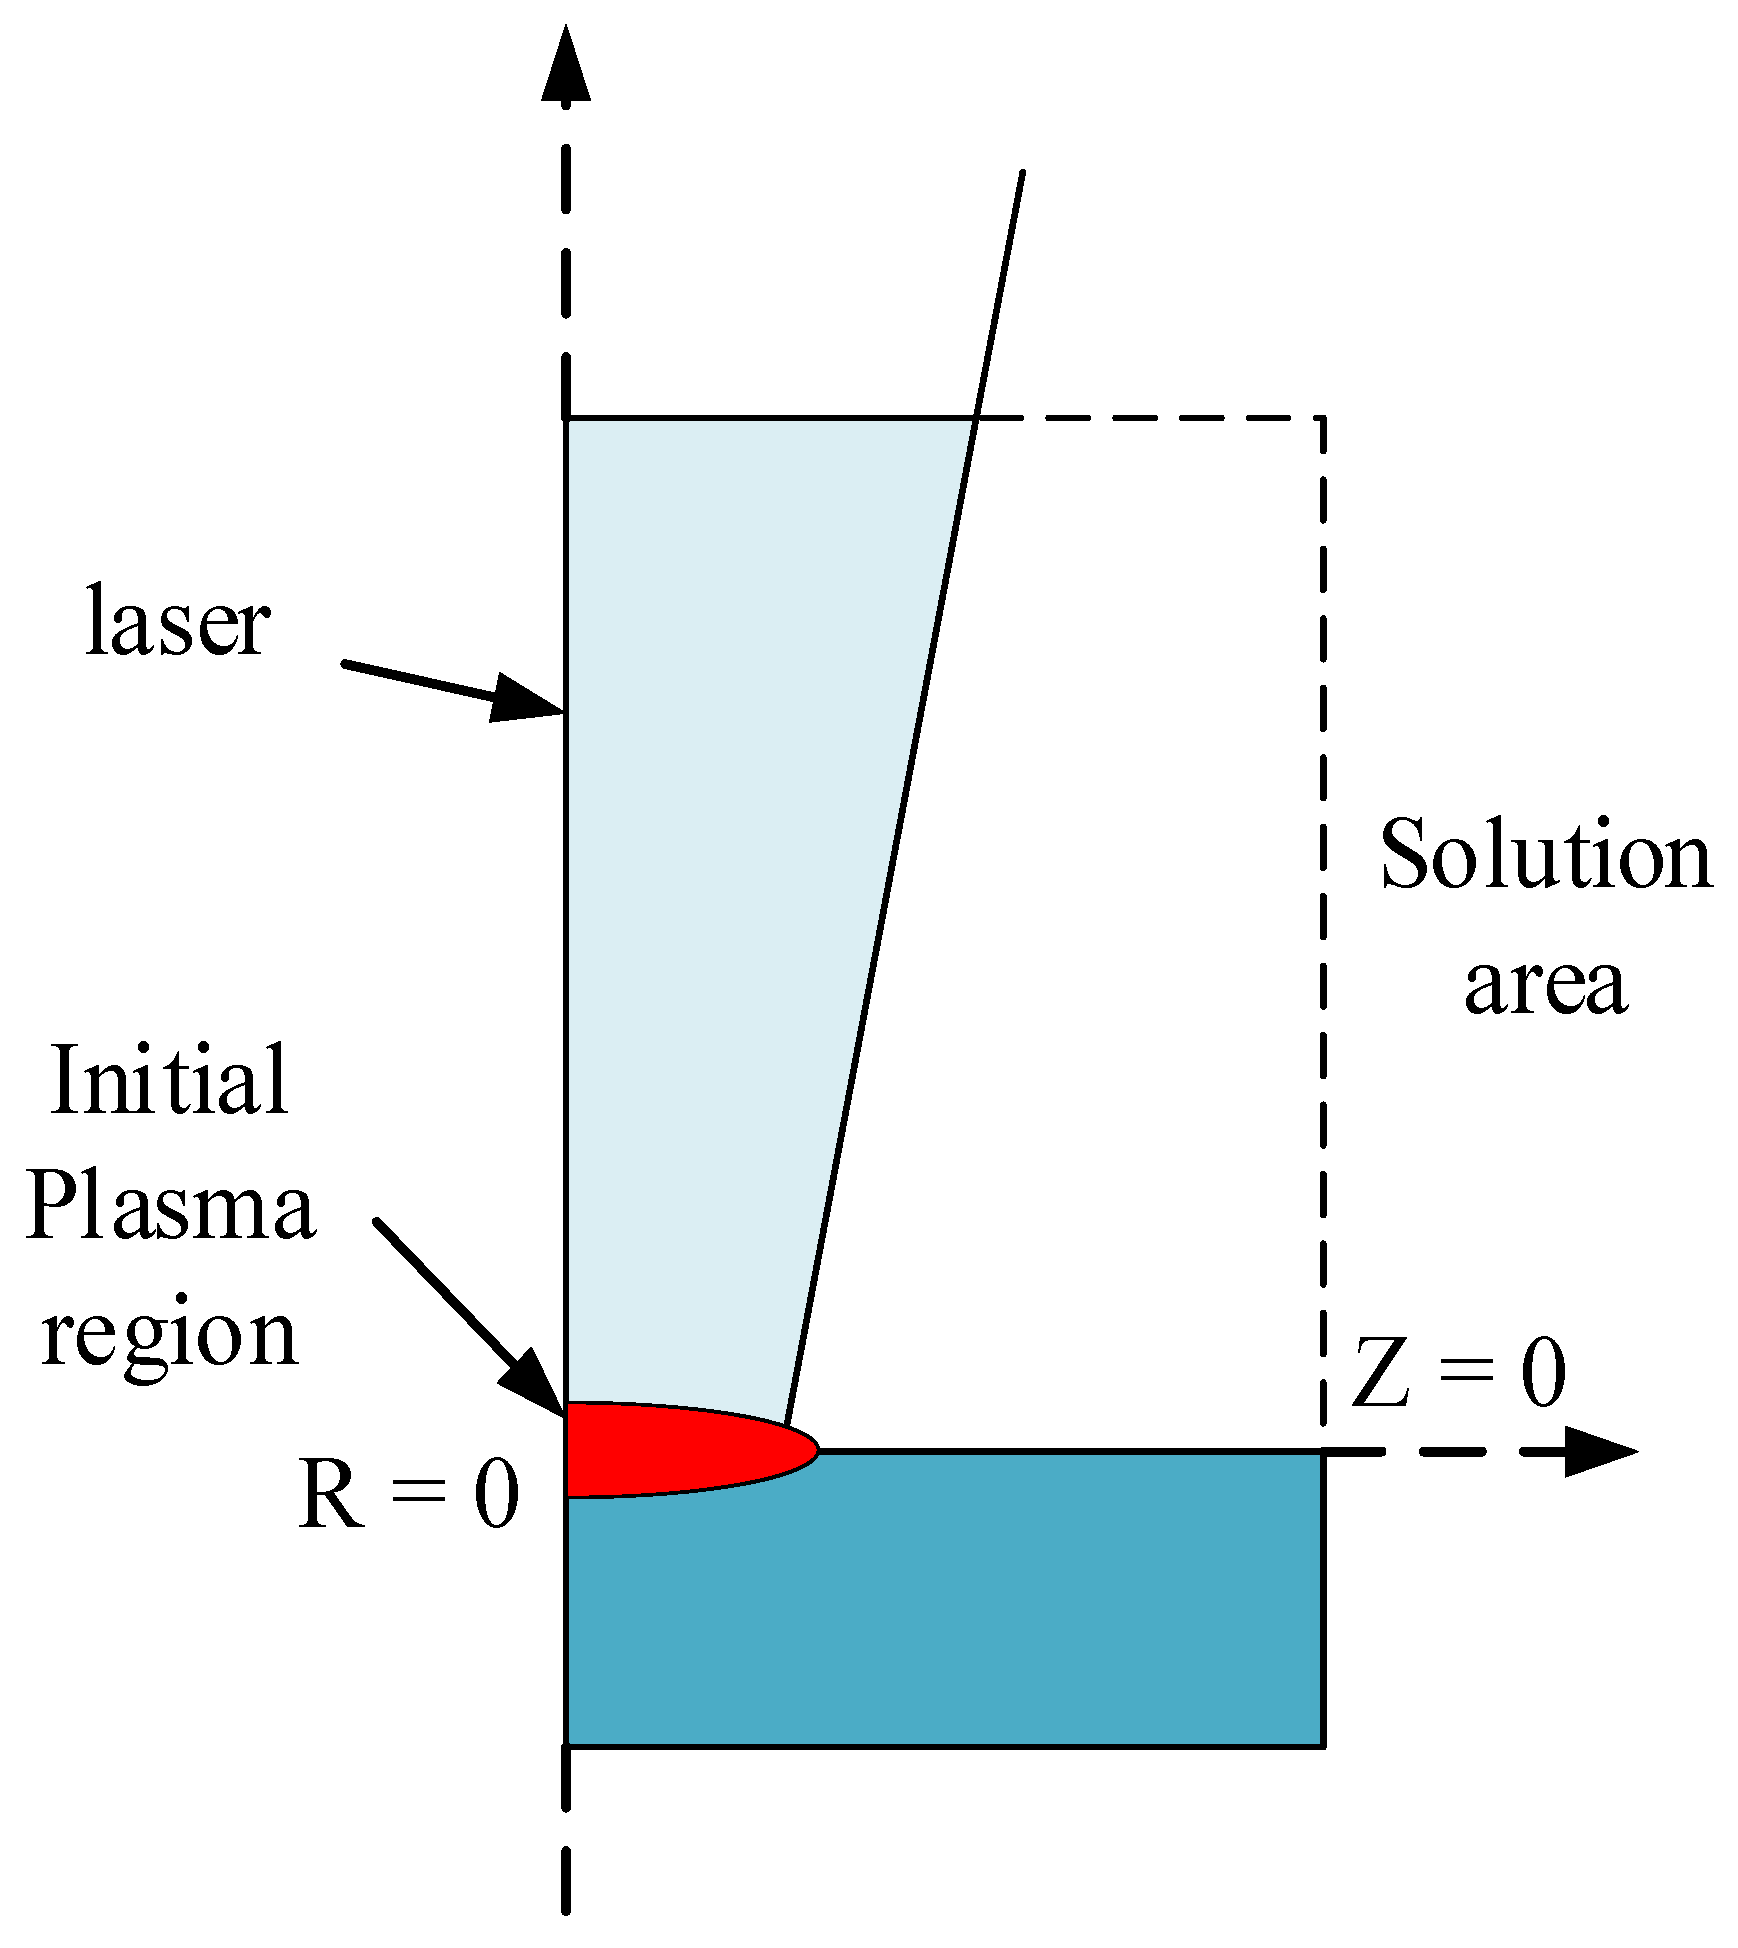
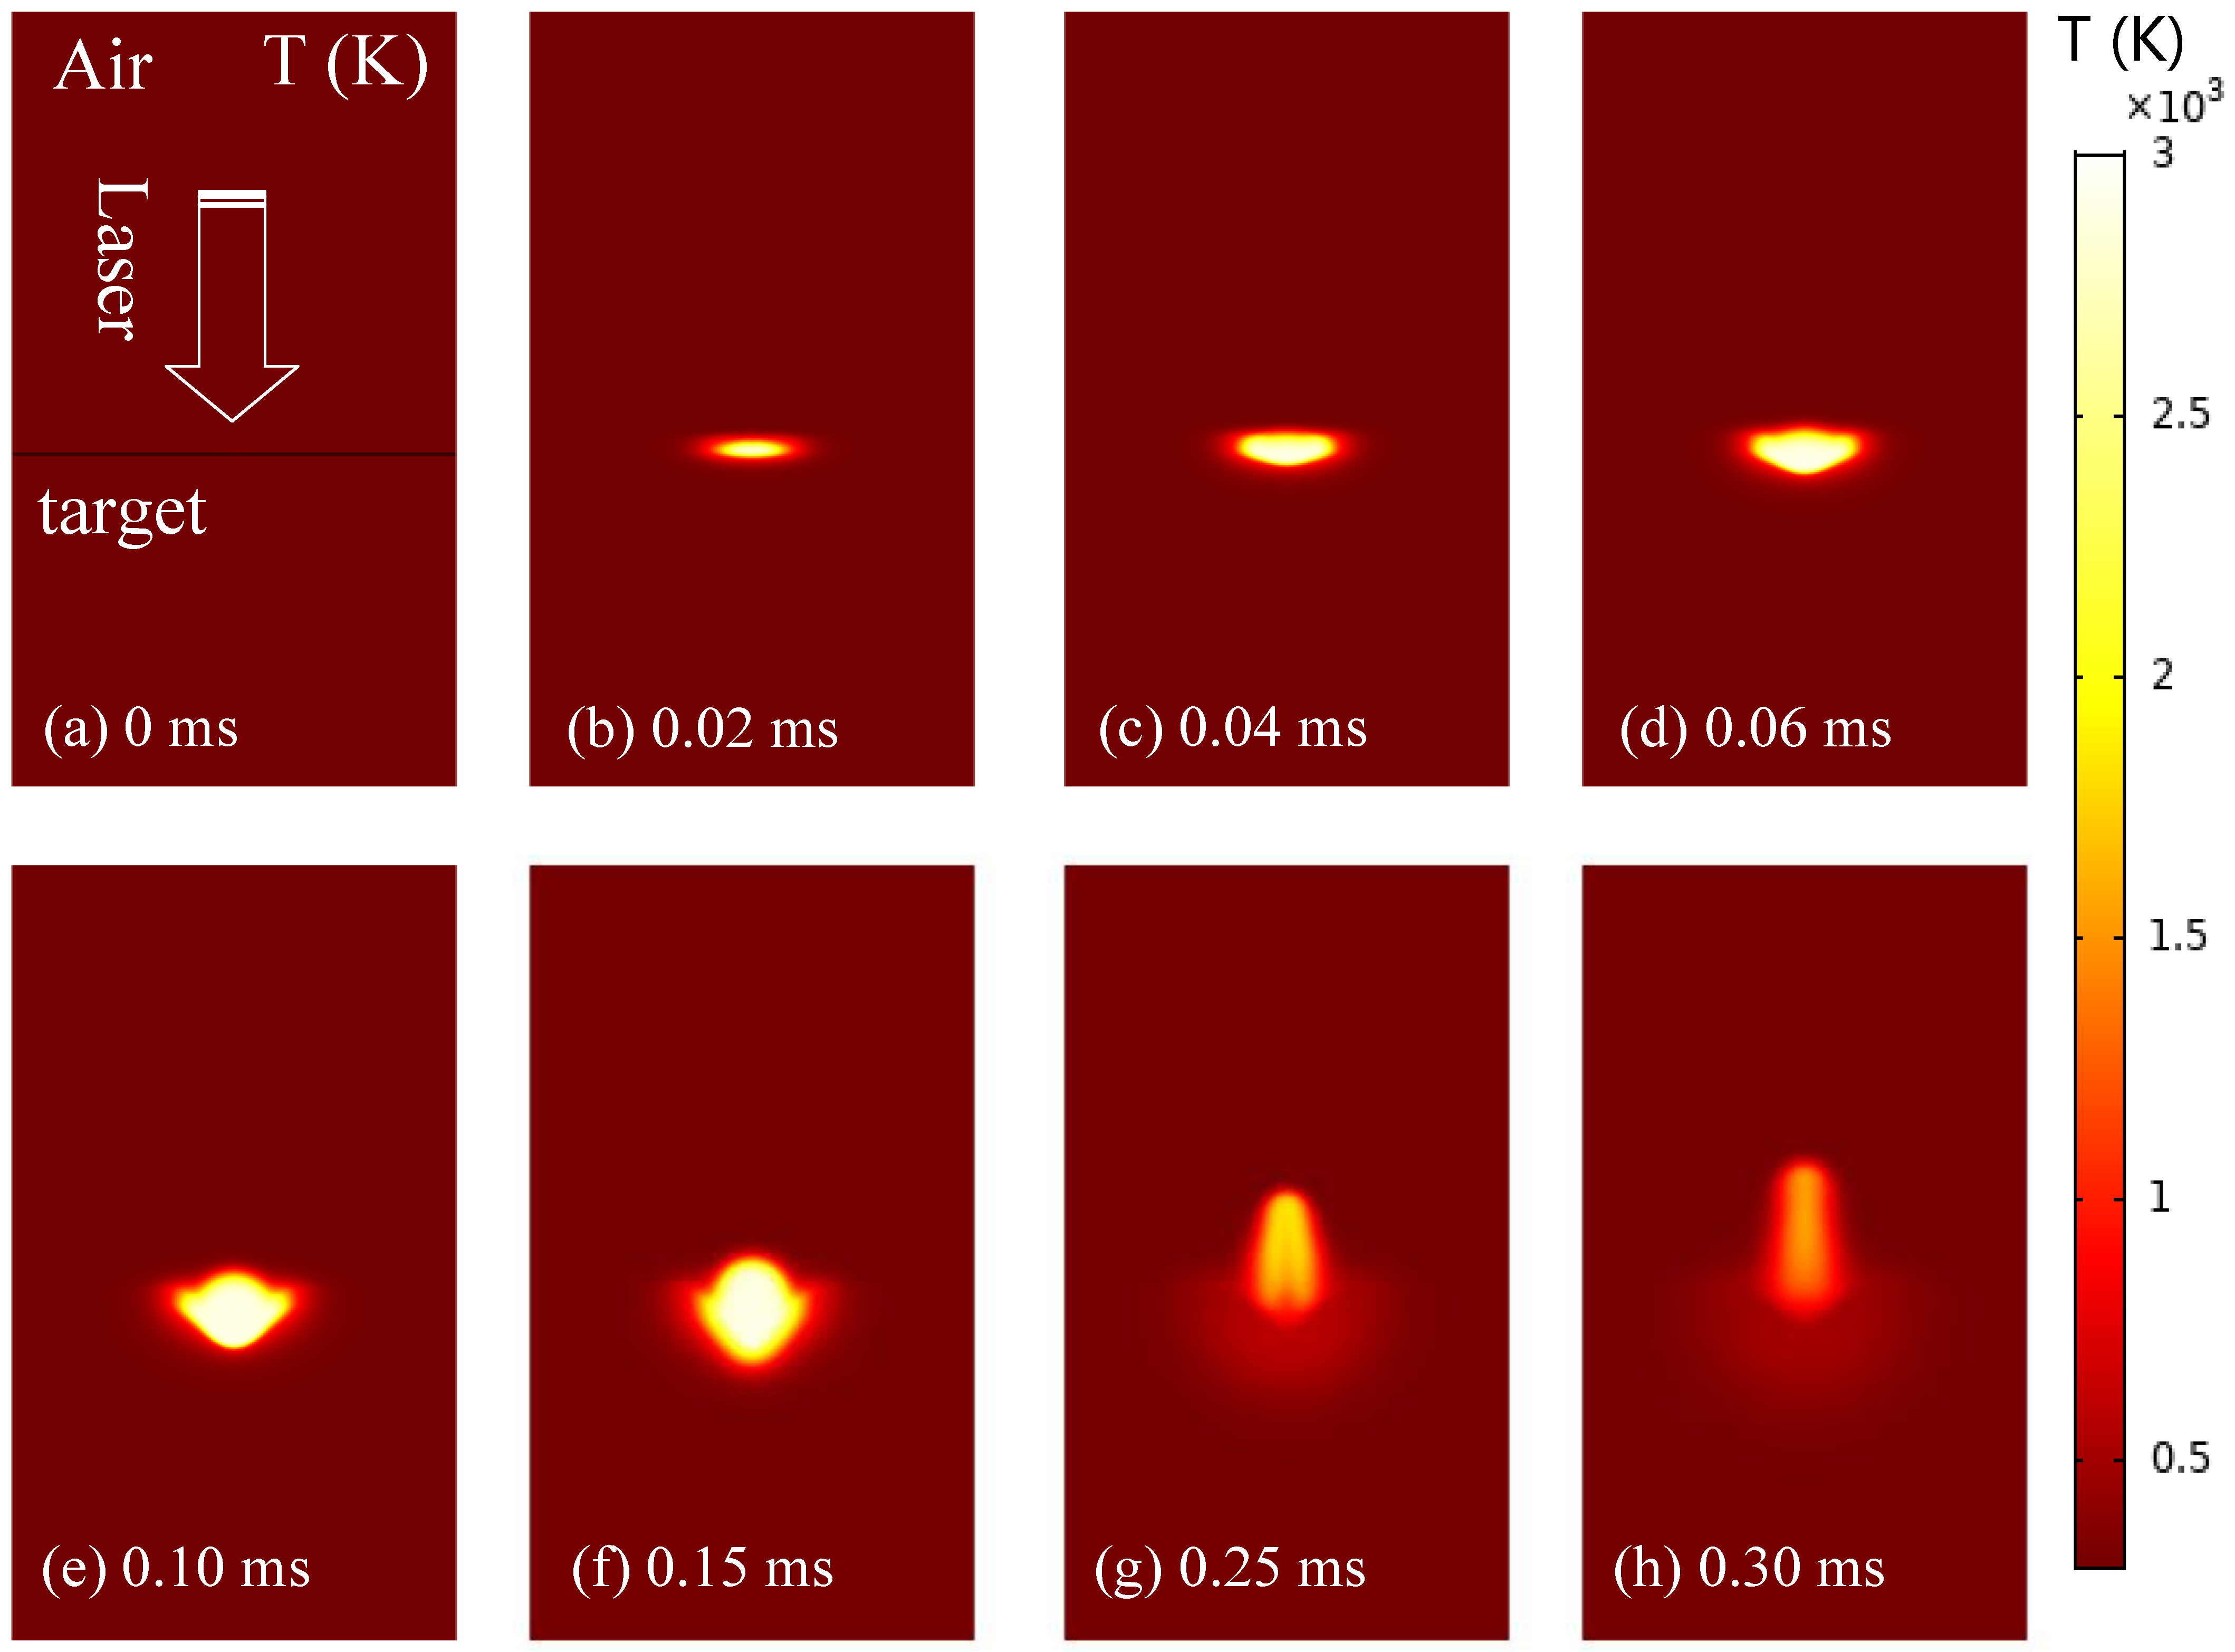
4.1. Analysis of the Plasma Temperature Field Induced by a Pulsed Laser in Fused Silica

Under millisecond pulse laser irradiation, the laser energy densities used to simulate the plasma generated by laser irradiation of fused silica were 8.0 × 10³ J/cm2, the pulse width was 0.2 ms, and the irradiation radius was 0.25 mm.
The temperature field results of the numerical simulation of the plasma generated by the millisecond pulse laser induced fused silica were as follows:
When the laser with an energy density of 8.0 × 10³ J/cm2 irradiated the surface of the fused silica material, the main form of plasma generated in the laser irradiation area was thermally induced plasma. Due to the laser heating, the surface of the fused silica material melted, vaporized, and splashed, forming a numerical simulation of the low-temperature thermally induced plasma temperature field as shown in the figure.
Figure 3 shows the temperature field distribution of the laser-induced plasma at different times of the plasma. At the initial stage of laser action 0–0.06 ms, the temperature of the irradiated area rose rapidly and plasma began to be generated; the temperature gradually stabilized within the time range of 0.10–0.15 ms, the plasma slowly expanded outward, and thermally induced plasma was generated. In the time range of 0.25–0.30 ms, since the internal energy of the thermally induced plasma was converted into kinetic energy, the plasma expanded outwards and the temperature decreased accordingly.
Figure 4 is the curve of radial temperature change with time when the laser energy density was 8.0 × 10³ J/cm2 in the period of 0.005–0.030 ms. From Figure 4, it can be seen that the temperature change in the center area of the laser irradiation on the surface of the target was much greater than that of other areas. This is because the pulse laser has a Gaussian distribution, and the laser energy is concentrated in the center, which makes the highest temperature rise in the irradiated center area the fastest. Figure 5 is the curve of radial temperature change with time when the laser energy density was 8.0 × 10³ J/cm2 in the period of 0.035–0.055 ms. Compared with Figure 4, it can be seen that the temperature in the central area of laser irradiation was stable at 0.030 ms, and plasma began to be generated. At this time, since the action time of the pulsed laser did not stop, the generation area of the plasma began to expand.

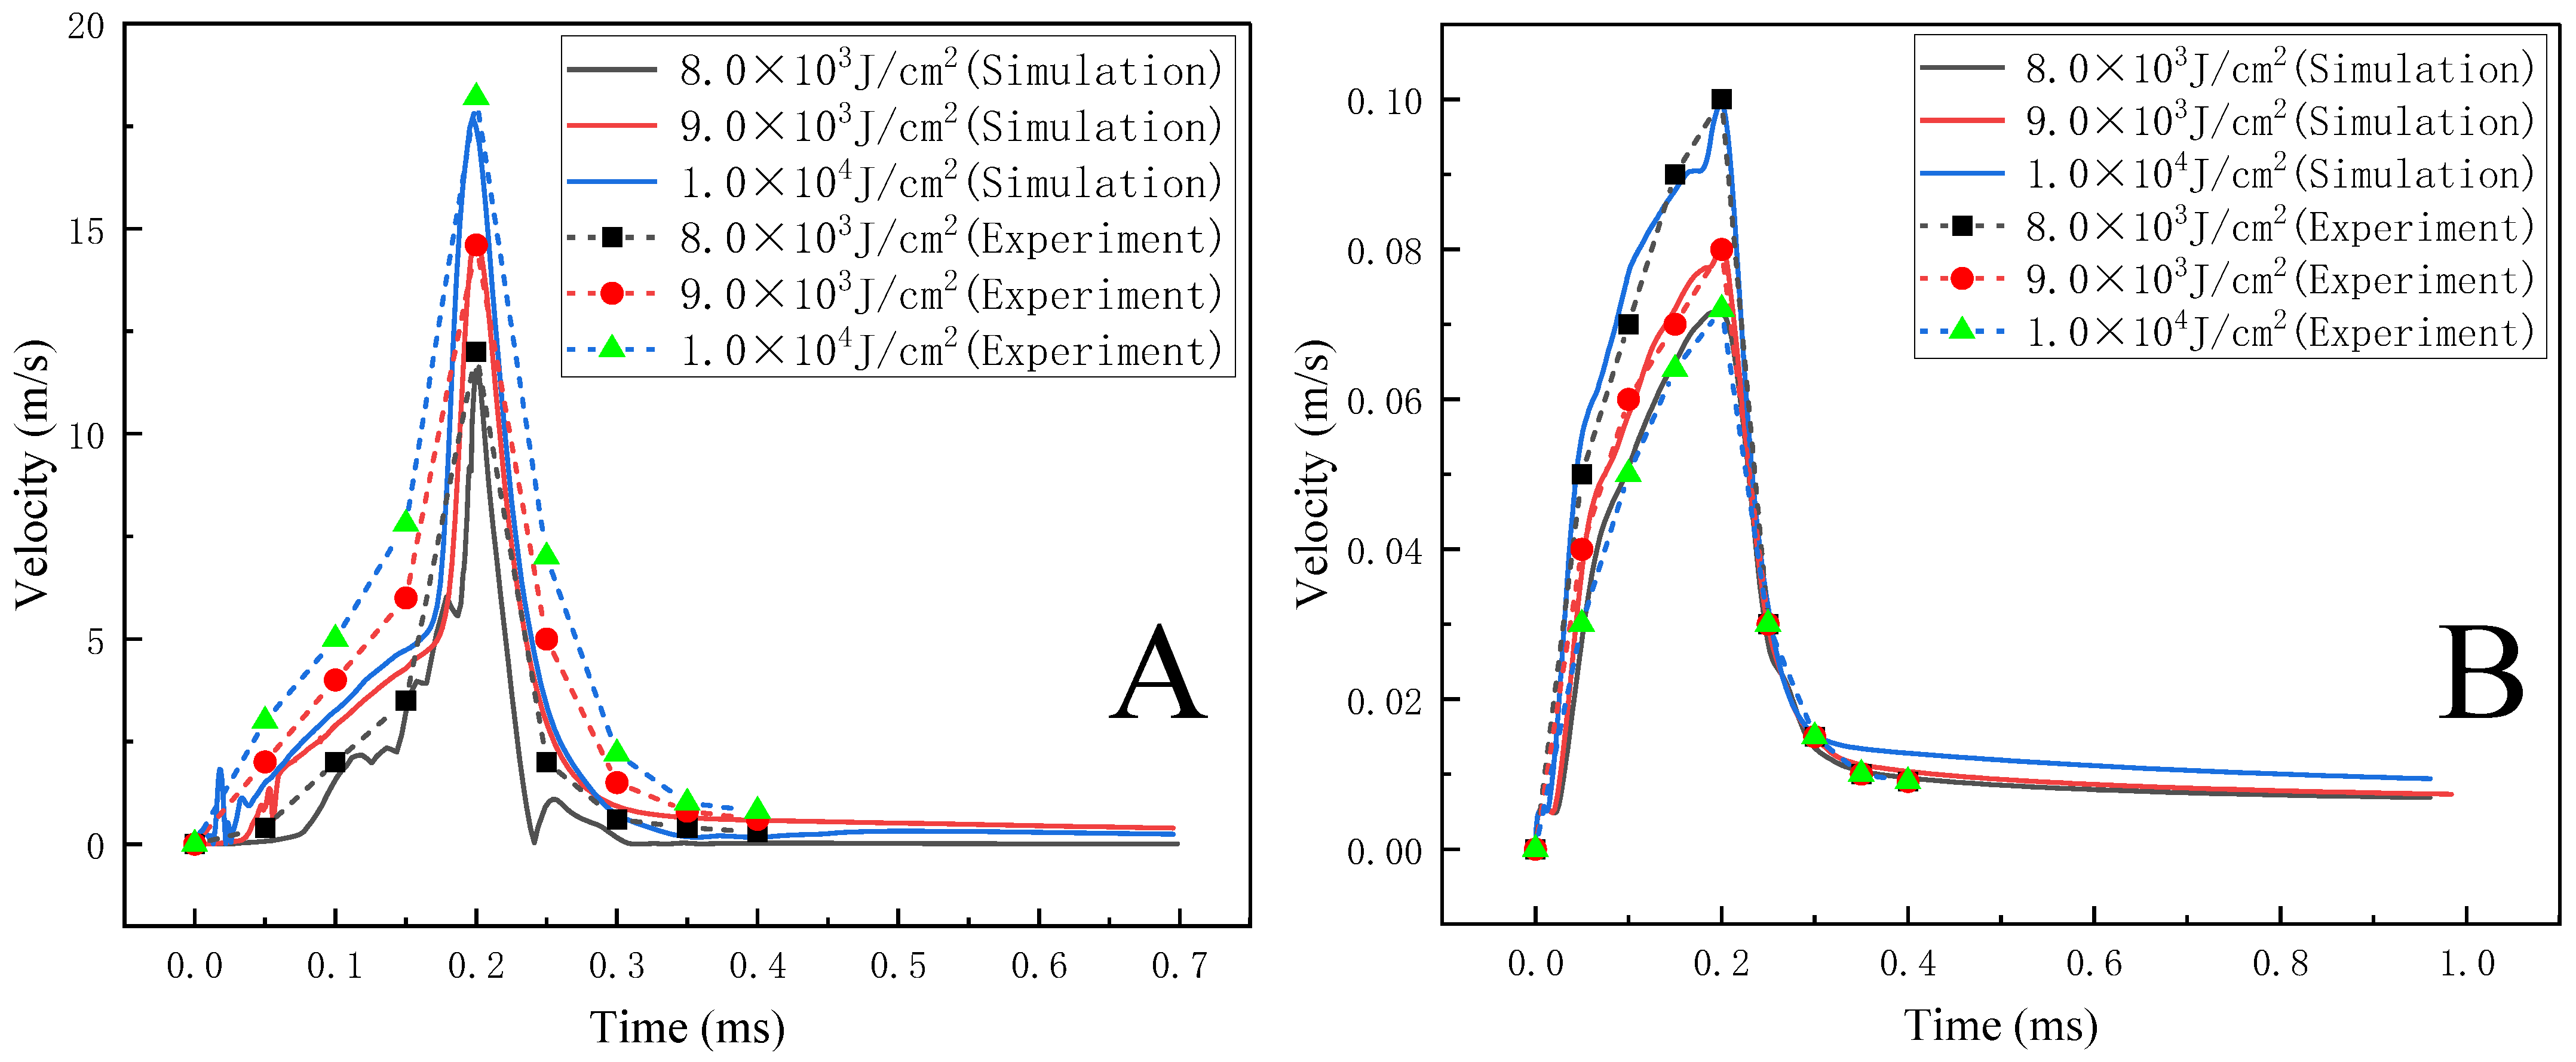
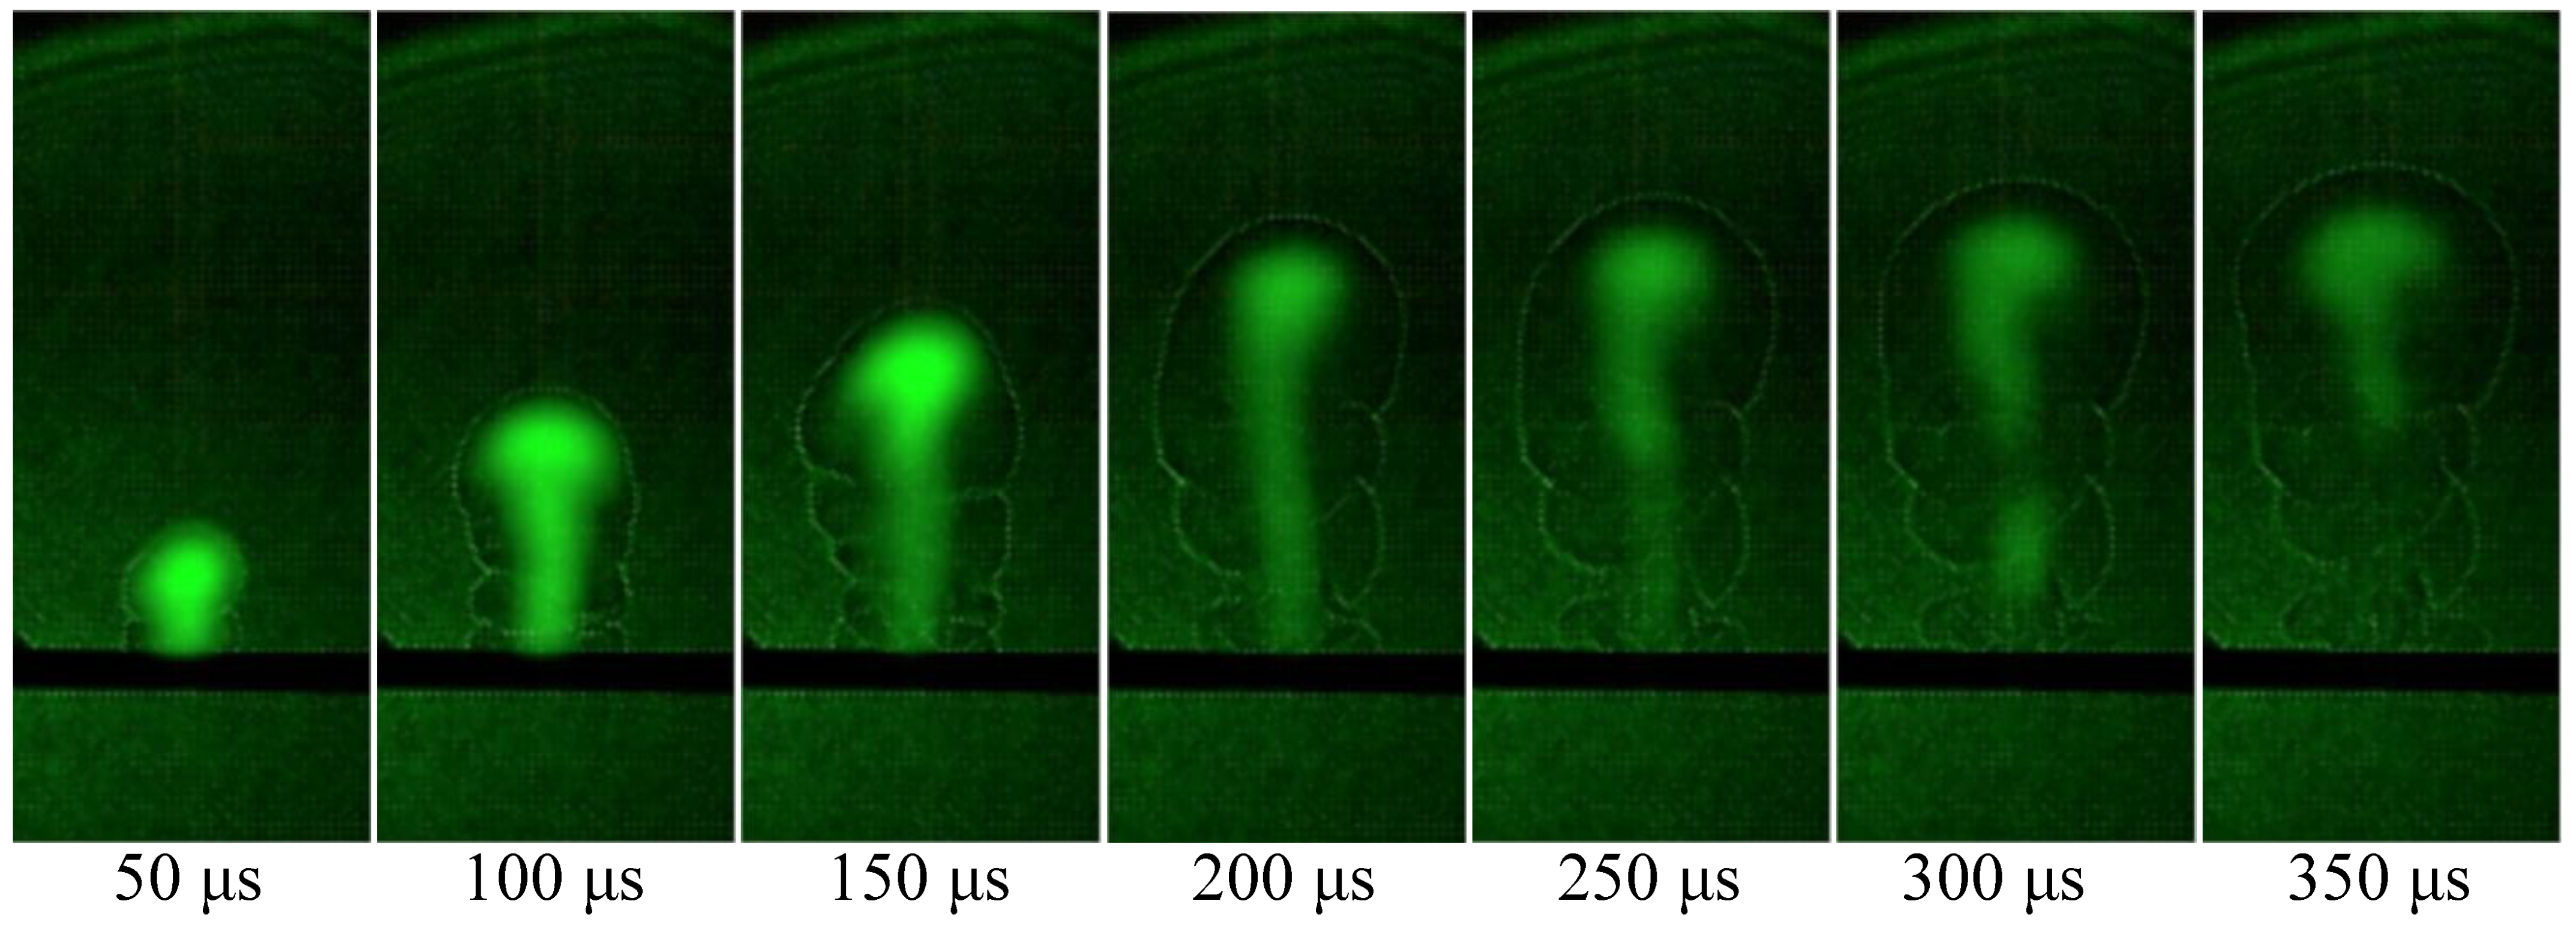
4.2. Analysis of the Plasma Flow Field in Fused Silica Induced by a Pulsed Laser

Figure 6 shows the distribution of the plasma flow field caused by the laser with a laser energy density of 1.0 × 10⁴ J/cm2 and a pulse width of 0.2 ms acting on the fused silica.
Figure 6 shows the flow field distribution of the plasma at different times. In the initial stage of pulse laser action, the velocity of the flow field in the action area increased gently (0–0.14 ms). In the time range of 0.14–0.20 ms, the plasma flow field velocity increased rapidly and reached maximum velocity at 0.2 ms, with a value of 17.7 m/s. The velocity of the plasma flow field decreased gradually between 0.24 ms and 0.28 ms. This was because the laser action stopped, and the laser irradiation did not continue to provide energy; the plasma could only rely on its own internal energy to be converted into kinetic energy to continue to maintain its outward expansion.
The plasma expansion velocity as a function of time t was found using
v ( t ) = L ( t + t ) L ( t ) t
where the expanding plasma front is measured to reach distance L ( t ) at time t , and t is a small interval of time typically; the unit of t we used here is μs [14].
Figure 7A shows the axial velocity distribution of plasma generated by the millisecond laser-induced fused silica with a pulse width of 0.2 ms; the dotted line is the experimental results, the solid line is the simulation results. Within 0–0.2 ms, the laser induced plasma continuously absorbed laser energy and expanded outward rapidly. Figure 7B shows that the axial plasma expansion rate was much greater than the radial expansion rate. The reason for this phenomenon is that the plasma expansion speed is determined by the laser energy. When the laser was incident perpendicular to the target surface, the laser energy distributed in the axial direction was much greater than the laser energy in the radial direction. The axial position made it easier for the plasma to move faster than in the radial position. Therefore, there was a large gap between the expansion speed of the axial plasma and the expansion speed of the radial plasma.
Figure 8 shows the evolution process of the plasma expansion based on the shadow method using a high-speed camera with a pulse width of 0.2 ms under the same laser energy density (which was 50 μs/frame). Through calculation, we obtained the maximum expansion velocity of the combustion wave in this process, about 18.2 m/s. The observed experimental phenomena were in good agreement with our calculation results.
Figure 9 shows the relationship between the plasma velocity field and the pulse width at three different energy densities of 8.0 × 10³ J/cm2, 9.0 × 10³ J/cm2, and 1.0 × 10⁴ J/cm2 (Figure 9A–D), respectively, corresponding to the pulse widths of 0.2 ms, 0.5 ms, 0.8 ms, and 1.0 ms.
Figure 10 shows the relationship between the plasma expansion velocity field and the laser pulse width under three different laser energy densities. From Figure 10, it can be seen that when the laser energy density was 8.0 × 10³ J/cm2, the maximum speeds corresponding to 0.2 ms, 0.5 ms, 0.8 ms, and 1.0 ms were 11.545 m/s, 10.169 m/s, 8.0608 m/s, and 6.3985 m/s. When the energy density was 9.0 × 10³ J/cm2, the maximum speeds corresponding to the simulation results were 14.76 m/s, 11.848 m/s, 9.8884 m/s, and 8.159 m/s, respectively. When the energy density was 1.0 × 10⁴ J/cm2, the corresponding maximum speeds were 17.7 m/s, 15.769 m/s, 13.453 m/s, and 10.046 m/s, respectively.
Comparing the plasma flow field velocity in Figure 8 and Figure 9, it can be seen that the time for the plasma flow field velocity to reach the maximum value increased with the increase in the pulse width, and the maximum velocity decreased with the increase in the pulse width. After the laser ended, the plasma flow field velocity rapidly decreased to zero.

5. Conclusions

This paper considered the laser energy transmission processes including thermal radiation, heat conduction, and convection, and simulated the whole physical process of the millisecond pulse laser induced fused silica to generate plasma, and the simulation results have good convergence. The simulation of laser-induced fused silica plasma can easily provide some details, such as the initial plasma temperature, which is not easy to measure in the experiment. It can deepen people’s understanding of the initial details of plasma generation and make the plasma generation process less abstract. The plasma simulation model still has some shortcomings, and people need to continue to improve it in future work, so that it can represent a more realistic physical process. The results were as follows:
(1)
The temperature field mainly discussed the relationship of temperature distribution in the radial position over time. The simulation results showed that the temperature in the center region irradiated by the laser was the highest, and plasma was first generated in this region.
(2)
In the velocity field, the plasma flow field under different laser energy densities and pulse widths were analyzed and studied, and the relationship between the plasma expansion law and the laser energy density and pulse width were obtained. The simulation results showed that there was a large gap between the axial plasma expansion speed and the radial plasma expansion speed; the plasma expansion speed increased with the increase in the laser energy density and decreased with the increase in the pulse width. The simulation results were in good agreement with the experimental results, and it also provided a theoretical and experimental basis for studying the laser-induced plasma process of fused silica materials.

Author Contributions

Conceptualization, L.W. and Z.Z.; methodology, C.G.; software, C.G.; validation, L.W., X.S. and Z.Z.; formal analysis, L.W.; investigation, L.W.; resources, L.W.; data curation, L.W.; writing—original draft preparation, L.W.; writing—review and editing, J.C.; visualization, L.W.; supervision, J.C.; project administration, J.C.; funding acquisition, J.C. All authors have read and agreed to the published version of the manuscript.

Funding

This research was funded by the National Natural Science Foundation of China, grant number 62005023.

Institutional Review Board Statement

Not applicable.

Informed Consent Statement

Not applicable.

Data Availability Statement

Not applicable.

Acknowledgments

Thanks to the Jilin Key Laboratory of Solid-State Laser Technology and Application, School of Science, Changchun University of Science and Technology.

Conflicts of Interest

The authors declare no conflict of interest.

References

  1. Zhuang, S.; Kainuma, S.; Yang, M.; Haraguchi, M.; Asano, T. Characterizing corrosion properties of carbon steel affected by high-power laser cleaning. Constr. Build. Mater. 2021, 274, 122085. [Google Scholar] [CrossRef]
  2. Schneider, F.; Wolf, N.; Petring, D. High Power Laser Cutting of Fiber Reinforced Thermoplastic Polymers with cw- and Pulsed Lasers. Phys. Procedia 2013, 41, 415–420. [Google Scholar] [CrossRef]
  3. Ohnishi, T.; Kawahito, Y.; Mizutani, M.; Katayama, S. High-Power and High-Brightness Laser Butt Welding with Using Hot Wire for Thick High-Strength Steel Plate. Q. J. Jpn. Weld. Soc. 2011, 29, 41–47. [Google Scholar] [CrossRef] [Green Version]
  4. Wu, J.; Zhang, H.; Li, Y.; Zhong, Q. Numerical analysis of mass distribution in side shielding gas in laser welding. HanjiXuebao/Trans. China Weld. Inst. 2018, 39, 39–43. [Google Scholar]
  5. Kotz, F.; Quick, A.S.; Risch, P.; Martin, T.; Hoose, T.; Thiel, M.; Helmer, D.; Rapp, B.E. Two-Photon Polymerization of Nanocomposites for the Fabrication of Transparent Fused Silica Glass Microstructures. Adv. Mater. 2021, 33, 2006341. [Google Scholar] [CrossRef] [PubMed]
  6. Yoshida, H.; Fujita, H.; Nakatsuka, M.; Yoshida, K. High Resistant Phase-conjugated Stimulated Brillouin Scattering Mirror Using Fused-silica Glass for Nd:YAG Laser System. Jpn. J. Appl. Phys. 1999, 38, L521–L523. [Google Scholar] [CrossRef]
  7. Kozlowski, M.R.; Thomas, I.M.; Campbell, J.H.; Rainer, F. High-power optical coatings for a megajoule-class ICF laser. In Proceedings of the SPIE, Berlin, Germany, 14–19 September 1992; pp. 105–119. [Google Scholar]
  8. Wang, B.; Dai, G.; Zhang, H.; Ni, X.; Shen, Z.; Lu, J. Damage performance of TiO2/SiO2 thin film components induced by a long-pulsed laser. Appl. Surf. Sci. 2011, 257, 9977–9981. [Google Scholar] [CrossRef]
  9. Hopper, R.W.; Ublmann, D.R. Mechanism of inclusion damage in laser glass. J. Appl. Phys. 1970, 41, 4023–4037. [Google Scholar] [CrossRef]
  10. Bonneau, F.; Combis, P.; Rullier, J.L.; Vierne, J.; Pellin, M.; Savina, M.; Broyer, M.; Cottancin, E.; Tuaillon, J.; Pellarin, M.; et al. Study of UV laser interaction with gold nanoparticles embedded in silica. Appl. Phys. B 2002, 75, 803–815. [Google Scholar] [CrossRef]
  11. Bonneau, F.; Combis, P.; Rullier, J.L.; Vierne, J.; Bertussi, B.; Commandre, M.; Gallais, L.; Natoli, J.Y.; Bertron, I.; Malaise, F.; et al. Numerical simulations for description of UV laser interaction with gold nanoparticles embedded in silica. Appl. Phys. B 2004, 78, 447–552. [Google Scholar] [CrossRef]
  12. Courtois, M.; Carin, M.; Le Masson, P.; Gaied, S.; Balabane, M. A new approach to compute multi-reflections of laser beam in a keyhole for heat transfer and fluid flow modelling in laser welding. J. Phys. D Appl. Phys. 2013, 46, 505305. [Google Scholar] [CrossRef]
  13. Ranjbar, O.A.; Lin, Z.; Volkov, A.N. One-dimensional kinetic simulations of plume expansion induced by multi-pulse laser irradiation in the burst mode at 266 nm wavelength. Vacuum 2018, 157, 361–375. [Google Scholar] [CrossRef]
  14. Ji-Xing, C.; Ming, G.; Xu, Q.; He, L.; Guang-Yong, J. Gas dynamics and combustion wave expanding velocity of laser induced plasma. Acta Phys. Sin. 2017, 66, 094202. [Google Scholar] [CrossRef]
Figure 1. Schematic diagram of the initial plasma generation area.
Crystals 11 01009 g001
Figure 2. Experimental setup.
Crystals 11 01009 g002
Figure 3. Time-resolved simulation results of the plasma temperature field, subfigures (ah) are the distribution diagrams of the plasma temperature field at different moments.
Crystals 11 01009 g003
Figure 4. Simulation results of the radial temperature changing with time when the laser energy density was 8.0 × 10³ J/cm2 in the time period of 0.005–0.030 ms.
Crystals 11 01009 g004
Figure 5. Simulation results of the radial temperature change with time when the laser energy density was 8.0 × 10³ J/cm2 in the time period of 0.035–0.055 ms.
Crystals 11 01009 g005
Figure 6. Simulation results graph of the plasma velocity evolution with time under 1.0 × 10⁴ J/cm2 laser energy density, subfigures (ah) are the distribution diagrams of the plasma flow field at different moments.
Crystals 11 01009 g006
Figure 7. The evolution curve of the maximum plasma velocity field with time under different laser energies; (A) Axial plasma flow field velocity curve; (B) Radial plasma flow field velocity curve.
Crystals 11 01009 g007
Figure 8. Plasma expansion process image.
Crystals 11 01009 g008
Figure 9. Distribution of the plasma flow field under different pulse widths; (A) The evolution of the plasma flow field with time when the pulse width was 0.2 ms; (B) The evolution of the plasma flow field with time when the pulse width was 0.5 ms; (C) The evolution of the plasma flow field with time when the pulse width was 0.8 ms; (D) The evolution of the plasma flow field with time when the pulse width was 1 ms.
Crystals 11 01009 g009
Figure 10. The relationship between the velocity field and pulse width under different laser energy densities.
Crystals 11 01009 g010
Table 1. Material parameters required for numerical simulation.
Feature Parameter NameSymbolNumerical Value
Plasma Density ρ / ( g cm 3 ) 3.49/T × 10−6
Plasma Thermal conductivity k / ( Wm 1 K 1 ) −0.002 + 1.5 × 10⁻⁴ × T − 7.9 × 10⁻⁸ × T2 + 4.12 × 10⁻¹¹ × T3 − 7.44 × 10⁻¹⁵ × T4
Plasma Heat capacity C / ( J / ( kg K ) ) 1047.27 + 9.45 × 10⁻⁴ × T2 − 6.02 × 10⁻⁷ × T3 + 1.29 × 10⁻¹⁰ × T4
Plasma Viscosity coefficient η / ( Pa S ) −8.38 × 10⁻⁷ + 8.36 × 10⁻⁸ × T − 7.69 × 10⁻¹¹ × T2 + 4.64 × 10⁻¹⁴ × T3 − 1.07 × 10⁻¹⁷ × T4
Melting point T m / K 1730
Boiling point T v / K 2503
Molar mass M S i O 2 / ( g / mol ) 60
Publisher’s Note: MDPI stays neutral with regard to jurisdictional claims in published maps and institutional affiliations.

