Article

RF-Characterization of HZO Thin Film Varactors

1
Fraunhofer IPMS, Center Nanoelectronic Technologies, An der Bartlake 5, 01109 Dresden, Germany
2
Faculty of Electrical and Computer Engineering, TU Dresden, Mommsenstr. 15, 01067 Dresden, Germany
*
Author to whom correspondence should be addressed.
Crystals 2021, 11(8), 980; https://doi.org/10.3390/cryst11080980
Submission received: 10 July 2021 / Revised: 13 August 2021 / Accepted: 13 August 2021 / Published: 18 August 2021
(This article belongs to the Special Issue Ferroelectrics Materials for Microwave Devices)

Abstract

:
A microwave characterization at UHF band of a ferroelectric hafnium zirconium oxide metal-ferroelectric-metal (MFM) capacitors for varactor applications has been performed. By using an impedance reflectivity method, a complex dielectric permittivity was obtained at frequencies up to 500 MHz. Ferroelectric Hf0.5Zr0.5O2 of 10 nm thickness has demonstrated a stable permittivity switching in the whole frequency range. A constant increase of the calculated dielectric loss is observed, which is shown to be an effect of electric field distribution on highly resistive titanium nitride (TiN) thin film electrodes. The C-V characteristics of a “butterfly” shape was also extracted, where the varactors exhibited a reduction of capacitance tunability from 18.6% at 10 MHz to 15.4% at 500 MHz.

1. Introduction

CMOS compatible materials with extraordinary electrical properties (e.g., piezoelectric, ferroelectric, or multiferroic) are becoming very attractive in the upcoming technology areas, like neuromorphic computing, 5G, etc. An example of such CMOS compatible materials is ferroelectric hafnium oxide (HfO2) discovered by Boescke et al. [1]. It is considered now as a very prospective candidate for nonvolatile memory devices [2] and neuromorphic computing [3,4,5]. It can be deposited by using atomic layer deposition (ALD), which makes it feasible to be included into large-scale industrial production. Ferroelectricity in such films occurs in an orthorhombic non-centrosymmetric polymorphic modification of HfO2 (o-phase), with space group Pca21, upon the doping with Si or other elements [6], including Zr [7]. Hf0.5Zr0.5O2 (HZO) shows a low temperature of formation of the o-phase (400°) [8,9], which is a good characteristic for Back-End-of-Line (BEoL) integration [10]. The ferroelectric phase is usually enhanced by capping of the HfO2 with a titanium nitride (TiN) electrode, which increases the surface energy and stabilizes the orthorhombic phase [11].
Varactors, based on ferroelectric HZO interdigitated capacitors were first proposed by Dragoman group [12,13,14,15,16]. We have also proposed the use of CMOS compatible devices in the BEoL, based on HZO varactors in a parallel-plate MFM configuration [17,18], but due to the lack of experimental data at high frequencies, the dielectric relaxation was not considered. In fact, the results of studies of the high-frequency properties of HfO2 are controversial. Some authors report almost no deterioration of dielectric properties at frequencies up to 5 GHz [19] or even up to 20 GHz [20], whereas others report the drop of capacitance in a range of 1–10 MHz [21,22,23,24]. In [20], complicated methods were used, which include 2-port measurements with a Vector Network Analyer (VNA) and a subsequent extraction of permittivity through a co-simulation, whereas in [21,22] the permittivity characterization via LCR-meter is performed, which normally has limitations in the MHz-range.
In this work, by using a simple reflectivity VNA technique, we were able to investigate the complex permittivity and the C-V characteristics of HZO in a frequency range of 10 MHz to 500 MHz.

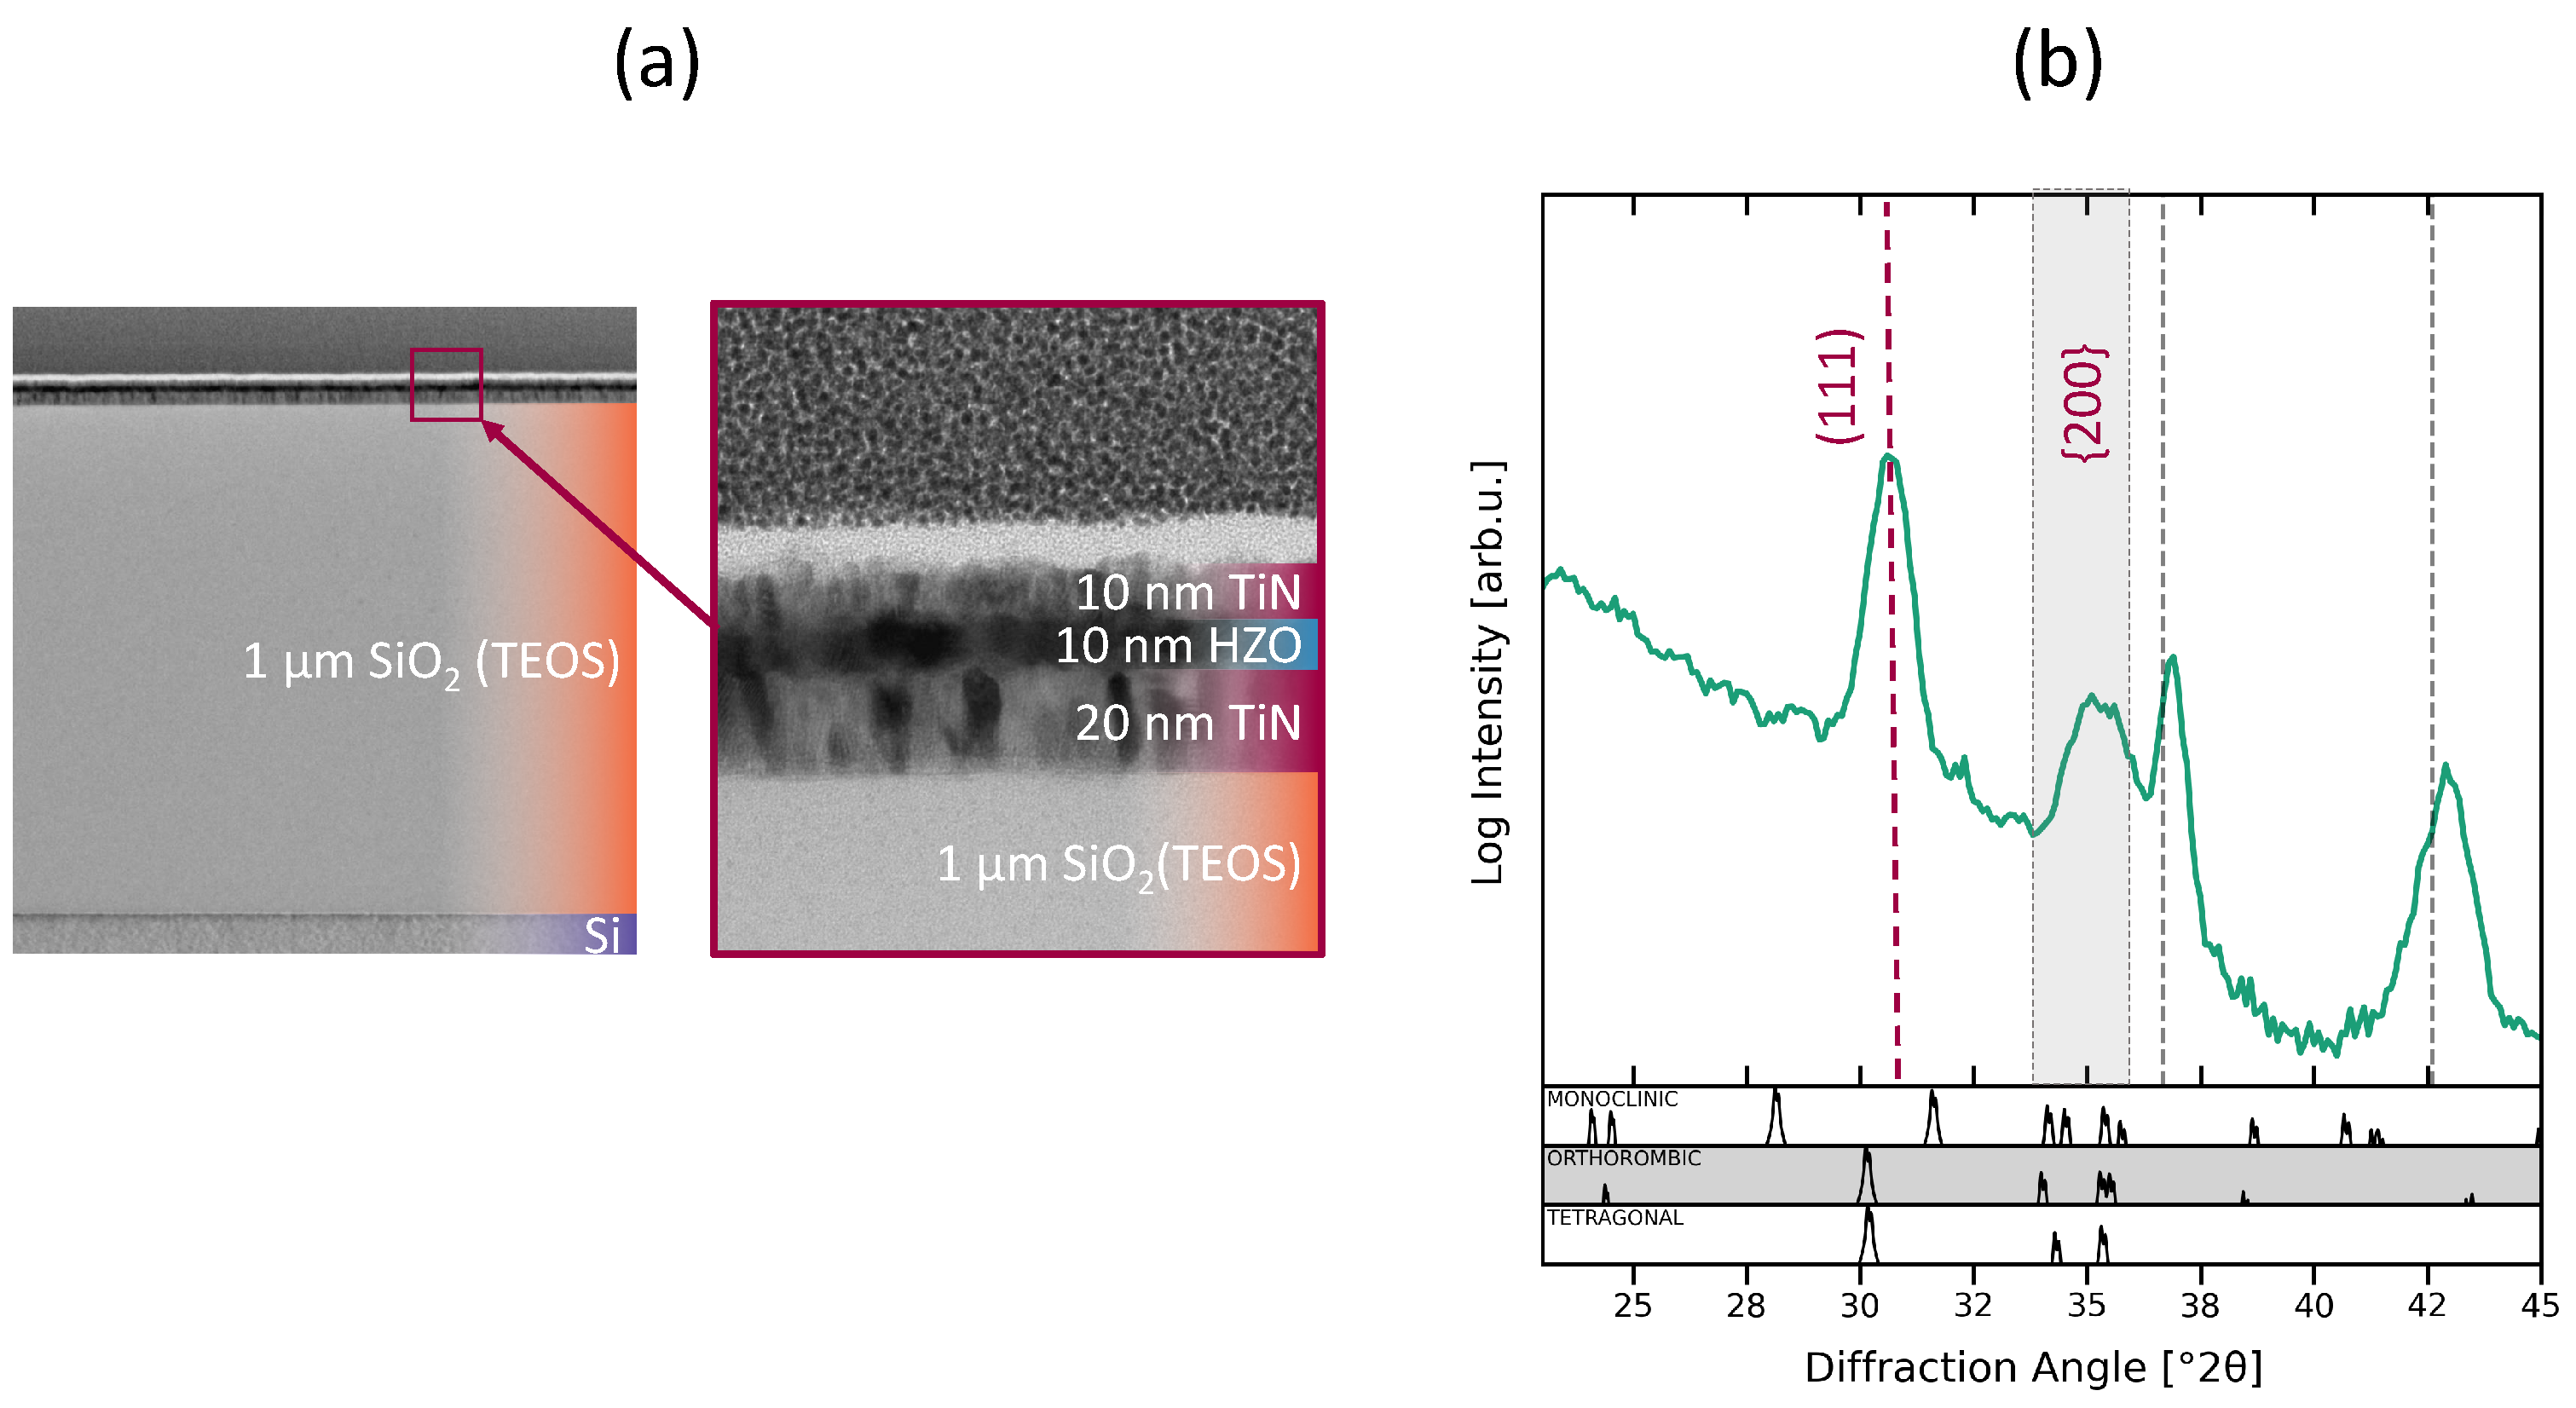
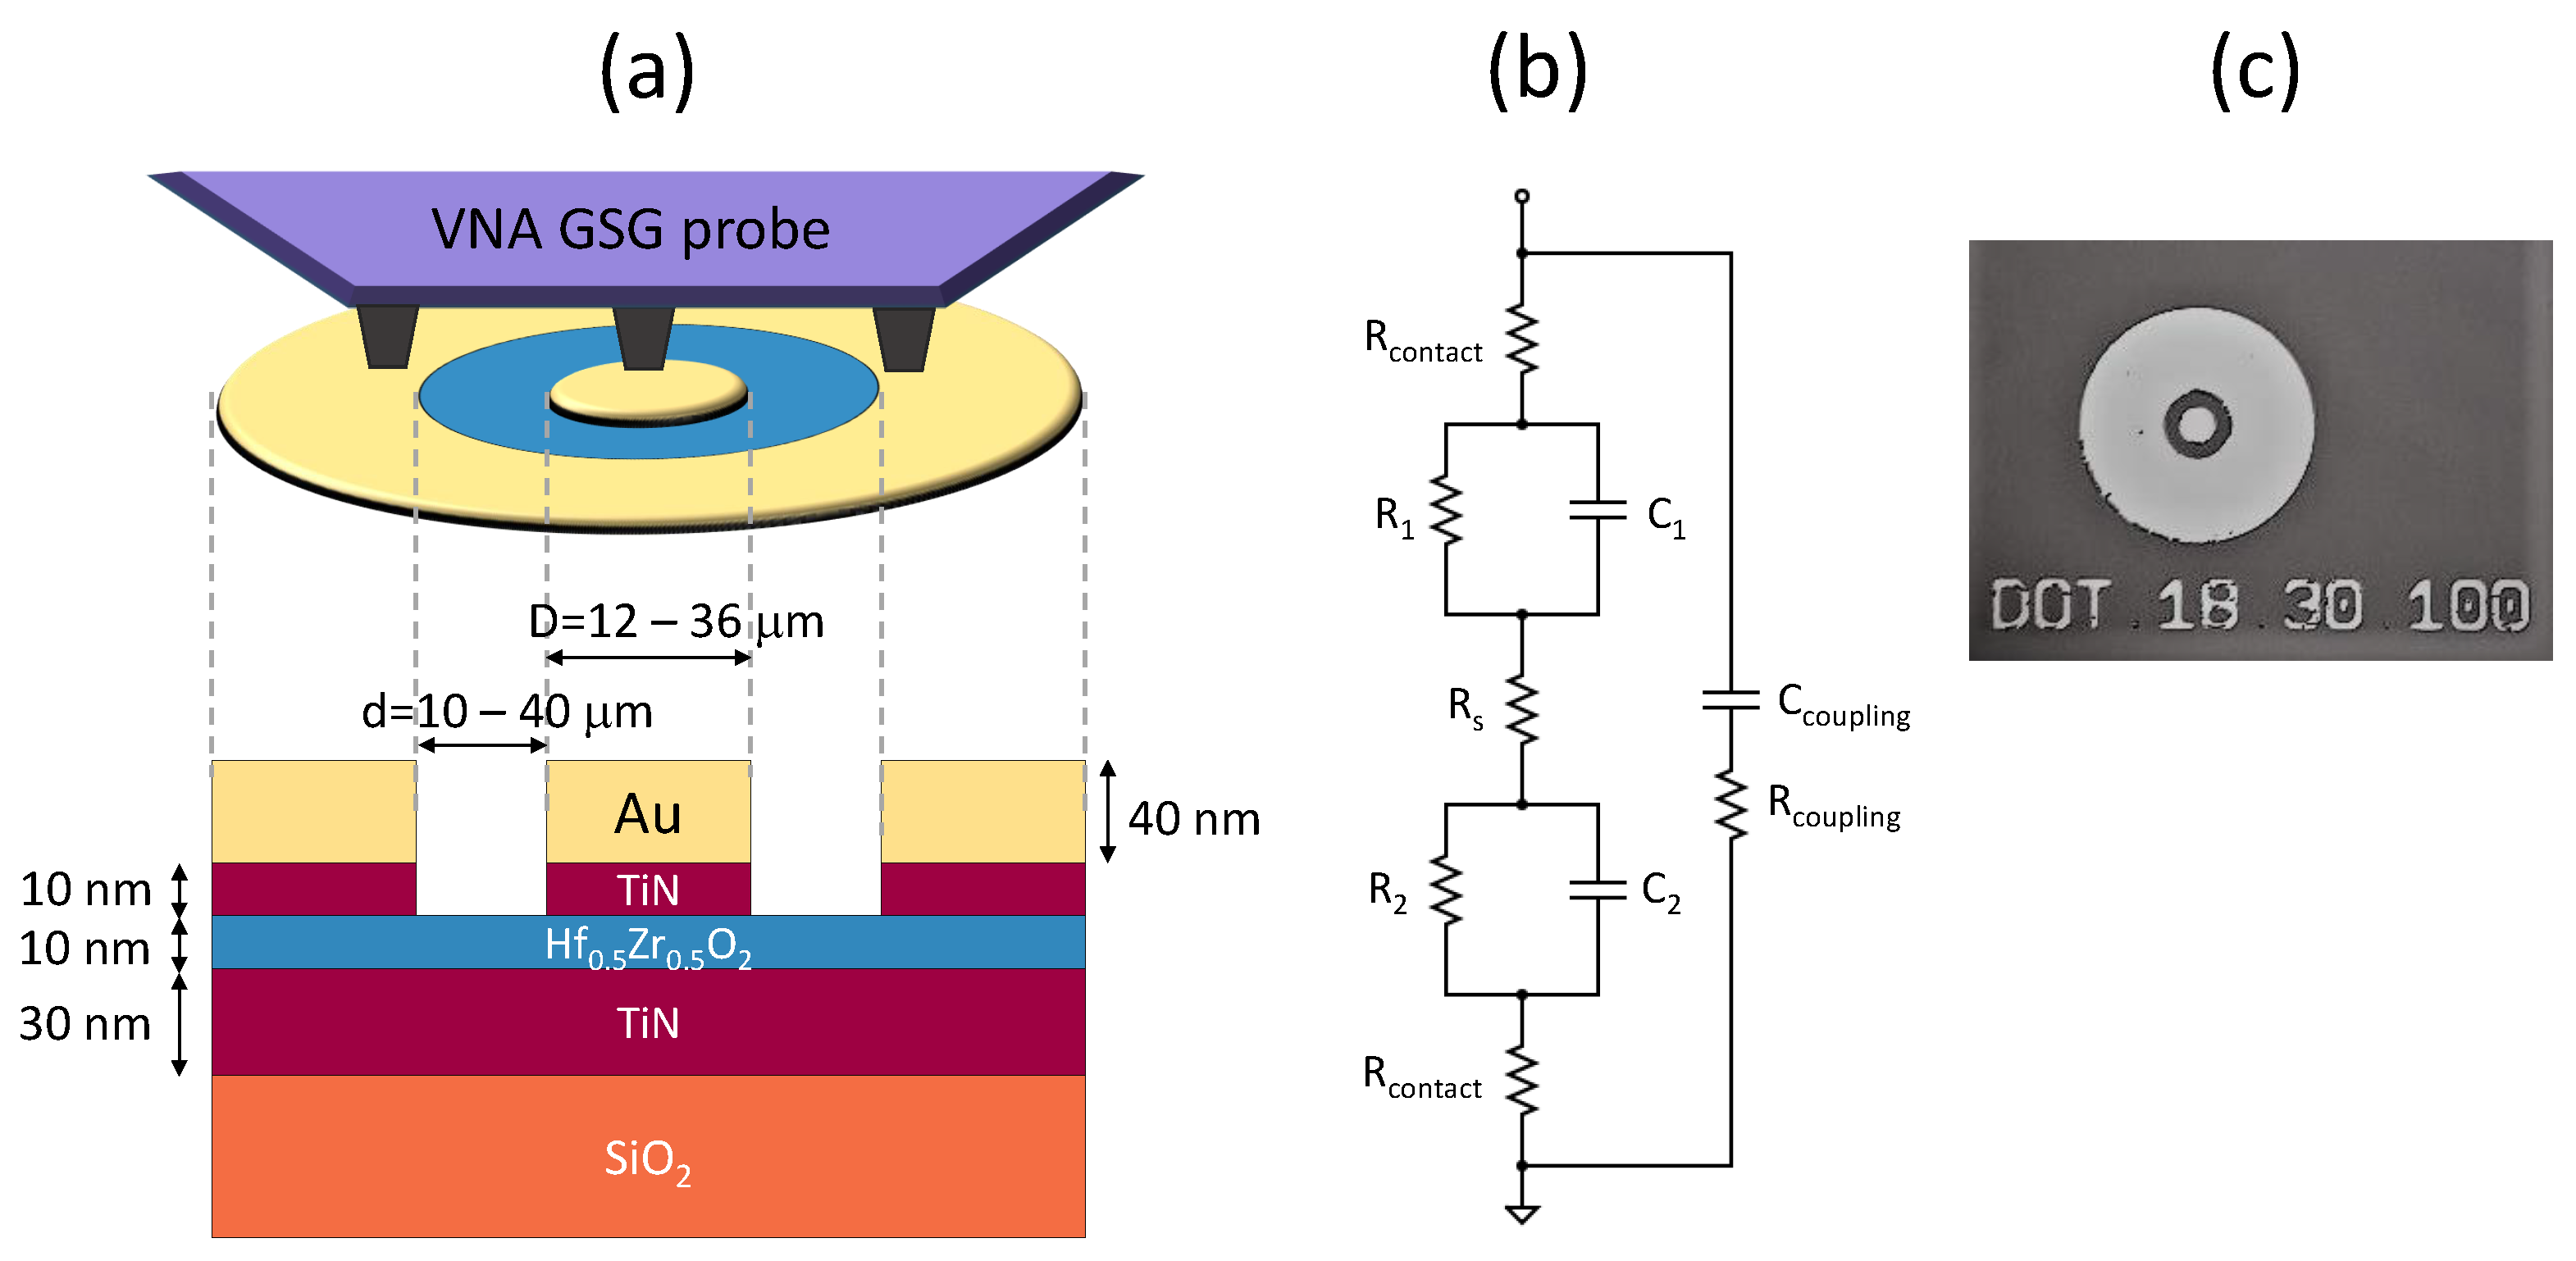
2. Materials and Methods

Tetraethoxysilane (TEOS) isolating layer of 1 μ m thickness was deposited on top of a Si wafer using chemical vapour deposition (CVD) (Figure 1a). Afterwards, a MFM stack was deposited in several steps. A bottom titanium electrode of titanium nitride (TiN) with 20 nm thickness was deposited on top of TEOS using atomic layer deposition (ALD). Hafnium oxide was deposited by ALD with HfCl4 and ZrCl4 precursors on top of the bottom TiN layer. The Hf:Zr cycling ratio was set to 1:1. Finally, the HZO layer was capped with a 10 nm TiN electrode, deposited by physical vapor deposition (PVD). The obtained MFM stack was annealed by rapid thermal anneal (RTA) at 400 °C for 60 s. High-resolution grazing incidence X-ray diffraction (GIXRD) (Figure 1b) was used to verify the ferroelectric phase, where it can be seen that the HZO was crystallized completely into the orthorhombic/tetragonal phase.
For the further RF characterization where a triple-contact ground-signal-ground (GSG) probe is used for S-parameter measurement, concentric Au electrodes were deposited by a lift-off lithography (Figure 2a,c). This method for measuring the permittivity of the thin films with a triple contact, also called an annular ring method, is described in [25,26,27,28]. The structure represents a series combination of two capacitors (Figure 2b). Its main advantage is that only one lithography step is needed for the fabrication, yet the main drawback is the unavailability of a proper de-embedding (due to one-port measurement) and therefore a high sensitivity to parasitics [25,28].

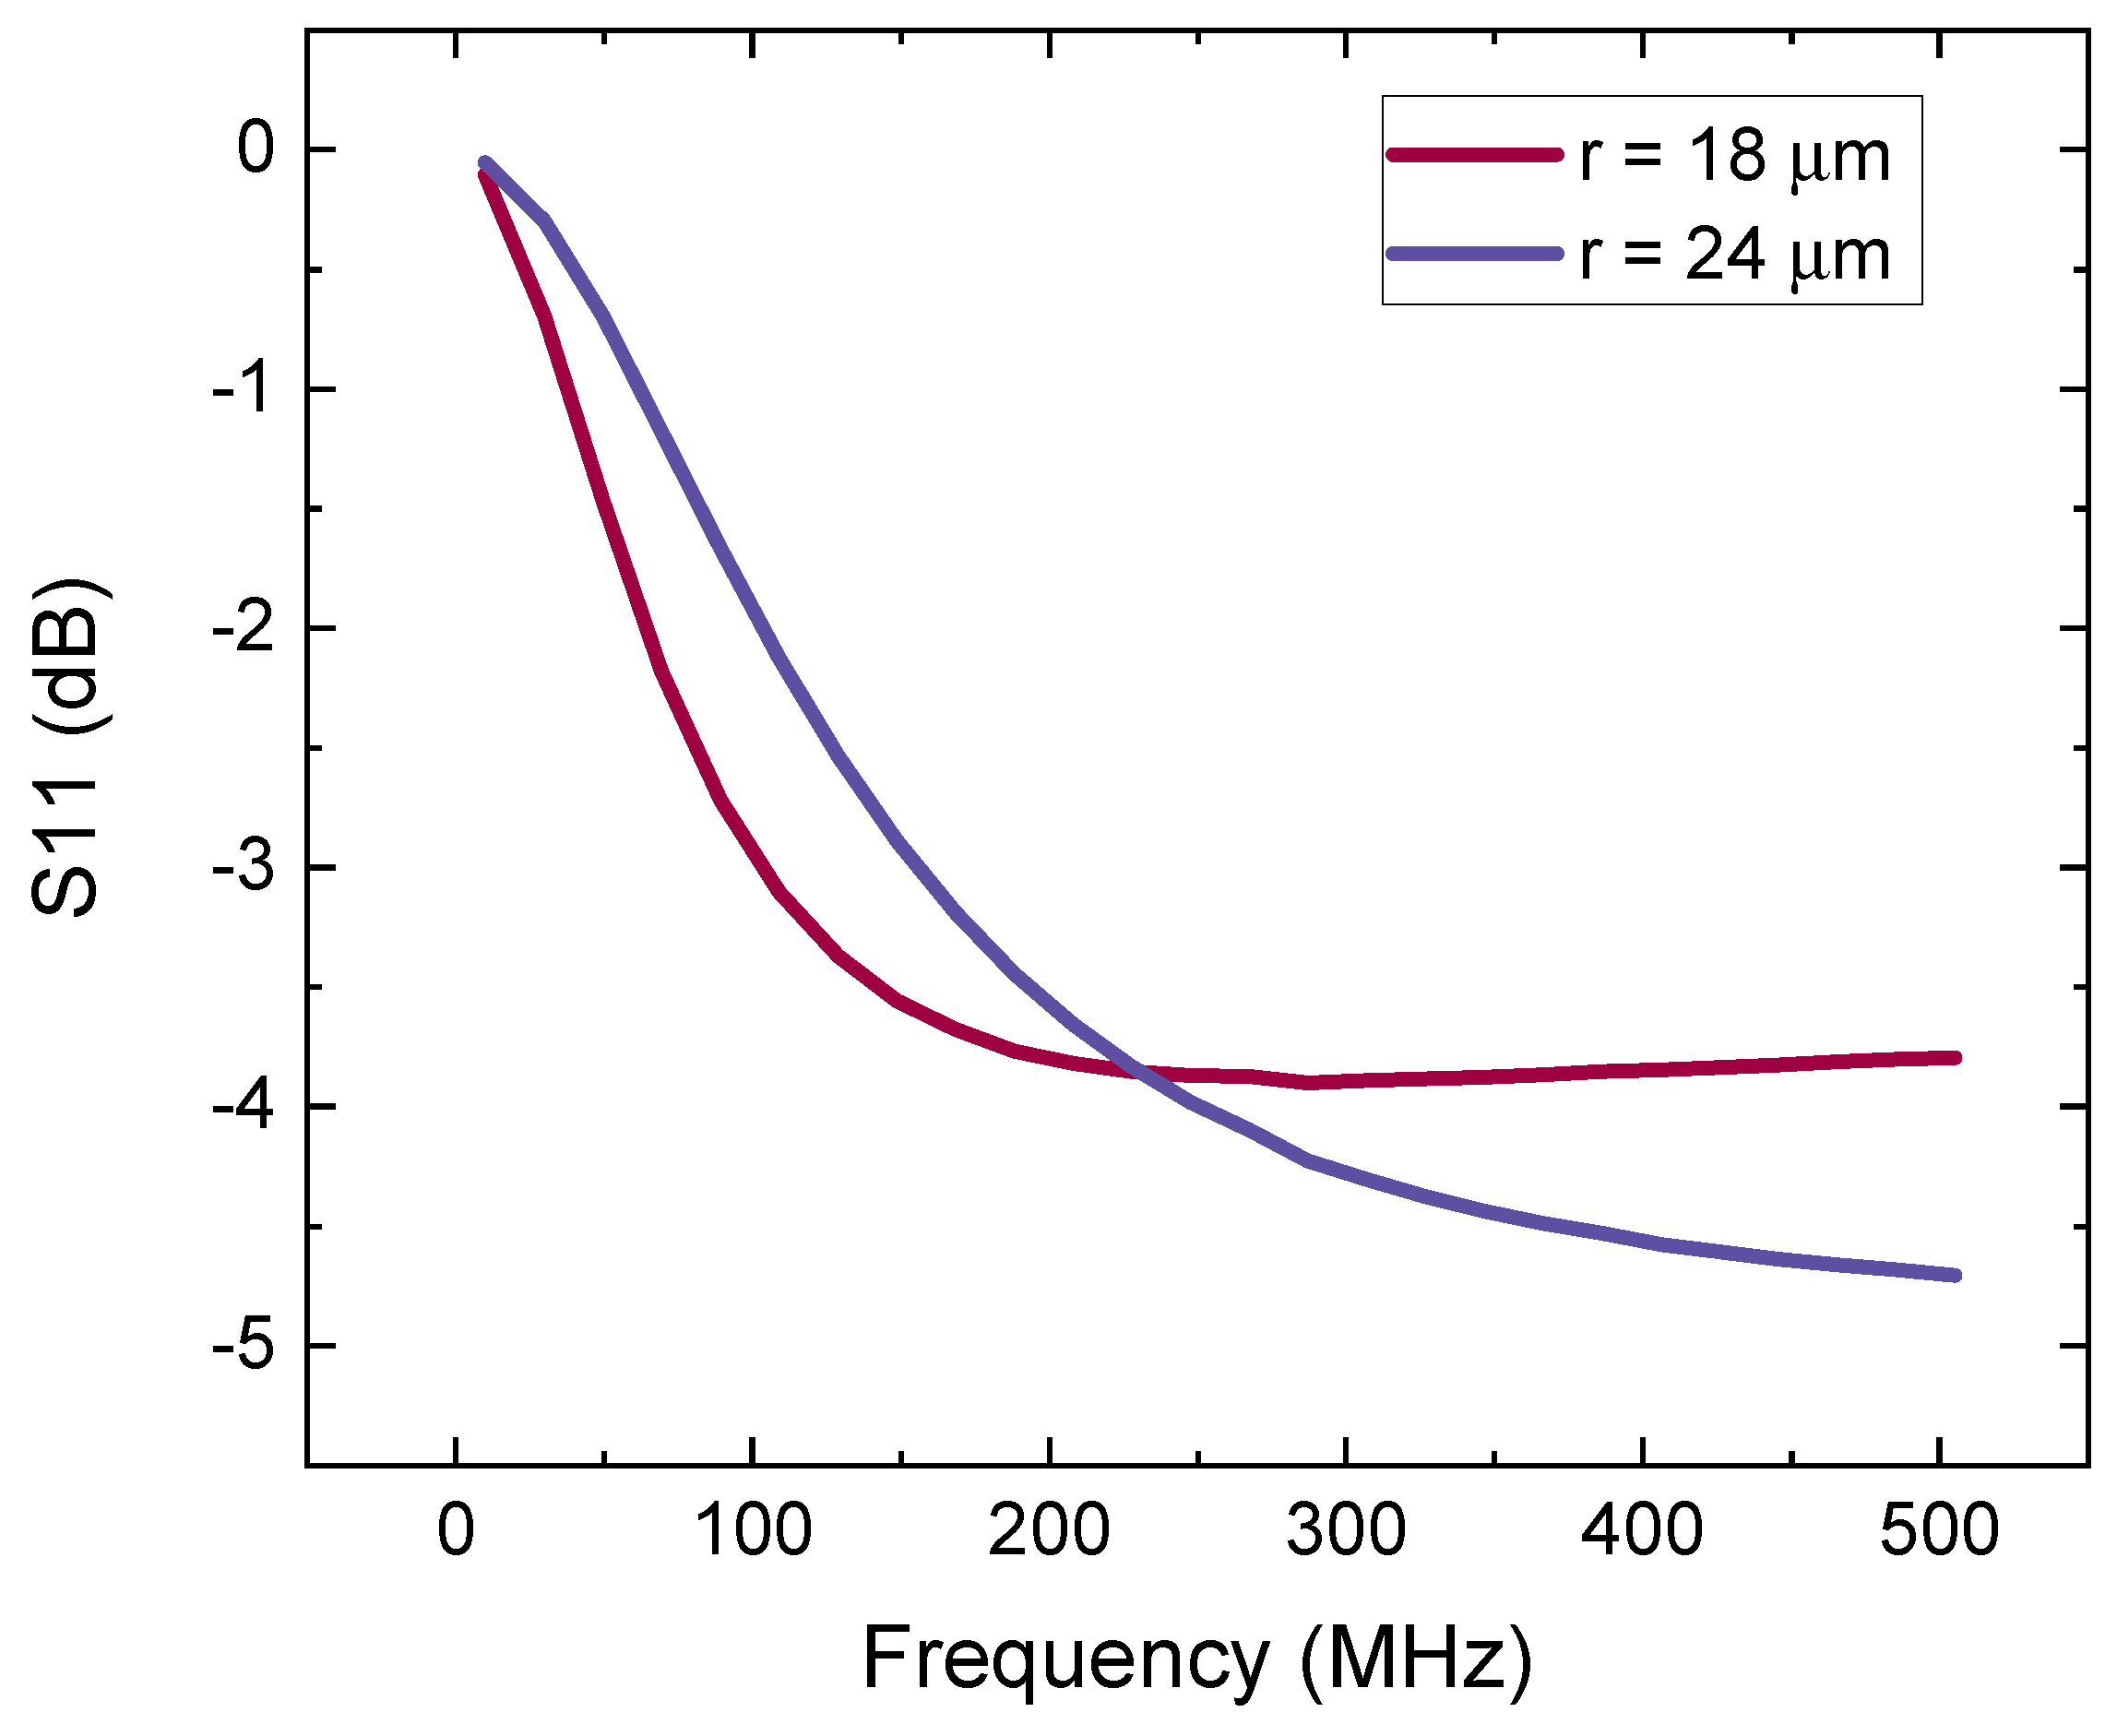
3. RF Characterization

High-frequency electric measurements were performed on a Keysight N5247B PNA-X vector network analyzer in the frequency range between 10 MHz and 500 MHz by applying a -15 dBm signal. The 50 µm pitch Ground-Signal-Ground Infinity probes were used to contact the ring structure. An SMU B2902A was used for the DC bias application. The DC bias was applied upon RF signal using the bias tee. Additionally, a co-simulation was performed in Ansys HFSS to analyze the distribution of the electric field between the electrodes.

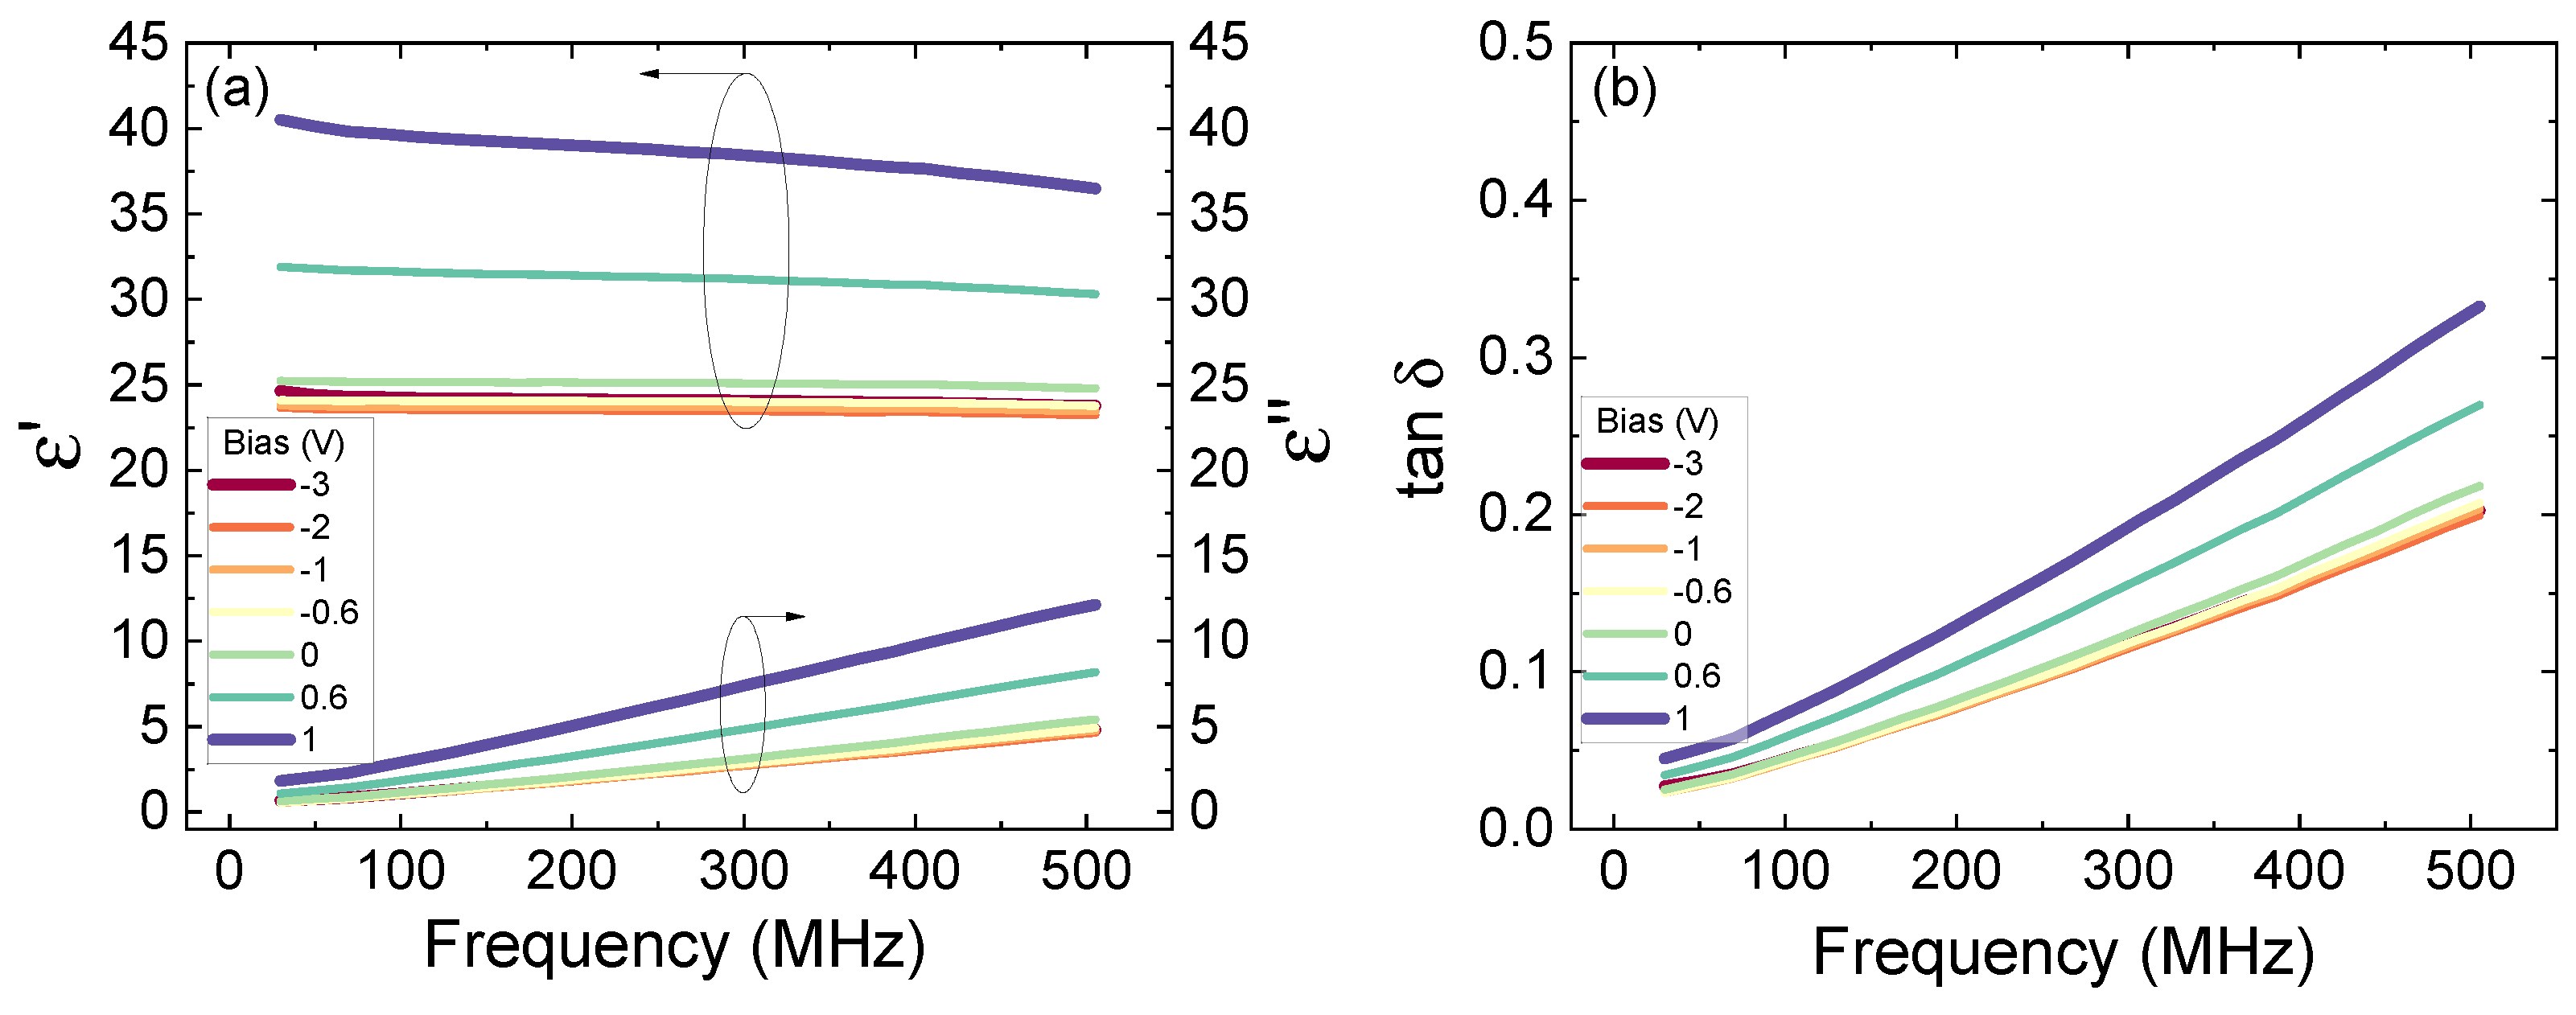
3.1. Complex Permittivity

The complex permittivity was measured by utilizing a procedure described by [25,27], where two ring structures with different inner dot radii are measured (see Appendix A).
In Figure 3a the real and imaginary permittivity values in frequency domain are plotted. With an increase of bias from V = −3 V towards the coercive voltage Vc = 1 V, both values are changing, indicating a stable varactor tuning. In Figure 3b the loss tangent is plotted with frequency. Sweeping the bias voltage also shifts the loss tangent, so that the maximum value lies at Vc, which can be explained by the increase of intrinsic losses due to the distortion of the crystal lattice, as well as the extrinsic losses due to the motion of the domain walls [28]. As the frequency increases, the loss tangent at −3 V increases by an order of magnitude from 0.02 to 0.2. The data was exported to Table 1 for comparison with other state-of-the-art HfO2 capacitors, whose characteristics were measured at high frequency.
At first glance it might seem that a dielectric relaxation is taking place. However when implementing an Ansys HFSS simulation with the permittivity set constant over the entire frequency range and loss tangent set to 0 (Simulation 1), it is found that the simulation results fit the experimental results much better (Figure 4a) than when using the data obtained from experiment (Simulation 2). Also, when implementing the permittivity extraction used in Appendix A towards the results of Simulation 1, the same effect of reduction in permittivity is observed Figure 4b, which fits well with the experiment, while Simulation 2 does not. This means that the observed strong dielectric relaxation is an artifact in this frequency range upon application of this method, and an increase in the dielectric loss is due to other parasitic effects. This was also explained in [25], where the increase in the loss tangent was attributed to the contact resistance and to the distribution of electric fields on the lower thin film electrode. Since a highly conductive Pt electrode was used in [25], the effect of field distribution played a minor role, but in our case a moderately metallic 20 nm TiN electrode is used, so an effect of field distribution causes larger distortions in the permittivity values. Indeed, a simulation has demonstrated a high decrease in the homogeneity of field distribution on the bottom electrode Figure 4c,d.

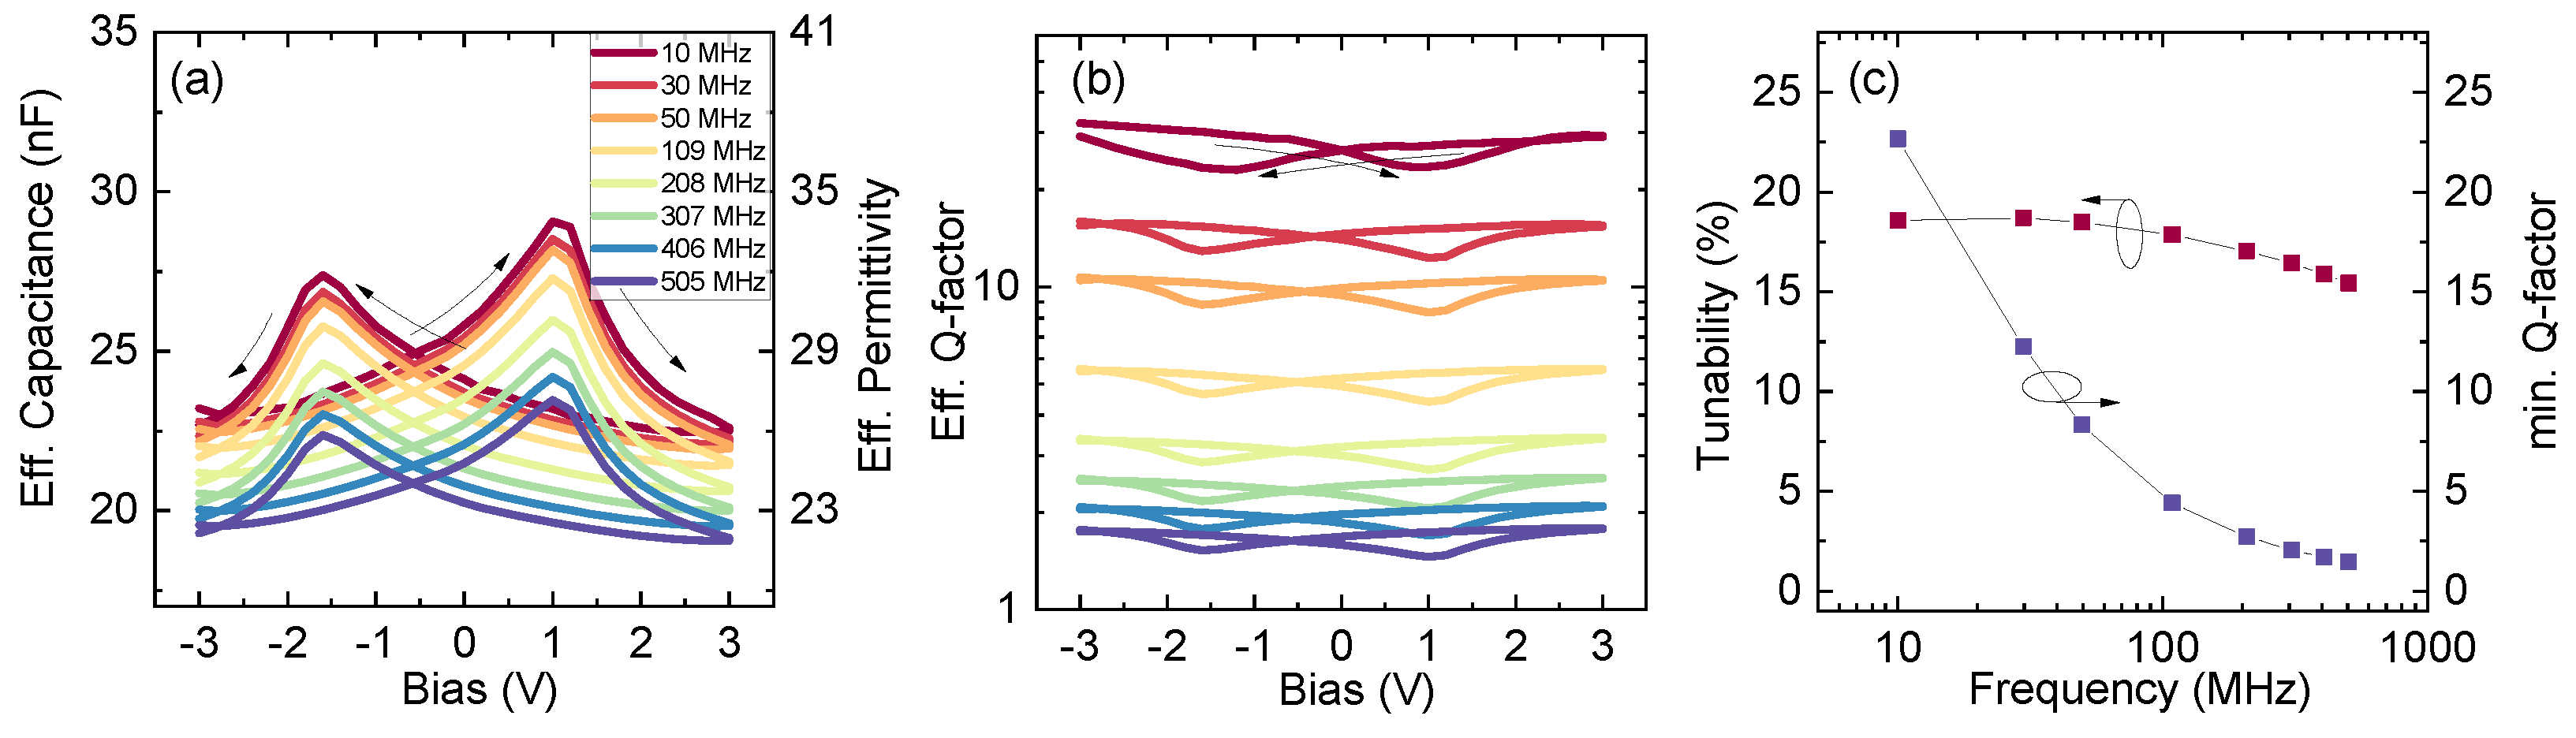
3.2. C-V Characteristics and Tunability

Since the method, as described in Appendix A, involves the measurement of two devices, it introduces a significant variation in the extracted parameters, and thus becomes ineffective for a smooth C-V characteristics. Therefore, to extract the capacitance of a single device, a simpler approach was used (see Appendix B) to extract both capacitance and loss tangent. Since the extracted permittivity obtained by this method is less accurate, as the parasitic sheet resistance is not compensated, it was coined an effective permittivity.
In Figure 5a, a C-V characteristics is plotted at different frequency values. In the plot, C-V curves have a “butterfly” shape, which is a standard indication of a ferroelectric behavior [7,29], thus confirming the measurement authenticity. The peaks are located at coercive voltage Vc = 1 V, which is not changing with frequency. Upon increase in frequency, the loops shift to lower permittivity values, repeating the trend, described in Section 3.1. In [29], a similar drop in the C-V curves with increasing frequency is observed, although it occurs in a much lower frequency range than in our case.
Based on the C-V curves, the corresponding tunability was calculated using the relation:
τ = ε m a x ( V ) ε m i n ( V ) ε m a x ( V )
where ε m a x and ε m i n are maximum and minimum values of the real parts of complex permittivity, respectively.
In Figure 5b the corresponding Q-V characteristics are plotted at different frequency values in logarithmic scale for a better peak visualization. The Q-V minima lie on the coercive bias points, which was explained in Section 3.1 for tan δ . Upon increasing frequency, the Q-factor drops due to an increase in tan δ .
In Figure 5c, tunability and minimum Q-factor are both plotted with respect to the frequency. The tunability experiences a reduction from 18.6% at 10 MHz towards 15.4% at 500 MHz and the minimum Q-factor decreases from 22.7 to 1.45, respectively. This can also be attributed, at least in part, to an effect of the inhomogeneous field distribution close to the TiN electrode.

4. Conclusions

In this work we have investigated the RF properties of 1:1 Hf:Zr doped ferroelectric HfO2 thin-film varactor, implementing the annular ring reflectivity method. In the frequency range of 10 MHz to 500 MHz, HZO shows a slight decrease in effective permittivity and an increase in effective loss tangent. The co-simulation has demonstrated an inhomogeneous distribution of the electric field on the bottom thin film TiN electrode, which is contributing to the reduction of varactor performance. Upon the bias sweep, varactors exhibit a stable shift of permittivity. For the extracted C-V-characteristics we are observing the typical butterfly shape, indicating a perfect match with low-frequency C-V measurements. The extracted tunability shows a slight decrease, which can at least partially be attributed to the inhomogeneous field distribution on the bottom electrode.

Author Contributions

Conceptualization, S.A.; methodology, S.A.; software, R.O.; validation, Q.H.L., D.K.H., D.W. and T.K.; formal analysis, S.A.; investigation, S.A.; resources, S.A., M.L., K.M. and J.E.; data curation, S.A. and T.K.; writing—original draft preparation, S.A.; writing—review and editing, T.K.; visualization, S.A. and R.O.; supervision, T.K. and G.G.; project administration, T.K.; funding acquisition, T.K. All authors have read and agreed to the published version of the manuscript.

Funding

This research was funded by the German Bundesministerium für Wirtschaft (BMWi) and by the State of Saxony, in the frame of project OCEAN12 from the Electronic Component Systems for European Leadership (ECSEL) Joint Undertaking.

Institutional Review Board Statement

Not applicable.

Informed Consent Statement

Not applicable.

Data Availability Statement

Research data in this article is not shared.

Acknowledgments

The authors would like to thank TU Dresden and especially U. Lehmann and V. Norkus for their support with the lift-off lithography.

Conflicts of Interest

The authors declare no conflict of interest.

Appendix A. Calculation of Complex Permittivity

By measuring the return loss (S11) of two structures with different inner circle radii r 1 and r 2 (Figure A1), and extracting the real and imaginary parts of the impedance, the complex permittivity and loss tangent ( tan δ ) can be obtained [25]:
Z 1 Z 2 = R s 2 π ln ( r 2 r 1 ) + 1 i ω π d ε 0 ε r ( 1 r 1 2 1 r 2 2 )
where R s is the sheet resistance of bottom electrode and d is the film’s thickness. For our bottom TiN electrode, R s = 50 Ω /sq.
Figure A1. Return loss (S11) in dB obtained from the measurement of the two annular ring structures with inner dot radii of 18 µm and 24 µm, respectively.
Crystals 11 00980 g0a1
By inserting the complex properties of impedance and permittivity:
Z 1 Z 2 = ( R 1 R 2 ) + i ( X 1 X 2 )
ε r = ε i ε
one finally gets the real and imaginary part of permittivity and the loss tangent:
ε = X 2 X 1 · d w π ϵ 1 r 1 2 1 r 2 2 R 1 R 2 R s 2 π l n r 2 r 1 2 + X 2 X 1 2
ε = R 1 R 2 R s 2 π ln r 2 r 1 · d w π ε 0 1 r 1 2 1 r 2 2 R 1 R 2 R s 2 π ln r 2 r 1 2 + X 2 X 1 2
tan δ = ε 2 ε 1 = R 1 R 2 R s 2 π ln r 2 r 1 X 2 X 1

Appendix B. Calculation of an Effective Permittivity for C-V Characteristics

First, an effective capacitance C e f f is calculated from the imaginary part of complex impedance Im Z 11 :
C e f f = 1 w Im Z 11
Then the effective permittivity ε e f f is calculated:
ε e f f = C e f f · d π ε 0 r 1 2 + r 3 2 r 2 2 r 1 2 r 3 2 r 2 2
where d is the thickness of HZO; r 1 is the radius of the inner circle, and r 2 , r 3 are the inner and outer radii of the outer ring, respectively.
In the same way, the effective loss tangent and Q-factor can be calculated:
tan δ e f f = R s 2 π ln r 2 r 3 Re Z 11 Im Z 11
Q e f f = 1 tan δ

References

  1. Böscke, T.S.; Müller, J.; Bräuhaus, D.; Schröder, U.; Böttger, U. Ferroelectricity in hafnium oxide thin films. Appl. Phys. Lett. 2011, 99, 102903. [Google Scholar] [CrossRef]
  2. Ali, T.; Polakowski, P.; Riedel, S.; Büttner, T.; Kämpfe, T.; Rudolph, M.; Pätzold, B.; Seidel, K.; Löhr, D.; Hoffmann, R. Silicon doped hafnium oxide (HSO) and hafnium zirconium oxide (HZO) based FeFET: A material relation to device physics. Appl. Phys. Lett. 2018, 112, 222903. [Google Scholar] [CrossRef]
  3. Ali, T.; Seidel, K.; Kuhnel, K.; Rudolph, M.; Czernohorsky, M.; Mertens, K.; Hoffmann, R.; Zimmermann, K.; Muhle, U.; Muller, J.; et al. A Novel Dual Ferroelectric Layer Based MFMFIS FeFET with Optimal Stack Tuning toward Low Power and High-Speed NVM for Neuromorphic Applications. In Proceedings of the 2020 IEEE Symposium on VLSI Technology, Honolulu, HI, USA, 16–19 June 2020; pp. 1–2. [Google Scholar] [CrossRef]
  4. Ali, T.; Mertens, K.; Kühnel, K.; Rudolph, M.; Oehler, S.; Lehninger, D.; Müller, F.; Revello, R.; Hoffmann, R.; Zimmermann, K.; et al. A FeFET with a novel MFMFIS gate stack: Towards energy-efficient and ultrafast NVMs for neuromorphic computing. Nanotechnology 2021, 32, 425201. [Google Scholar] [CrossRef] [PubMed]
  5. Lederer, M.; Kämpfe, T.; Ali, T.; Muller, F.; Olivo, R.; Hoffmann, R.; Laleni, N.; Seidel, K. Ferroelectric Field Effect Transistors as a Synapse for Neuromorphic Application. IEEE Trans. Electron Devices 2021, 68, 2295–2300. [Google Scholar] [CrossRef]
  6. Batra, R.; Huan, T.D.; Rossetti, G.A.; Ramprasad, R. Dopants Promoting Ferroelectricity in Hafnia: Insights from a comprehensive Chemical Space Exploration. Chem. Mater. 2017, 29, 9102–9109. [Google Scholar] [CrossRef]
  7. Müller, J.; Böscke, T.S.; Schröder, U.; Mueller, S.; Bräuhaus, D.; Böttger, U.; Frey, L.; Mikolajick, T. Ferroelectricity in Simple Binary ZrO2 and HfO2. Nano Lett. 2012, 12, 4318–4323. [Google Scholar] [CrossRef] [PubMed]
  8. Kim, S.J.; Narayan, D.; Lee, J.G.; Mohan, J.; Lee, J.S.; Lee, J.; Kim, H.S.; Byun, Y.C.; Lucero, A.T.; Young, C.D. Large ferroelectric polarization of TiN/Hf0.5Zr0.5O2/TiN capacitors due to stress-induced crystallization at low thermal budget. Appl. Phys. Lett. 2017, 111, 242901. [Google Scholar] [CrossRef]
  9. Lehninger, D.; Olivo, R.; Ali, T.; Lederer, M.; Kämpfe, T.; Mart, C.; Biedermann, K.; Kühnel, K.; Roy, L.; Kalkani, M.; et al. Back–End–of–Line Compatible Low–Temperature Furnace Anneal for Ferroelectric Hafnium Zirconium Oxide Formation. Phys. Status Solidi A 2020, 217, 1900840. [Google Scholar] [CrossRef] [Green Version]
  10. Mart, C.; Abdulazhanov, S.; Czernohorsky, M.; Kampfe, T.; Lehninger, D.; Falidas, K.; Eslinger, S.; Kuhnel, K.; Oehler, S.; Rudolph, M.; et al. Energy Harvesting in the Back-End of Line with CMOS Compatible Ferroelectric Hafnium Oxide. In Proceedings of the 2020 IEEE International Electron Devices Meeting (IEDM), San Francisco, CA, USA, 12–18 December 2020; pp. 26.3.1–26.3.4. [Google Scholar] [CrossRef]
  11. Park, M.H.; Lee, Y.H.; Kim, H.J.; Schenk, T.; Lee, W.; Kim, K.D.; Fengler, F.P.G.; Mikolajick, T.; Schroeder, U.; Hwang, C.S. Surface and grain boundary energy as the key enabler of ferroelectricity in nanoscale hafnia-zirconia: A comparison of model and experiment. Nanoscale 2017, 9, 9973–9986. [Google Scholar] [CrossRef] [Green Version]
  12. Dragoman, M.; Modreanu, M.; Povey, I.M.; Iordanescu, S.; Aldrigo, M.; Romanitan, C.; Vasilache, D.; Dinescu, A.; Dragoman, D. Very large phase shift of microwave signals in a 6 nm HfxZr1-xO2 ferroelectric at ±3 V. Nanotechnology 2017, 28, 38LT04. [Google Scholar] [CrossRef]
  13. Dragoman, M.; Modreanu, M.; Povey, I.; Iordanescu, S.; Aldrigo, M.; Dinescu, A.; Vasilache, D.; Romanitan, C. 2.55 GHz miniaturised phased antenna array based on 7 nm-thick HfxZr1-xO2 ferroelectrics. Electron. Lett. 2018, 54, 469–470. [Google Scholar] [CrossRef]
  14. Dragoman, M.; Aldrigo, M.; Modreanu, M.; Dragoman, D. Extraordinary tunability of high-frequency devices using Hf0.3Zr0.7O2 ferroelectric at very low applied voltages. Appl. Phys. Lett. 2017, 110, 103104. [Google Scholar] [CrossRef] [Green Version]
  15. Dragoman, M.; Aldrigo, M.; Dragoman, D.; Iordanescu, S.; Dinescu, A.; Modreanu, M. HfO2—Based Ferroelectrics Applications in Nanoelectronics. Phys. Status Solidi (RRL) Rapid Res. Lett. 2021, 15, 2000521. [Google Scholar] [CrossRef]
  16. Aldrigo, M.; Dragoman, M.; Iordanescu, S.; Nastase, F.; Vulpe, S. Tunable Microwave Filters Using HfO2-Based Ferroelectrics. Nanomaterials 2020, 10, 2057. [Google Scholar] [CrossRef] [Green Version]
  17. Abdulazhanov, S.; Le, Q.H.; Huynh, D.K.; Wang, D.; Gerlach, G.; Kämpfe, T. A mmWave Phase Shifter Based on Ferroelectric Hafnium Zirconium Oxide Varactors. In Proceedings of the 2019 IEEE MTT-S International Microwave Workshop Series on Advanced Materials and Processes for RF and THz Applications (IMWS-AMP), Bochum, Germany, 16–18 July 2019; pp. 175–177. [Google Scholar] [CrossRef]
  18. Abdulazhanov, S.; Le, Q.H.; Huynh, D.K.; Wang, D.; Gerlach, G.; Kämpfe, T. A Tunable mmWave Band-Pass Filter Based on Ferroelectric Hafnium Zirconium Oxide Varactors. In Proceedings of the 2019 IEEE MTT-S International Microwave Workshop Series on Advanced Materials and Processes for RF and THz Applications (IMWS-AMP), Bochum, Germany, 16–18 July 2019; pp. 46–48. [Google Scholar] [CrossRef]
  19. Lee, B.; Moon, T.; Kim, T.G.; Choi, D.K.; Park, B. Dielectric relaxation of atomic-layer-deposited HfO2 thin films from 1 kHz to 5 GHz. Appl. Phys. Lett. 2005, 87, 012901. [Google Scholar] [CrossRef] [Green Version]
  20. Vo, T.T.; Lacrevaz, T.; Bermond, C.; Bertaud, T.; Flechet, B.; Farcy, A.; Morand, Y.; Blonkowski, S.; Torres, J.; Guigues, B. In situ microwave characterisation of medium-k HfO2 and high-k SrTiO3 dielectrics for metal–insulator–metal capacitors integrated in back-end of line of integrated circuits. IET Microwaves Antennas Propag. 2008, 2, 781–788. [Google Scholar] [CrossRef]
  21. Mannequin, C.; Gonon, P.; Vallée, C.; Bsiesy, A.; Grampeix, H.; Jousseaume, V. Dielectric relaxation in hafnium oxide: A study of transient currents and admittance spectroscopy in HfO2 metal-insulator-metal devices. J. Appl. Phys. 2011, 110, 104108. [Google Scholar] [CrossRef]
  22. Zhao, C.Z.; Taylor, S.; Werner, M.; Chalker, P.R.; Gaskell, J.M.; Jones, A.C. Frequency dispersion and dielectric relaxation of La2Hf2O7. J. Vac. Sci. Technol. B Microelectron. Nanometer Struct. Process. Meas. Phenom. 2009, 27, 333–337. [Google Scholar] [CrossRef]
  23. Zhao, C.; Zhao, C.Z.; Werner, M.; Taylor, S.; Chalker, P. Dielectric relaxation of high-k oxides. Nanoscale Res. Lett. 2013, 8, 456. [Google Scholar] [CrossRef] [Green Version]
  24. Esro, M.; Vourlias, G.; Somerton, C.; Milne, W.I.; Adamopoulos, G. High-Mobility ZnO Thin Film Transistors Based on Solution-processed Hafnium Oxide Gate Dielectrics. Adv. Funct. Mater. 2015, 25, 134–141. [Google Scholar] [CrossRef]
  25. Ma, Z.; Becker, A.J.; Polakos, P.; Huggins, H.; Pastalan, J.; Wu, H.; Watts, K.; Wong, Y.H.; Mankiewich, P. RF measurement technique for characterizing thin dielectric films. IEEE Trans. Electron Devices 1998, 45, 1811–1816. [Google Scholar]
  26. Sheng, S.; Wang, P.; Zhang, X.Y.; Ong, C.K. Characterization of microwave dielectric properties of ferroelectric parallel plate varactors. J. Phys. D Appl. Phys. 2008, 42, 015501. [Google Scholar] [CrossRef]
  27. Tierno, D.; Dekkers, M.; Wittendorp, P.; Sun, X.; Bayer, S.C.; King, S.T.; van Elshocht, S.; Heyns, M.; Radu, I.P.; Adelmann, C. Microwave characterization of ba-substituted PZT and ZnO thin films. IEEE Trans. Ultrason. Ferroelectr. Freq. Control 2018, 65, 881–888. [Google Scholar] [CrossRef] [PubMed]
  28. Gevorgian, S. Ferroelectrics in Microwave Devices, Circuits and Systems: Physics, Modeling, Fabrication and Measurements; Springer Science & Business Media: Berlin/Heidelberg, Germany, 2009. [Google Scholar]
  29. Si, M.; Lyu, X.; Ye, P.D. Ferroelectric Polarization Switching of Hafnium Zirconium Oxide in a Ferroelectric/Dielectric Stack. ACS Appl. Electron. Mater. 2019, 1, 745–751. [Google Scholar] [CrossRef] [Green Version]
Figure 1. Transmission electron microscopy (TEM) (a) and Grazing Incidence X-ray diffraction (GIXRD) (b) of the HZO MFM stack.
Crystals 11 00980 g001
Figure 2. Schematic of the sample and measurement configuration (a), equivalent cirquit (b), and optical microscope image (c) of the deposited ring structure.
Crystals 11 00980 g002
Figure 3. Frequency dependence of the real ( ε ) and complex ( ε ) permittivity values (a) and of the effective loss tangent (b) at different bias voltages.
Crystals 11 00980 g003
Figure 4. Ansys HFSS simulation of the measured Smith chart (a) of HZO varactor and the complex permittivity (b) extracted both from the simulation and the measurement using Equations (A4) and (A5). The homogeneous electric field distribution on the bottom TiN electrode at 10 MHz (c) is getting more confined towards the inner radius of the outer electrode at 500 MHz (d), leading to a decrease in effective permittivity.
Crystals 11 00980 g004
Figure 5. C-V (a) and Q-V (b) characteristics of HZO MFM thin film varactors, (c)—development of tunability and minimum Q-factor upon frequency.
Crystals 11 00980 g005
Table 1. Comparison of the performance of the state-of-the-art hafnium oxide thin-film capacitors at different frequencies.
Ref.MaterialTanneald (nm)fmin (MHz) ϵ ’(fmin)tan δ (fmin)fmax (MHz) ϵ ’(fmax)tan δ (fmax)
 [19]HfO2500 °C10 10 3 160.0135000150.013
 [20]HfO2-1090190.0120,000210.07
 [22]La2Hf2O7900 °C182 × 10 5 150.012140.2
 [23]Ce0.63Hf0.37O2900 °C56–98 10 4 32-125-
 [24]HfO2400 °C1042 × 10 5 18.80.01101.88150
 [29]HZO500 °C30 10 3 17.5-115-
 [15]HZO-610009.80.0914,00070.02
Our workHZO400 °C101024.60.02750023.80.2
Publisher’s Note: MDPI stays neutral with regard to jurisdictional claims in published maps and institutional affiliations.

