Article

Start-Up of a Solid Oxide Fuel Cell System with a View to Materials Science-Related Aspects, Control and Thermo-Mechanical Stresses

by
Konrad W. Eichhorn Colombo
* and
Vladislav V. Kharton
Institute of Solid State Physics Russian Academy of Sciences, Chernogolovka, 142432 Moscow, Russian
*
Author to whom correspondence should be addressed.
Crystals 2021, 11(7), 732; https://doi.org/10.3390/cryst11070732
Submission received: 5 May 2021 / Revised: 10 June 2021 / Accepted: 11 June 2021 / Published: 24 June 2021

Abstract

:
The start-up of a solid oxide fuel cell (SOFC) is investigated by means of numerical simulation with a view to material and operational constraints on a component and system level, as well as thermo-mechanical stresses. The applied multi-physics modeling approach couples thermal-, electrochemical, chemical-, and thermo-mechanical phenomena. In addition to constraints, emphasis is given to degrees of freedom with respect to manipulated and controlled variables of the system. Proper ramping during the start-up procedure keeps critical parameter values within a safe regime. Of particular interest are gradient in terms of temperature and chemical concentrations. Nevertheless, simulations show that thermo-mechanical stresses are relatively high during the initial start-up phase, the system is, thus, more susceptible to failure. The combination of multi-physics modeling in conjunction with practical control aspects for start-up of an SOFC, which is presented in this paper, is important for applications.

1. Introduction

Fuel cells (FC) are an important part of the sustainable power generation mix [1], also as elements of larger system networks [2], and for vehicles [3]. Various FC technologies have been developed [4], where solid oxide fuel cells (SOFC) have certain advantages in comparison to other FC types, for example the potential use of non-precious metals [5], which have therefore been intensively investigated [6,7,8]. Nevertheless, issues remain to obtain sufficient lifetime for a wide application, including irreversible degradation of electrodes, electrolyte, and sealing materials linked to the fuel contaminants (further discussed below) [9,10,11,12,13,14].
Mathematical modeling is indispensable to gain insights about performance for realistic and critical scenarios of complex systems due to mutual interaction of time-dependent physical phenomena as well as strong dependence on operation conditions. In addition to an electro-chemical perspective to assess thermodynamic performance, a systems perspective should also take into account thermo-mechanical aspects [15,16,17] to analyze overall metrics that specify the system lifetime.
Benign operation conditions in terms of transient gradients already lead to complex control strategies due to the number of physical variables that need to be controlled as well as material and operational constraints. For safe and economically feasible system start-up, further aspects need to be addressed [18,19], for example due to the need for safety gas [20] to maintain proper conditions with respect to chemical potential in the material to avoid excessive stresses during rapid transients. However, compared to studies that are concerned with design point performance and off-design (including part-load operation), relatively few publications exist dealing with detailed transient behavior on a system level. Even fewer studies directly investigate the start-up behavior with all the aforementioned physical phenomena (see References [21,22], and in particular those conducted by the Jülich team [23,24,25]), despite the critical importance of these aspects. Of special interest are gradients in temperature, as well as chemical compositions.
The multi-physics approach with time-dependent partial differential algebraic integral equations (PDAIE) is a core element of a more general model-based systems engineering (SE) framework (See also Reference [26] for a recent review comparing characteristic specifications of electro-chemical energy systems). Systems control is another branch within this model-based SE framework, where simplified models in the frequency- or time domain are commonly used to develop control strategies and to tune controllers, e.g. based on (nonlinear) model predictive control [27]. To obtain information about a system’s transient behavior subject to disturbances, (open-loop) step responses are imposed. The underlying models are however in many cases linear, or more general, reduced order representations, of a high-fidelity or simplified physics-based model. Besides, control objectives may be in mutual conflict. In summary, the model-based SE framework used in this work balances the physics- and control perspective to arrive at a more realistic understanding of failure-induced risks for the SOFC during start-up, compared to a purely thermodynamic (equilibrium) performance approach. With a broader and more detailed perspective, better conclusions and actions can be formulated for practical operating systems, their control and economics.
To the best of our knowledge, the present study is one of few which investigates SOFC behavior on a component and system level during start-up by means of a thermo-mechanical model in conjunction with physics-based control constraints.
A separate note on system shutdown is necessary. For a normal shutdown, i.e., no emergency shutdown, the inverse of the start-up procedure is assumed to be applicable, possibly with some adjustments in terms of duration for the individual operation phases. In the following, only start-up is considered where normal shutdown proceeds in the same (or similar) fashion.

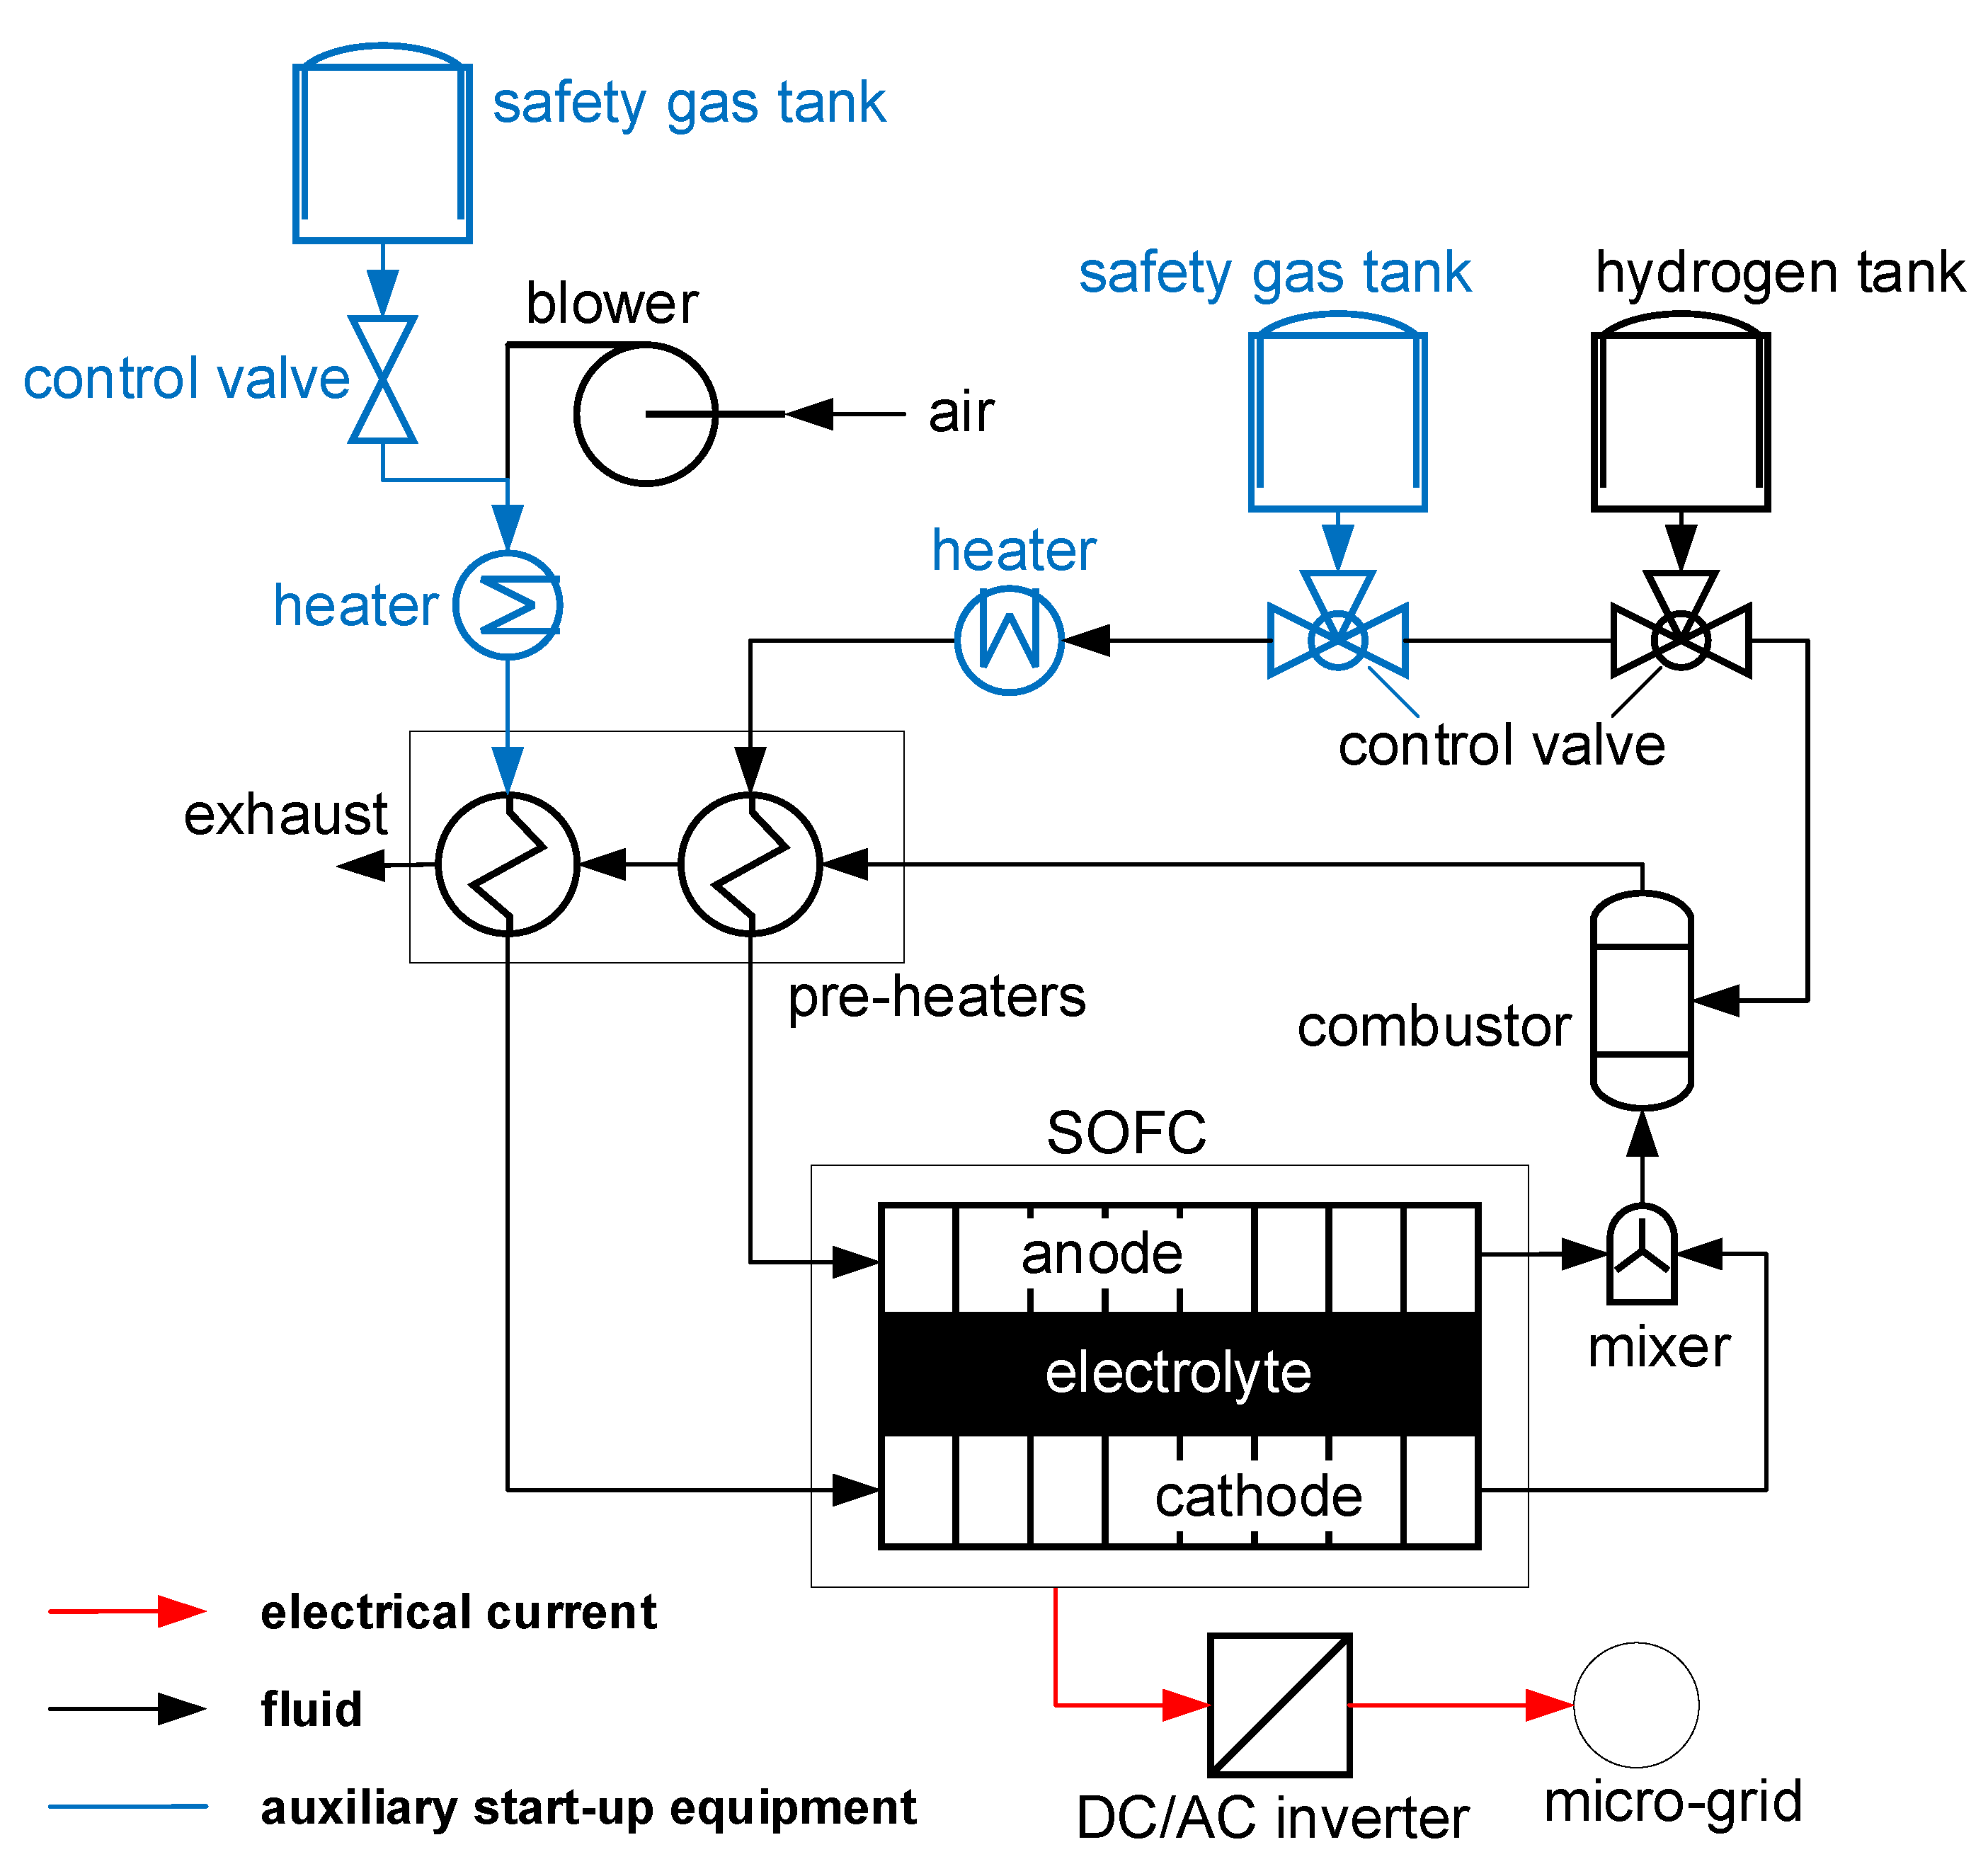
2. System Description

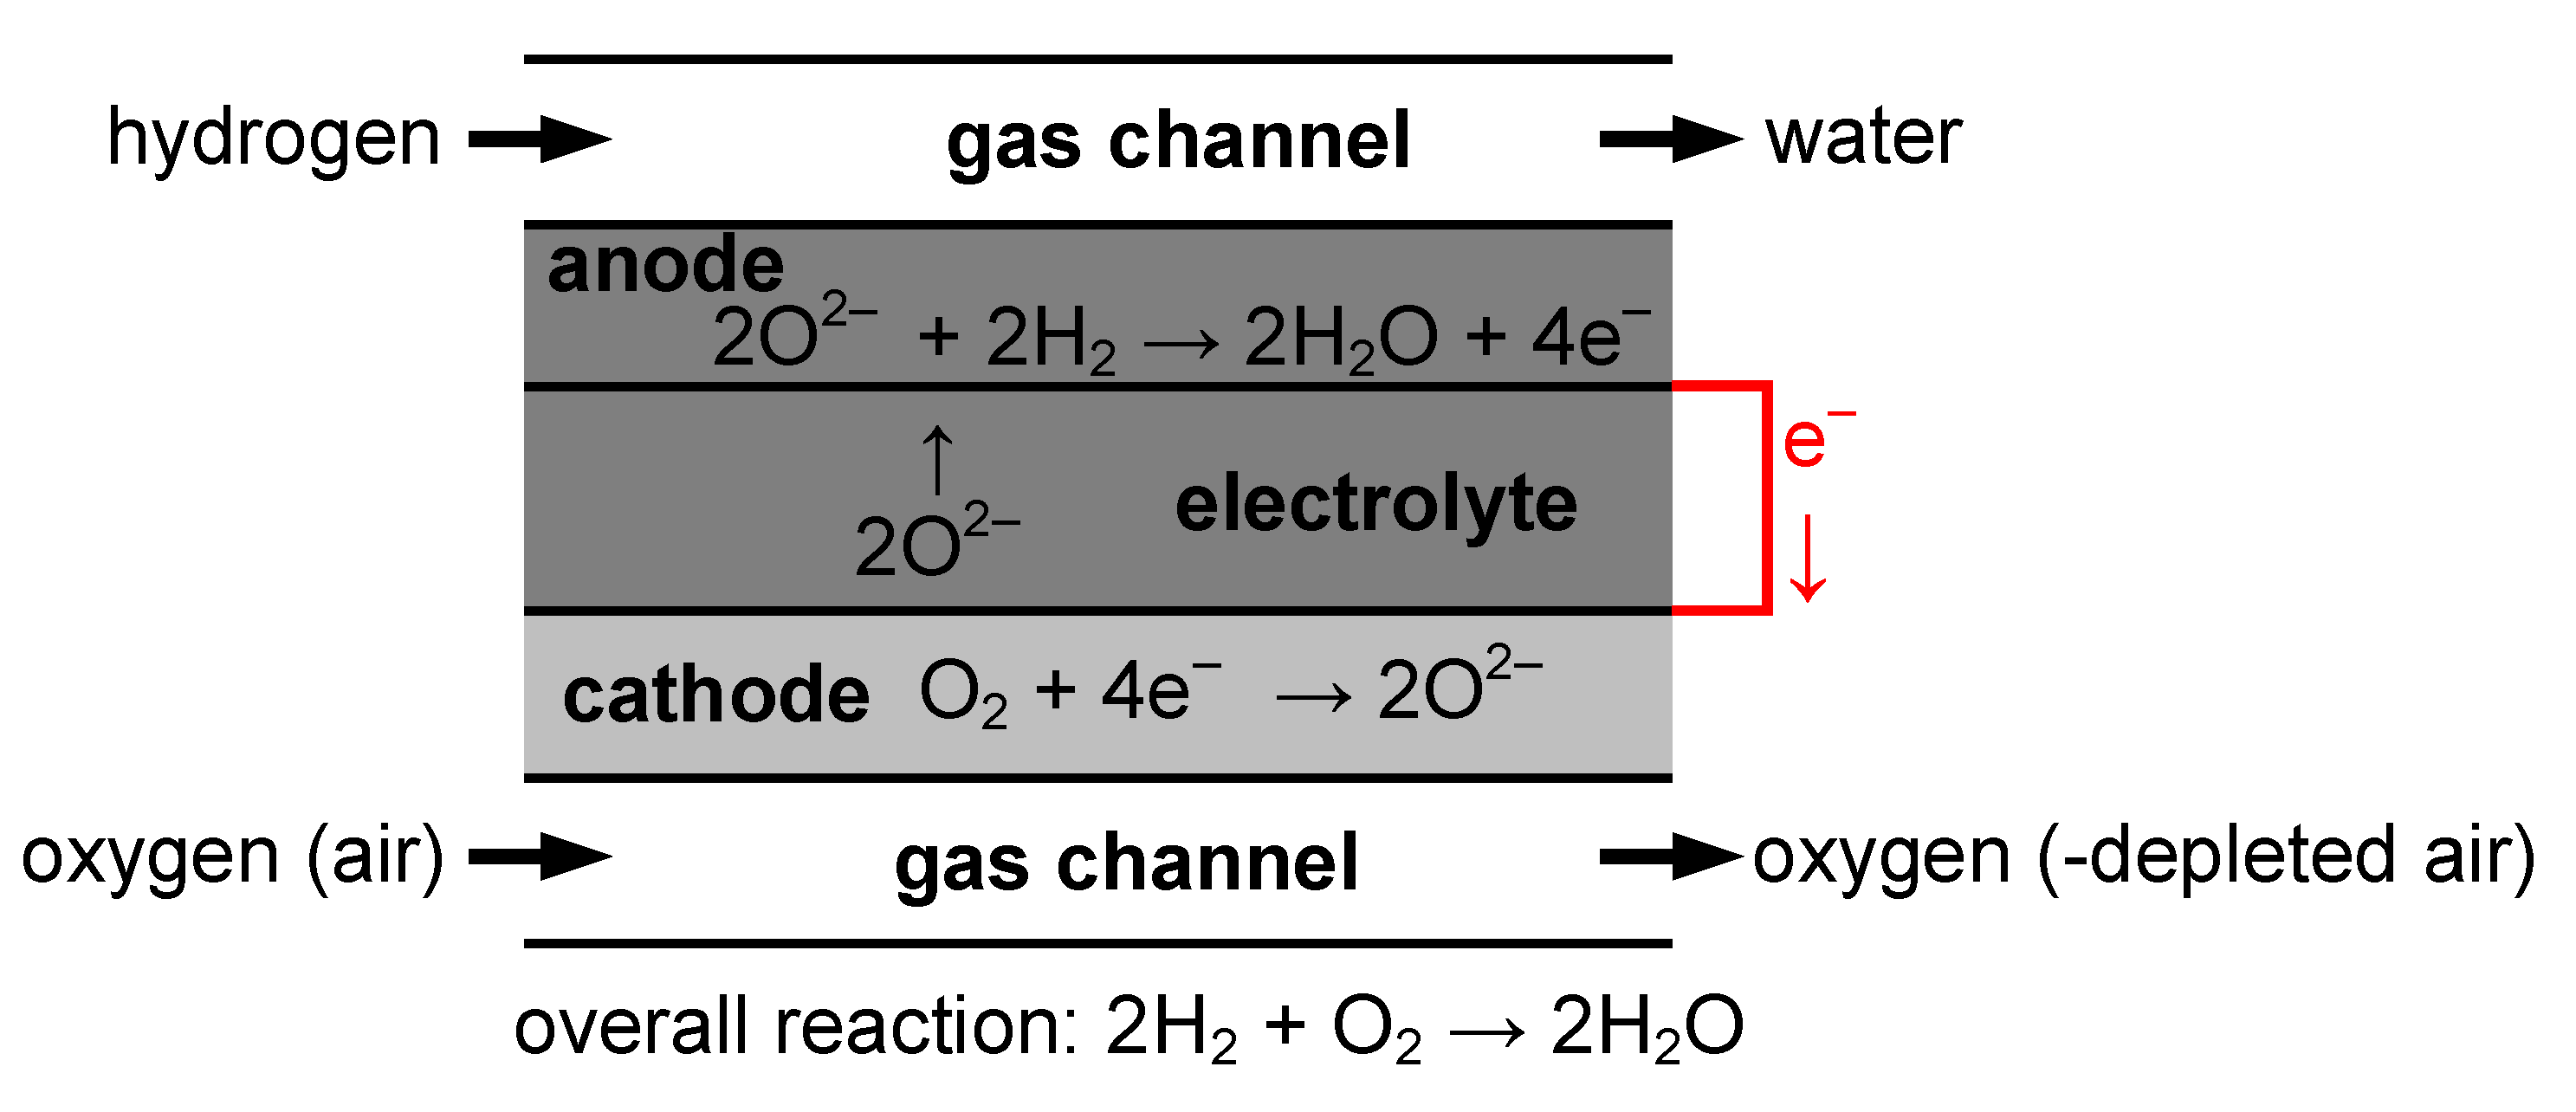
2.1. Solid Oxide Fuel Cell

In this work, one of the most basic SOFC-based system designs is assumed, shown in the process flow diagram in Figure 1. Hydrogen and air are fed to the SOFC where it is converted to electrical DC power. Any remaining hydrogen is burned in the combustor afterwards, which provides further heat to the process system. This heat is utilized to pre-heat the gas streams which consist of oxygen-depleted air and steam. The electrical DC power is converted to AC power by means of a converter. Hydrogen is assumed as feedstock because it is perhaps the most benign fuel for SOFC and also other fuel cell types. More complex feedstocks would require further auxiliary equipment and also add more constraints. Probably some more fundamental and pressing issues need to be resolved first for such basic system designs which will also be present in more complex designs, such as level of heat integration and operational requirements including the choice of fuel. The general auxiliary system equipment which is required for start-up is also indicated (in blue in Figure 1), further piping and instrumentation may also be needed.

2.2. Principal System Operation and Design

The principal mechanism in an individual SOFC is shown in Figure 2 with the gas channels and composite layers as its main parts. In addition to that, metallic current collectors (interconnects) and sealants are required (not shown in the figure). The gas channels on the cathode side provide the fluid for reduction and those on the anode side for oxidation, respectively. An oxygen-ion conducting solid electrolyte separates the cathode and anode. The outer electrical circuit provides charge neutrality and movement of electrons.
Oxygen ions move from the cathode across the electrolyte membrane to the anode with the half-cell reactions on the cathode (oxygen reduction) and anode (fuel oxidation) [4]
O 2 + 4 e 2 O 2 , 2 H 2 + 2 O 2 2 H 2 O + 4 e .
The SOFC is assumed to be of tubular-type, as shown in Figure 3 [28,29,30], with a total number of 1.200 equally behaving cells. Note that other geometries are also possible, such as planar designs, which have specific advantages and drawbacks compared to the tubular design [31,32]. Furthermore, designs may also differ with respect to cell-support. Here, a design with supporting cathodes was considered, but there are also designs with anode- and electrolyte-supported cells. Cathode-supported cells were reported to have advantages in terms of low carbon deposition [33] and, thus, fuel flexibility. Another advantage is the potentially lower risk of Ni-oxidation which leads to better mechanical integrity [34]. The cathode-supported SOFC may be regarded as optimal choice in terms of support thickness and operating parameters [35,36]. A drawback, compared to electrolyte- and anode-supported configurations, is a high polarization resistance [33]. Reference [37] provides further information about the present design.

2.3. Design and Operation System Constraints

Table 1 summarizes critical design and operation constraints of the SOFC-based system that determine the overall operation envelope for the SOFC. Of particular relevance are constraints related to temperature gradients which determine thermo-mechanical stresses. Note that constraints for the balance-of-plant system components are also shown for completeness. Some of those may be disregarded during start-up because of the use of auxiliary equipment. For example, the combustor is an active component which provides heat to the system. During start-up of the system, however, it may be necessary to use a secondary heat source in conjunction with auxiliary heaters to avoid potential fluctuations and rapid changes due to its relatively small thermal inertia [38]. In this work, setpoints of all manipulated variables are achieved without deviation and any constraints due to balance-of-plant system components are disregarded. Any preparation task for physical system start-up is assumed to be completed, including purging of gas channels. Furthermore, heat losses are likely to be of less concern during the relatively short start-up time compared to target operation times. Even though constraints may be soft with the principle possibility to exceed those, substantial performance loss, aggregation of irreversibilities, or both, may occur.

2.4. Degrees of Freedom

The controlled (CV) and manipulated variables (MV) for the SOFC system are listed in Table 2, also shown are the values for those related to the SOFC after more than 2 h from completion of the start-up procedure, i.e., when (semi-)steady state conditions can be assumed (further discussed below). The difference between the number of CV and MV represents the degrees of freedom (DOF) available in the system [58] but other options may also be possible for some of the variables. The selection of variables and their pairing need to take into account the general measurability of a quantity and its response time. For example, electrical properties, such as electrical current, usually respond faster than those related to heat. In the presence of electrochemically reactive species in the reaction zone (triple-phase-boundaries (TPB)) the SOFC can respond to load variations within the time scale of electrochemistry [38].
A physics-based system modeling approach requires to establish a well-posed formulation of the mathematical problem, which can be utilized to identify the correct set of CV and MV, both from a physical as well as technological perspective. The emerging required input parameters, therefore, represent exactly the DOF. For example, values of spatially distributed system state variables are usually not (easily) accessible through direct measurement, nevertheless, overall system state variables can be defined. A case in point is the mean solid temperature of the SOFC (defined below) which is a quantity obtained through numerical integration. Such metrics that are based on detailed models provide a better description of system constraints and operation compared to lumped-per-default quantities.
Well-posedness of the mathematical problem for numerical solution is preserved, independently whether MV or CV are specified as input parameters. In this respect, specifying the CV corresponds to the case of perfect control without deviations in measurements of MV, controller actions for CV, or other stochastic effects.

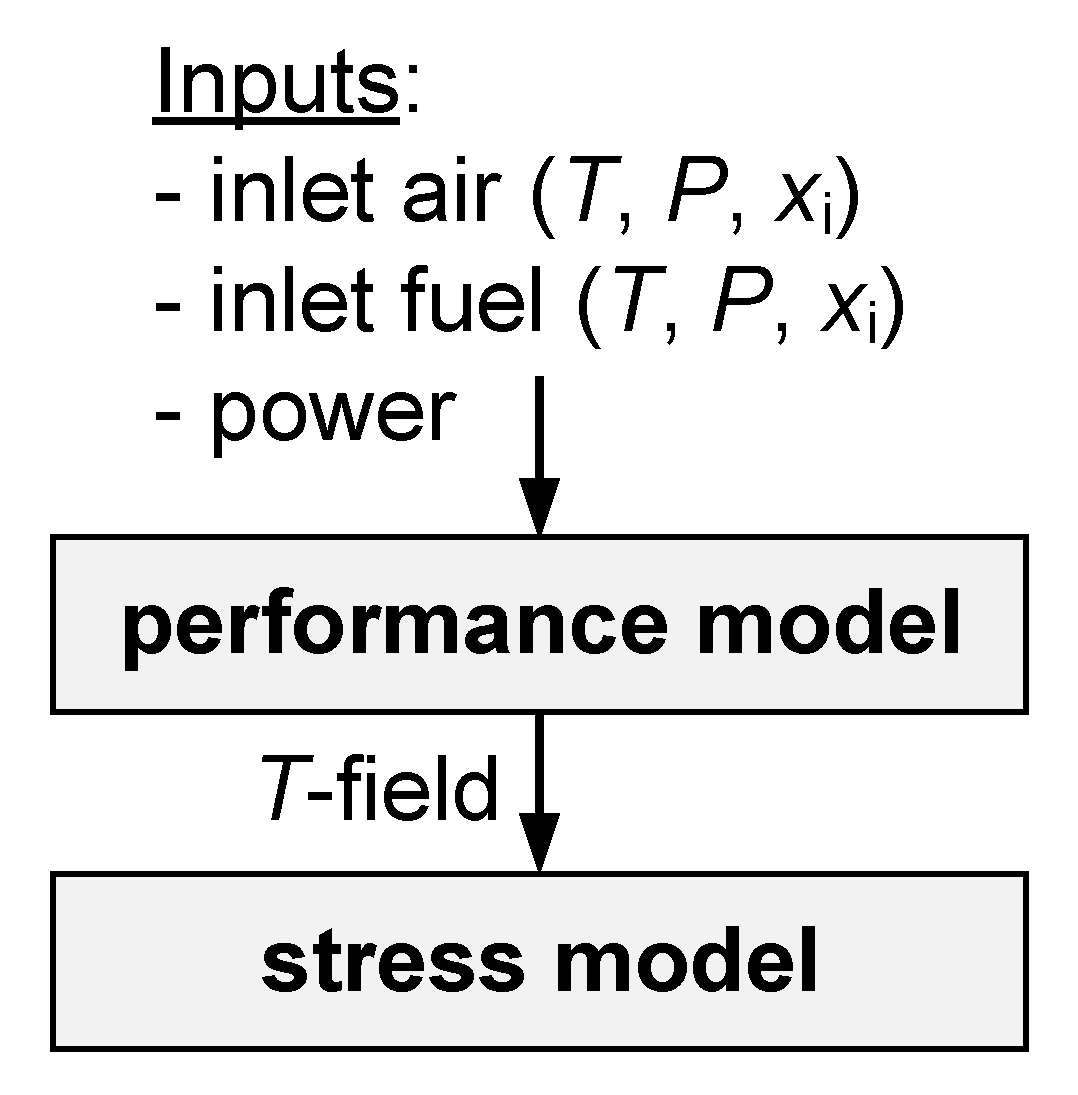
3. Mathematical Model

In this section, the mathematical model of the SOFC is briefly presented. The connection between the thermo-electrochemical-chemical performance and thermo-mechanical stress sub-models is shown in Figure 4, where the temperature field of the solid is calculated in the performance model and simultaneously used as input for the stress model. In the latter, the tensor stress field is determined. References [59,60] provide further details. And a complete description of the thermo-mechanical steady state model (including boundary conditions) is given in references [61,62].

3.1. Energy and Mass Conservation

Heat transfer for gas and solid, respectively, are described by [59,60,63]
T g c p , g ρ g t + v g T g c p , g ρ g z = 2 h c r ( T s T g ) ,
ρ s c p , s T s t = λ s 2 T s .
with the boundary condition [59,60]
λ s T s r = h c ( T s T g ) + r ˙ Δ h 2 π r L ,
where the reaction rate is given by [4]
r ˙ = i A 2 F .
For the gas phases, mass conservation reads [59,60,63]
C i t + v g C i z = r ˙ i ,
The model includes pressure drops for the gas streams.

3.2. Electrochemistry

The cell voltage is [4,29]
V c e l l = V O C η a c t a n η a c t c a η c o n a n η c o n c a η o h m
The Nernst equation gives the open circuit voltage (OCV) [4,29]
V O C = E + R T z F l n a o x i a r e d .
And with the Butler-Volmer equation the activation polarization losses are implicitly determined [4,29]
i i = i i e x p n i β f i F η a c t , i R T e x p n i β r i F η a c t , i R T
The concentration polarization losses are described as follows [4,29]
η c o n , i = R T n i F l n ( p i , g , p i , T P B ) .
The ohmic loss is [4,29]
η o h m = i A R ,
with an ohmic resistance comprising temperature-dependent layer resistivity of electrodes and electrolyte and a constant resistivity for the interconnects [59,60].

3.3. Thermo-Mechanics of Solid Components

The deformations and displacements of the solid material are determined by means of the Navier equations in cylindrical coordinates [64,65]
μ 2 u r u r r 2 + ( λ + μ ) r 1 r r ( r u r ) + u z z = β T ˜ r , μ 2 u z + ( λ + μ ) z 1 r r ( r u r ) + u z z = β T ˜ z .
The relations between displacement and strain are [65]
ε r = u r r , ε θ = u r r , ε z = u z z , ε z r = ε r z = 1 2 u r z + u z r .
Stress and strain are related through Hooke’s law [65]
σ i = λ ( ε r + ε θ + ε z ) + 2 μ ε i β T ˜ , w i t h i = r , θ , z , τ z r = τ r z = 2 μ ε z r .
Boundary conditions are defined at gas–solid and solid–solid interfaces. One end is assumed to be fixed on the cathode and the other end is free [59,60], as shown in Figure 3. The crooks (indicated by dotted lines in the top view of Figure 3) for individual cells are not included in the present analysis because these are assumed to be less susceptible to failure compared to the electro-chemically active materials of the electrodes and electrolyte. Furthermore, the use of current collectors as indicated in Figure 3, represent a discontinuity of the tubes, their effects are also disregarded here. Note that a variety of materials have been developed for the individual parts of the SOFC, see for examples references [66,67] for individual advantages and drawbacks, also including the materials assumed in this work.
Thermo-mechanical parameters are [64,65]
λ ( z ) = E ( z ) ν ( 1 + ν ) ( 1 2 ν ) , μ ( z ) = E ( z ) 2 ( 1 + ν ) , β ( z ) = α E ( z ) 1 2 ν .
The initial stress distribution during the sintering process, with a reference temperature of 1473 K [68], is assumed to be homogeneously distributed in the material. See Table 3 for additional input parameters.

3.4. System Variables

The total current from the SOFC is
I = A L 0 L i ( z ) d z ,
with the DC power
P = V I .
Fuel utilization (FU) is calculated according to [4]
F U = I 2 F n ˙ f u e l .
The overall electrical system efficiency is
η e l = P n ˙ f u e l L H V f u e l .
And the mean solid temperature is determined by
T ¯ s = 1 L 0 L T s ( z ) d z .

3.5. Degradation and Failure Mechanisms

Potential degradation mechanisms for SOFC are numerous, complex, and often mutually dependent. For example, the system design determines to some extent which mechanisms will be dominant [72], also the actual dimensions of parts [73]. Materials the process components and parts are made of are other design criteria with a strong effect on performance and duarability [41]. The feed-gases, in particular the fuel and its purity, are further criteria (see also references in the introduction). For example, carbon-containing fuels, such as natural gas or synthetic gas (produced from biomass or coal gasification), can lead to coke formation [74]. Sulfur, even in relatively small amounts, can promote poisoning [75]. Moreover, evaporation of materials from balance-of-plant system components may also cause contamination. The complex kinetics are temperature-dependent (among others), operation conditions therefore also strongly affect degradation mechanisms, for example in terms of voltage, current density and FU [76]. Yet another criterion with an effect on materials durability is the number of cycles the system undergoes as well as their characteristics in terms of loads and dynamics [77].
In this work, the gas supplied to the SOFC is assumed to be free of any potential contaminants. Safety gas is used for the simulation to control the electrochemical reactions and chemical potential, respectively. In addition, uncertainties would be introduced, since in many cases data are not available for the entire range of interest for start-up analysis, which must cover a temperature range from ambient temperature to the temperature ranges required for operation.
Failures can occur as a result of thermo-mechanical stresses, with a force-term comprising temperature gradients and differences between the materials with respect to physical properties, such as thermal expansion coefficients (see Table 3). It is emphasized that degradation mechanisms can also promote or trigger failures, for example due to material defects that are introduced during manufacture or system assembly. However, these effects are characterized by high stochastics and can hardly be captured with first principles modeling.

3.6. Model Implementation and Numerical Solution Methods

The model was implemented and numerically solved in gPROMS [78]. Besides well-posedness, the solution requires a problem formulation of index one (The index determines the smallest number of times the PDAIE must be differentiated to determine continuous functions of the state variables and certain space derivatives of their components. The higher the index, the more difficult it is to solve the equation system. Individual equations may be reformulated if models have an index higher than one for the numerical solvers to handle. ).
Finite difference (FD) schemes are used for the discretization of the PDE. For the SOFC 40 discretization elements in axial direction and 10 in radial direction for the cathode, and 5 for the anode and electrolyte are used (cathode is the thickest part of the assembly). The total number of equations for the complete system is 14.5 k (13 k algebraic and 1.5 k differential equations). The thermodynamic model was tested with a finer discretization, which led to a higher number of equations and therefore computation time but little difference in the results. Backward, forward and central FD methods were used for discretization. Air in the air delivery tube used backward FD, whilst for the air and fuel forward FD was used as they have the same flow direction. Central FD was used for the solid membrane layer. All simulations start with steady state as initial condition. As the numerical solution of strongly coupled time-dependent PDAIE systems are demanding for the solvers, in particular in the presence of (imposed) discontinuities and a wide parameter value range for state variables, various techniques were used for numerical stability, including non-dimensionalizations and adjustments of solver settings.
The physical property package Multiflash [78], is used for thermodynamic properties, while thermo-mechanical properties were taken from literature (e.g., Table 3). Empirical functions were implemented for continuous parameter-dependency using the software DataFit [79].

4. Results and Discussion

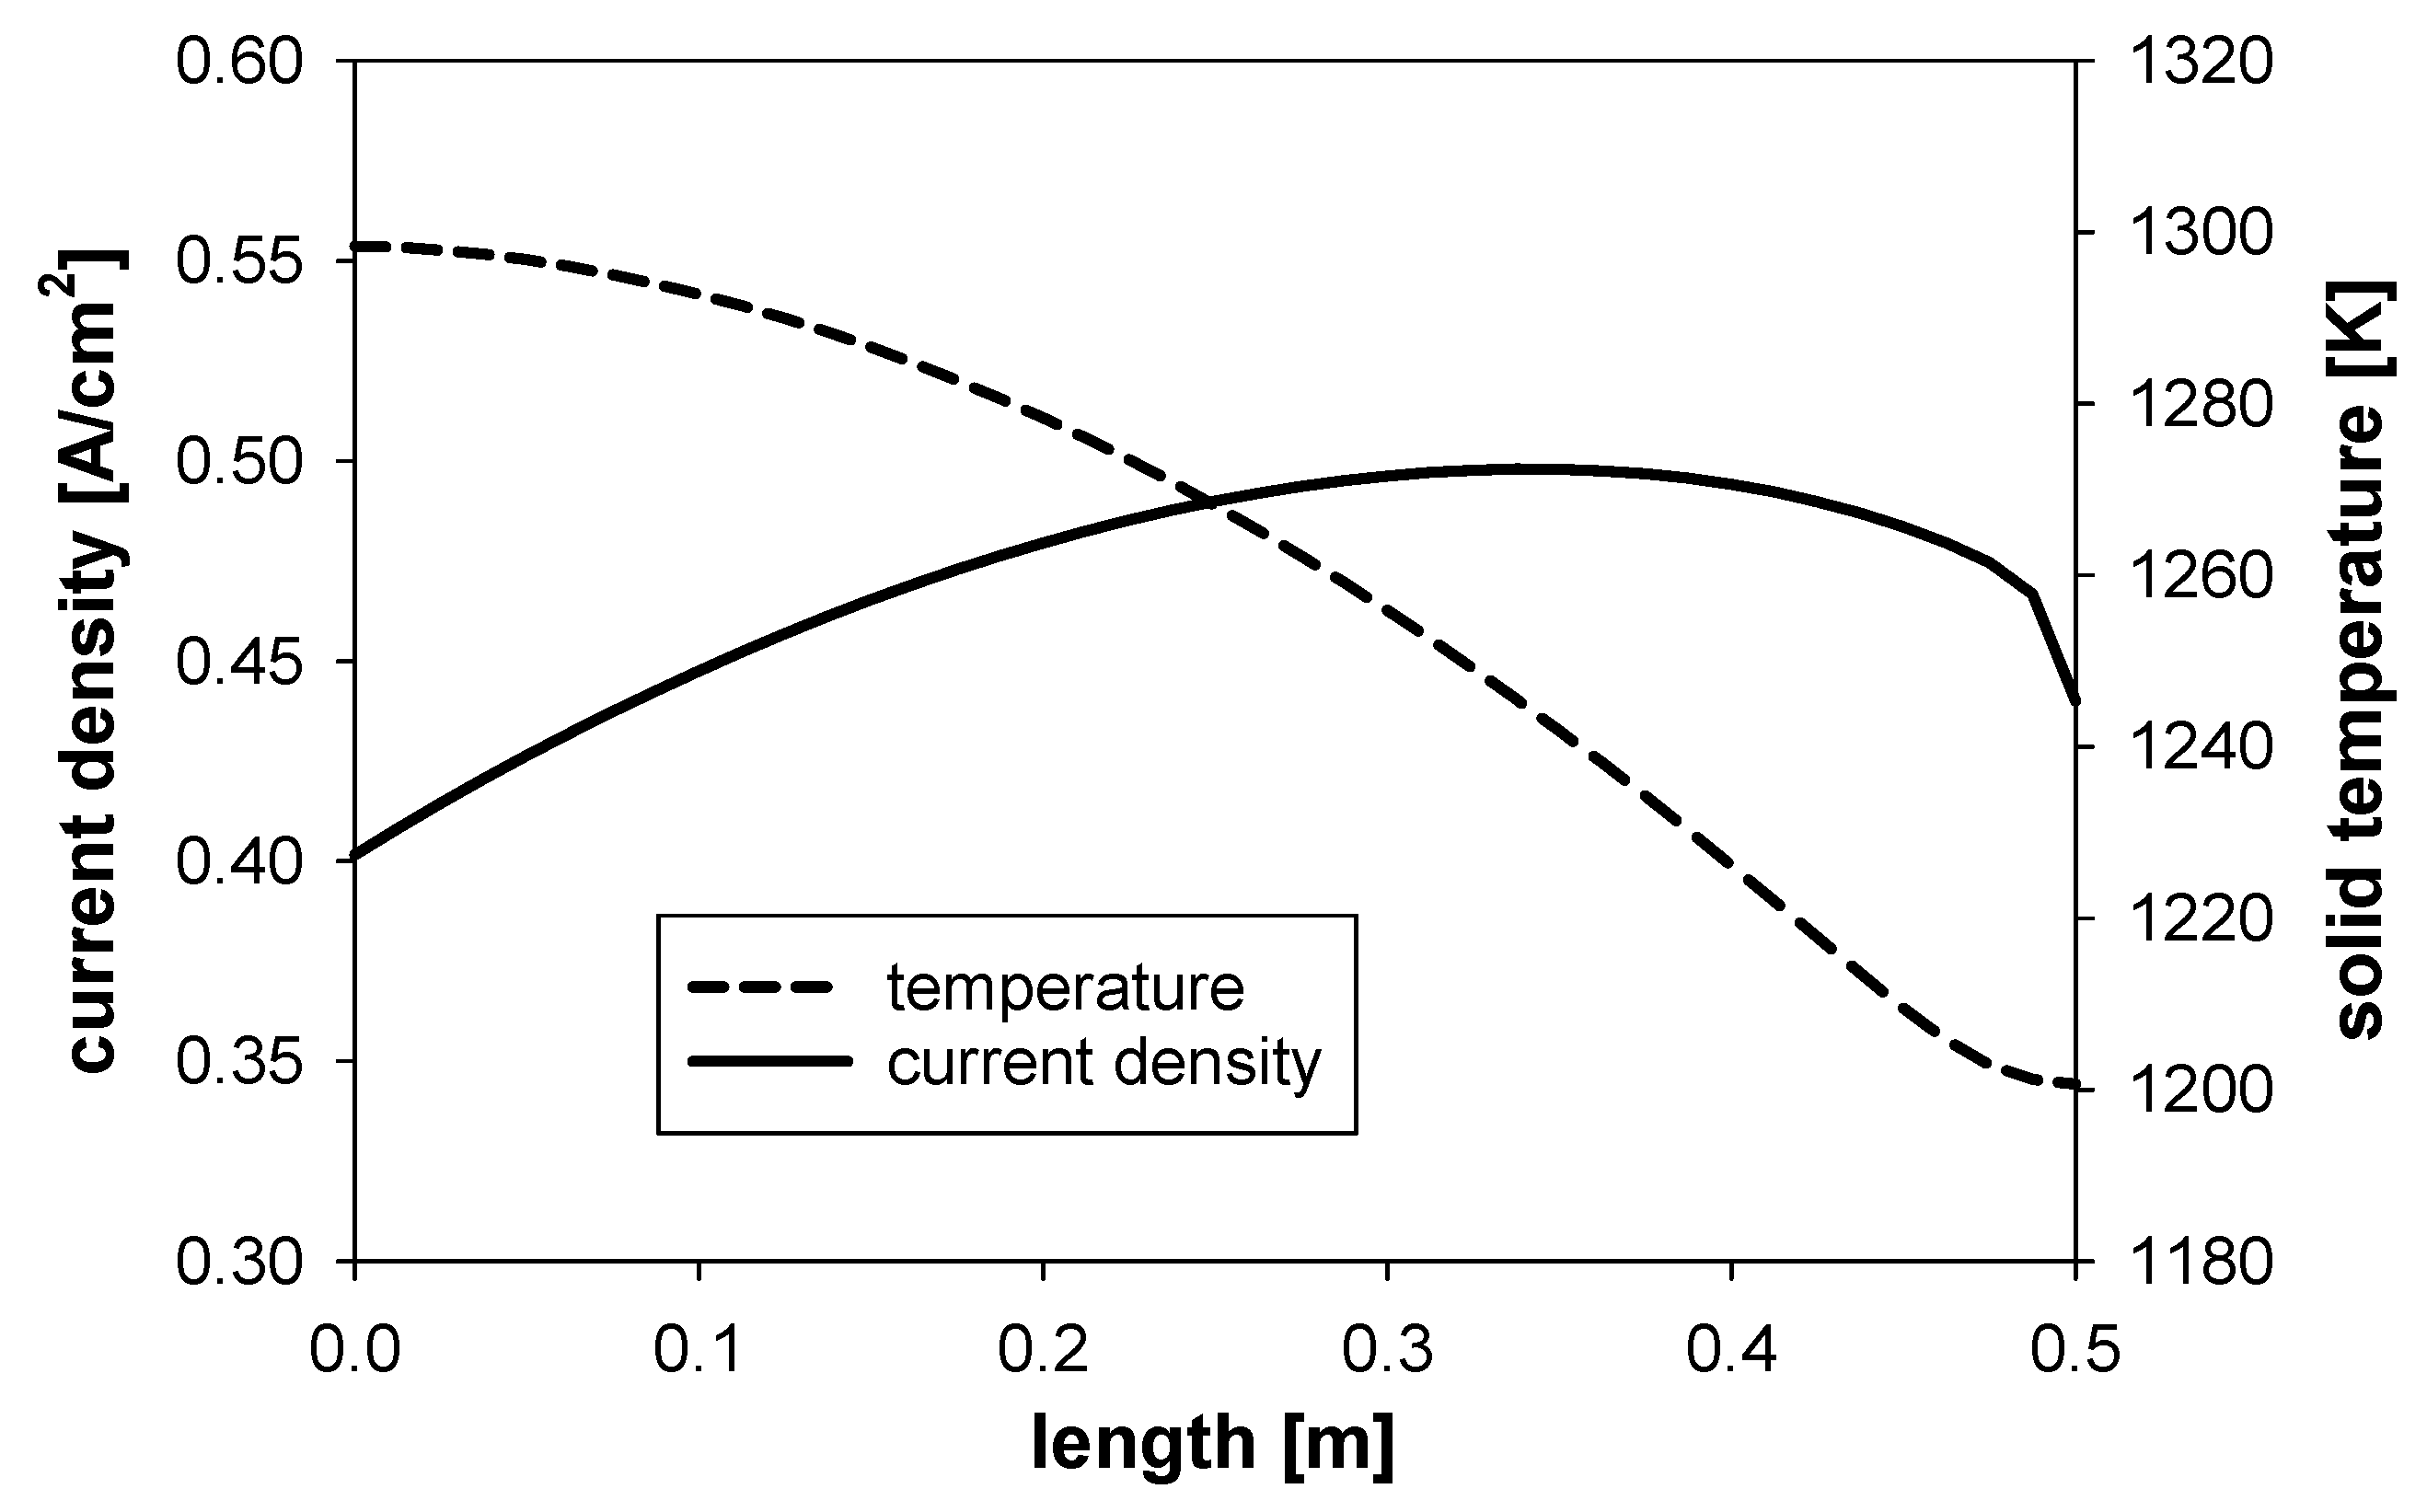
4.1. Model Verification and Thermodynamic Steady State Performance

The overall deviation of energy and mass conservation due to the numerical solution between the inlets and outlets on a component- and system level
Δ ζ = 1 k ζ i n , k k ζ o u t , k , ζ = E ˙ , m ˙ ,
to verify the model for all steady state simulation. For the energy balance check of the SOFC the supplied heat through the feed gas, as well as electrochemical reactions need to be taken into account. The deviation with respect to energy is about 0.1% and for mass about 0.001%, which is considered as sufficiently small.
The original thermodynamic model is based on References [59,60], which was validated against results from cited references. For the thermo-mechanical part, a direct validation of simulation results presented in this work was not possible, neither a comparison with other works using the same assumptions, such as geometry, reference temperature, and operating conditions. However, results for stresses and displacement presented below are comparable with those reported in other studies, see Table 4.
Figure 5 shows results for current density and solid temperature from the thermodynamic performance model under normal operation conditions, with a voltage of 0.55 V, after more than 15 h from initiating start-up (see Figure 6 and Figure 7), the mean solid temperature is 1261 K (Table 2). As shown in Figure 3, air is preheated in the air delivery tubes. Heat transfer between the preheated air and fuel, which flow in the same direction, is determined by convection in addition to heat generation through electrochemical reactions (Figure 2). Due to this heat source, the solid temperature (electrodes and electrolyte) is close or even higher (but still <1 K) than that of the fuel temperature, rather than between the gases (temperature profiles are not shown). Hydrogen and steam in the fuel, and oxygen in the depleted air, participate in the electrochemical reactions. The current density is calculated through the reaction rate (not shown), which is a function of the solid temperature and the driving force caused by the electrochemically reacting species. It ranges from 0.402 to 0.498 Acm 2 , i.e., current density is relatively homogeneously distributed over the axial direction. The resulting total electrical current for the system is 131.1 A (Table 2). The drop in current density after passing the mid section (from right to left) is dominated by the decreasing driving force in axial direction in spite of higher solid temperatures.

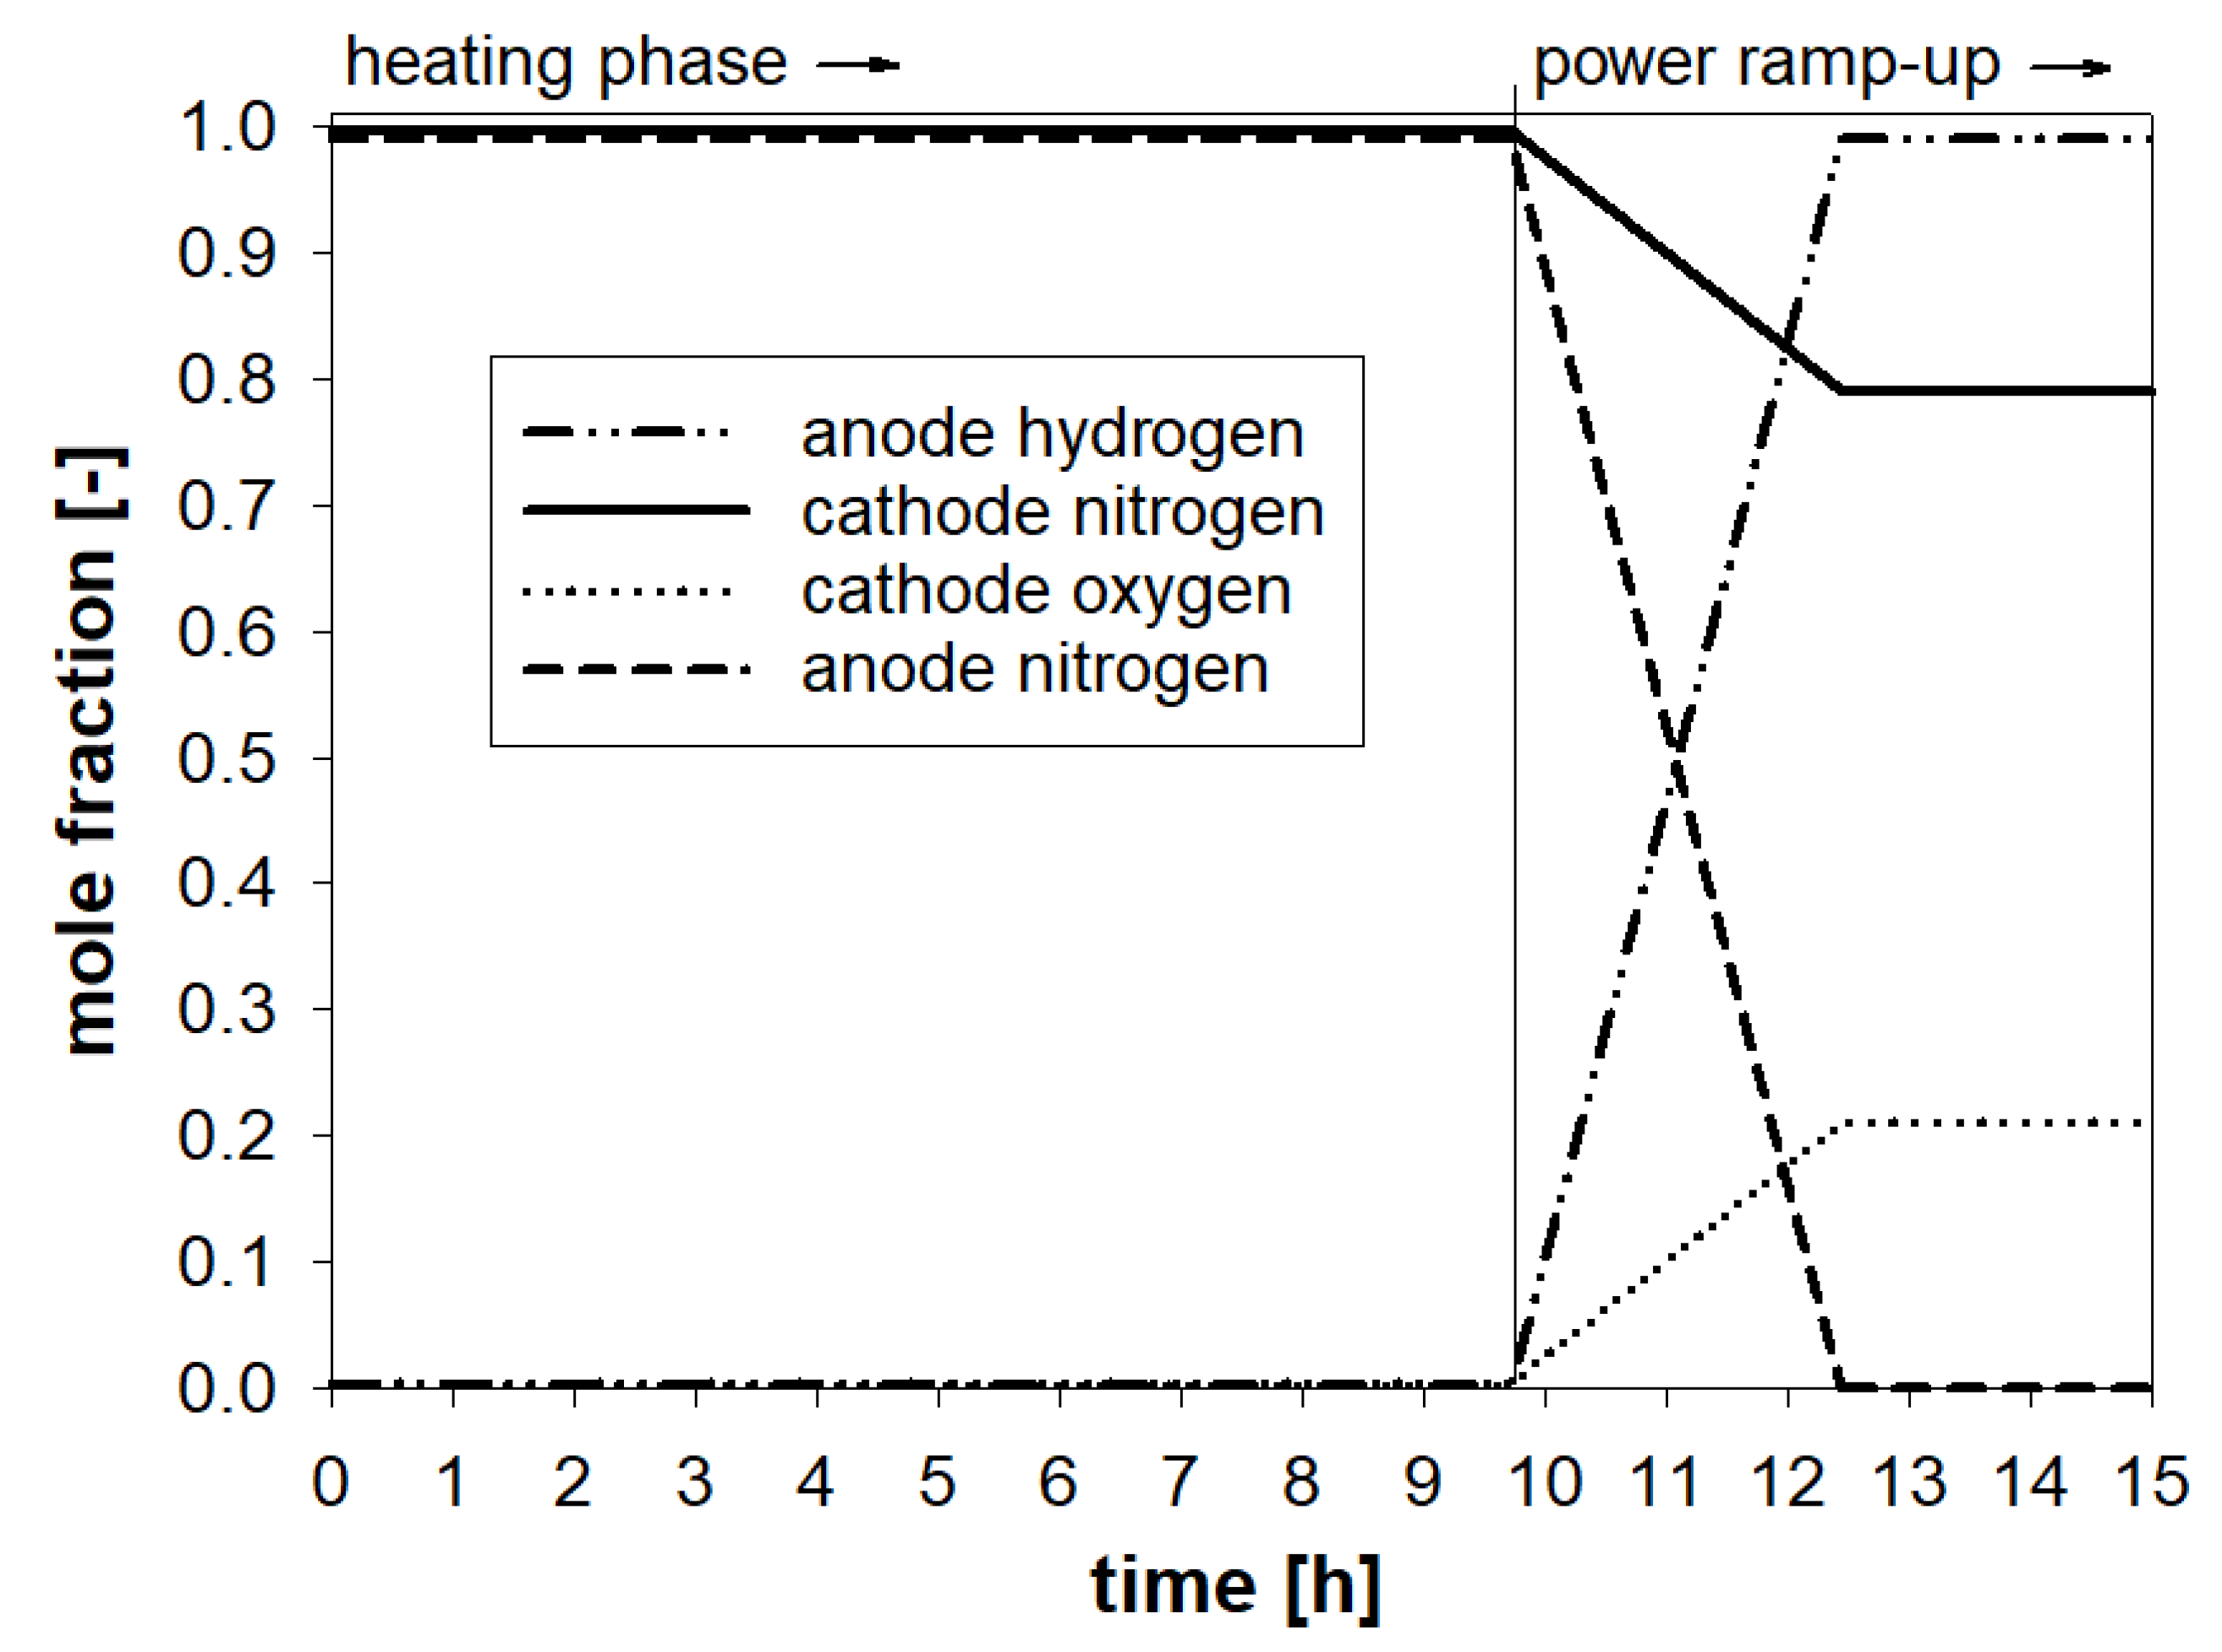
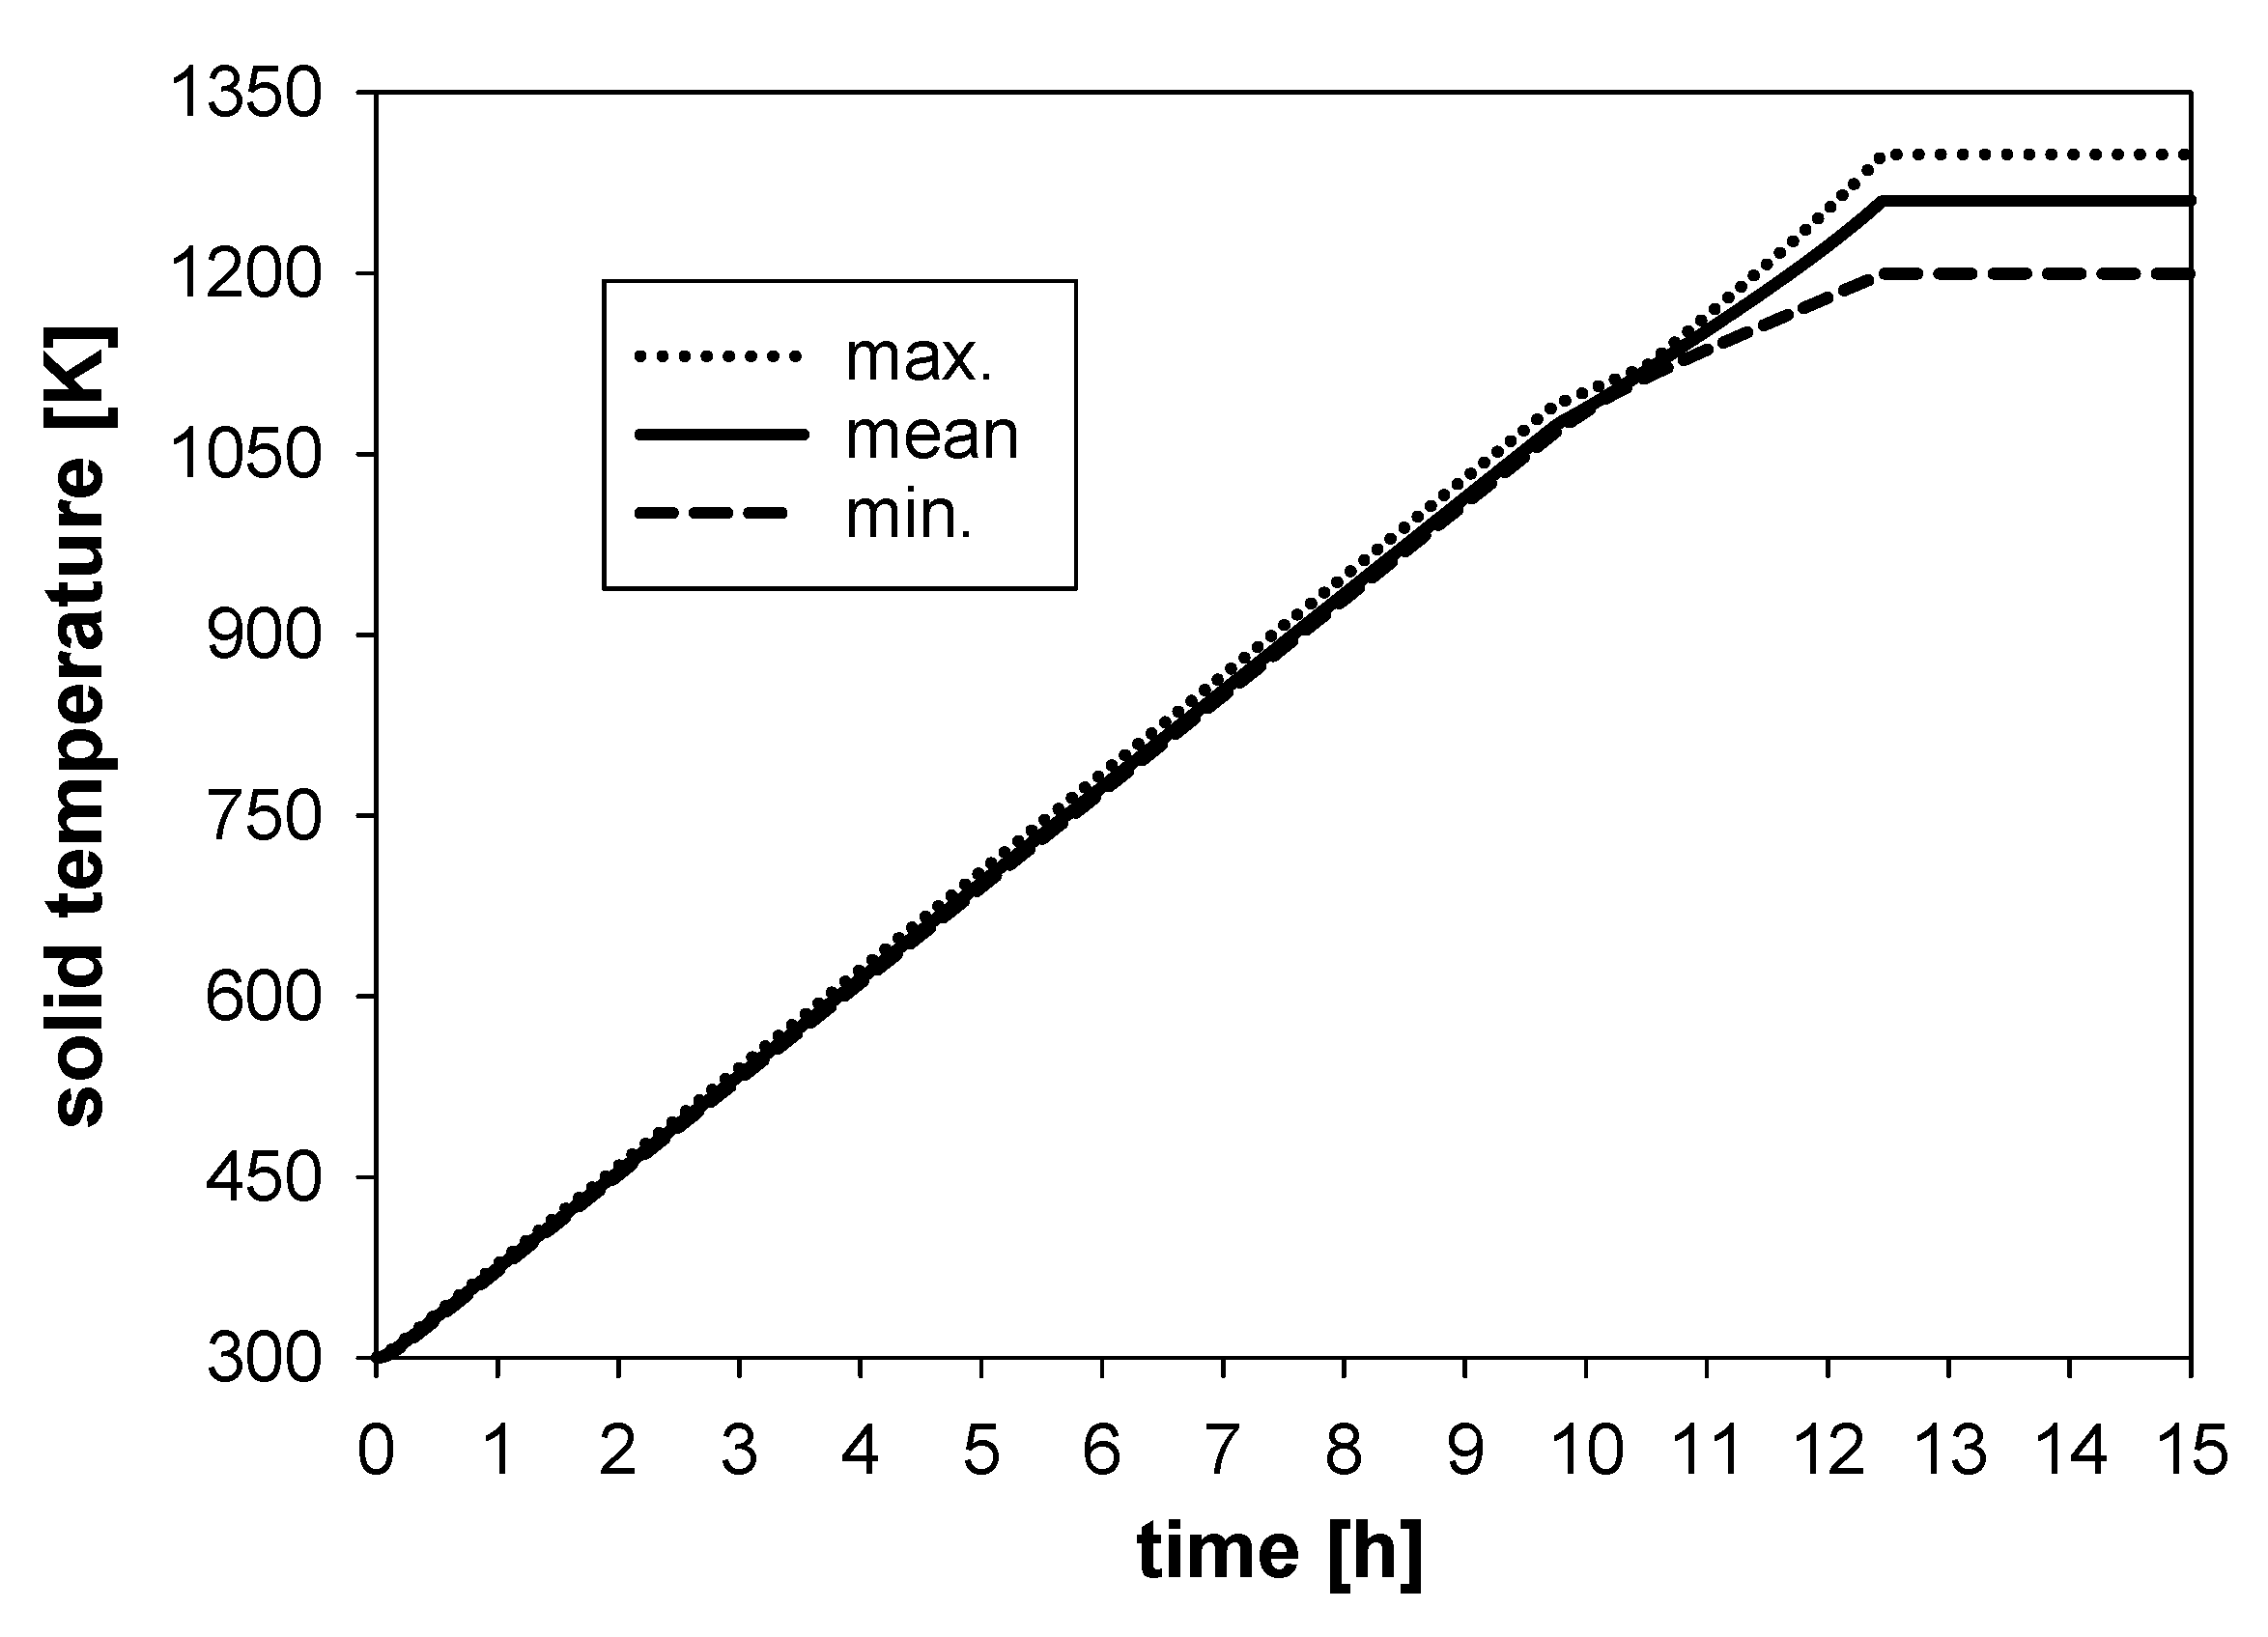
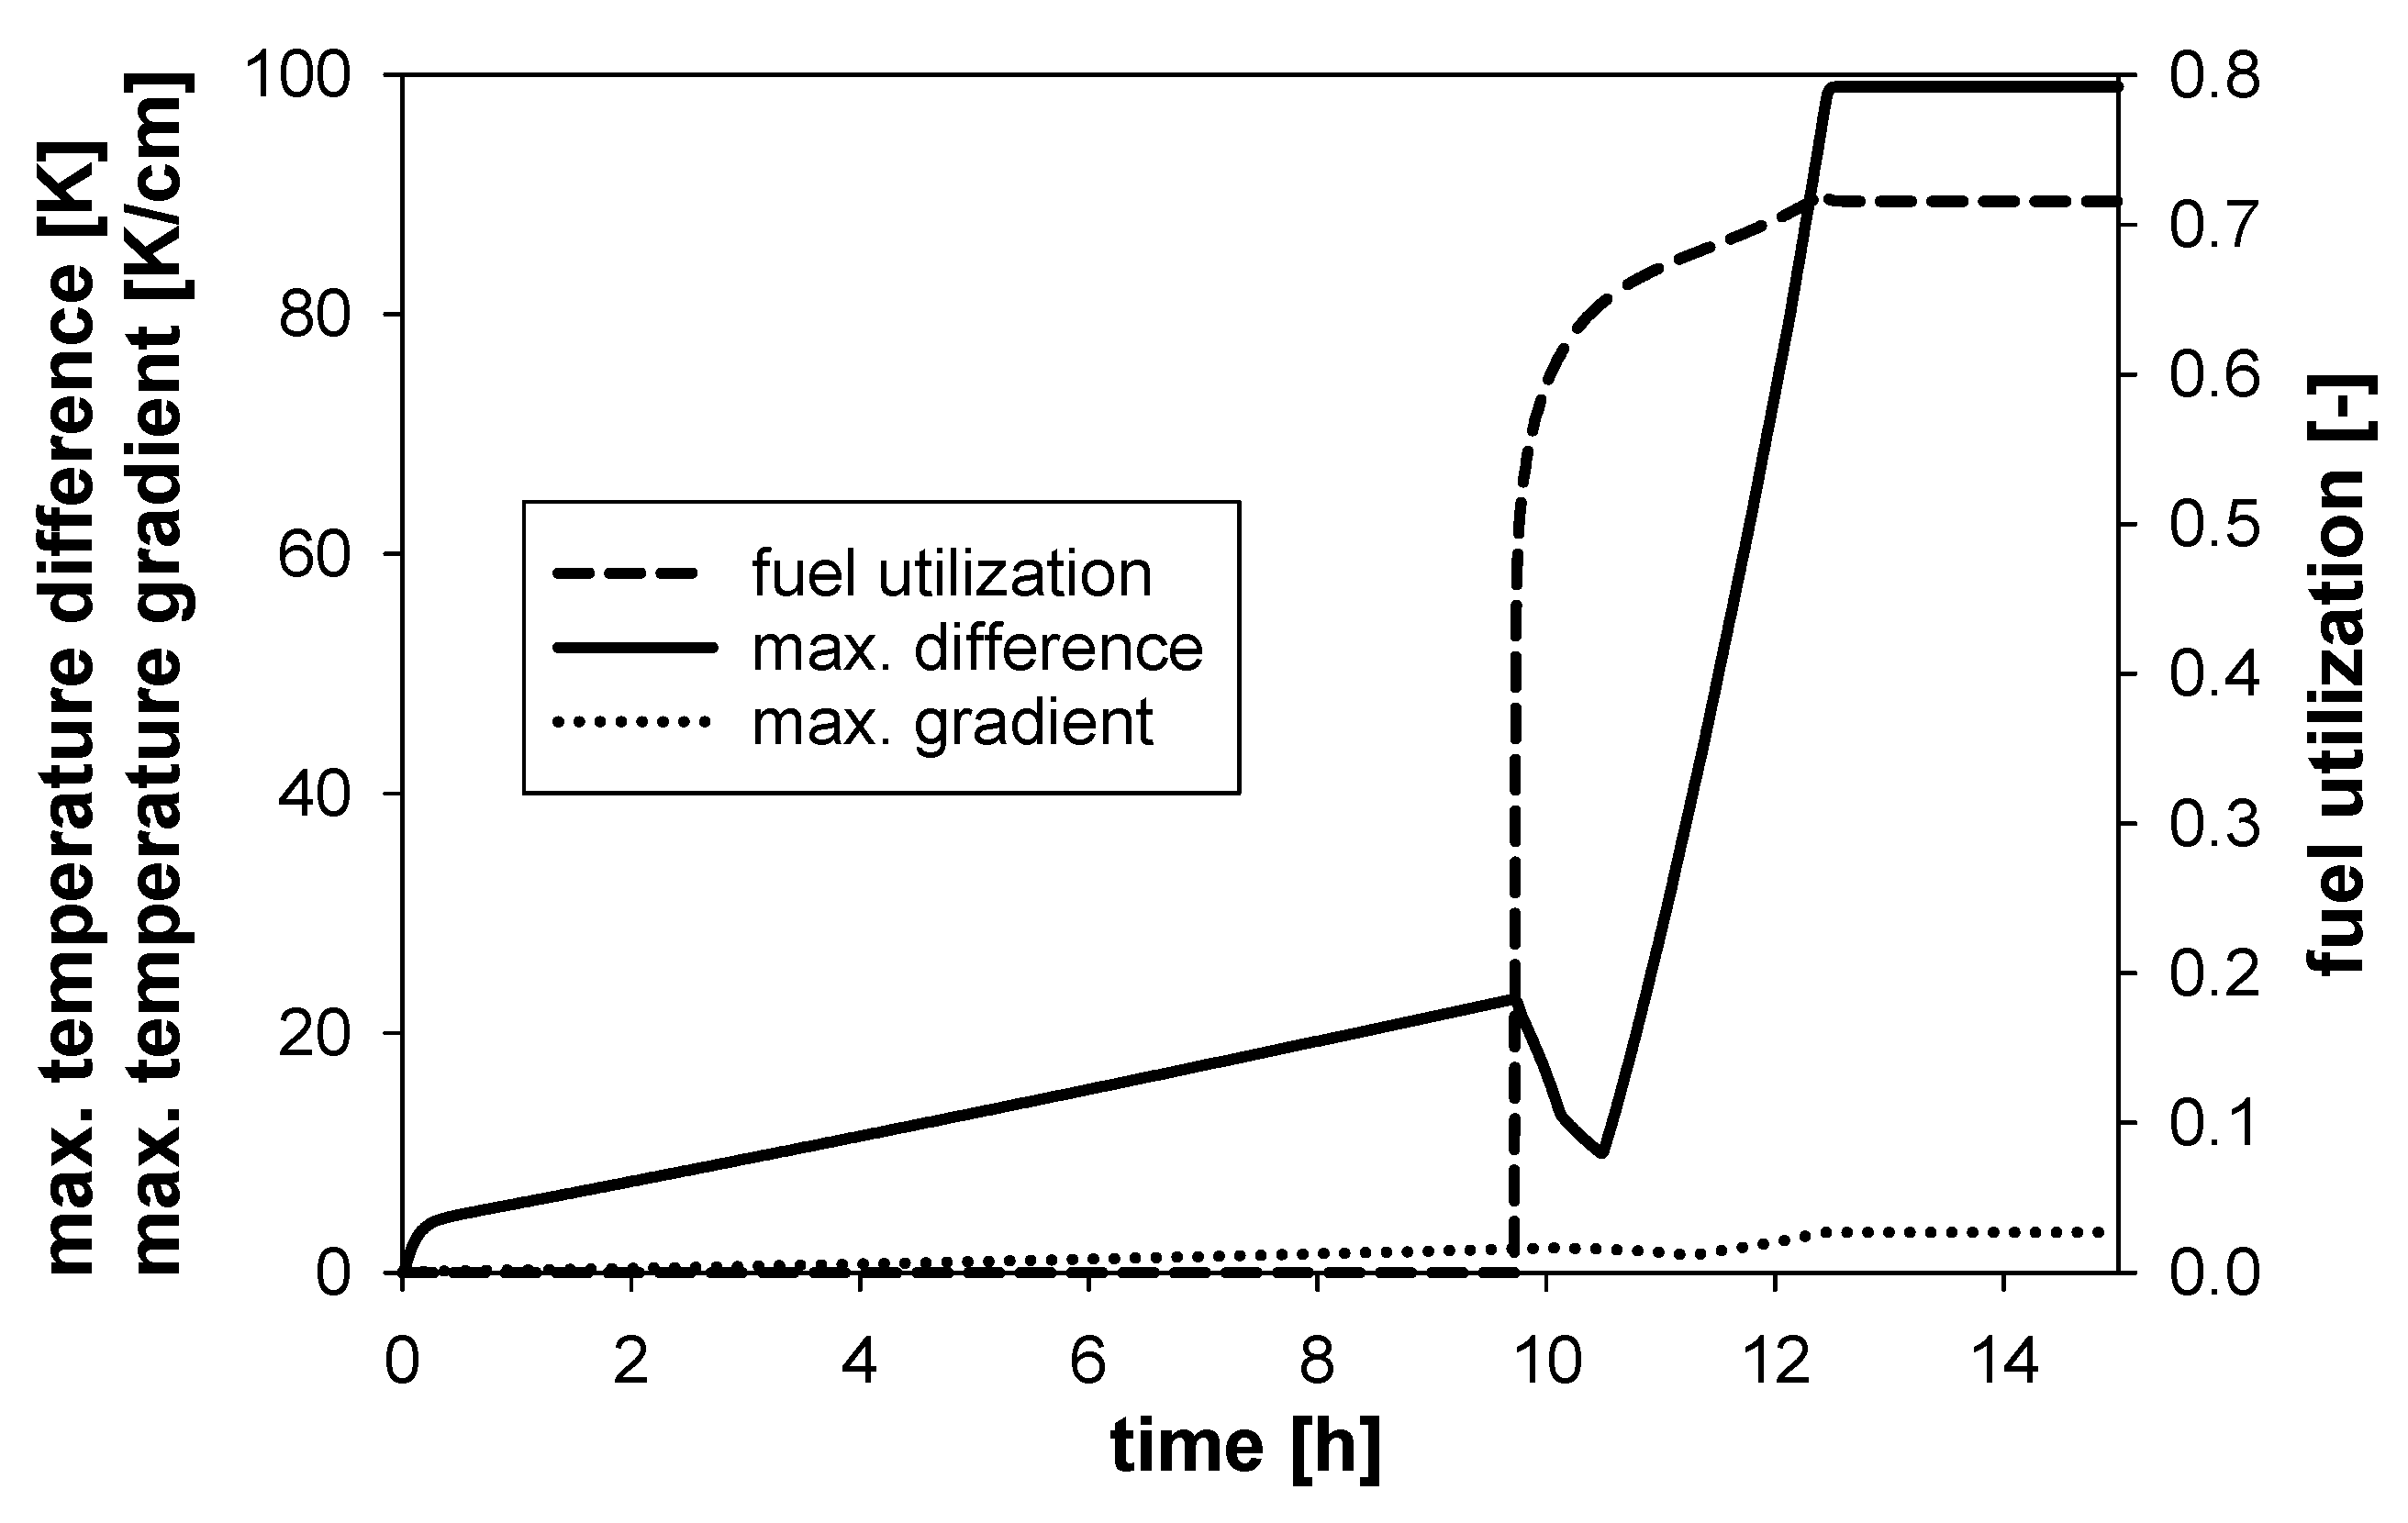
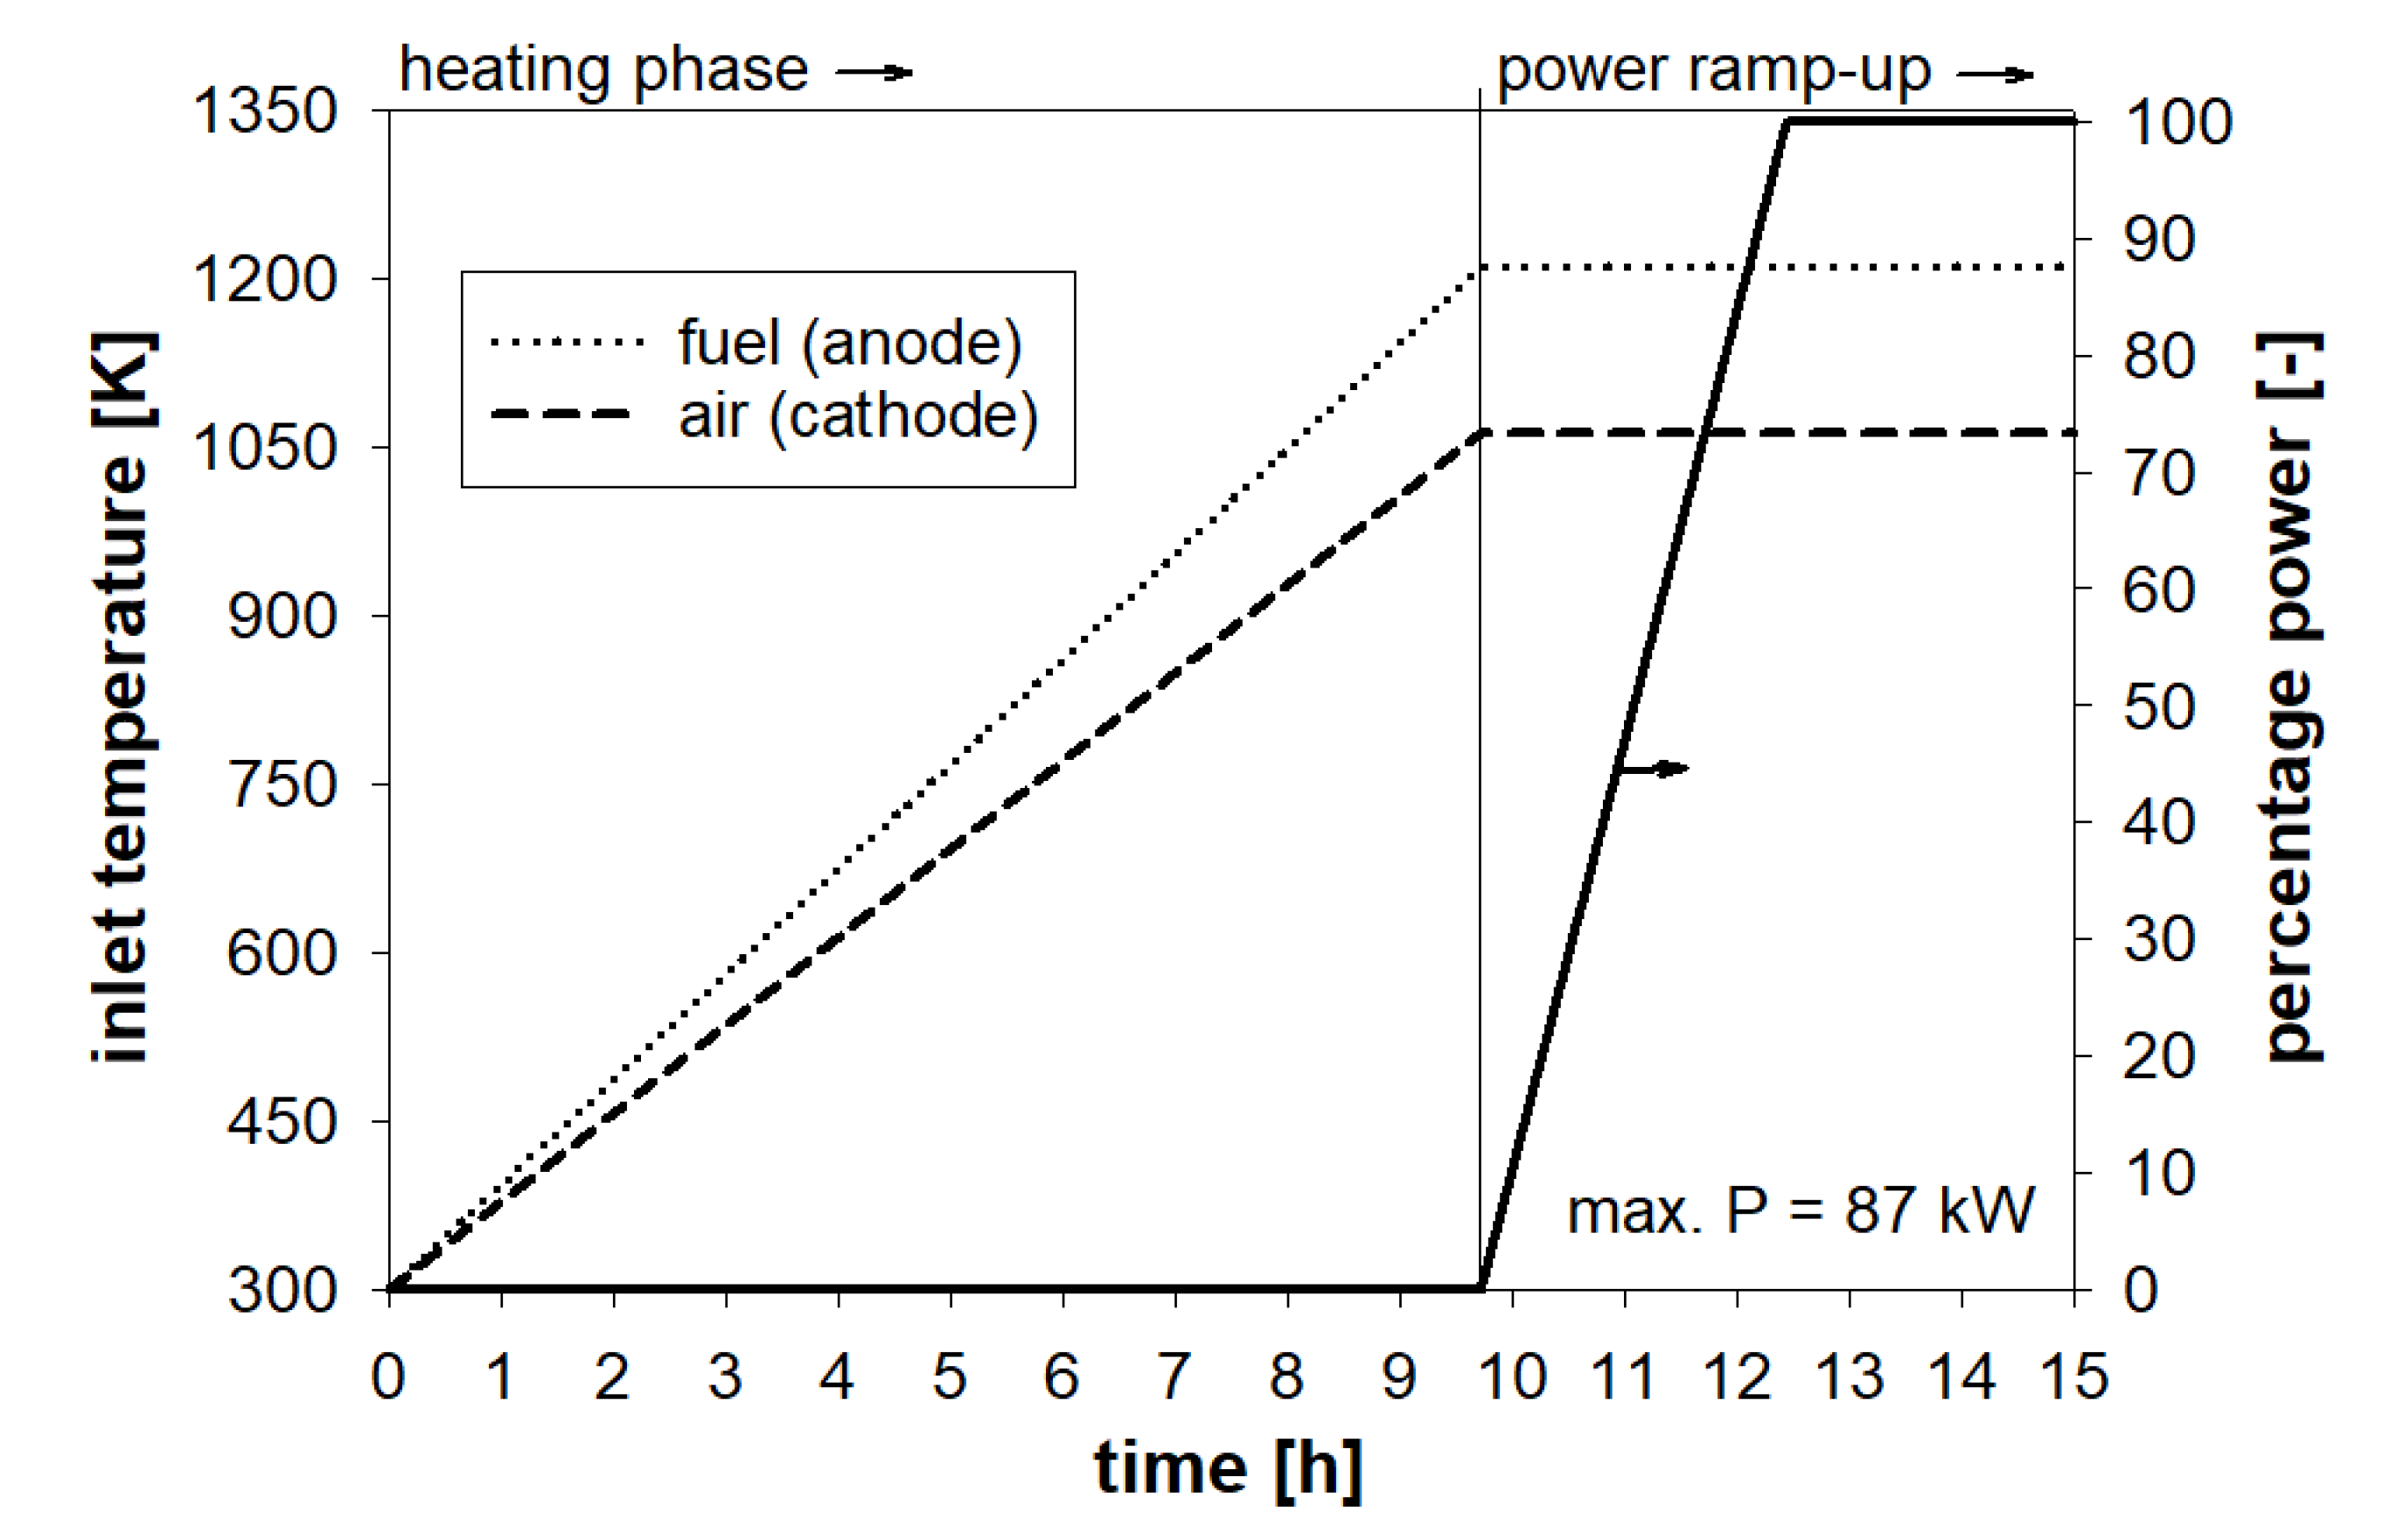
4.2. Start-Up Procedure

The start-up procedure consists of two phases, namely heating and power-ramping. In the heating phase the system’s temperature is increased by auxiliary heaters; the resulting temperature profiles are shown in Figure 6 (see also the system block diagram in Figure 1). During this phase no electrical power is extracted from the system. Heat transfer through anode and cathode gas is used to increase the temperature in the SOFC at a rate of 1.308 Kmin 1 for air and 1.56 Kmin 1 for fuel, respectively. A higher rate, and, thus, final maximum temperature, was chosen for the fuel gas based on the target design point [82], but other temperatures and combinations with respect to temperature differences between the feed gas streams are in principle also possible. The start-up procedure is initiated under non-reactive conditions at ambient temperature and ends when target operation conditions are reached with respect to the controlled variables (see Table 2). In the second phase, the chemical compositions of the two feed gas streams are changed, as shown in Figure 7 (anode hydrogen up and nitrogen down, cathode oxygen up and nitrogen down), along with power ramp-up (531 Wmin 1 ) (Figure 6) until the target design point has been reached. This safety gas is used for the anode, as well as cathode to control the hydrogen and oxygen partial pressures, respectively. The mass flows are kept constant for simplicity but they are additional DOF, which are important from an economic point of view. Various scenarios were simulated for the ramping of gas compositions and electrical power. In this work, the ramping duration for gas compositions and electrical power coincide but other combinations are possible as well, for example power ramping may continue while no further safety gas is used (or vice versa). Simulations were also done with higher rates which may be feasible for the second phase of the start-up procedure, but the present values led to improved numerical stability throughout the entire simulation run. With further optimization of the input values for the controlled variables more aggressive rates are hence applicable. Concerning the balance-of-plant system components, the combustor can be assumed to respond (nearly) instantaneously. Perhaps it needs to be bypassed during start-up to avoid interruptions in the heat supply to the SOFC. For the pre-heater standard materials can be used, i.e., the exhaust gas from the combustor can be directly fed to those process units. The entire start-up procedure from off-mode conditions to operation conditions takes about 12.4 h which is in the range presented in Reference [20].

4.3. Performance and Temperature Response

Figure 8 shows the minimum, mean, and maximum spatial temperature in the SOFC during start-up, with an absolute maximum of 1299 K in the chosen design point. The temperature of the solid eventually exceeds that of the fluids due to the electrochemical reactions, as discussed earlier. Figure 9 shows the maximum of the temperature gradient and temperature difference over the SOFC’s axial length in the solid, as well as FU over time. Notice that power ramping and changes in the chemical composition of the feed gases is initiated after the final gas temperatures have been reached (Figure 6 and Figure 7). The decreasing maximum temperature difference shown in Figure 8 can be explained by the dynamic response due to thermal inertia at a constant feed gas temperature during power ramping. With higher concentrations of reactive species in the feed gases, the maximum temperature difference increases again, but without exceeding the specified limit (Table 1). Once power ramping is initiated, the FU changes rapidly (electrical phenomena are modeled such that these occur instantaneously [83]). In (semi-)steady state conditions, the FU reaches 71.5% (Table 2). The pressure of fluid entering the cathode and anode are kept constant, but could in principle be controlled. Here, the pressure difference between cathode and anode channels is kept <0.1 bar (Table 2).

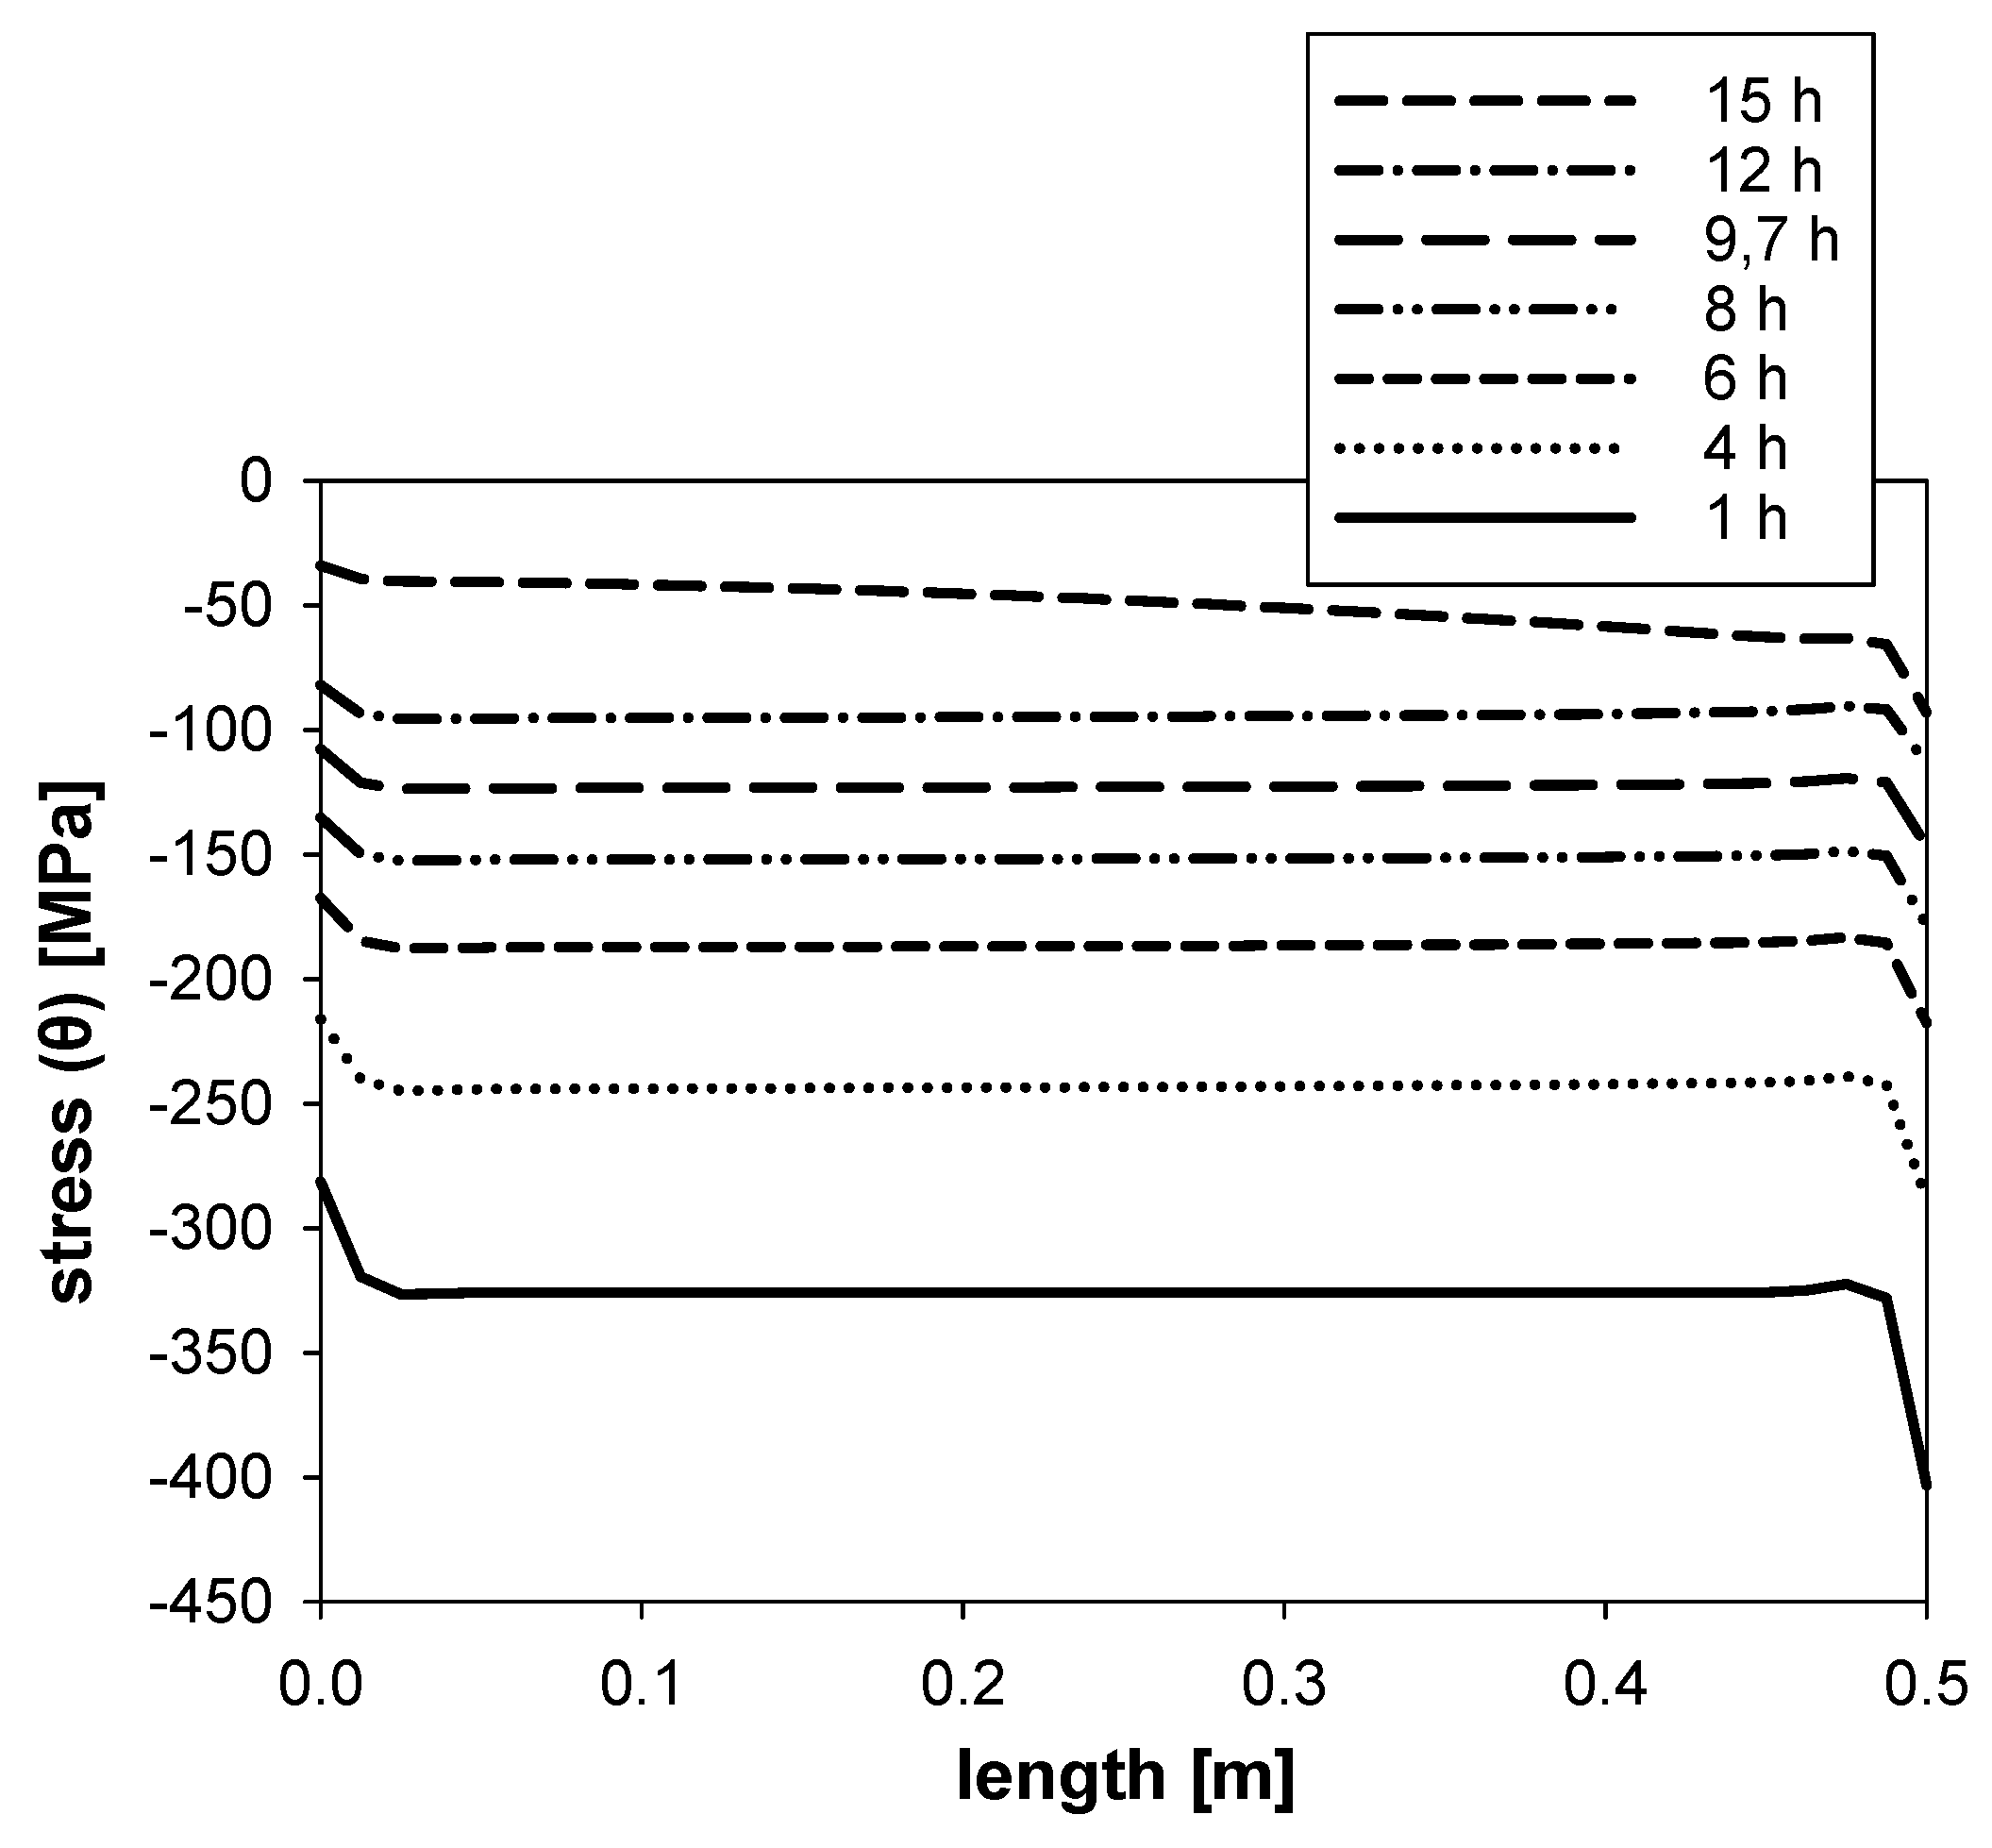
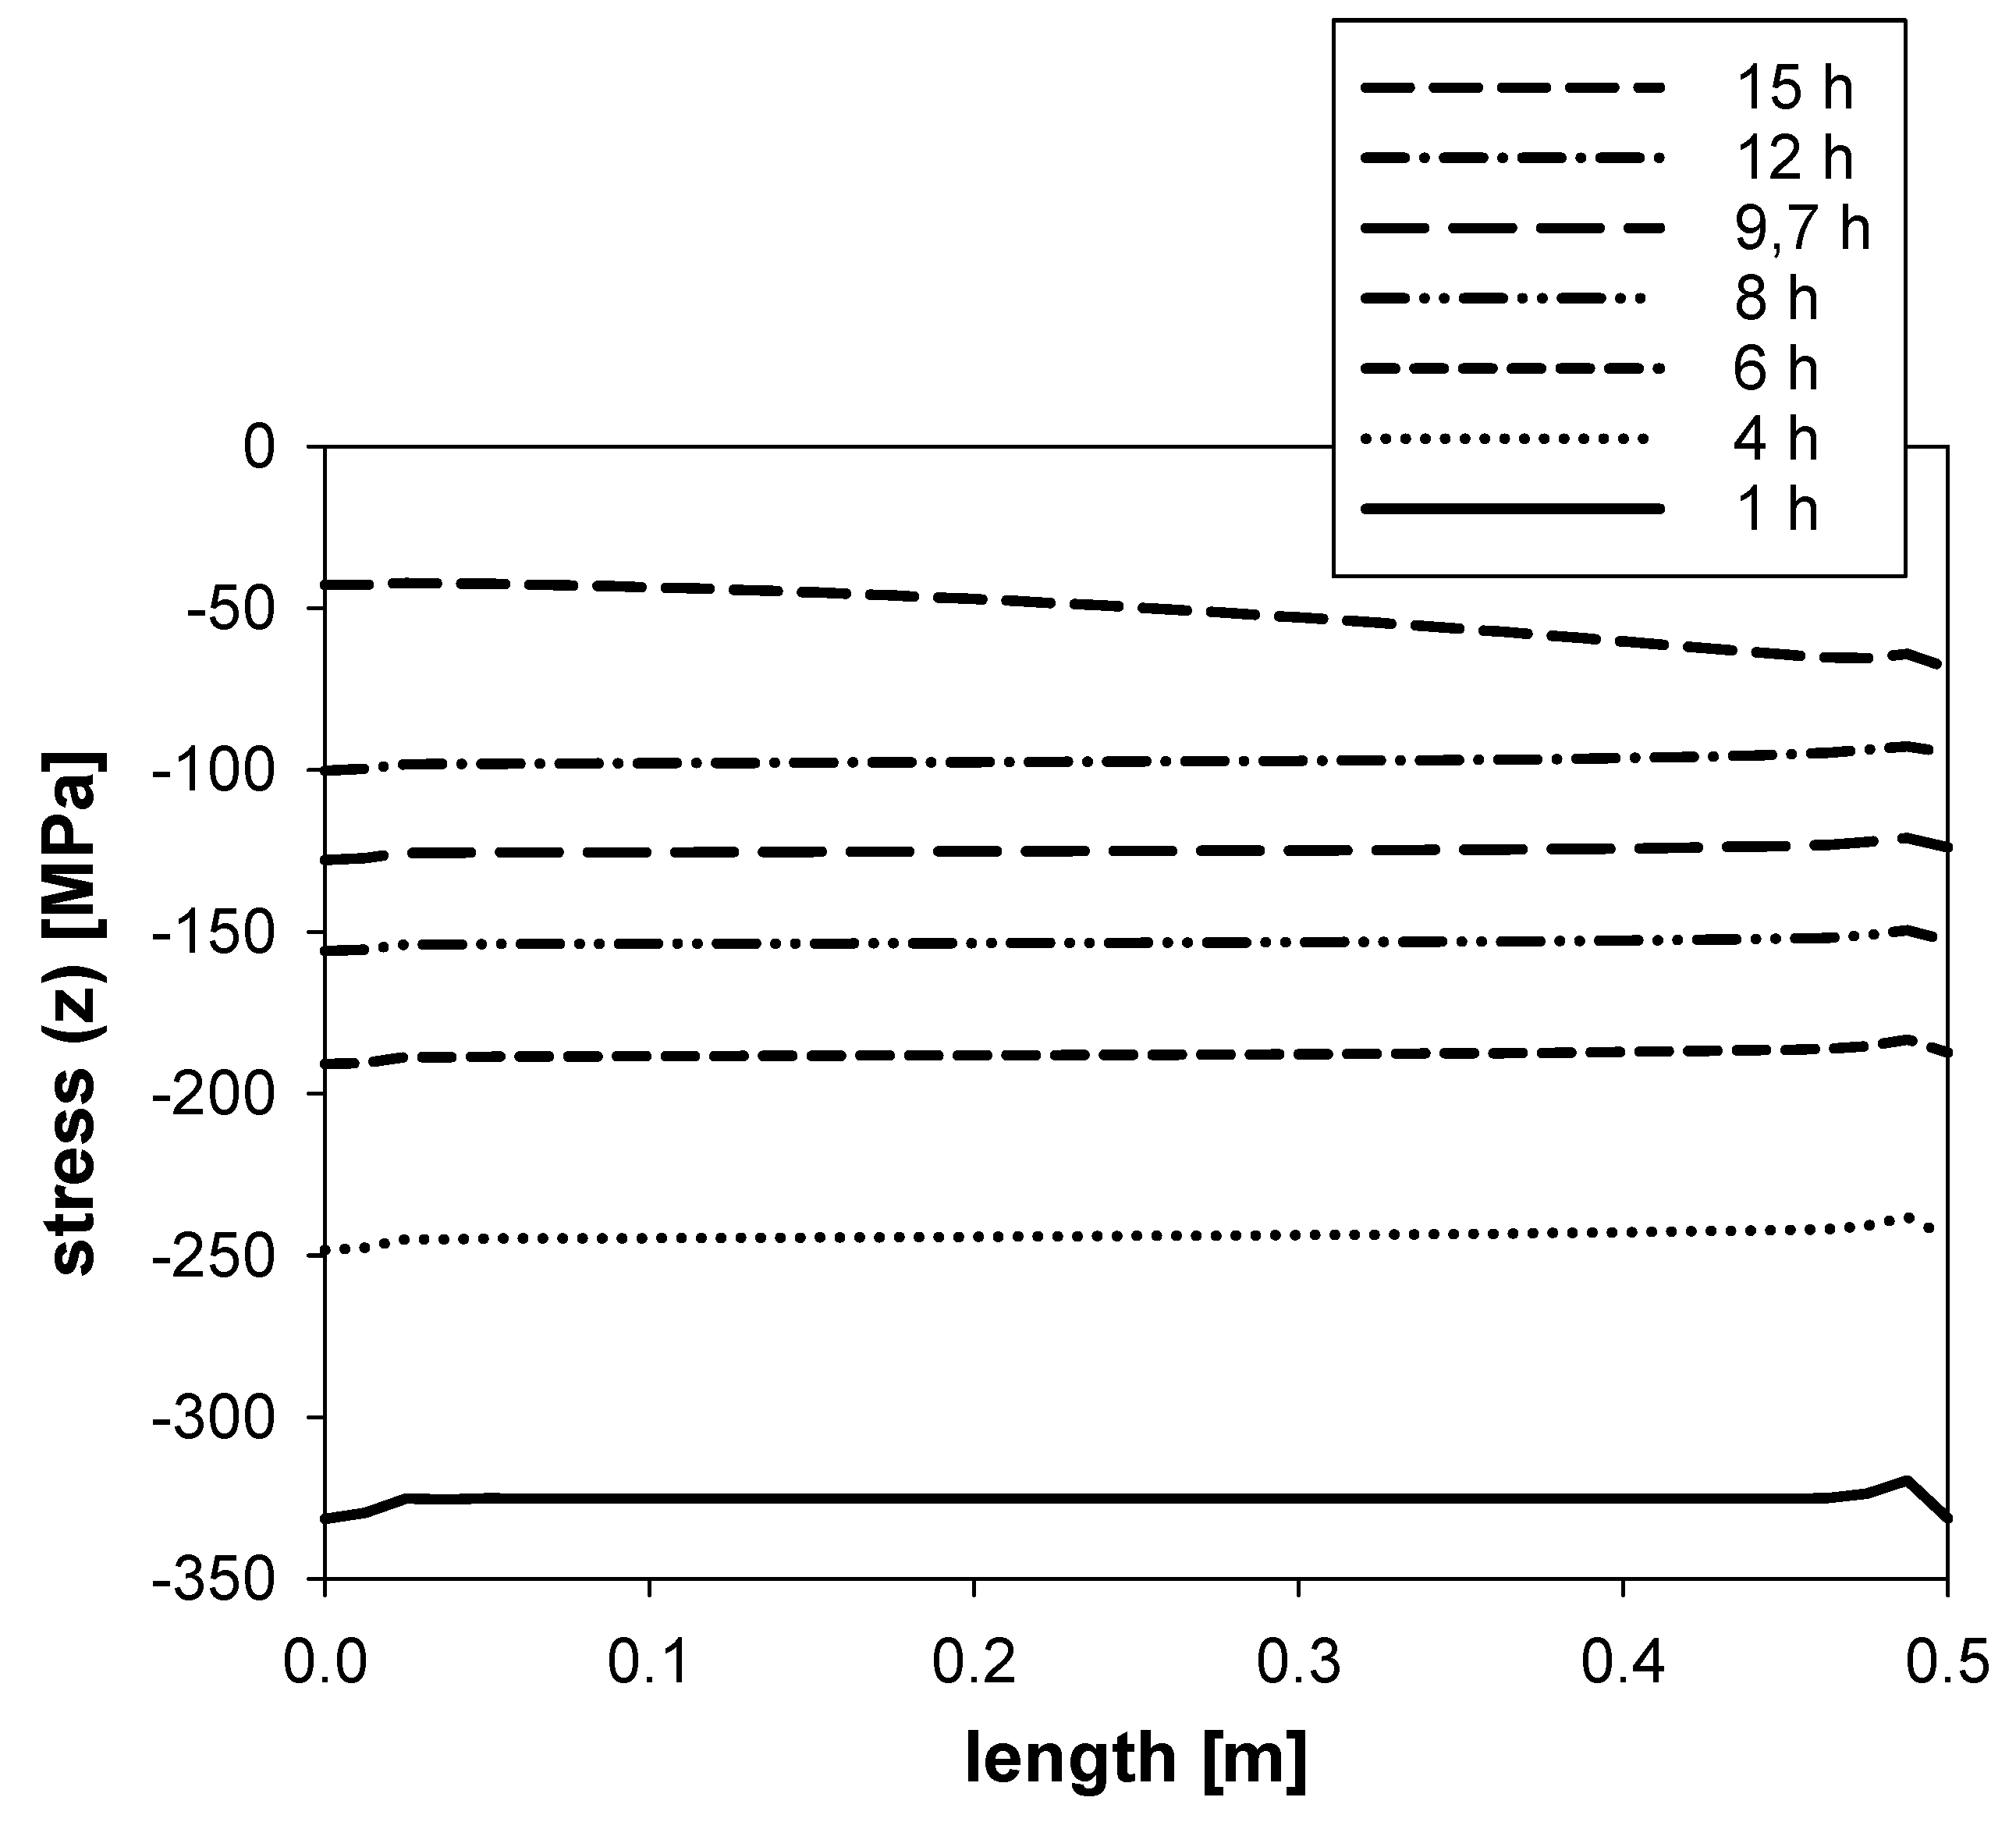
4.4. Stress Distributions and Displacements

Changes in the stresses occur primarily as a result of thermo-elasticity, in other words, any changes that make the force term in the Navier equations larger. Figure 10, Figure 11 and Figure 12 show the stress distributions for the electrolyte in axial direction in the r-, θ - and z-coordinate, respectively. The profiles represent snapshots at different times of the start-up procedure, starting at ambient and ending at design operation conditions. The stresses decrease with progress in the start-up process because the force term in the equation set describing thermo-mechanics decreases, or more specifically the difference between sintering temperature (manufacturing) and operation temperature, gets smaller. From the two electrode and the electrolyte materials, the largest stresses occur in the latter because of a higher value for the Young’s modulus compared to those of the electrodes. As shown in Table 3, the Young’s modulus for the electrolyte and anode are modeled as a function of temperature, the absolute maximum in the chosen design point is 159 GPa for the electrolyte and 44.2 GPa for the anode, respectively. On the other hand, the electrolyte’s thermal expansion coefficient is lower than those for the electrodes (Table 3), which also directly affects the magnitude of the force terms for thermo-mechanical stresses. However, the Young’s modulus dominates over the thermal expansion coefficient.
Figure 13 shows the displacement distribution in the r- and z-coordinate along the SOFC’s axial length for the electrolyte materials under (semi-)steady state conditions in the design point. Absolute values of displacements in the z-coordinate (maximum 1.27 mm) are more than 30 times higher than those for the r-coordinate (maximum 0.037 mm), which can be a problem from a stability point of view. The membrane layer of the SOFC in the present case is cathode-supported (Figure 3), while anode and electrolyte remain unconstrained. The latter parts can, therefore, relax some of the occurring stresses. As discussed previously, the cathode-support is considered in the boundary conditions for the thermo-mechanics, but sealants and their connection on the SOFC housing were not modeled.
Proper matching of physical properties is critical for all physically adjacent materials, including anodes and electrolyte as well as sealants, interconnects and current collectors. Materials in the membrane layer, however, need to meet functional behavior in addition to stability properties. Insufficient stability can lead to failure, for example due to physical disconnection, with potentially severe consequences on a system level. In Table 1 an upper leakage rate limit in the SOFC is specified. Any leakage can lead to a loss of performance, but possibly more critically, it can also pose a potential safety risk if high-temperature combustible gases accumulate outside the designated space over time, which may not be (easily) detectable. In physical systems, a perfect seal is difficult to achieve. The extent of the shift depends on the temperature and other parameters; every temperature gradient leads to a spatial gradient in the materials. Therefore, proper instrumentation for performance monitoring is critical.

5. Conclusions and Final Remarks

From a practical point of view, the number of conditions that need to be controlled during start-up is relatively extensive, resulting in a complex start-up procedure for the SOFC system. Auxiliary equipment is needed and a further cost factor is the requirement of safety gas considering the total start-up time.
Hydrogen is perhaps the most benign fuel for SOFC in terms of long-term stability. Other fuels such as carbon-containing fuels are more challenging, among others because of the more complex reaction chemistry involved, also with detrimental characteristics such as coke formation. Moreover, using natural gas as feedstock requires additional equipment, such as pre-reformer. Additional requirements need to be considered for concepts comprising other complex sub-processes (for example for internal fuel production) to ensure proper performance and process control, as well as economical perspective.
Thermo-elastic stresses are a problem for SOFC during start-up and shutdown. To moderate stresses during operation at elevated temperatures any changes in values of physical properties or state variables leading to an increased force term of the Navier equations should be minimized. During start-up, the system’s temperature goes through a regime of relatively low temperatures for several hours, which lead to high thermo-mechanical stresses. In general, frequent start-up and shutdown cycles should be avoided for economic reasons due to relatively long time periods until reaching design operation conditions, as well as higher risk of failure. Hence, for (thermal) systems comprising delicate process components and parts, transients (start-up and shutdown in particular) need to be considered with a view to thermo-mechanical and chemical stability, in addition to system performance under steady state conditions around the design point.
The application of a multi-physics modeling and simulation approach for the start-up procedure revealed further physical phenomena in the time domain which will be missed with a purely thermodynamic (lumped) approach or state-space models. Fuel cell-based systems are suitable to demonstrate the capabilities of this approach because they comprise thermal, electrochemical, chemical, and mechanical phenomena in a strongly interconnected fashion. Knowledge about the distribution of critical state variables occurring in the system over time can provide useful information for materials scientists as well as systems- and control engineers. Some physical input properties were hard to find, in particular for those having a dependency on state variables, such as temperature.
Potential avenues from this work include the simulation of fuels other than pure hydrogen, which would introduce further constraints. Other geometries than tubular may be modeled and analyzed. Furthermore, the start-up procedure was developed manually through a trial-and-error approach. The start-up procedure could be formulated as a PDE-constrained optimization problem (perhaps after simplifications of the system model). Control strategies and controller designs may be developed for the entire range of interest, also including start-up and shutdown of the system, for example based on non-linear model predictive control. Physics-based models represent important building blocks for concepts, such as digital twins [84].
Overall, engineering aspects should be taken into account, which make further testing of full-scale systems under realistic conditions indispensable to obtain a better general understanding of the system’s dynamics.

Author Contributions

Both authors contributed in all parts. All authors have read and agreed to the published version of the manuscript.

Funding

Please see acknowledgements.

Acknowledgments

Christoph Stiller is gratefully acknowledged for providing the original SOFC performance model code. VVK acknowledges support from the Russian Science Foundation (grant 17-79-30071). KEC acknowledges financial support from NTNU. We thank the editors and anonymous reviewers who made it possible to improve the original manuscript.

Conflicts of Interest

None.

List of symbols

Aarea [m 2 ]
aactivity [-]
Cgas concentration [mol/m 3 ]
c p heat capacity [J/(mol K)]
EYoung’s modulus [Pa]
E Gibbs potential [V]
FFaraday constant [C/mol], force [kg/(m s 2 )]
F U fuel utilization [-]
henthalpy [J/mol]
h c heat transfer coefficient [W/(m 2 K)]
icurrent density [A/m 2 ]
Icurrent [A]
jindex for anode, cathode, electrolyte [-]
Llength [m]
L H V lower heating value [J/mol]
m ˙ mass flow [kg/s]
n ˙ mole flow [mol/s]
ppartial pressure [Pa]
Ppower [W]
Runiversal gas constant [J/(mol K)], ohmic resistance [ Ω ]
rradius, spatial distribution variable in radial direction [m]
r ˙ reaction rate [mol/s]
ttime [s, h]
udisplacement [m]
vfluid velocity [m/s]
Vvoltage [V]
Ttemperature [K]
T ˜ difference between operation and sintering temperature [K]
znumber of electrons [-], spatial distribution variable in axial direction [m]
α thermal expansion coefficient [1/K]
β constant for Butler-Volmer equation [-], thermo-mechanical coefficient [Pa/K]
γ heat capacity ratio [-]
ε strain [-]
η overpotential [-], efficiency [-]
λ thermal conductivity [W/(K m)], Lamé coefficient [Pa]
μ Lamé coefficient [Pa]
ρ density [kg/m 3 ]
ν Poisson ratio [-]
σ stress [Pa]
τ shear stress [Pa]

List of subscripts

a c t activation overpotential losses
c o n concentration polarisation loss
e l electrical
fforward reaction
ggaseous
ichemial species
O C open circuit
o h m ohmic loss
o x i oxidation
rreverse reaction, r-coordinate
r e d reduction
ssolid
s a f e safety gas
T P B triple-phase boundary
zspatial z-direction
θ spatial θ -direction

List of superscripts

a n anode
c a cathode

List of abbreviations

ACalternating current
CVcontrolled variable(s)
DCdirect current
DOFdegree(s) of freedom
FDfinite difference
FUfuel utilization
MVmanipulated variable(s)
PDAIEpartial differential algebraic integral equation(s)
SEsystems engineering
SOFCsolid oxide fuel cell(s)
TPBtriple-phase boundary

References

  1. Adams, T., II; Nease, J.; Tucker, D.; Barton, P. Energy conversion with solid oxide fuel cell systems: A review of concepts and outlooks for the short- and long-term. Ind. Eng. Chem. Res. 2013, 52, 3089–3111. [Google Scholar] [CrossRef]
  2. Braun, R.; Klein, S.; Reindl, D. Evaluation of system configurations for solid oxide fuel cell-based micro-combined heat and power generators in residential applications. J. Power Sources 2006, 158, 1290–1305. [Google Scholar] [CrossRef]
  3. Edwards, P.; Kuznetsov, V.; David, W.; Brandon, N. Hydrogen and fuel cells: Towards a sustainable energy future. Energy Policy 2008, 36, 4356–4362. [Google Scholar] [CrossRef]
  4. O’Hayre, R.; Cha, S.; Colella, W.; Prinz, F. Fuel Cell Fundamentals; John Wiley & Sons: Hoboken, NJ, USA, 2016. [Google Scholar]
  5. Lawlor, V.; Griesser, S.; Buchinger, G.; Olabi, A.; Cordiner, S.; Meissner, D. Review of the micro-tubular solid oxide fuel cell. part I. stack design issues and research activities. J. Power Sources 2009, 193, 387–399. [Google Scholar] [CrossRef]
  6. Choudhury, A.; Chandra, H.; Arora, A. Application of solid oxide fuel cell technology for power generation—A review. Renew. Sustain. Energy Rev. 2013, 20, 430–442. [Google Scholar] [CrossRef]
  7. Stambouli, A.; Traversa, E. Solid oxide fuel cells (sofcs): A review of an environmentally clean and efficient source of energy. Renew. Sustain. Energy Rev. 2002, 6, 433–455. [Google Scholar] [CrossRef]
  8. Zhang, X.; Chan, S.; Li, G.; Ho, H.; Li, J.; Feng, Z. A review of integration strategies for solid oxide fuel cells. J. Power Sources 2010, 195, 685–702. [Google Scholar] [CrossRef]
  9. Cavalli, A.; Aravind, P. Effect of selected representative biomass gasification tar compounds on ni-gdc solid oxide fuel cells. Int. J. Hydrog. Energy 2021, 46, 21124–21135. [Google Scholar] [CrossRef]
  10. Jacobson, A. Materials for solid oxide fuel cells. Chem. Mater. 2010, 22, 660–674. [Google Scholar] [CrossRef]
  11. Kuramoto, K.; Hosokai, S.; Matsuoka, K.; Ishiyama, T.; Kishimoto, H.; Yamaji, K. Degradation behaviors of sofc due to chemical interaction between ni-ysz anode and trace gaseous impurities in coal syngas. Fuel Process. Technol. 2017, 160, 8–18. [Google Scholar] [CrossRef]
  12. Lanzini, A.; Ferrero, D.; Papurello, D.; Santarelli, M. Reporting degradation from different fuel contaminants in ni-anode sofcs. Fuel Cells 2017, 17, 423–433. [Google Scholar] [CrossRef]
  13. Martinez, A.; Gerdes, K.; Gemmen, R.; Poston, J. Thermodynamic analysis of interactions between ni-based solid oxide fuel cells (sofc) anodes and trace species in a survey of coal syngas. J. Power Sources 2010, 195, 5206–5212. [Google Scholar] [CrossRef]
  14. Wang, Y.; Li, W.; Ma, L.; Li, W.; Liu, X. Degradation of solid oxide electrolysis cells: Phenomena, mechanisms, and emerging mitigation strategies—A review. J. Mater. Sci. Technol. 2020, 55, 35–55. [Google Scholar] [CrossRef]
  15. Peksen, M. Numerical thermomechanical modelling of solid oxide fuel cells. Prog. Energy Combust. Sci. 2015, 48, 1–20. [Google Scholar] [CrossRef]
  16. Timurkutluk, B.; Mat, M. A performance prediction tool for solid oxide fuel cells after single redox cycle. Fuel Cells 2015, 15, 71–89. [Google Scholar] [CrossRef]
  17. Xiang, Y.; Da, Y.; Zhong, Z.; Shikazono, N.; Jiao, Z. Thermo-mechanical stress analyses of solid oxide fuel cell anode based on three-dimensional microstructure reconstruction. Int. J. Hydrog. Energy 2020, 45, 19791–19800. [Google Scholar] [CrossRef]
  18. Chen, M.-H.; Jiang, T. The analyses of the start-up process of a planar, anode-supported solid oxide fuel cell using three different start-up procedures. J. Power Sources 2012, 220, 331–341. [Google Scholar] [CrossRef]
  19. Zheng, K.; Kuang, Y.; Rao, Z.; Shen, S. Numerical study on the effect of bi-polar plate geometry in the sofc heating-up process. J. Renew. Sustain. Energy 2019, 11, 014301. [Google Scholar] [CrossRef]
  20. Halinen, M.; Thomann, O.; Kiviaho, J. Experimental study of sofc system heat-up without safety gases. Int. J. Hydrog. Energy 2014, 39, 552–561. [Google Scholar] [CrossRef]
  21. Choudhary, T.; Sanjay. Computational analysis of ir-sofc: Transient, thermal stress, carbon deposition and flow dependency. Int. J. Hydrog. Energy 2016, 41, 10212–10227. [Google Scholar] [CrossRef]
  22. Ki, J.; Kim, D. Computational model to predict thermal dynamics of planar solid oxide fuel cell stack during start-up process. J. Power Sources 2010, 195, 3186–3200. [Google Scholar] [CrossRef]
  23. Al-Masri, A.; Peksen, M.; Blum, L.; Stolten, D. A 3d cfd model for predicting the temperature distribution in a full scale apu sofc short stack under transient operating conditions. Appl. Energy 2014, 135, 539–547. [Google Scholar] [CrossRef]
  24. Peksen, M.; Al-Masri, A.; Blum, L.; Stolten, D. 3D transient thermomechanical behaviour of a full scale sofc short stack. Int. J. Hydrog. Energy 2013, 38, 4099–4107. [Google Scholar] [CrossRef]
  25. Peksen, M. Safe heating-up of a full scale sofc system using 3d multiphysics modelling optimisation. Int. J. Hydrog. Energy 2018, 43, 354–362. [Google Scholar] [CrossRef]
  26. Eapen, D.E.; Suresh, R.; Patil, S.; Rengaswamy, R. A systems engineering perspective on electrochemical energy technologies and a framework for application driven choice of technology. Renew. Sustain. Energy Rev. 2021, 147, 111165. [Google Scholar] [CrossRef]
  27. Oh, S.-R.; Sun, J.; Dobbs, H.; King, J. Model predictive control for power and thermal management of an integrated solid oxide fuel cell and turbocharger system. IEEE Trans. Control Syst. Technol. 2014, 22, 911–920. [Google Scholar]
  28. Fergus, J.W. Solid Oxide Fuel Cells; John Wiley & Sons, Ltd.: Hoboken, NJ, USA, 2012; Chapter 14; pp. 671–700. [Google Scholar]
  29. Gellings, P.J.; Bouwmeester, H.J. Handbook of Solid State Electrochemistry; CRC: Boca Raton, FL, USA, 1997. [Google Scholar]
  30. Li, P.-W.; Chyu, M.K. Simulation of the chemical/electrochemical reactions and heat/mass transfer for a tubular sofc in a stack. J. Power Sources 2003, 124, 487–498. [Google Scholar] [CrossRef]
  31. Colombo, K.W.E.; Kharton, V.V.; Berto, F.; Paltrinieri, N. Mathematical modeling and simulation of hydrogen-fueled solid oxide fuel cell system for micro-grid applications—Effect of failure and degradation on transient performance. Energy 2020, 202, 117752. [Google Scholar] [CrossRef]
  32. Sammes, N.; Du, Y.; Bove, R. Design and fabrication of a 100w anode supported micro-tubular sofc stack. J. Power Sources 2005, 145, 428–434. [Google Scholar] [CrossRef]
  33. Li, G.; Gou, Y.; Qiao, J.; Sun, W.; Wang, Z.; Sun, K. Recent progress of tubular solid oxide fuel cell: From materials to applications. J. Power Sources 2020, 477, 228693. [Google Scholar] [CrossRef]
  34. Ho, T.X.; Kosinski, P.; Hoffmann, A.C.; Vik, A. Modeling of transport, chemical and electrochemical phenomena in a cathode-supported sofc. Chem. Eng. Sci. 2009, 64, 3000–3009. [Google Scholar] [CrossRef]
  35. Chelmehsara, M.E.; Mahmoudimehr, J. Techno-economic comparison of anode-supported, cathode-supported, and electrolyte-supported sofcs. Int. J. Hydrog. Energy 2018, 43, 15521–15530. [Google Scholar] [CrossRef]
  36. Ilbas, M.; Kumuk, B. Numerical modelling of a cathode-supported solid oxide fuel cell (sofc) in comparison with an electrolyte-supported model. J. Energy Inst. 2019, 92, 682–692. [Google Scholar] [CrossRef]
  37. Huang, K.; Singhal, S. Cathode-supported tubular solid oxide fuel cell technology: A critical review. J. Power Sources 2013, 237, 84–97. [Google Scholar] [CrossRef]
  38. Mueller, F.; Jabbari, F.; Brouwer, J. On the intrinsic transient capability and limitations of solid oxide fuel cell systems. J. Power Sources 2009, 187, 452–460. [Google Scholar] [CrossRef] [Green Version]
  39. NETL. Fuel Cell Handbook; US Department of Energy, National Energy Technology Laboratory: Morgantown, WV, USA, November 2004.
  40. Vielstich, W.; Lamm, A.; Gasteiger, H.A. (Eds.) Handbook of Fuel Cells; Wiley: Hoboken, NJ, USA, 2009; Volume 5. [Google Scholar]
  41. Vielstich, W.; Lamm, A.; Gasteiger, H.A. (Eds.) Handbook of Fuel Cells; Wiley: Hoboken, NJ, USA, 2009; Volume 6. [Google Scholar]
  42. Wu, X.; Gao, D. Optimal robust control strategy of a solid oxide fuel cell system. J. Power Sources 2018, 374, 225–236. [Google Scholar] [CrossRef]
  43. Kim-Lohsoontorn, P.; Priyakorn, F.; Wetwatana, U.; Laosiripojana, N. Modelling of a tubular solid oxide fuel cell with different designs of indirect internal reformer. J. Energy Chem. 2014, 23, 251–263. [Google Scholar] [CrossRef]
  44. Spivey, B.; Edgar, T. Dynamic modeling, simulation, and mimo predictive control of a tubular solid oxide fuel cell. J. Process. Control 2012, 22, 1502–1520. [Google Scholar] [CrossRef]
  45. Jiang, J.; Li, X.; Li, J. Modeling and model-based analysis of a solid oxide fuel cell thermal-electrical management system with an air bypass valve. Electrochim. Acta 2015, 177, 250–263. [Google Scholar] [CrossRef]
  46. Chen, J.; Song, W.; Xu, D. Thermal management in catalytic heat-recirculating micro-combustors: A computational fluid dynamics study. Appl. Therm. Eng. 2019, 160, 114073. [Google Scholar] [CrossRef]
  47. Karagiannidis, S.; Mantzaras, J.; Jackson, G.; Boulouchos, K. Hetero-/homogeneous combustion and stability maps in methane-fueled catalytic microreactors. Proc. Combust. Inst. 2007, 31, 3309–3317. [Google Scholar] [CrossRef]
  48. Li, Q.; Wang, J.; Meng, L.; Li, J.; Guo, Z. Cfd study on stability limits of hydrogen/air premixed flames in planar micro-combustors with catalytic walls. Appl. Therm. Eng. 2017, 121, 325–335. [Google Scholar] [CrossRef]
  49. Shantanu, M.; Reddy, V.M.; Karmakar, S. Experimental and numerical studies on heat recirculated high intensity meso-scale combustor for mini gas turbine applications. Energy Convers. Manag. 2018, 176, 324–333. [Google Scholar] [CrossRef]
  50. Wang, Y.; Zhou, Z.; Yang, W.; Zhou, J.; Liu, J.; Wang, Z.; Cen, K. Combustion of hydrogen-air in micro combustors with catalytic pt layer. Energy Convers. Manag. 2010, 51, 1127–1133. [Google Scholar] [CrossRef]
  51. Zhou, J.; Wang, Y.; Yang, W.; Liu, J.; Wang, Z.; Cen, K. Combustion of hydrogen-air in catalytic micro-combustors made of different material. Int. J. Hydrog. Energy 2009, 34, 3535–3545. [Google Scholar] [CrossRef]
  52. Zhang, X.; Keramati, H.; Arie, M.; Singer, F.; Tiwari, R.; Shooshtari, A.; Ohadi, M. Recent developments in high temperature heat exchangers: A review. Front. Heat Mass Transf. 2018, 11. [Google Scholar] [CrossRef] [Green Version]
  53. Fardadi, M.; McLarty, D.; Jabbari, F. Actuator limitations in spatial temperature control of sofc. J. Fuel Cell Sci. Technol. 2013, 10, 031005. [Google Scholar] [CrossRef]
  54. Hering, M.; Wahl, S.; Meise, R. Characteristic blower map modeling for volume flow rate estimation in solid oxide fuel cell systems. Flow Meas. Instrum. 2018, 64, 116–125. [Google Scholar] [CrossRef]
  55. Cho, J.-H.; Yu, S.-S.; Kim, M.-Y.; Kang, S.-G.; Lee, Y.-D.; Ahn, K.-Y.; Ji, H.-J. Dynamic modeling and simulation of hydrogen supply capacity from a metal hydride tank. Int. J. Hydrog. Energy 2013, 38, 8813–8828. [Google Scholar] [CrossRef]
  56. Jiang, J.; Shen, T.; Deng, Z.; Fu, X.; Li, J.; Li, X. High efficiency thermoelectric cooperative control of a stand-alone solid oxide fuel cell system with an air bypass valve. Energy 2018, 152, 13–26. [Google Scholar] [CrossRef]
  57. Sorrentino, M.; Pianese, C. Model-based development of low-level control strategies for transient operation of solid oxide fuel cell systems. J. Power Sources 2011, 196, 9036–9045. [Google Scholar] [CrossRef]
  58. Sharifzadeh, M. Integration of process design and control: A review. Chem. Eng. Res. Des. 2013, 91, 2515–2549. [Google Scholar] [CrossRef] [Green Version]
  59. Stiller, C.; Thorud, B.; Bolland, O.; Kandepu, R.; Imsland, L. Control strategy for a solid oxide fuel cell and gas turbine hybrid system. J. Power Sources 2006, 158, 303–315. [Google Scholar] [CrossRef]
  60. Stiller, C. Design, Operation and Control Modelling of SOFC/GT Hybrid Systems. Ph.D. Thesis, Norwegian University of Science and Technology (NTNU), Trondheim, Norway, 2006. [Google Scholar]
  61. Colombo, K.E.; Kharton, V.; Berto, F.; Paltrinieri, N. Mathematical multi-physics modeling and simulation of a solid oxide fuel cell unit for thermo-mechanical stress analyses. J. Electrochem. Soc. 2020, 167, 044514. [Google Scholar] [CrossRef]
  62. Colombo, K.E.; Kharton, V.; Berto, F.; Paltrinieri, N. Transient simulation of failures during start-up and power cut of a solid oxide fuel cell system using multiphysics modeling. Mater. Des. Process. Commun. 2020, e177. [Google Scholar]
  63. Bird, R.B.; Stewart, W.E.; Lightfoot, E.N. Transport Phenomena; Wiley: Hoboken, NJ, USA, 2006. [Google Scholar]
  64. Hetnarski, R.B.; Eslami, M.R. Thermal Stresses-Advanced Theory and Applications; Springer: Berlin/Heidelberg, Germany, 2019. [Google Scholar]
  65. Sadd, M. Elasticity, 3rd ed.; Academic Press: Boston, MA, USA, 2009; p. iii. [Google Scholar]
  66. Dwivedi, S. Solid oxide fuel cell: Materials for anode, cathode and electrolyte. Int. J. Hydrog. Energy 2020, 45, 23988–24013. [Google Scholar] [CrossRef]
  67. Sreedhar, I.; Agarwal, B.; Goyal, P.; Singh, S.A. Recent advances in material and performance aspects of solid oxide fuel cells. J. Electroanal. Chem. 2019, 848, 113315. [Google Scholar] [CrossRef]
  68. Hildenbrand, N.; Boukamp, B.; Nammensma, P.; Blank, D. Improved cathode/electrolyte interface of sofc. Solid State Ionics 2011, 192, 12–15. [Google Scholar] [CrossRef]
  69. Greco, F.; Frandsen, H.; Nakajo, A.; Madsen, M.F.; Herle, J.V. Modelling the impact of creep on the probability of failure of a solid oxide fuel cell stack. J. Eur. Ceram. Soc. 2014, 34, 2695–2704. [Google Scholar] [CrossRef]
  70. Giraud, S.; Canel, J. Young’s modulus of some sofcs materials as a function of temperature. J. Eur. Ceram. Soc. 2008, 28, 77–83. [Google Scholar] [CrossRef]
  71. Selçuk, A.; Merere, G.; Atkinson, A. The influence of electrodes on the strength of planar zirconia solid oxide fuel cells. J. Mater. Sci. 2001, 36, 1173–1182. [Google Scholar] [CrossRef]
  72. Kennouche, D.; Fang, Q.; Blum, L.; Stolten, D. Analysis of the cathode electrical contact in sofc stacks. J. Electrochem. Soc. 2018, 165, F677–F683. [Google Scholar] [CrossRef] [Green Version]
  73. Zhang, Y.-C.; Lu, M.-J.; Jiang, W.; Tu, S.-T.; Zhang, X.-C. Effect of the geometrical size on time dependent failure probability of the solid oxide fuel cell. Int. J. Hydrog. Energy 2019, 44, 11033–11046. [Google Scholar] [CrossRef]
  74. Boldrin, P.; Ruiz-Trejo, E.; Mermelstein, J.; Menendez, J.B.; Reina, T.R.; Brandon, N. Strategies for carbon and sulfur tolerant solid oxide fuel cell materials, incorporating lessons from heterogeneous catalysis. Chem. Rev. 2016, 116, 13633–13684. [Google Scholar] [CrossRef] [PubMed]
  75. Haga, K.; Adachi, S.; Shiratori, Y.; Itoh, K.; Sasaki, K. Poisoning of sofc anodes by various fuel impurities. Solid State Ionics 2008, 179, 1427–1431. [Google Scholar] [CrossRef]
  76. Cheng, Z.; Zha, S.; Liu, M. Influence of cell voltage and current on sulfur poisoning behavior of solid oxide fuel cells. J. Power Sources 2007, 172, 688–693. [Google Scholar] [CrossRef]
  77. Hanasaki, M.; Uryu, C.; Daio, T.; Kawabata, T.; Tachikawa, Y.; Lyth, S.; Shiratori, Y.; Taniguchi, S.; Sasaki, K. Sofc durability against standby and shutdown cycling. J. Electrochem. Soc. 2014, 161, F850–F860. [Google Scholar] [CrossRef]
  78. Process Systems Enterprise (PSE), the Advanced Process Modelling Company. Available online: https://www.psenterprise.com/ (accessed on 22 June 2021).
  79. DataFit; Version 8.2.79; Oakdale Engineering: Oakdale, PA, USA, 2006.
  80. Pianko-Oprych, P.; Zinko, T.; Jaworski, Z. Modeling of thermal stresses in a microtubular solid oxide fuel cell stack. J. Power Sources 2015, 300, 10–23. [Google Scholar] [CrossRef]
  81. Pianko-Oprych, P.; Zinko, T.; Jaworski, Z. Simulation of thermal stresses for new designs of microtubular solid oxide fuel cell stack. Int. J. Hydrog. Energy 2015, 40, 14584–14595. [Google Scholar] [CrossRef] [Green Version]
  82. Colombo, K.W.; Kharton, V.V.; Berto, F.; Paltrinieri, N. Transient system-level performance and thermo-mechanical stress analysis of a solid oxide fuel cell-based power generation plant with a multi-physics approach. Comput. Chem. Eng. 2020, 140, 106972. [Google Scholar] [CrossRef]
  83. Schnadt, J.; Bruhwiler, P.; Patthey, L.; O’Shea, J.; Sodergren, S.; Odelius, M.; Ahuja, R.; Karis, O.; Bassler, M.; Persson, P.; et al. Experimental evidence for sub-3-fs charge transfer from an aromatic adsorbate to a semiconductor. Nature 2002, 418, 620–623. [Google Scholar] [CrossRef] [PubMed]
  84. Kang, J.-L.; Wang, C.-C.; Wong, D.S.-H.; Jang, S.-S.; Wang, C.-H. Digital twin model and dynamic operation for a plant-scale solid oxide fuel cell system. J. Taiwan Inst. Chem. Eng. 2021, 118, 60–67. [Google Scholar] [CrossRef]
Figure 1. Basic SOFC system design with auxiliary equipment for start-up and shutdown (in blue).
Crystals 11 00732 g001
Figure 2. Principle of a solid oxide fuel cell.
Crystals 11 00732 g002
Figure 3. SOFC design.
Crystals 11 00732 g003
Figure 4. Link between the thermo-electrochemical-chemical performance model and thermo-mechanical stress model.
Crystals 11 00732 g004
Figure 5. Current density and solid temperature under normal operation conditions.
Crystals 11 00732 g005
Figure 6. Ramping of fluid temperatures and power.
Crystals 11 00732 g006
Figure 7. Ramping of fluid compositions.
Crystals 11 00732 g007
Figure 8. Minimum, mean, and maximum spatial temperature in the solid during start-up.
Crystals 11 00732 g008
Figure 9. Transient temperature gradient and FU during start-up.
Crystals 11 00732 g009
Figure 10. Stresses in electrolyte material for r-coordinate.
Crystals 11 00732 g010
Figure 11. Stresses in electrolyte material for θ -coordinate.
Crystals 11 00732 g011
Figure 12. Stresses in electrolyte material for z-coordinate.
Crystals 11 00732 g012
Figure 13. Displacements in electrolyte in design point.
Crystals 11 00732 g013
Table 1. Design and operation constraints.
UnitConstraintPotential EffectLimit
systemheat lossperformance lossper design
SOFCpower densityincreasing currents lead to higher concentration polarization and faster cell degradation80–90% [39,40,41]
SOFCmax. leakage rate (interconnects)performance loss, failure due to leakage0.1% [39,40,41]
SOFCmin. temperatureperformance loss, and failure due to thermo-mechanical stresses900 K [39,40,41,42]
SOFCmax. temperatureperformance loss and failure due to thermo-mechanical stresses and chemical interaction1300 K [39,40,41]
SOFCmax. difference in thermal expansion coefficientsperformance loss and failure due to thermo-mechanical stresses10–17% [39,40,41]
SOFCtransient temperature gradientsthermo-mechanical stresses20 K/cm [43,44]
SOFCsteady state temperature differences in axial direction of SOFCthermo-mechanical stresses150 K [39,40,41]
SOFCmin. FUthermo-mechanical stresses40% [39,40,41]
SOFCmax. FUfuel starvation, efficiency loss90% [39,40,41]
SOFCmax. total pressure difference between fluid streamsmechanical stress3 bar [39,40,41]
combustorair excess ratioperformance loss, emissions, flame instability6–12 [45]
combustorresidence timeflame instability, blowout [46,47,48,49,50]
combustormax. temperaturemechanical stress1400 K [42,46,51]
pre-heatermax. temperatureloss of strength1300 K [52]
blowermax. volume flow, pressure, rotational speed [53,54]stress, flow instability, performance lossdefined by design
tankmax. pressure, discharge rate [55]mechanical stress
valvespeed, max. volume flow [56] defined by design
controller, actuatorspeed, accuracy [57]delay times, setpoint shift
sensoruncertainty, accuracydelay times, setpoint shift
Table 2. Set of CV and MV.
Controlled VariableValueManipulated VariableValue
electrical system power86.73 kWelectrical current131.1 A
mean solid temperature of SOFC1261 Kmolar flow of air (blower capacity)18 mol s 1
FU of SOFC71.5%molar flow of fuel to SOFC (fuel valve opening)1.15 mol s 1
pressure gradient across solid of SOFC<0.1 baruse of throttles (not shown in Figure 1)-
combustion outlet temperature-fuel mass flow to combustor (fuel valve opening)-
air temperature to SOFC-bypass ratio of air (not used here)-
driving force for chemical kinetics in SOFC-fuel composition (not used here)-
Table 3. Thermo-elastic input parameters.
ComponentMaterialE [GPa] ν [-] α [10 6 · K 1 ]
anode (reduced)Ni-3YSZf 2 (T) [69]0.387 [69]12.6
electrolyte8YSZf 3 (T) [69]0.31 [69]10.9 [69]
cathodeLSM41 [70]0.28 [70]12 [71]
Table 4. Comparison of simulation results for electrolyte against literature data.
ParameterThis StudyRef. [80,81]
approximate max. abs. displacement (z) [mm]1.31.34
approximate max. abs. displacement (r) [mm]0.040.5
approximate max. abs. axial stress [MPa]330265–583
Publisher’s Note: MDPI stays neutral with regard to jurisdictional claims in published maps and institutional affiliations.

