Article

The Beauty of Twist-Bend Nematic Phase: Fast Switching Domains, First Order Fréedericksz Transition and a Hierarchy of Structures

1
Department of Electronic and Electrical Engineering, Trinity College Dublin, The University of Dublin, Dublin 2, Ireland
2
School of Electronic & Electrical Engineering, Sungkyunkwan University, Suwon 440-746, Korea
3
Department of Chemistry, University of Hull, Hull HU6 7RX, UK
*
Author to whom correspondence should be addressed.
Crystals 2021, 11(6), 621; https://doi.org/10.3390/cryst11060621
Submission received: 29 April 2021 / Revised: 20 May 2021 / Accepted: 25 May 2021 / Published: 31 May 2021
(This article belongs to the Special Issue In Celebration of Noel A. Clark’s 80th Birthday)

Abstract

:
The twist-bend nematic phase (NTB) exhibits a complicated hierarchy of structures responsible for several intriguing properties presented here. These are: the observation of a fast electrooptic response, the exhibition of a large electroclinic effect, and the observation of an unusual pattern of the temperature dependence of birefringence of bent-shaped bimesogens in parallel-rubbed planar-aligned cells. These unusual effects inspired the use of highly sophisticated techniques that led to the discovery of the twist-bend nematic phase. Results of the optical retardation of a parallel-rubbed planar-aligned cell show that the ‘heliconical angle’ (the angle the local director makes with the optical axis) starts increasing in the high temperature N phase, it exhibits a jump at the N–NTB transition temperature and continues to increase in magnitude with a further reduction in temperature. The liquid crystalline parallel-rubbed planar-aligned and twist-aligned cells in this phase exhibit fascinating phenomena such as a demonstration of the beautiful stripes and dependence of their periodicity on temperature. The Fréedericksz transition in the NTB phase is found to be of the first order both in rubbed planar and homeotropic-aligned cells, in contrast to the second order transition exhibited by a conventional nematic phase. This transition shows a significant hysteresis as well as an abrupt change in the orientation of the director as a function of the applied electric field. Hierarchical structures are revealed using the technique of polymer templating the structure of the liquid crystalline phase of interest, and imaging of the resulting structure by scanning electron microscopy.

1. Introduction

Nematic liquid crystals are used ubiquitously in the multibillion display industry. Over the years, the device architecture and the materials have improved to the extent that the switching times of liquid crystals currently can be reduced to 1.0 ms or less [1] without the use of over-drive circuitry. This offers a reasonable speed of switching for most current display applications, including the future development of high-resolution fast displays based on the colour sequential display mode. Furthermore, nematic liquid crystal materials can be designed to approach an ideal dielectric. This is achieved by reducing its DC conductivity and dielectric loss for frequencies where the display will operate. The liquid crystalline nematic phase offers higher energy efficiency as it consumes extremely low levels of power when compared to other display technologies. Currently, the main area of improvement is to address the brightness of a display, such as in mobile phones. Their nematic liquid crystals (NLCs) are continually being replaced by organic light emitting diodes (OLEDs). Nevertheless, NLCs are still used in over 90% of the display market due to their higher energy efficiency, reliability, longevity, and the ease in manufacturing large size displays. The latter are used for displaying information at airports and other major public information centres, including their use in manufacturing large TV screens.
In addition to their applications in displays, the uses of liquid crystals in frequency tuned millimetre wave antennas, biological sensors and photonics offer promise for applications in an array of future technologies. Hence, it can safely be predicted that nematics shall underpin emerging technologies of the future. More generally, liquid crystals are ideal examples of self-organisation and self-assembly systems. In the nematic phase, the orientational order is present, the long-range positional order, however, is absent. Since the material is in a fluid state, it can be aligned easily and efficiently in liquid crystal cells. The alignment, if disturbed, returns to its initial state within a shorter time span.
The twist-bend nematic phase in which both the twist and the bend form a heliconical structure of a few nm pitch was discovered about a decade ago [2,3,4]. This phase was the fifth in the series of nematics discovered by the end of the year 2013. The other nematic phases discovered chronologically are cholesteric nematic [5], blue phase nematic [5], conventional nematic [6], biaxial nematic (lyotropic) [7] and the biaxial nematic thermotropic [8,9]. Whether ‘biaxial thermotropic nematic’ definitely exists in soft matter is somewhat controversial. Most experiments do show spontaneous biaxiality [8,9], but its magnitude is low and in some cases it is swamped by the limitations of experimental error. It shall be commented on later in the next paragraph. We also note that the sixth in the series of nematics, the ‘ferroelectric nematic’, was discovered by Clark et al. [10] in 2020. Furthermore, since the discovery of the twist-bend nematic phase was announced and established, reports of finding other new nematic phases continue unabatedly in the literature. Some of these nematics are: the splay nematic [11], splay-bend nematic [12] and helielectric nematic [13]. Discussion and the critical appraisal of these nematic phases are beyond the scope of this paper.
The work presented here refers to that arising from interactions between Dublin and Hull for an EU project on ‘Biaxial Nematic Device (BIND)’ commenced in 2007. The initial objective was to fabricate the prototype of a ‘fast switching device’ based on a large optical biaxiality in a thermotropic biaxial nematic phase. The material also needed to have a sufficiently large dielectric biaxiality for this to be practically useful in switching. Though we investigated several materials, we were rather frustrated with their outcome as the magnitude of the optical biaxiality observed was rather small in most materials that we studied [14]. While still engaged in the pursuit of a biaxial nematic, we observed a low temperature nematic phase in dicyanobiphenyl initially and later in specifically synthesised difluoroterphenyl dimers/bimesogens [15]. This phase was initially labelled as Nx, and it was found to be helical with a pitch << 100 nm, much lower than the wavelength of UV light [16,17]. The twist-bend nematic, NTB, was thus discovered [3,18] with a helical pitch on the nm scale. It was also independently discovered by Clark et al. [2] and by Luckhurst et al. [4] around the same time. The work has briefly been reviewed before [19].
In this paper, we discuss the fast switching domains in the NTB phase while clarifying the phenomenon of the origin of chirality in domains through electro-optic response investigations. We proceed to describe the Fréedericksz transition and show how this transition behaves differently in NTB than in a conventional nematic (N) phase. We demonstrate the first order nature of the transition for several different cell geometries. We proceed to discuss the hierarchy of structures formed in the NTB phase by scanning electron microscopy in particular.

2. Methods

The electro-optical measurements are made using the set-up as shown in Figure 1.
This set-up uses a Polariser (P) and an Analyser (A) of a polarising microscope in which P and A are crossed with each other. A Centronic OSD15-E Visible light Si photodiode is mounted in the camera port of the microscope, connected to a home-made current (I)/Voltage (V) converter, as shown in Figure 1. The signal from the photodiode is proportional to the light intensity transmitted through the crossed polarising system. The output is digitised by a data acquisition board (DAQ, National Instruments USB-6216) and transmitted to a PC. Analyses of the response signal from the sample are carried out by PC software to determine the amplitude and phase of the harmonics of the input waveform. The waveform applied is synthesised by the same DAQ board and, if necessary, amplified by a high-voltage amplifier based on APEX PA85 chip. The output from the DAQ (DC and different harmonics) is fed to an oscilloscope with 4 different channels for the visual observations of the response signal [16].
The first harmonic in the output is not allowed in a classical nematic phase due to its inversion symmetry n ≡ −n, where n is the orientational director [16] In the optical set-up, the output signal will contain the first harmonic of the input when a change in either birefringence or azimuthal angle depends on the sign of the applied voltage. For a classical nematic, with its head-tail equivalence, the dielectric coupling with the electric field is sign-invariant. The director should not deviate from the rubbing direction under the electric field applied normally to a parallel-rubbed planar-aligned cell. However, at the N–NX phase transition temperature, the signal for the fundamental frequency in the output is clearly discernible. This signal conceivably originates from a domain of the LC that lacks inversion symmetry and is chiral. Chirality seems to arise from the symmetry breaking at the phase transition temperature, otherwise there exists no plausible reason for the first harmonic signal in the output to be of finite amplitude. This observation at the time specifically attracted our attention since the constituent molecules of the material used were achiral. This phase confirmed by X-ray scattering was nematic [15], but it has properties different from a conventional one. Furthermore, we find that the ‘high temperature nematic phase’ has properties different from a conventional nematic phase, especially close to the N–Nx transition temperature. There are at least four reasons for this finding to be ground-breaking as it differed from those reported previously in the literature. These are: (i) the existence of a Nematic–Nematic transition, (ii) the low-temperature nematic phase has different physical properties than a conventional nematic phase, (iii) some of the properties of the high-temperature nematic phase are also different, and (iv) the low temperature nematic phase is chiral.

3. Results and Discussion

3.1. Materials Used

We investigated compounds M1, M2, M3 and 70%/30% w/w mixtures of M4 with a prototypal nematic 4-4’ pentyl cyano-biphenyl (5CB). Compounds M1 and M4 are cyano-biphenyl-based bimesogens. These have methylene spacers of 11 and 9 carbon atoms, respectively, and are often identified as CBC11CB and CBC9CB, respectively. We also investigated compounds M2 and M3, often referred to in the literature as DTC3C11 and DTC5C11, and their mixtures mixed with their monomers in the ratios of weight/weight (w/w) percentage of bimesogen/monomer. These are termed as MGTP3 and MGTP5. For convenience, we continue naming these materials as performed previously. Both M1 and M4 contain cyano-end groups attached to the biphenyl in its para position at each end. When these molecules are bent and twisted, the relative permittivity along the long molecular axis is higher than normal to it. These materials thus exhibit positive dielectric anisotropy (Δε). However, compounds M2 and M3 have fluorinated terphenyl groups, and the resultant dipole moment of the terphenyls lies in a direction normal to the molecular axis. These materials consequently exhibit negative Δε, and its magnitude depends on the net dipole moment. The phase transition temperatures of the mixture can be controlled to an extent by the dilution of the bimesogen with its monomer. The chemical formulae and the structure of the compounds used are given in Figure 2.
The transition temperatures given above are determined by differential scanning calorimetry (DSC) for a heating/cooling rate of 10 °C per minute; however, these temperatures are somewhat different under slow cooling/heating. Most of our experiments are carried out at a cooling rate of 0.2 °C per minute; therefore, some disagreement in phase transition temperatures can appear.

3.2. Electro-Optical Response

Results for the electro-optical experiment show that for temperatures lower than for a conventional nematic, the odd harmonics of the signal are of measurable amplitudes in the Nx phase [16]. This is possible only if switching is polar in an LC cell. When the square waveform is applied, the signals for the fundamental and third harmonic continue to satisfy the condition V1F = 3 V3F, even when the frequency of the signal applied across the sample cell is as large as 2 kHz. This means that the switching time is at least as fast as the third harmonic of the applied field. The results of the experiment are a direct demonstration of the polar switching that could conceivably arise from the domain of a single chirality present in the field of view of the microscope. This, indeed, was an extremely interesting observation recorded in the experiment on the nematic phase formed from achiral molecules. The observation raised an important question for us to answer—how did we obtain the structure of a single chirality over the macroscopic area of a ‘parallel rubbed planar-aligned’ material of achiral molecules in an LC cell?
The domains of single chirality were found to vary in size and shape depending on the surface conditions of an LC cell, the temperature gradient, the cooling/heating rate during the N–N
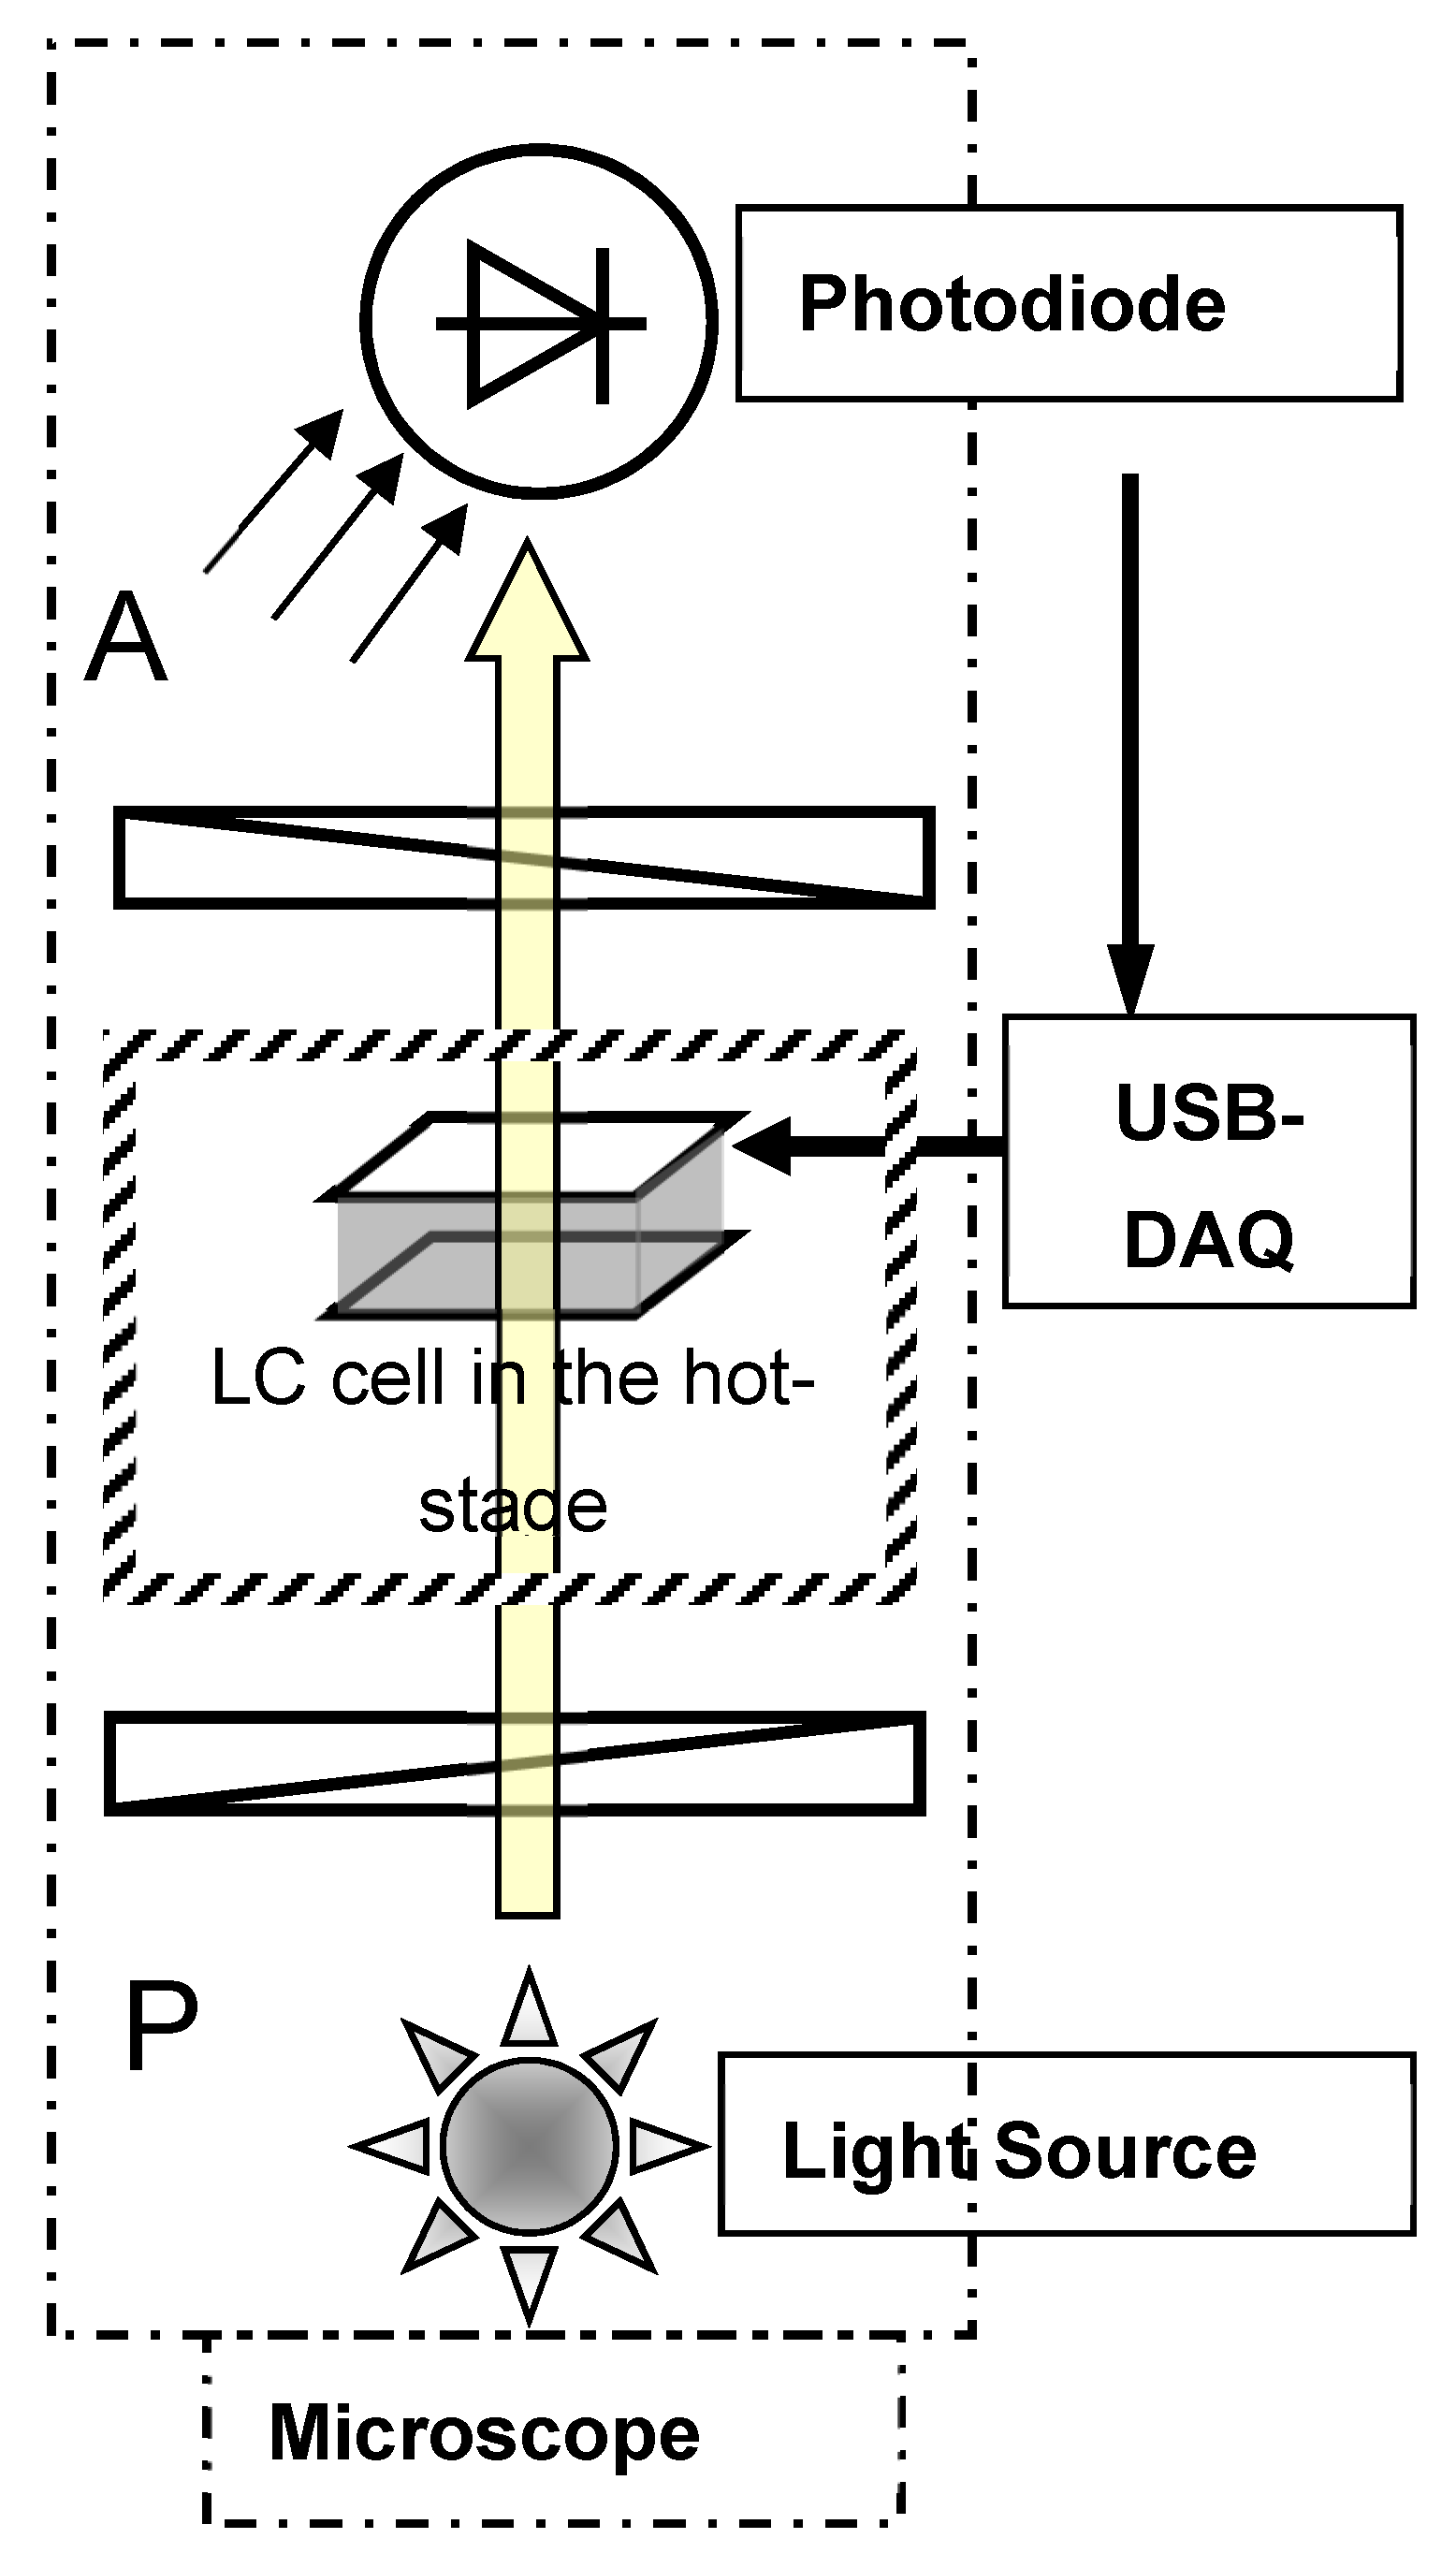
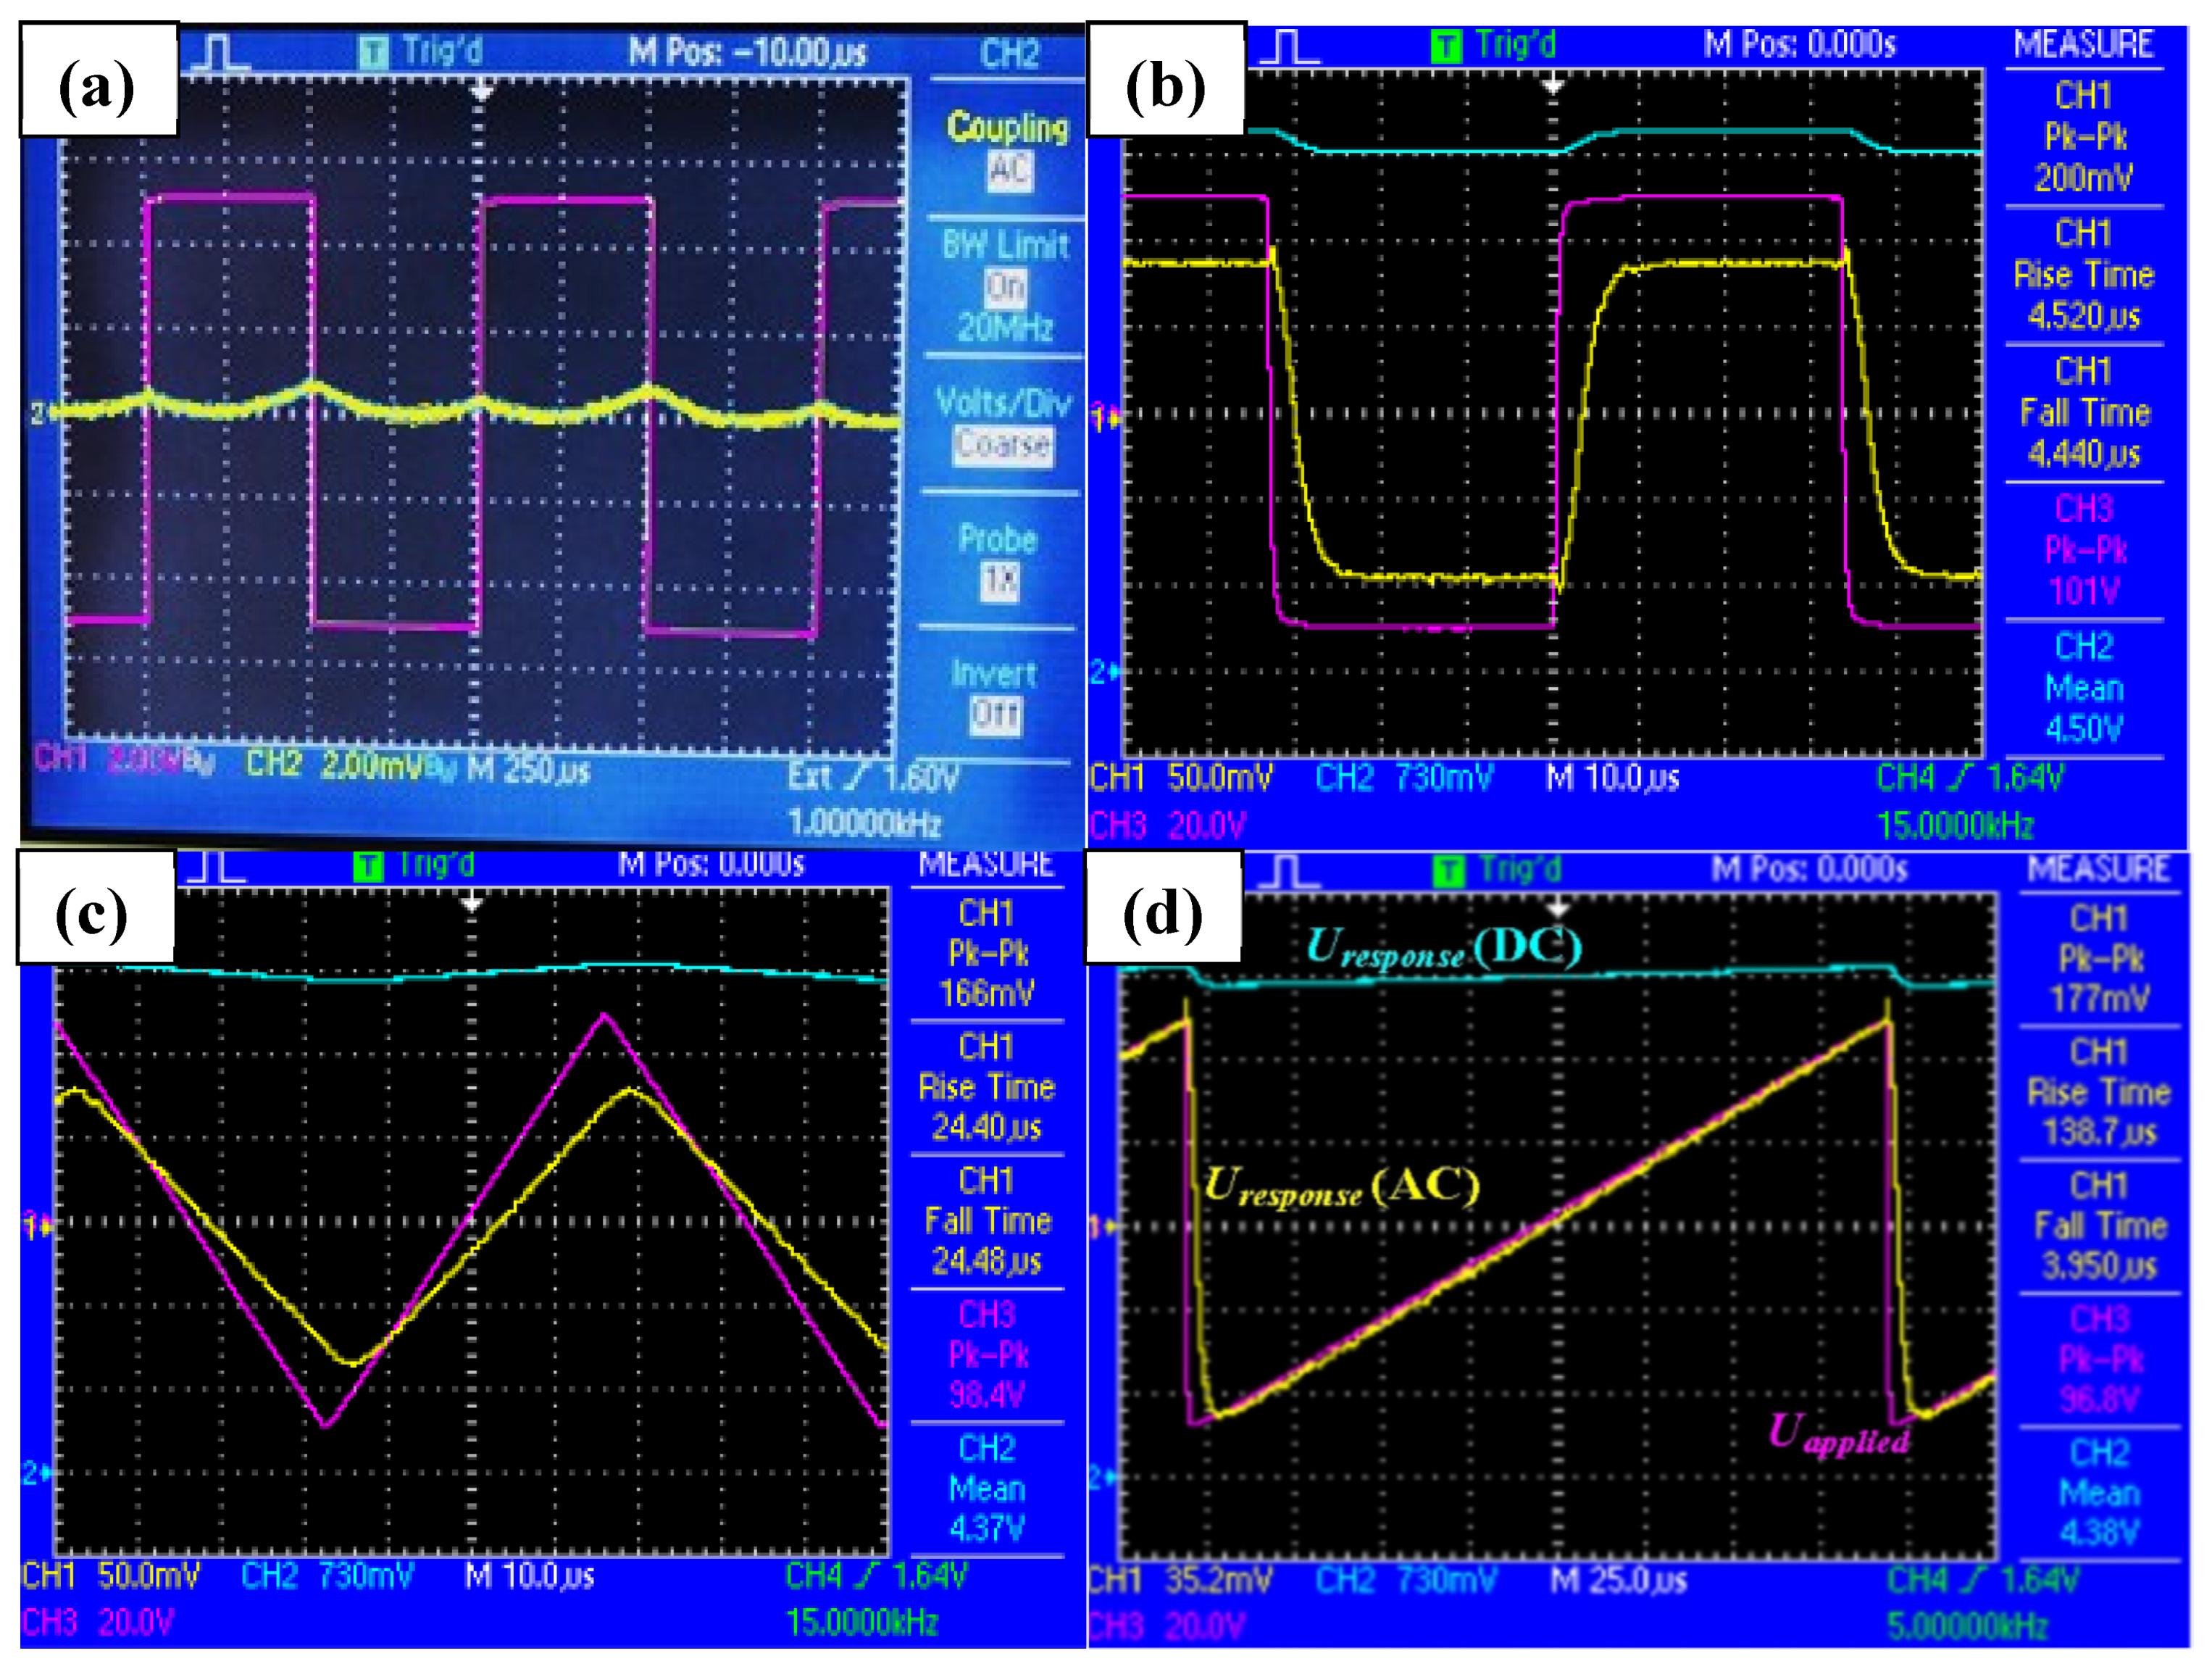
X phase transition and the sample history. In some cells, the domains of dimensions as large as 2 mm in length/breadth are observed. Repeated slow heating and cooling of the sample cell under electric fields of a single polarity could have played an important role in determining the outcome of this experiment. DC and AC coupled signals are fed to the separate channels of the oscilloscope, and the varying (switching) component of the signal relative to the input can be zoomed due to AC coupling. A close similarity of the applied and output waveforms (Figure 3b–d) confirmed the linear nature of the switching.
The results of the electro-optical experiment clearly confirm that the domain of a nematic phase in an LC cell under the field of view of a microscope is of single chirality [16,
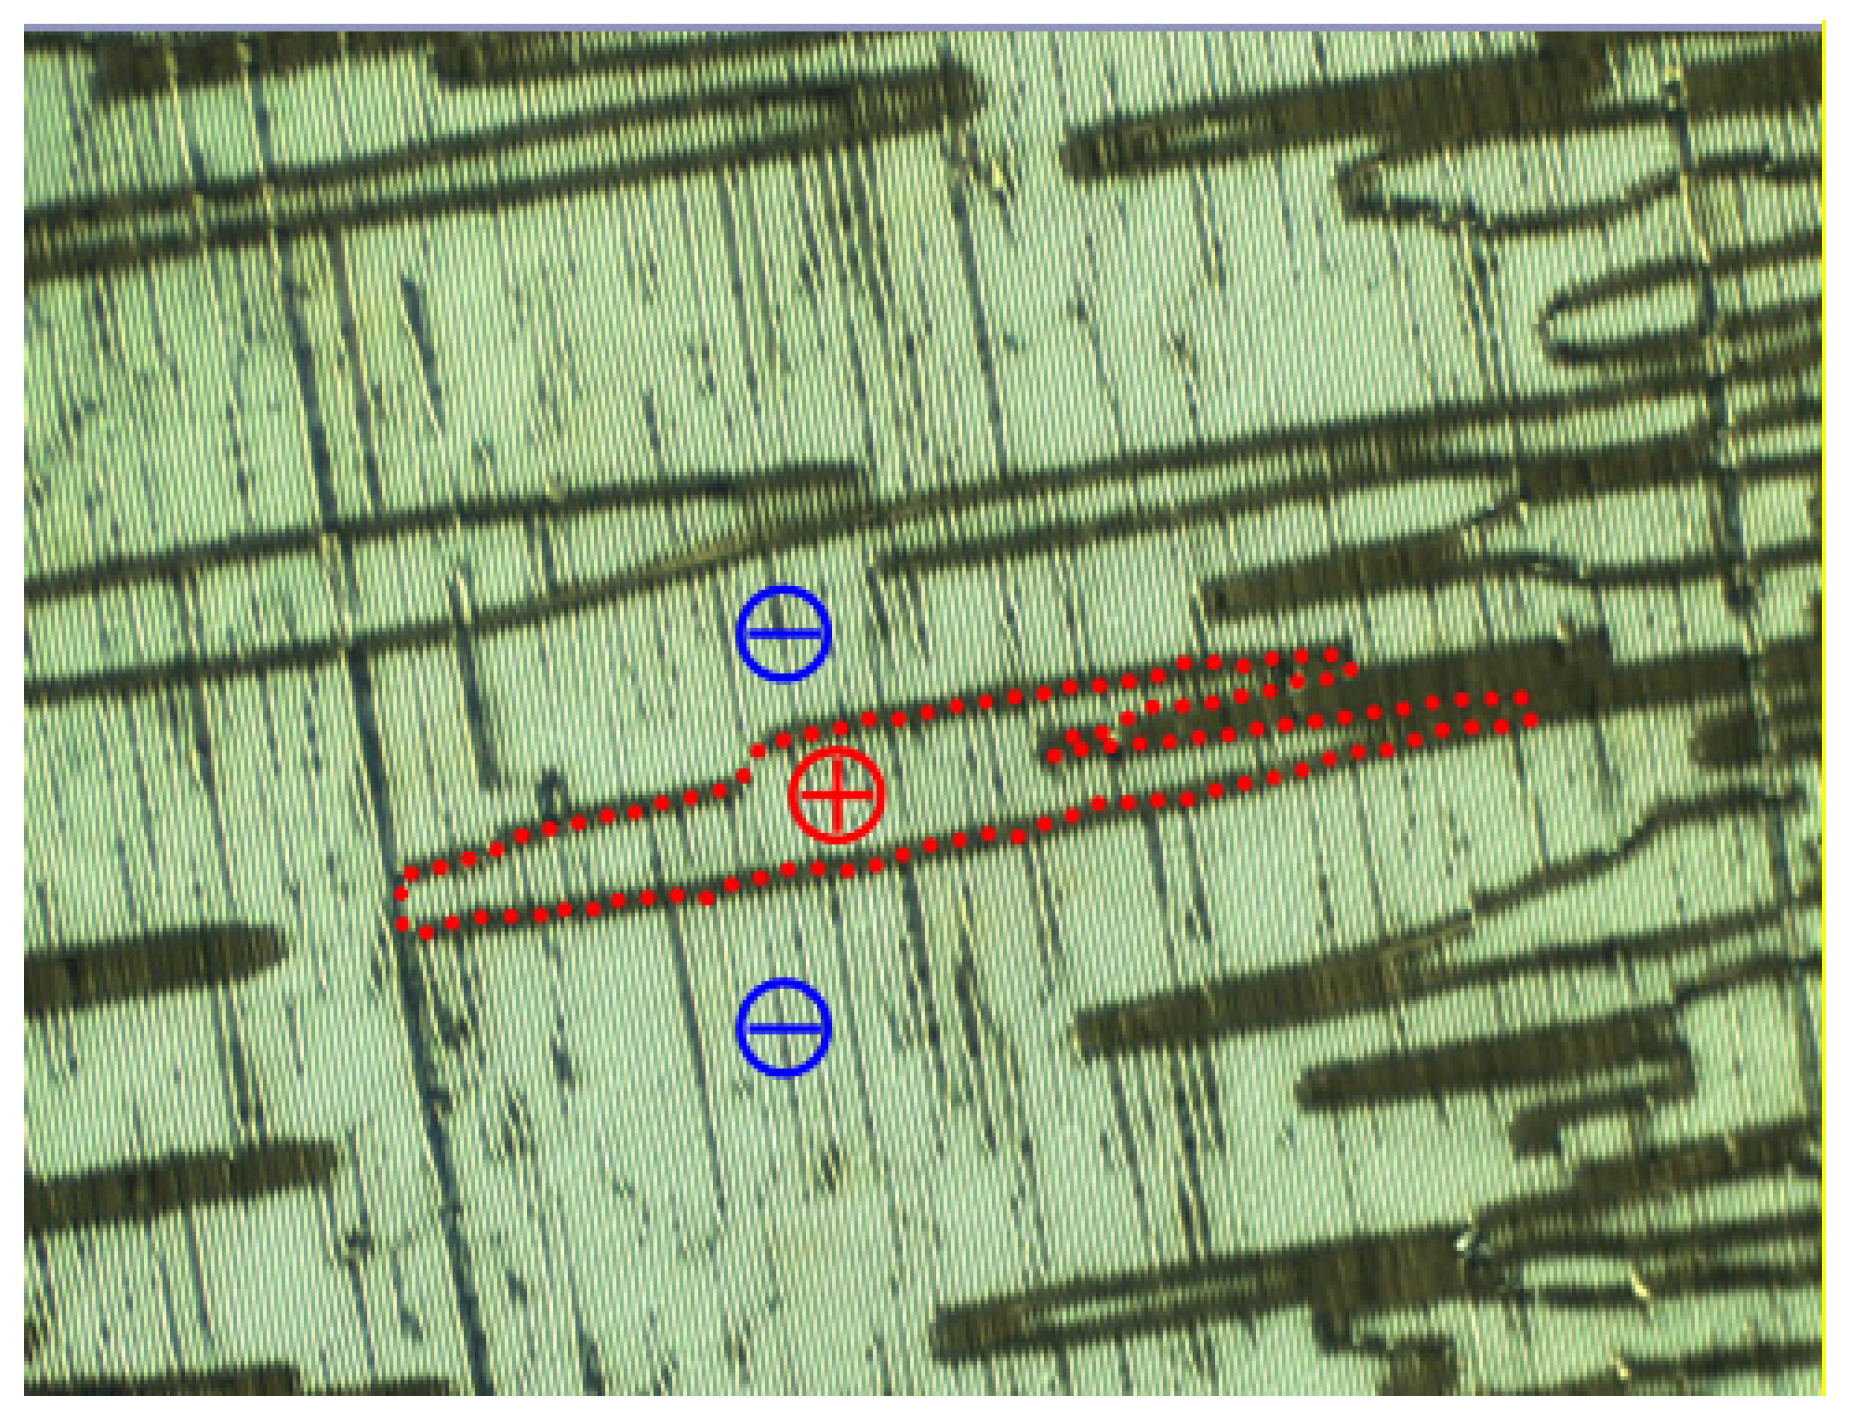
18]. Furthermore, the domain exhibits unusually fast electro-optic dynamics. To determine how such a chiral domain originated in the cell in the first instance, we examine the emergence of the domains observed under the polarising microscope in greater detail (Figure 4). The domain boundaries are identified as ‘discontinuities’ in a spontaneous emergence of the stripe pattern [15,16,17,18]. The two neighbouring domains gave an opposite switching response to the electric field applied [16,17,18]. The overall symmetry of the sample is consistent with the achiral nature of the material in a planar-aligned cell if the chiral domains of opposite chirality in a nematic phase also appear in the cell. The phase in question was proven to be nematic by X-ray scattering, as already been stated [15,
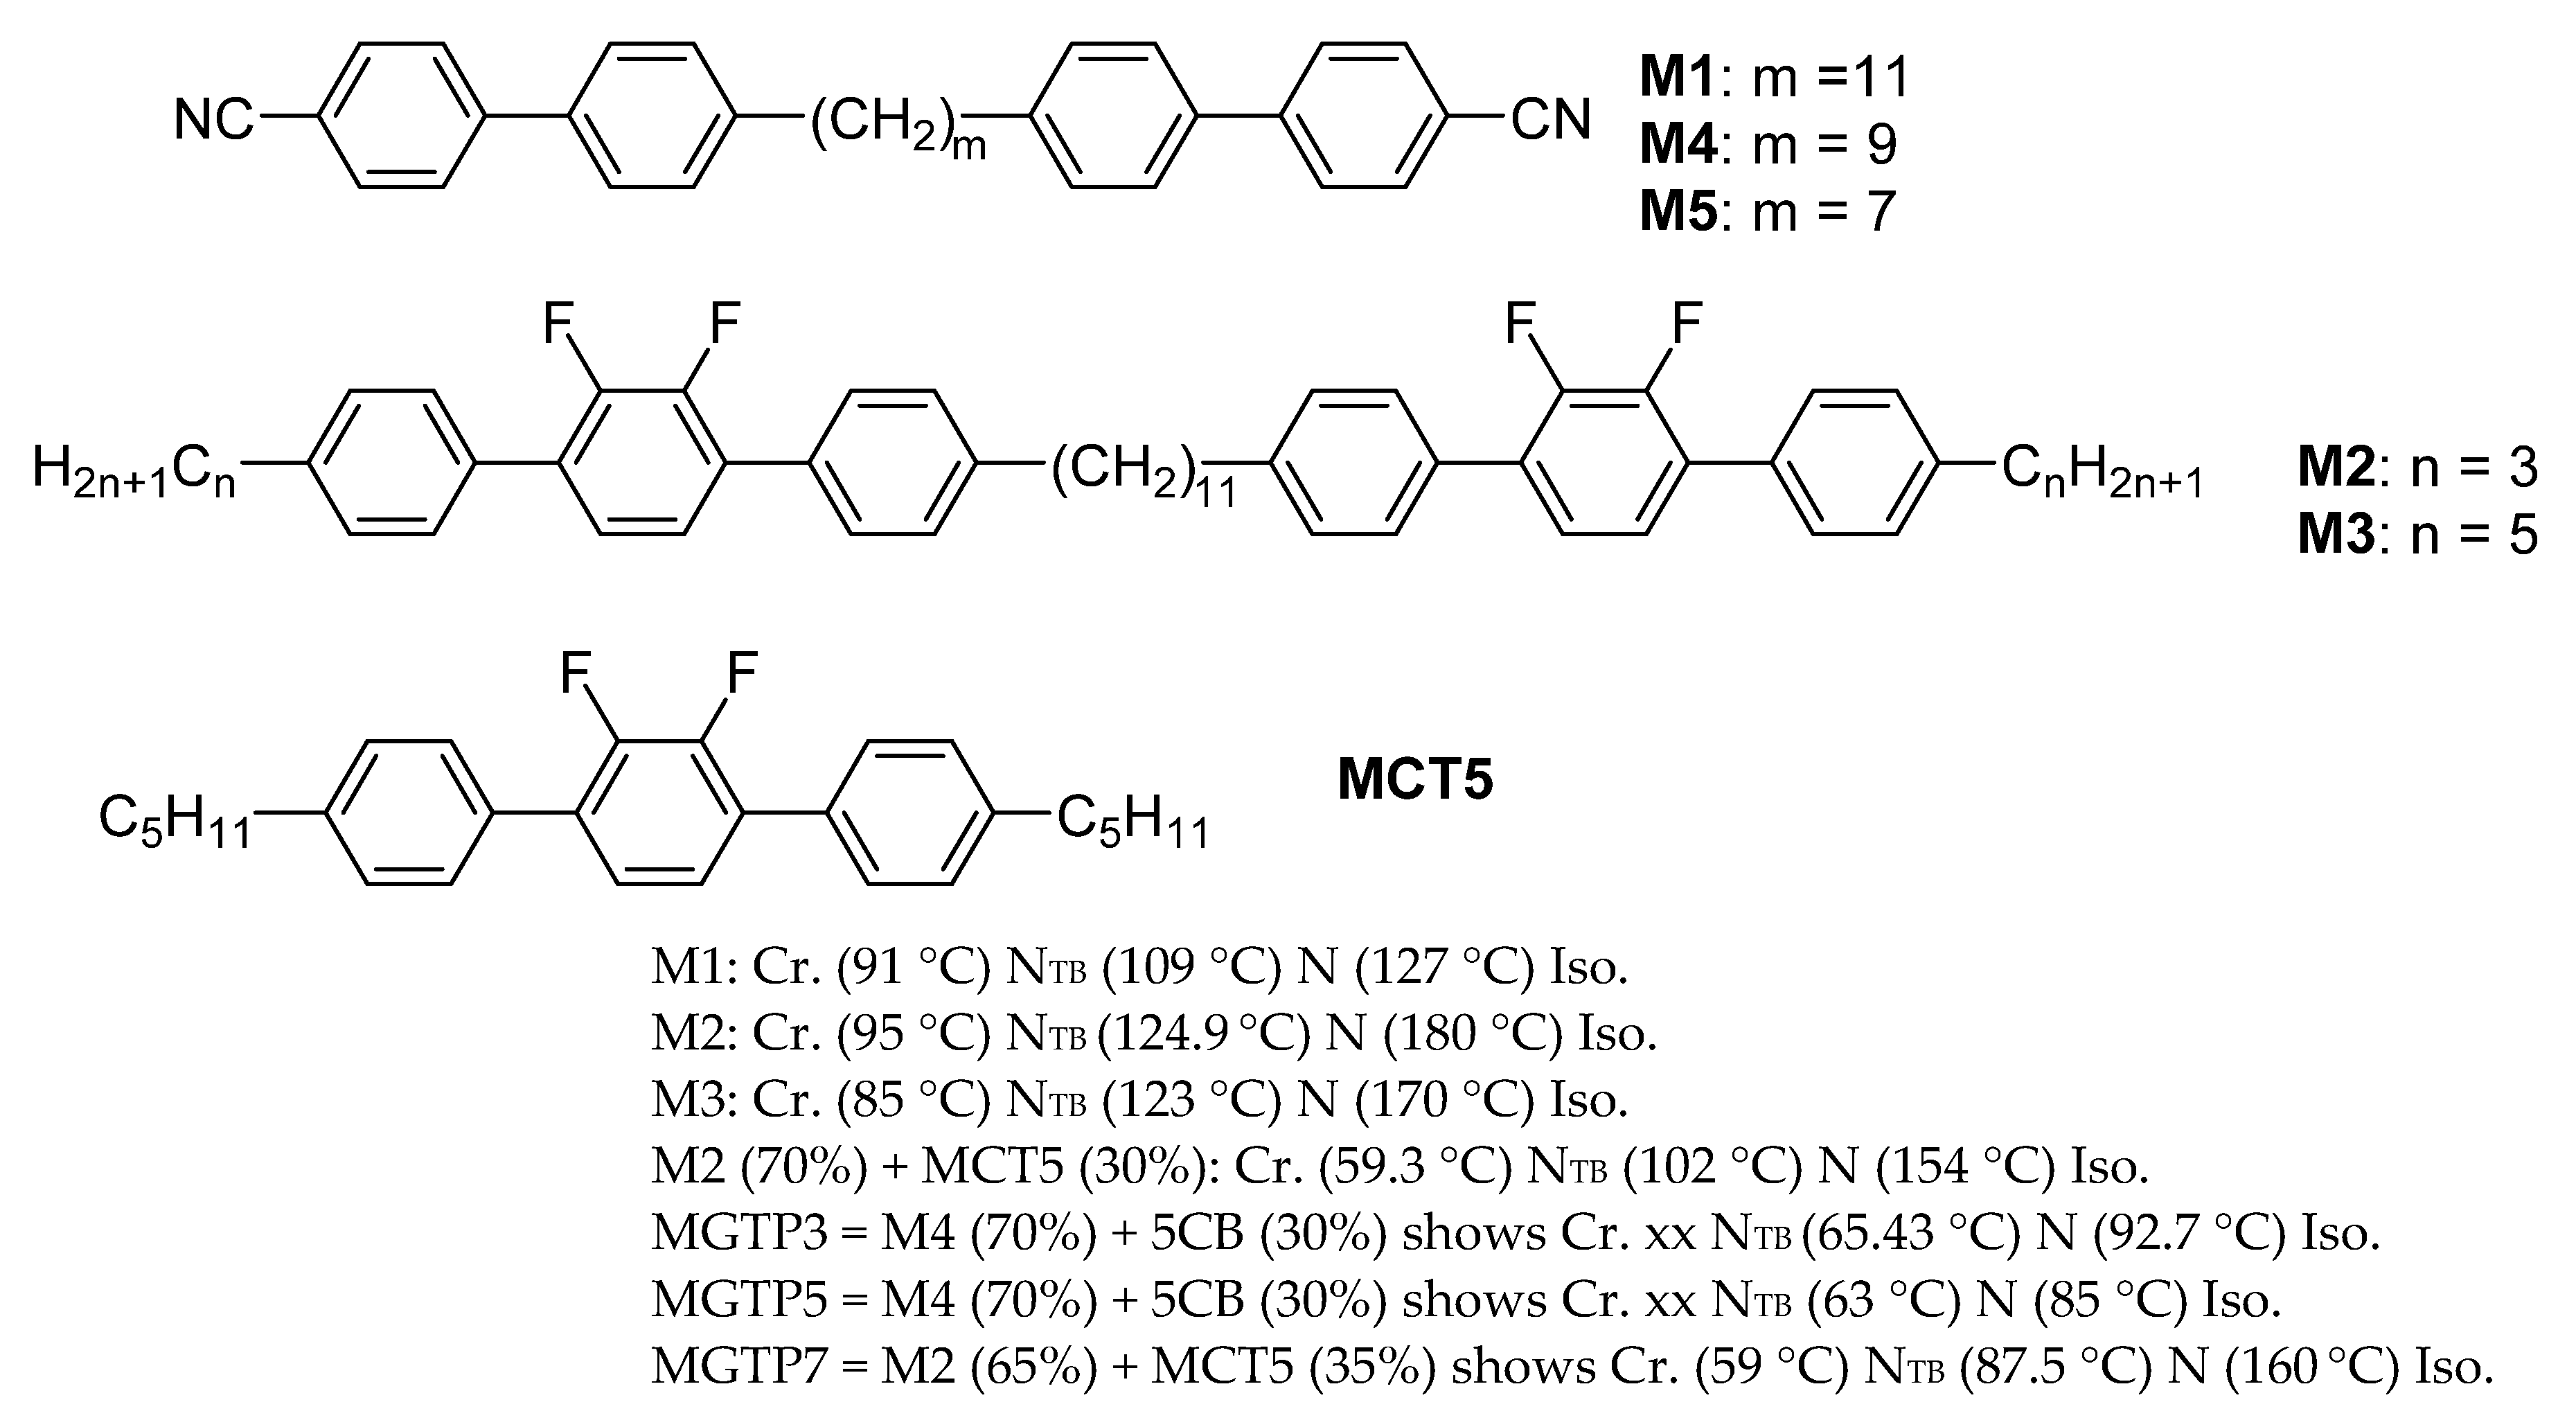
19]. Such observations were repeatable and reproducible for the compounds and the mixtures, composed of achiral molecules, investigated as listed in Figure 2.
When an LC cell is rotated by a small angle from its dark position clockwise or anticlockwise, a variation in the transmitted intensity (from dark to bright or reverse) is observed in between the two neighbouring domains [16]. Similar observations were made by Cestari et al. [20] soon after; however, these authors reported that neighbouring stripes (and not the neighbouring domains) were of opposite chirality. In our experiments, the domains were of large enough dimensions that each contained a significantly large number of stripes of the same chirality. Moreover, we found that the application of sufficiently large electric fields at high frequencies led to the formation of periodic patterns of such domains [17]. The domains of opposite chirality were also confirmed to exist using 2H nuclear magnetic resonance experiments later by Emsley et al. [21]. They converted the domains of opposite chirality or seeded to ‘the domain of a single chirality’ by doping the bimesogen with a chiral solute (S)-1-phenylethanol.
In our experiments, the system was cooled/heated slowly (0.2 °C per minute) under a weak DC electric field. The polar switching, as explained above, was observed with a switching time of a few microseconds. This meant that a domain of ‘a single chirality’ existed stably over the field of view of a polarising microscope, without having the need to seed it with a chiral dopant. A repeated slow heating and cooling of the sample cell could have resulted in the biasing of all the molecules, thus acquiring the bent shape of a single configuration (R) or (S). This could have been a major step forward for forming a single chirality domain.

3.3. Identification of NX Phase with the NTB Phase

A procedure of obtaining the domain of a single chirality without needing to use a chiral dopant offers significant potential in fabricating devices using chiral materials derived from achiral molecules. This method dispenses with following the most expensive route of synthesising chiral materials directly. Dozov had predicted that the twist-bend structure of weakly bent molecules in the nematic phase could lead to a chiral structure [22]. It now turns out that the formation and the stability of this structure are due to a minimisation of the excluded volume [23]. This, together with other evidence, has enabled the identification of this phase as the ‘twist-bend nematic’, ‘NTB’ [2,3,4,18,19,22]. Henceforth, we shall refer to the Nx phase as NTB. Essentially, it is a chiral structure created by the symmetry breaking of achiral molecules. Molecules are bent and twisted to form the twist-bend structure. The phase, however, is still nematic.
It may be restated that Dozov’s work [22] emphasised the emergence of spontaneous chirality in a nematic phase from the twist-bend structure formed by achiral molecules with a bend elastic constant K33 decreasing to almost zero and going to a negative value [24]. This results in a spontaneous bend distortion of the director. The twist provides stability with a higher packing efficiency and a minimisation of the excluded volume, as is conjectured by Goodby [23]. Whether the structure formed is splay-bend or twist-bend depends on the relative ratios of the other two elastic constants. However, the splay-bend phase does not lead to chirality. Since the domain observed was chiral, the ‘splay-bend nematic phase’ in its ground state is ruled out. We may add that the optical stripes observed in parallel-rubbed planar-aligned cells are not related to the chirality. The twist-bend of the molecules leads to a heliconical structure on the nm scale. The helical pitch of 8 nm was determined initially by Freeze Fracture Transmission Electron Microscopy (FF-TEM) [2,3], and it has recently been confirmed using other techniques of soft resonant carbon, selenium and sulphur K-edge X-rays [25,26,27]. The structure of the phase at the micrometre scale [28] is far more complex and intriguing than the locally biaxial helical structure on the nanometre (nm) scale would have suggested. A complicated hierarchy of structures on several different length scales [18,28,29] requires detailed investigations to be carried out using techniques that enable high resolution, a wide field of view and 3D imaging of the structure. As the electric field is applied across the parallel-rubbed planar-aligned cell, the NTB phase is converted to a splay-bend for fields larger than a few V/μm depending on the Δε and optical biaxiality. This was observed for the first time in [30] especially for a bent-core LC, and was theoretically predicted by Longa et al. [31,32] soon after. This has recently been verified by Meyer et al. [33] through birefringence measurements, which suggest that molecular biaxiality plays a key role in not only stabilising the NTB phase but also in producing a field-induced splay-bend phase. Merkel et al. show through polarised IR measurements that biaxiality order parameters increase significantly in the NTB phase with a reduction in temperature [34].
The measurement of the birefringence [16,18,19] gives both the deviation angle ϕ per unit electric field and the switching time τ for a uniformly lying helix. The angle ϕ by which the optic axis deviates from its initial position in the plane of the cell normal to E is given by:
tan ϕ = e E p 2 π K
The switching time τ is given by:
τ = γ p 2 4 π 2 K S i n 2 θ c
Our experiments yield values of ϕ ~ 0.1° to 1.0° for E = 10 to 20 V/µm [16,18,19]. In Equations (1) and (2), e is the flexoelectric coefficient, p is the pitch of the helix, K is the effective elastic constant, γ is the viscosity, and θc is the heliconical angle. The parameters e, k and τ can be measured [16,35], and γ can be estimated. Based on the experimental results, we estimated at an earlier stage that p << the wavelength of UV light [16]; p << 100 nm [19,35]. Coles et al. [36] used a set of Equations (1) and (2) for the cholesteric nematic phase, except they used K = K1 + K3 instead of K = K1 + K2 [4] for the NTB phase.

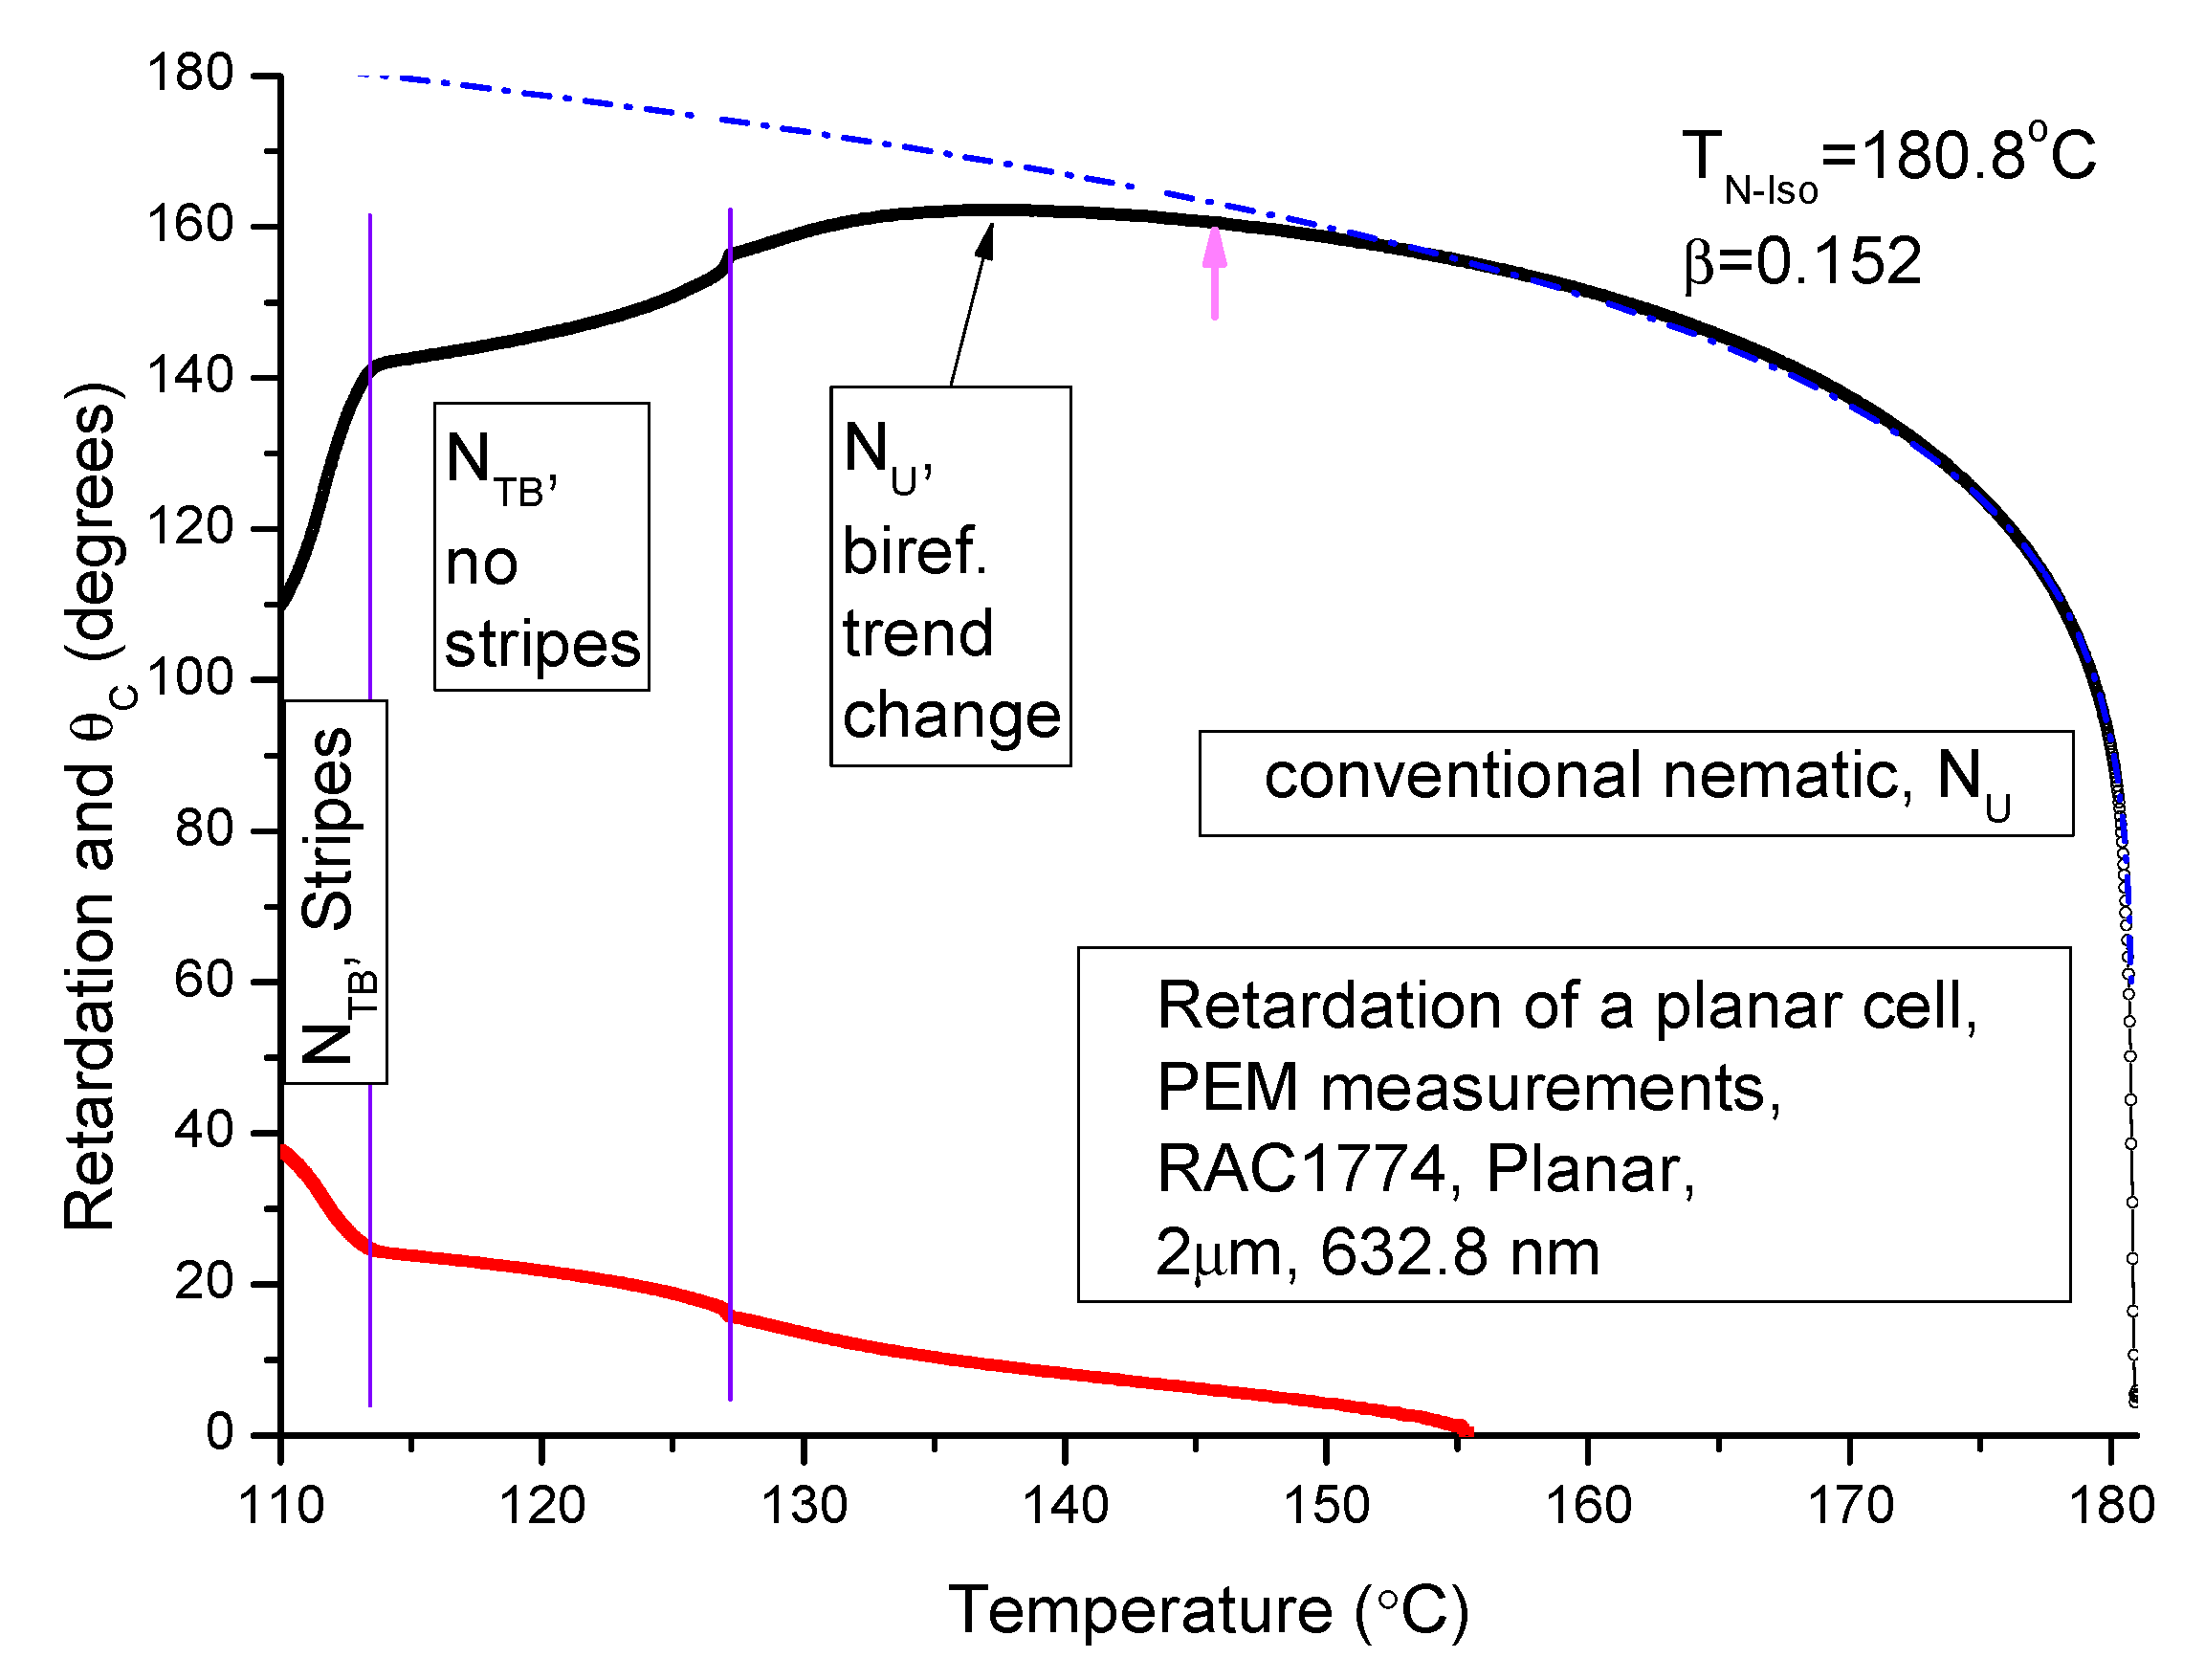
3.4. The Optical Retardation

The heliconical angle θc can be determined from the optical retardation (OPR) or the phase difference between the output and input signals. The OPR is given by:
OPR = 2 π Δ n   d λ
Here, Δ n is birefringence, d is the cell thickness, and λ is the wavelength of the light beam for which the optical retardation is measured. The OPR (in degrees) measured by the PEM set-up designed by one of the authors (VPP) [14] is plotted as a function of temperature in Figure 5. We used a planar-aligned cell of cell spacing 2 μm. The material used in this experiment is fluorinated bimesogen denoted as M2.
Interestingly, a change in the trend of the ‘dependence of OPR on temperature’ within the high temperature nematic phase but closer to the N–NTB phase transition temperature is observed. The decrement in OPR starts at a temperature approximately 10 °C just above the NTB-N phase transition temperature using the procedure given below. In a similar manner, we estimate θc = 24.3° at 113.9 °C (in the NTB at a temperature just above the onset of the striped pattern). However, caution in the interpretation of the results needs to be exercised for two reasons:
  • An extrapolation of the OPR over a wide temperature range depends significantly on the temperature range selected in the power law fitting formula of Haller [37]. The starting point of the temperature range is marked by an arrow (in colour magenta) in Figure 5, and;
  • An extremely complicated structure of the NTB phase may invalidate the use of the simple Haller formula [37].
The birefringence Δ n N TB in the NTB phase is given in terms of the heliconical angle θc:
Δ n N TB = Δ n extr ( 1 3 2 θ c 2 )
Here, Δ n N T B is the measured birefringence value at a temperature of interest. Δnextr is the extrapolated value at this temperature provided the transformation from N to NTB had not occurred. Δnextr is obtained from Haller’s formula [37]:
Δ n extr = Δ n 0 ( 1 T T * ) β
where the parameters Δno, T* and β are obtained by fitting the experimental birefringence data acquired in the high temperature conventional nematic phase. Here, Δn0 corresponds to the birefringence value at the absolute zero temperature, T* is the temperature of the Iso-N phase transition and β is a critical exponent. On having determined these parameters, one can obtain Δnextr for temperatures corresponding to the NTB phase using Equation (5) and then calculate θc using Equation (4).
We find that θc, calculated from the results of the OPR data, starts rising in the high temperature N phase (see Figure 5 red line). The heliconical angle is ~ 10° at a temperature of 14 °C above the N–NTB transition temperature. At first, this angle increases linearly with a reduction in temperature, followed by a jump at the N–NTB transition temperature. The observation is reminiscent of the first order phase transition. The important finding here is that the ‘heliconical angle’ emerges in the high temperature N phase itself, and it continues to increase with a decrease in temperature. The result is consistent with that obtained from NMR [38] and by dielectric spectroscopy [30]. A change in the nature of the high temperature N phase above the N–NTB transition temperature may be due to the pretransition effect caused by the first order N–NTB transition [19].

3.5. The Fréedericksz Transition in the NTB Phase

In this section, we examine the electro-optical response in the NTB phase following the application of an electric field across a planar-aligned cell, filled with achiral bimesogens having Δε > 0. The response is found to be of two types: the (a) linear and (b) non-linear. The latter is due to the Fréedericksz transition, of a type shown here. This is different in the NTB that in the N phase. The linear response has already been discussed in greater detail in Section 3.2.
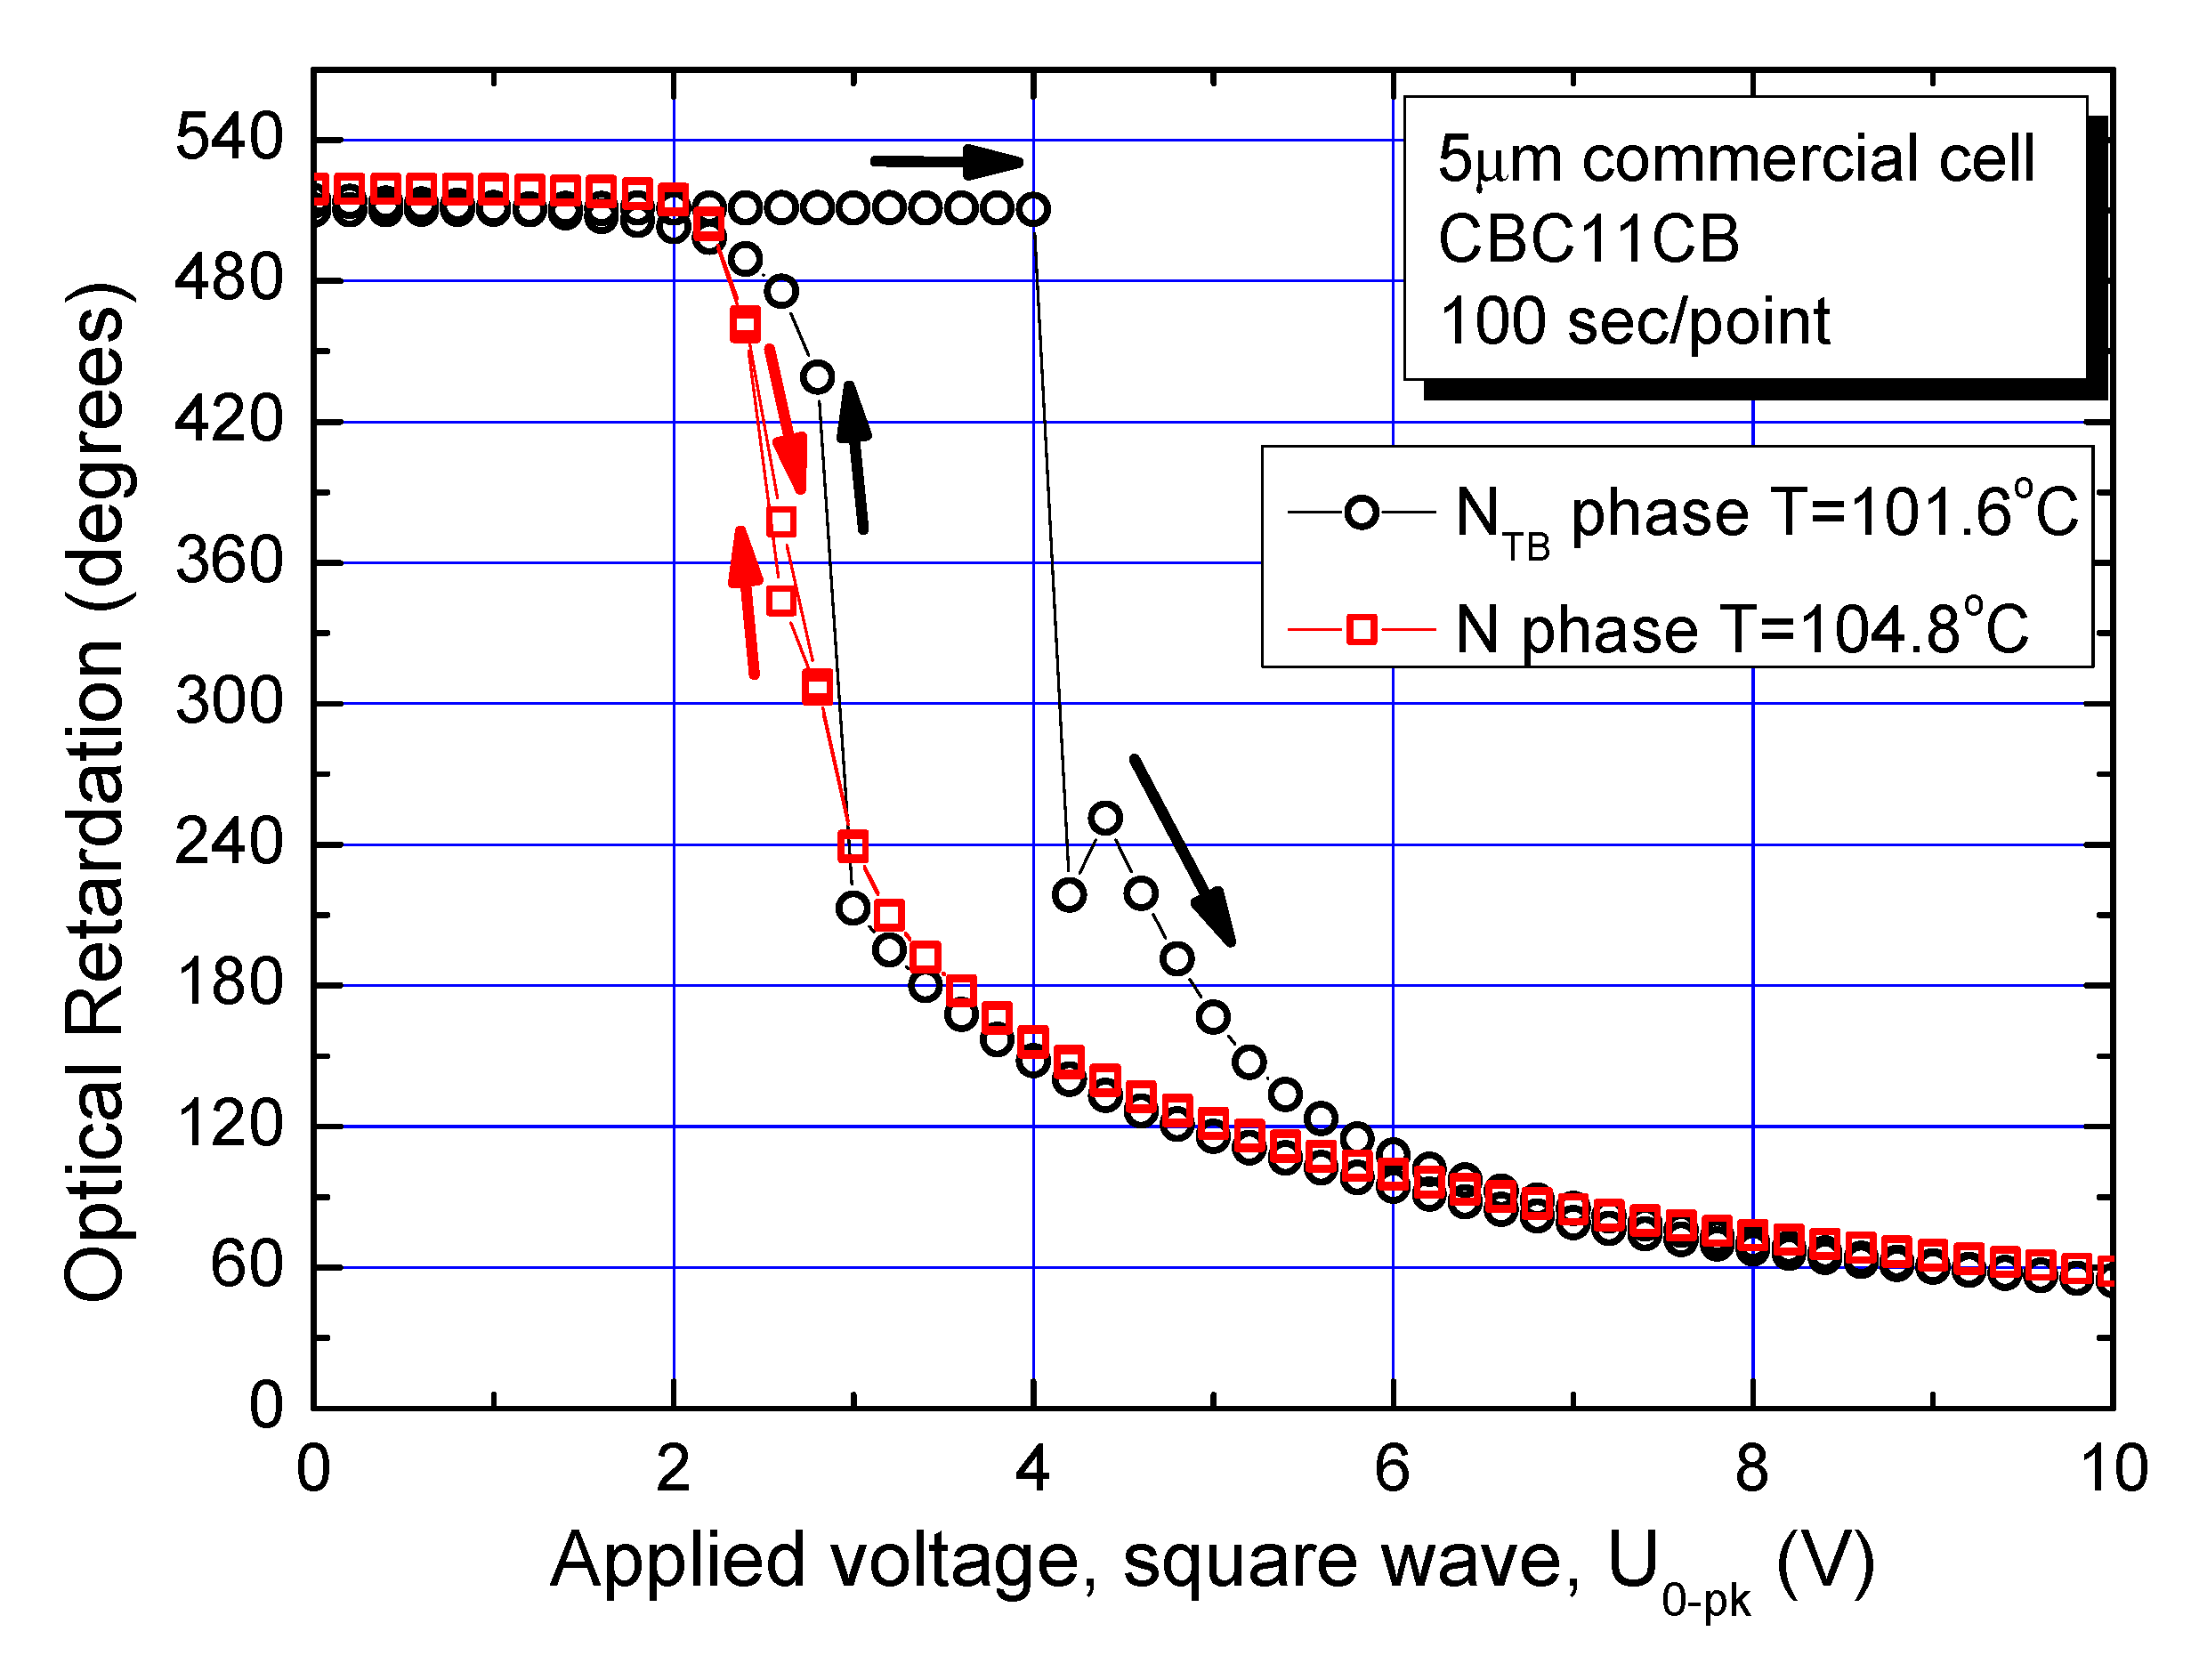
In terms of the differences in the characteristics of the two phases, the Fréedericksz transition is investigated for both N and NTB phases of a planar-aligned cell. The optical retardation (OPR) is measured using a photo-elastic modulator (PEM) system [14] following an application of square waveform across a commercial parallel-rubbed planar-aligned cell of sample thickness 5 μm. The cell is filled with the cyanobiphenyl bimesogen CBC11CB (M1). The dielectric anisotropy for both N and NTB phases is finite and positive. The amplitude of a square waveform is first increased, and then decreased gradually. Each measurement point is fixed to have 100 s delay time inserted in the computer program of an automated measurement procedure to eliminate the contribution to the output from an increased viscosity of the system. Hence, the experiment takes a time span of approximately 5 h to complete. The samples in the LC cell are chemically stable over a longer period. The experimental data, recorded just ~0.5 °C below the N–NTB phase transition, are plotted in Figure 6 as a function of applied voltage. For temperatures much below the N–NTB phase transition temperature, a manifold increase in the viscosity of the material makes this experiment almost impossible to conduct.
An interaction of the electric field applied across the parallel-rubbed planar-aligned cell with a material of positive dielectric anisotropy makes the constituent molecules start turning from the horizontal aligned positions to the direction vertical to the cell-windows. Consequently, the optical retardation decreases with an increase in the field strength. Furthermore, the Fréedericksz transition is mostly of the second order in the N phase. It is rarely observed as a first order transition except under the bias field [39]. No hysteresis is observed in the optical retardation values in between the two cases of the field increasing and the field decreasing in the N phase, as the response data for both waveforms coincide within the experimental error. The data for the OPR in the N phase are shown by red squares in Figure 6.
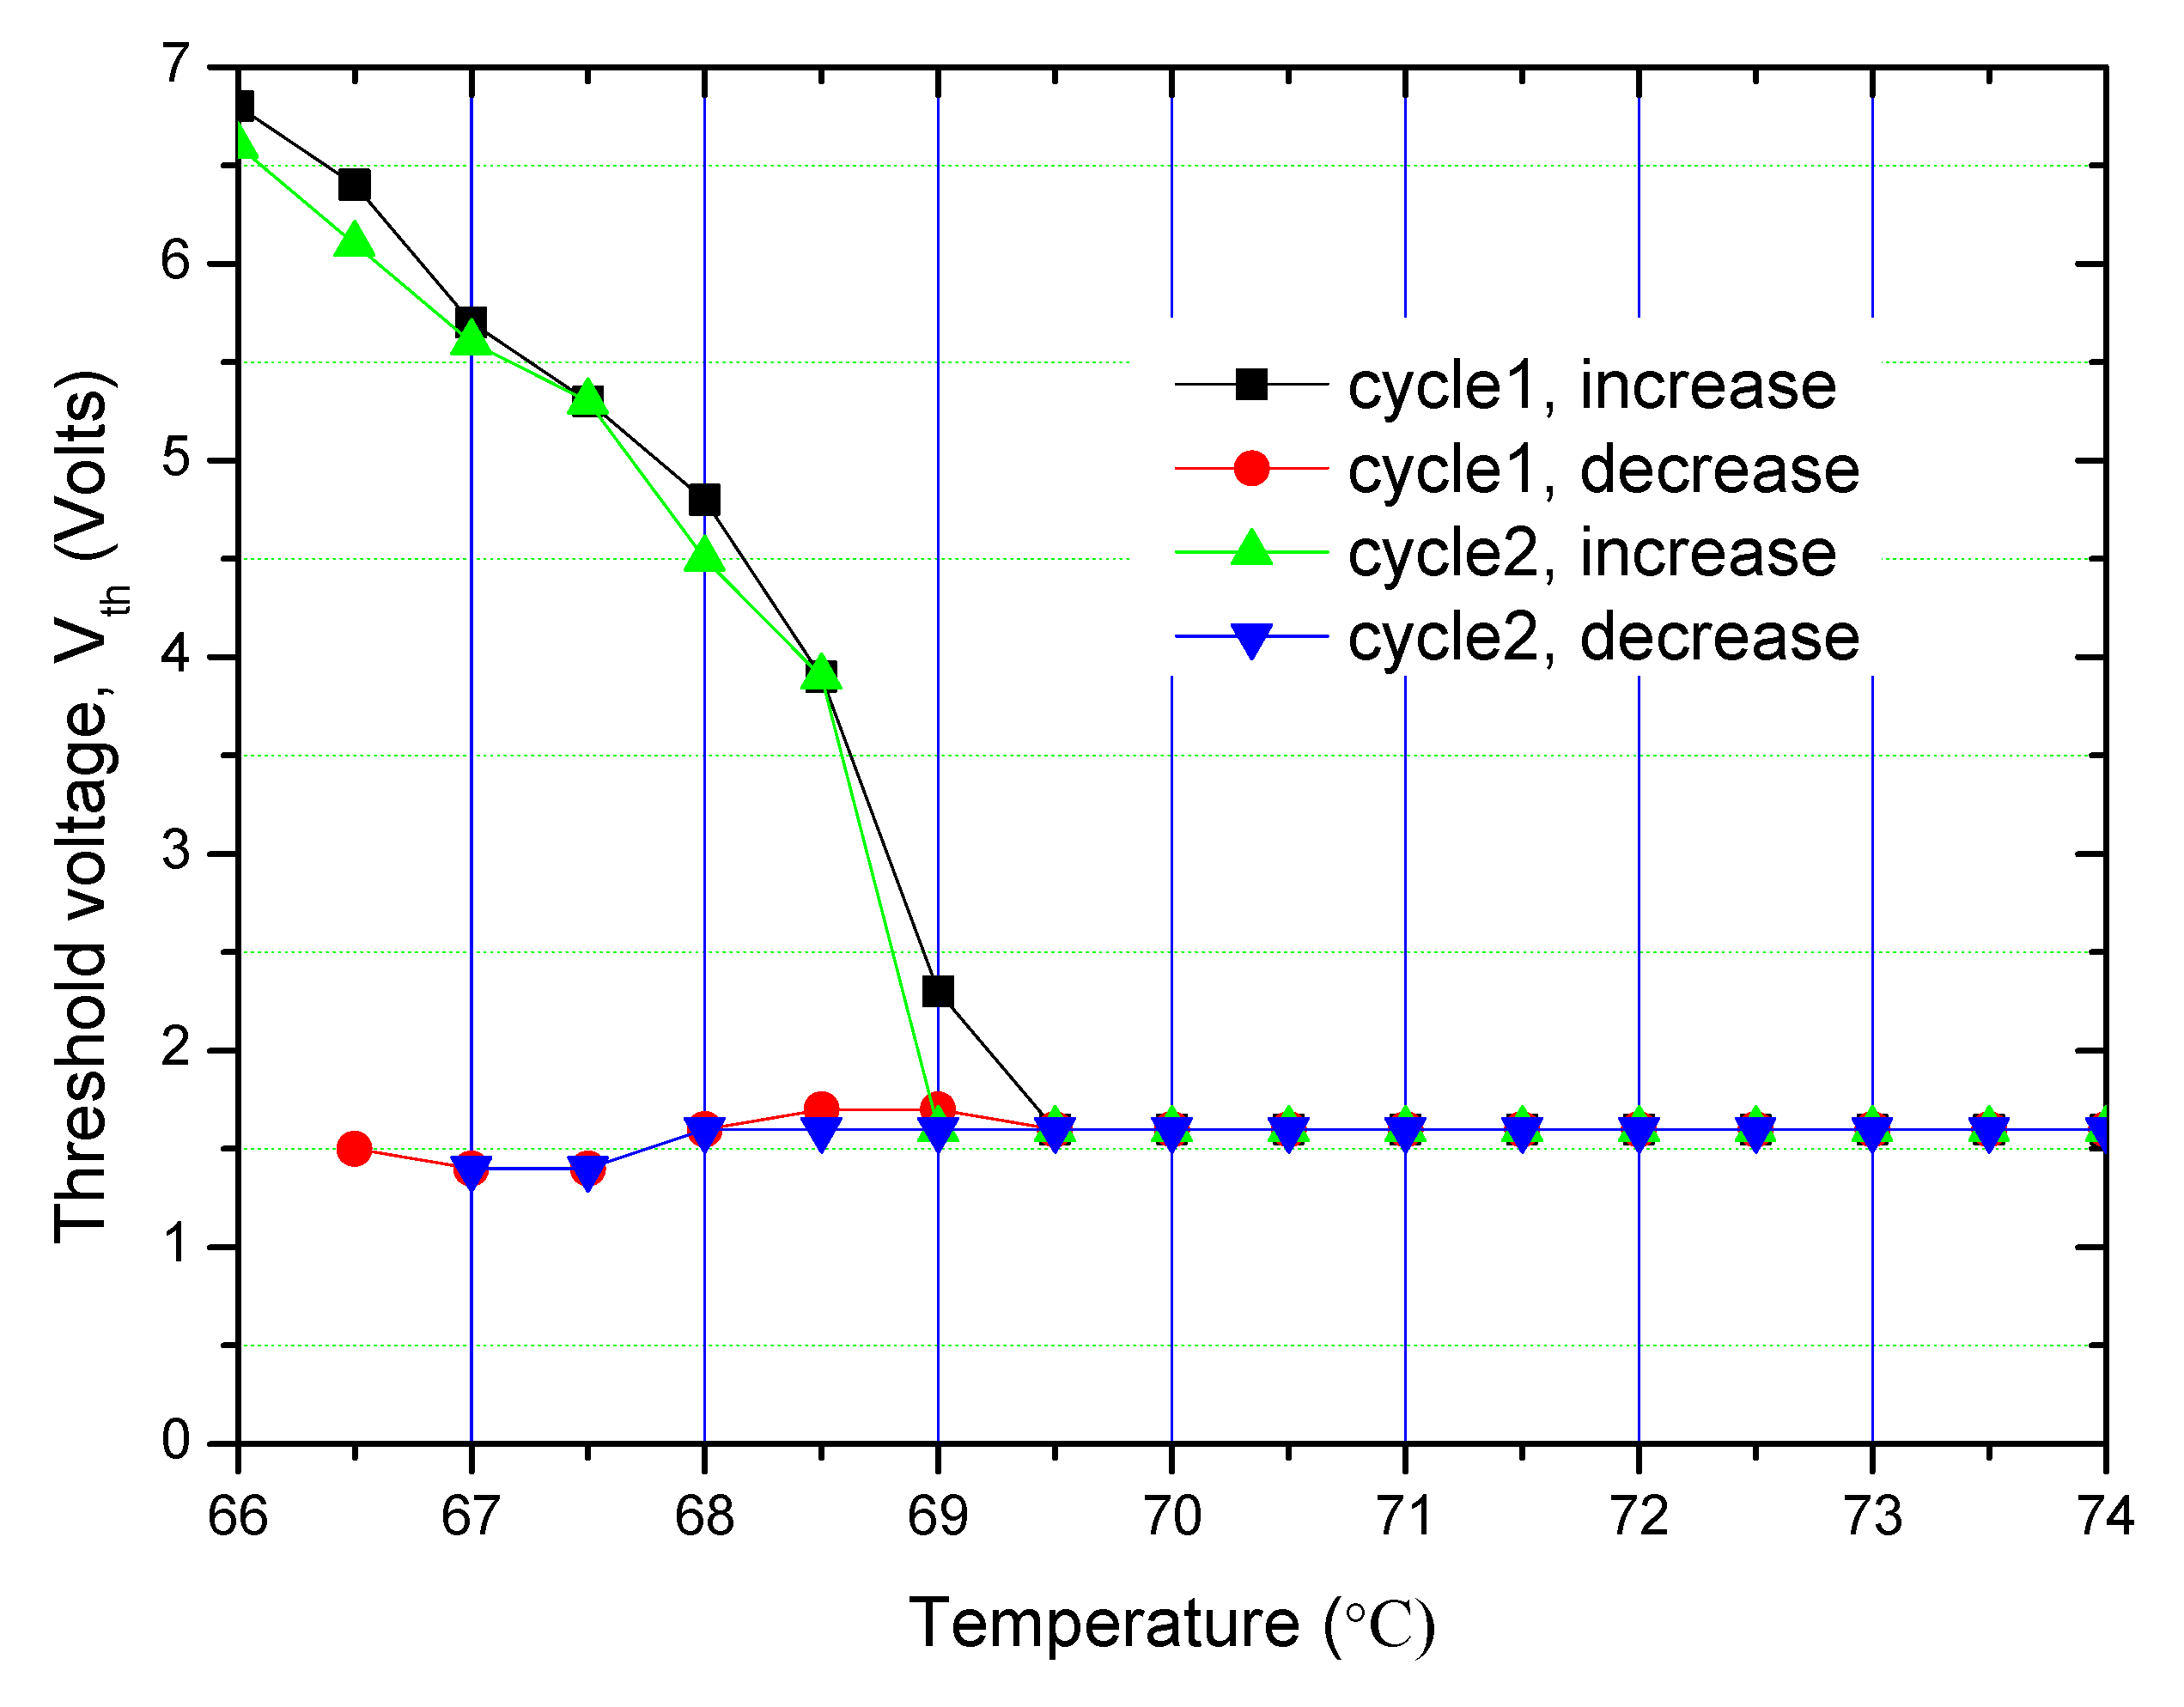
A good reproducibility in the results of the experiment is observed for repeated recycling of the input signal. The results are shown in Figure 7.
The threshold voltage, Vth, is defined as the voltage for which OPR suddenly drops to a lower value from its initial value following the application of an electric field. A significantly large hysteresis in the threshold voltage is observed in the NTB in contrast to almost none in the N phase at higher temperatures (Figure 7). The Fréedericksz transition is observed as the first order in the NTB phase as opposed to the second order in the N phase. Though a large increase in viscosity with a reduction in temperature in the NTB phase could have played a significant role in leading to a larger hysteresis, its effect is eliminated here by conducting measurements with a long time delay inserted in between acquisitions of the successive data points. We suggest that hysteresis in the NTB phase is due to its polar nature. The magnitude of hysteresis is relatively small when compared to the one arising from ‘bistability’ of the electric polarisation in ferroelectric liquid crystals.
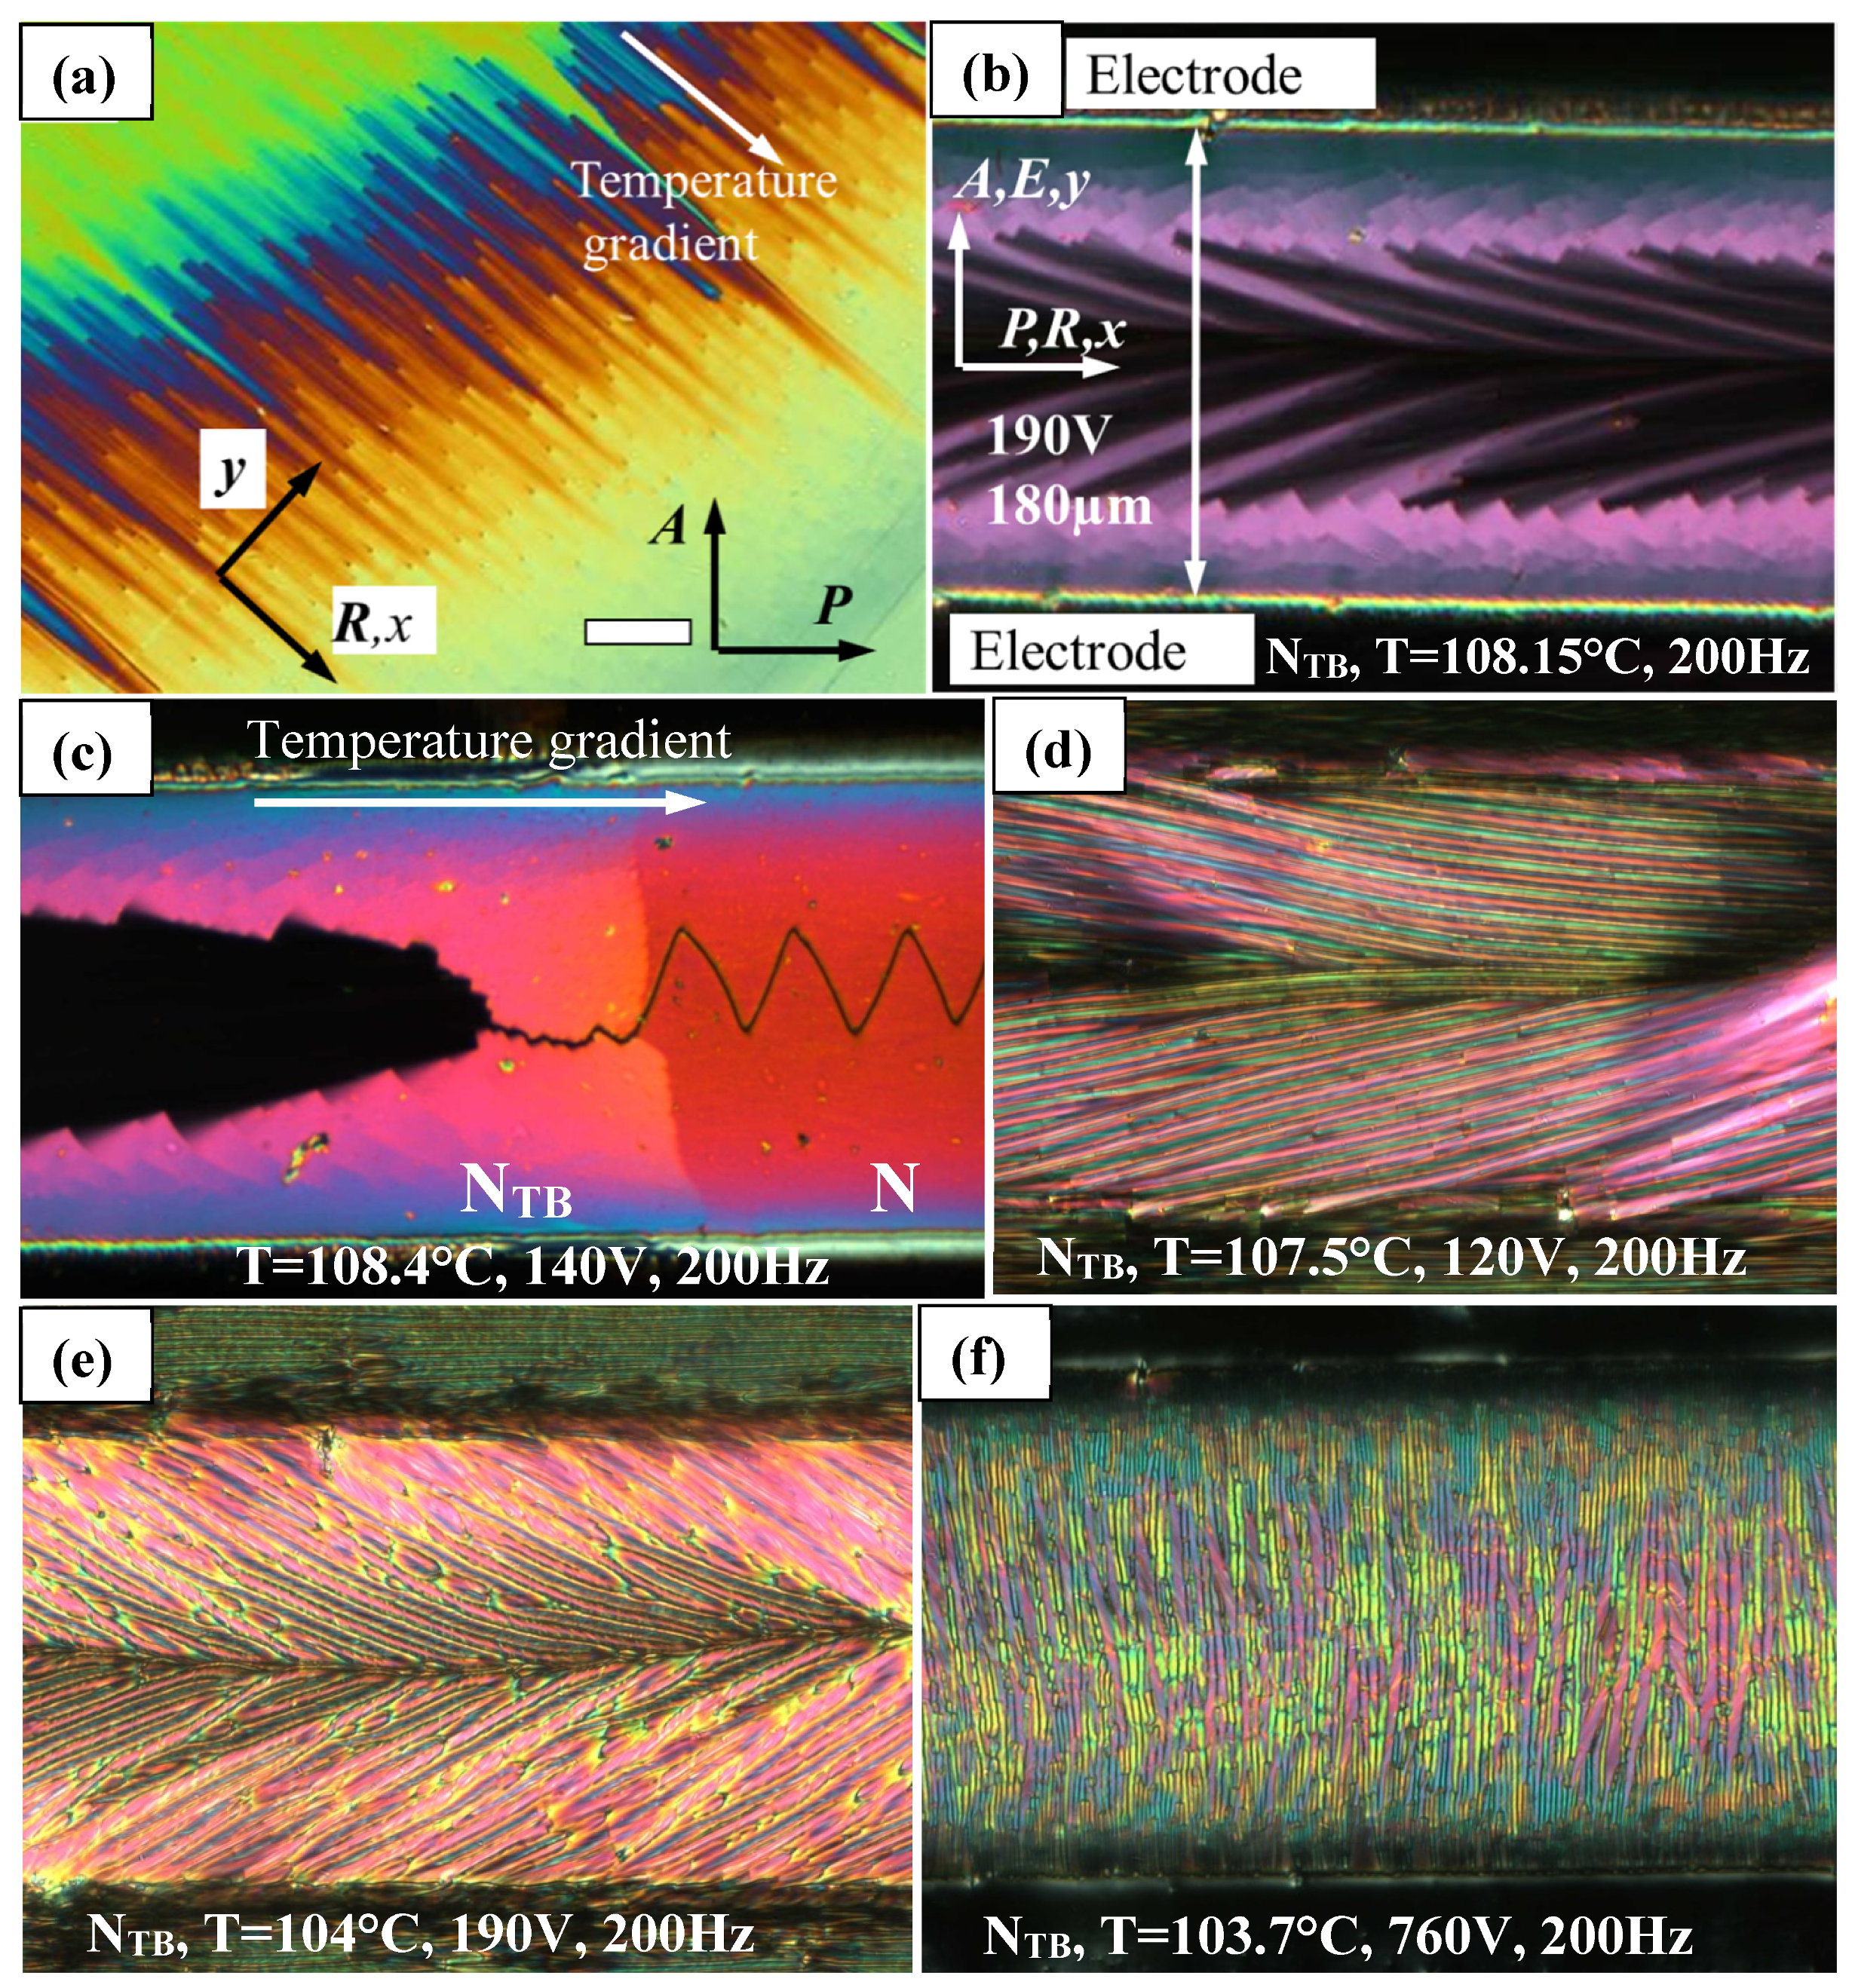
Data presented in Figure 6 and Figure 7 can be illustrated by POM image in Figure 8a showing the phase transition in planar parallelrubbed sandwich cell. Due to a small temperature gradient and temperature dependence of the threshold voltage, one can observe step-wise change of color along the temperature gradient direction.
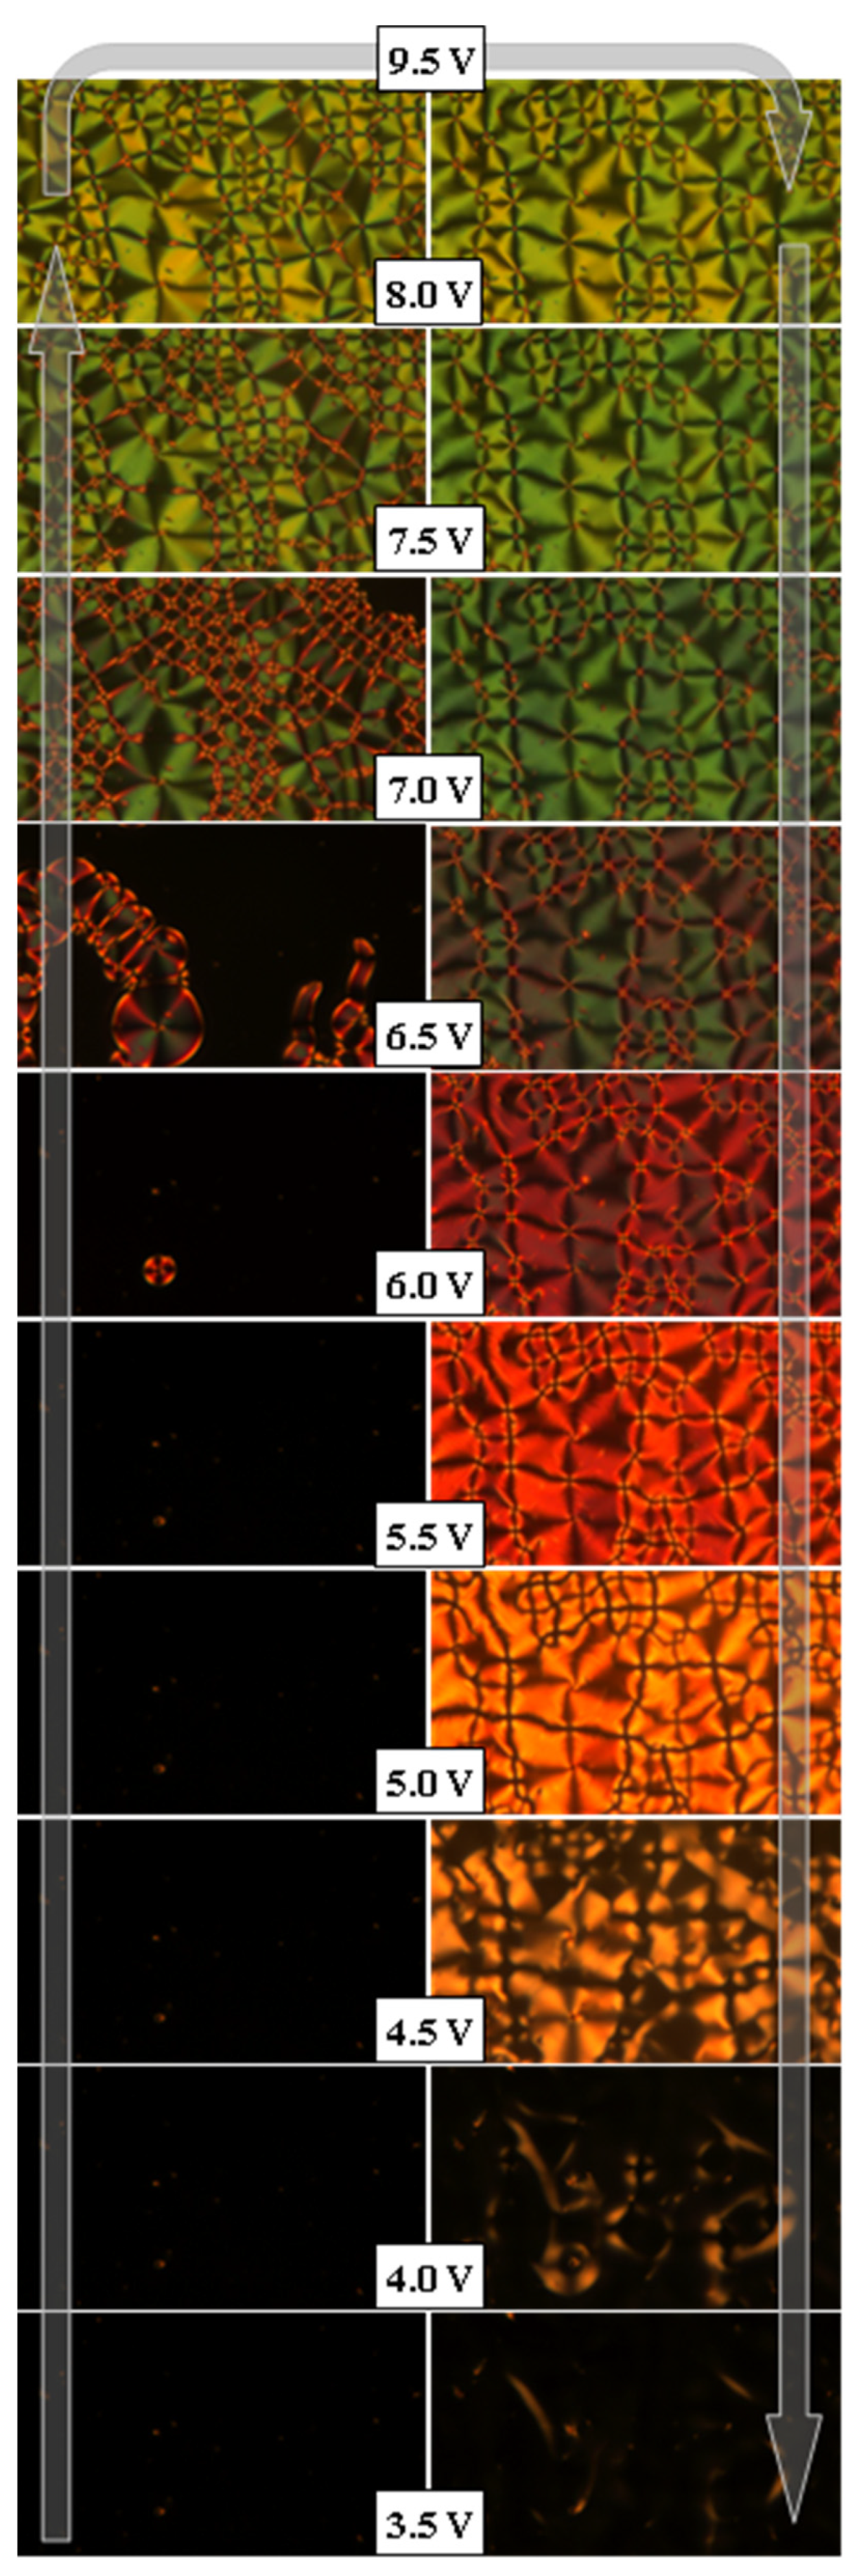
Fascinating images can be obtained using in-plane electrodes in planar rubbed cell (Figure 8b–f) by applying a variety of voltages in the vicinity of the N–NTB phase transition. Once again, sharp change is visible between switched (bright color) and non-switched states (dull color) demonstrate the first order of the transition (Figure 8b,c). Difference between the phases is clearly visible due to a small temperature gradient present in Figure 8c. When cooling the sample with a voltage applied, the self-deformation striped pattern appears with the stripes extending at an angle to the original rubbing direction (Figure 8d–f). Since for this material dielectric anisotropy is positive, this is one more confirmation that the stripes develop along the average director. Finally, for large fields, Figure 8f, the stripes are observed parallel to the electric field.
Based on the results of the experiment shown in Figure 8 and Figure 9, we conclude that a homeotropic aligned-cell containing materials/mixtures of negative Δε listed in Figure 2, with the AC field, applied across the cell shows a first order Fréedericksz reorientation in the NTB phase. In contrast, a classical N phase normally exhibits a second order transition [3], except when a large DC bias field is applied across the cell [39]. Here, the optical axis is realigned gradually and uniformly across the sample as the field exceeds the threshold. In the NTB phase, a reorientation of the optic axis seems to start only at isolated sites, and each site is presumably associated with the dust particle/s or a surface irregularity. The nucleating regions in the shape of asymmetric focal conic domains [40] coexist with the unswitched homeotropic state. Furthermore, the threshold voltage exhibits a significant hysteresis (Figure 9 has almost 3V difference between the left and the right columns). According to the data obtained for the same homeotropic geometry using PolScope [3], the deformations of the optical axis are of splay and saddle-splay type in the NTB phase.

3.6. Stripes in the NTB Phase

(i)
Planar-aligned cell
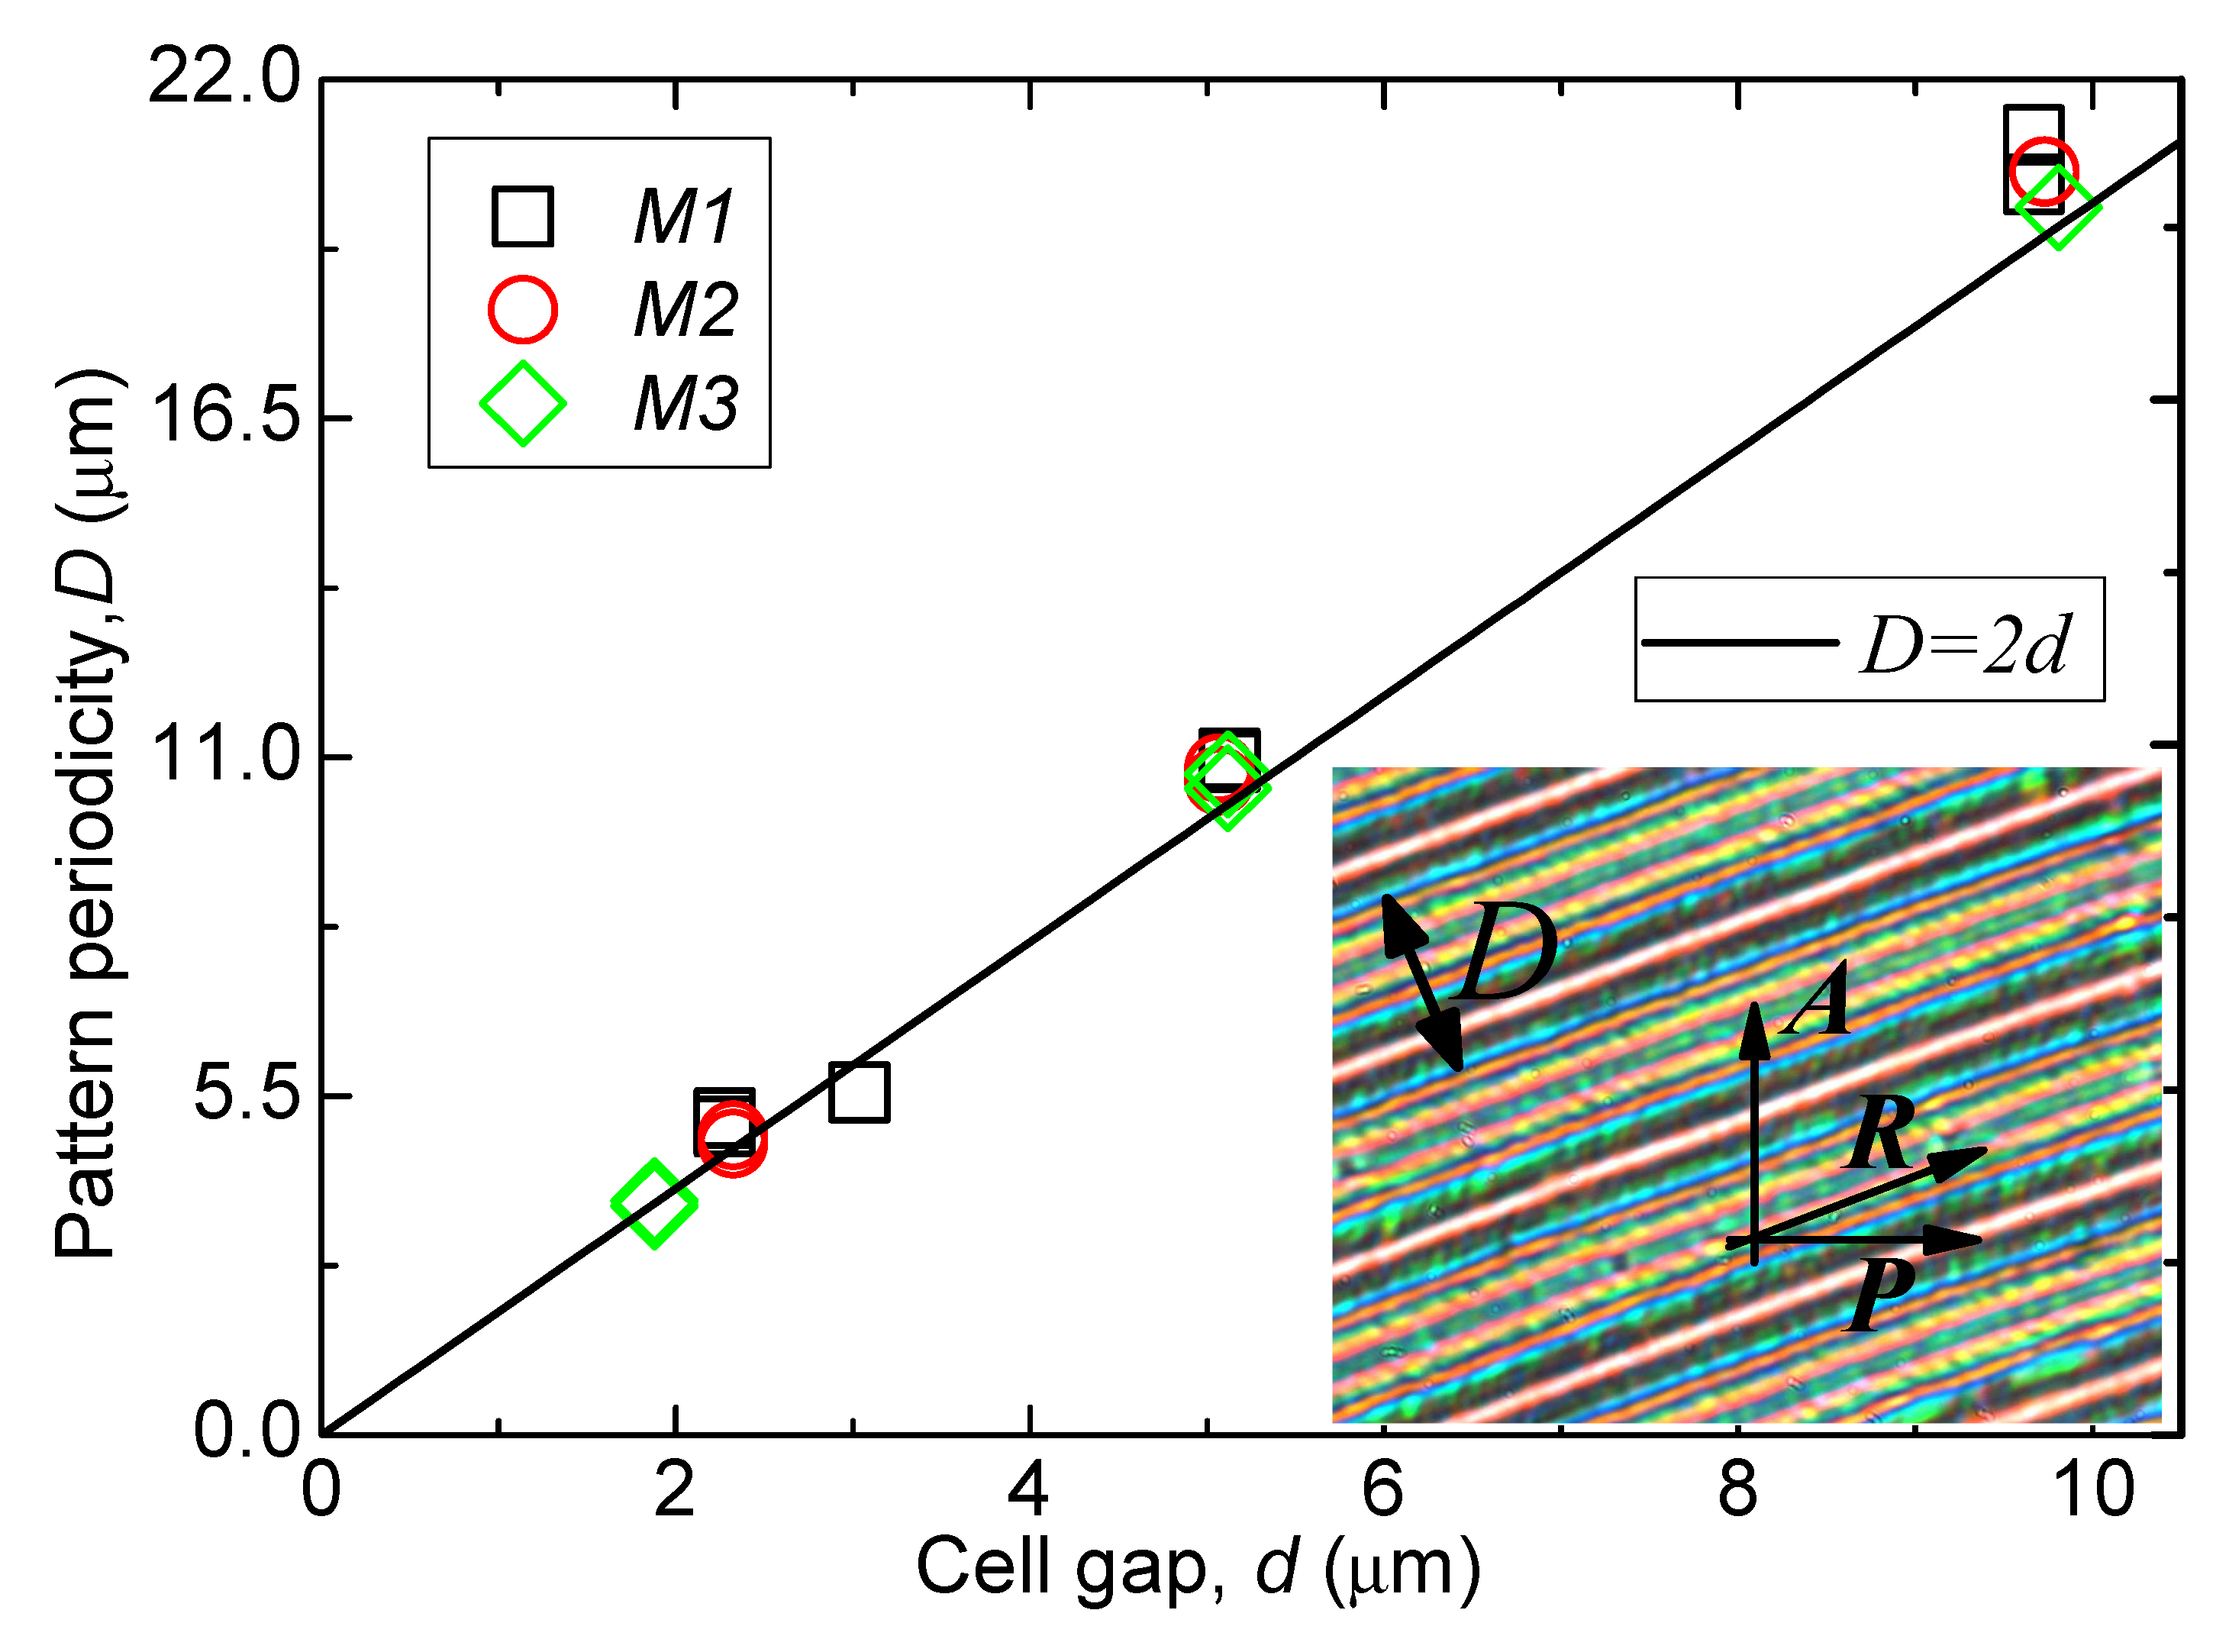
Beautiful stripes as observed in a thin planar-aligned cell under crossed-polarisers are shown in Figure 10 [15]. To explore these stripes further, the cell thickness in the experiment is varied from 2 μm to 10 μm. In the NTB phase, three materials (M1, M2, M3) exhibit uniform stripes parallel to the rubbing direction in each case. For each cell thickness, the width of a stripe or distance between the successive stripes, called ‘the stripe periodicity’, is 2 times the cell thickness. Periodicity is dependent only on the cell thickness, but is independent of temperature. Three bimesogen/dimer systems investigated here showed similar behaviour. The phenomenon is material-independent so long as it satisfies the criterion of exhibiting a twist-bend nematic phase. At much lower temperatures within the NTB, the stripe texture is too complex to be understood. For cell thicknesses greater than 12 µm, focal conic textures are observed. These are reminiscent of the typical texture of a smectic phase, discussed later. Nevertheless, an absence of smectic layers was confirmed by X-ray experiments [15] in this phase. For this reason, it was initially labelled as Nx (identified later as NTB). We refer to the virtual layers in the NTB as the pseudo-layers.
The stripes arise presumably as a direct consequence of mechanical Helfrich–Hurault instability due to an increase in the heliconical angle with a reduction in temperature, as discussed in Section 3.4, Figure 5 (red squares). This leads to a correlated decrease in the pseudo-layer thickness. These domains may have also arisen from an interaction of the flexoelectricity with the electric field produced by the surface polarisation. The pyroelectric data do show a rather strong surface polarisation signal both in the twisted and hybrid cell (planar alignment on one electrode and homeotropic on the second), even in the isotropic phase of the chemical systems investigated [36].
(ii)
Twisted liquid crystal cell
Not only do the planar-aligned cells exhibit beautiful stripes in the NTB phase discussed above, the twisted planar-aligned cells exhibit even more intriguing behaviour. The rubbing direction on the top electrode is at right angles to that on the bottom electrode. A delicate balance among the following variables: surfaces, material properties and the sample history, leads to display of a wide variety of patterns. Intriguingly, in some cases it is difficult to investigate patterns on account of the large sensitivity of their formation in experimental conditions. The material used in the LC cell is MGTP7, the composition of which is given in Figure 2, and it is characterised by a large negative Δε. The stripe periodicity is temperature dependent in a twisted cell in contrast to the temperature independence in a parallel-rubbed planar-aligned cell.
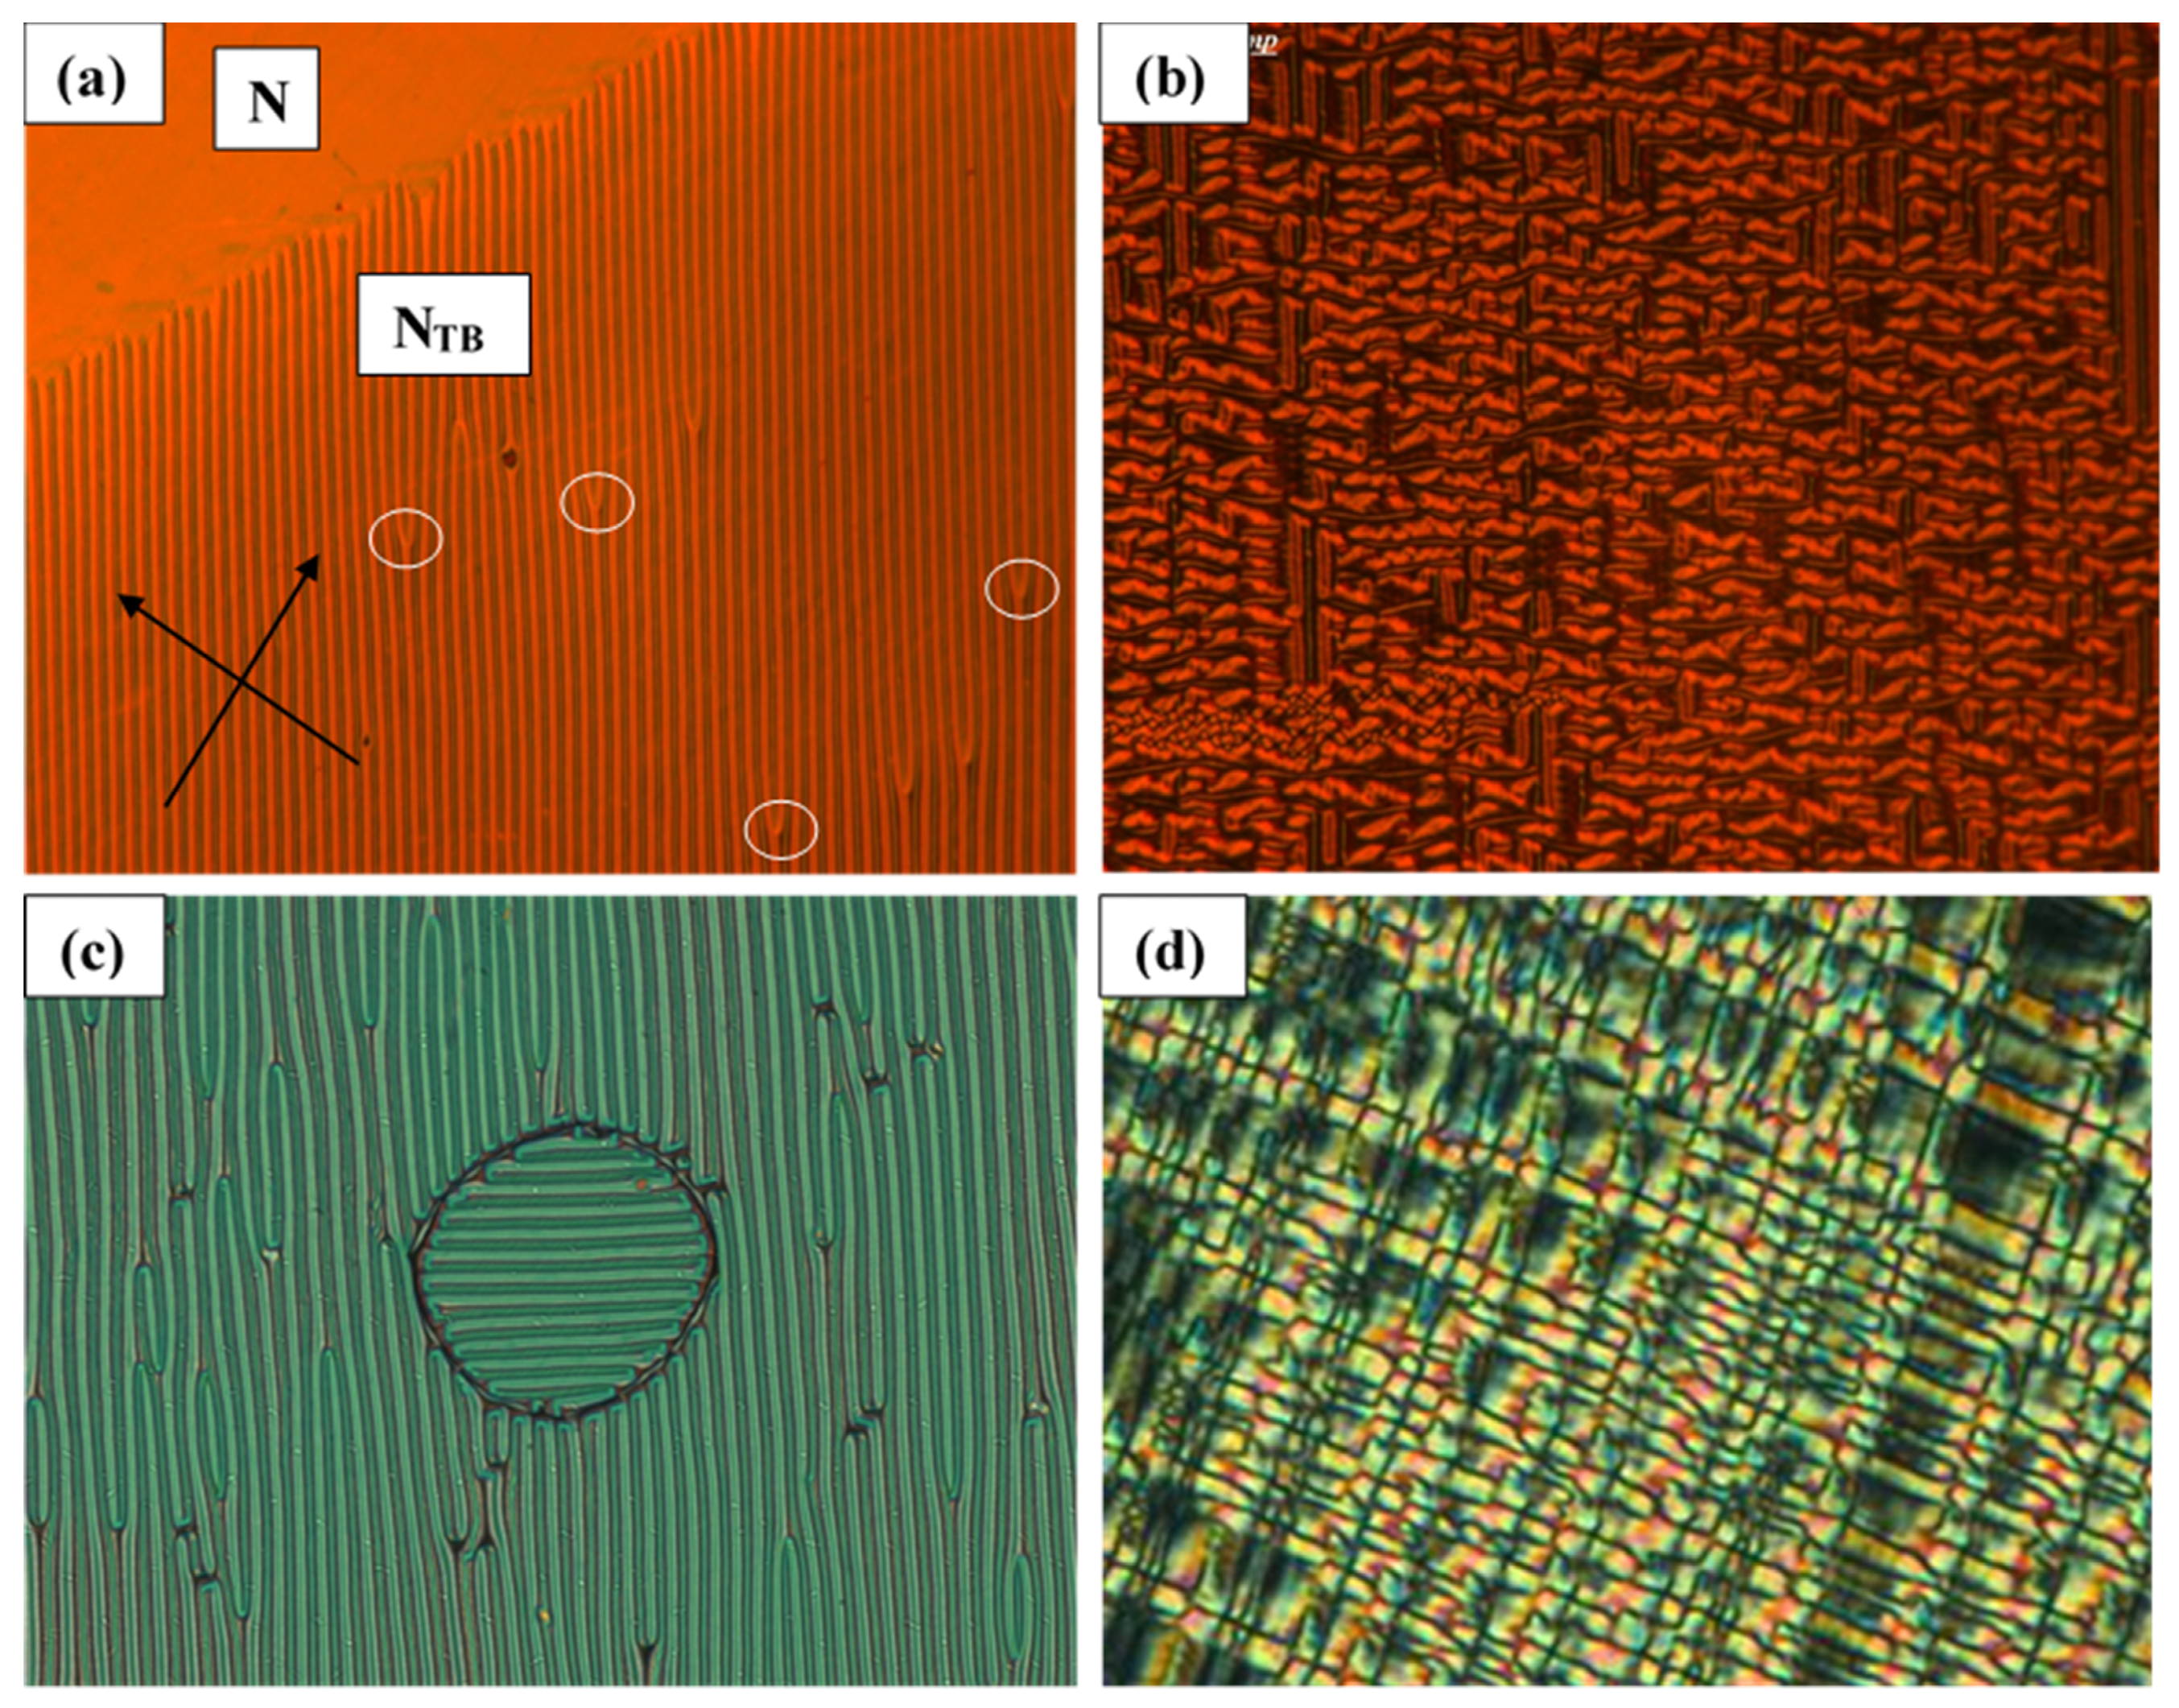
Due to the presence of a small temperature gradient in the cell, the top part of Figure 11a is at the highest temperature and is in the N phase. Some stripes discontinue (fork defects are created at places marked by white circles), this provides a space for the increase in the periodicity of the pattern at lower temperatures. The plot demonstrating detailed temperature dependence of the stripe periodicity in twisted cells is shown in Figure 12.
The texture in Figure 11b is recorded at a lower temperature of 4 °C than the transition temperature. The pattern formed is rather complex and only some stripes manage to survive. Two domains at right angles to each other are observed in a twisted cell (Figure 11c). An alternative pattern of ‘crosses’ is observed after an electric field is applied to a material with positive Δε planar-aligned in a twisted cell of thickness 8 μm. The temperature here is 5 °C below the N–NTB phase transition temperature.
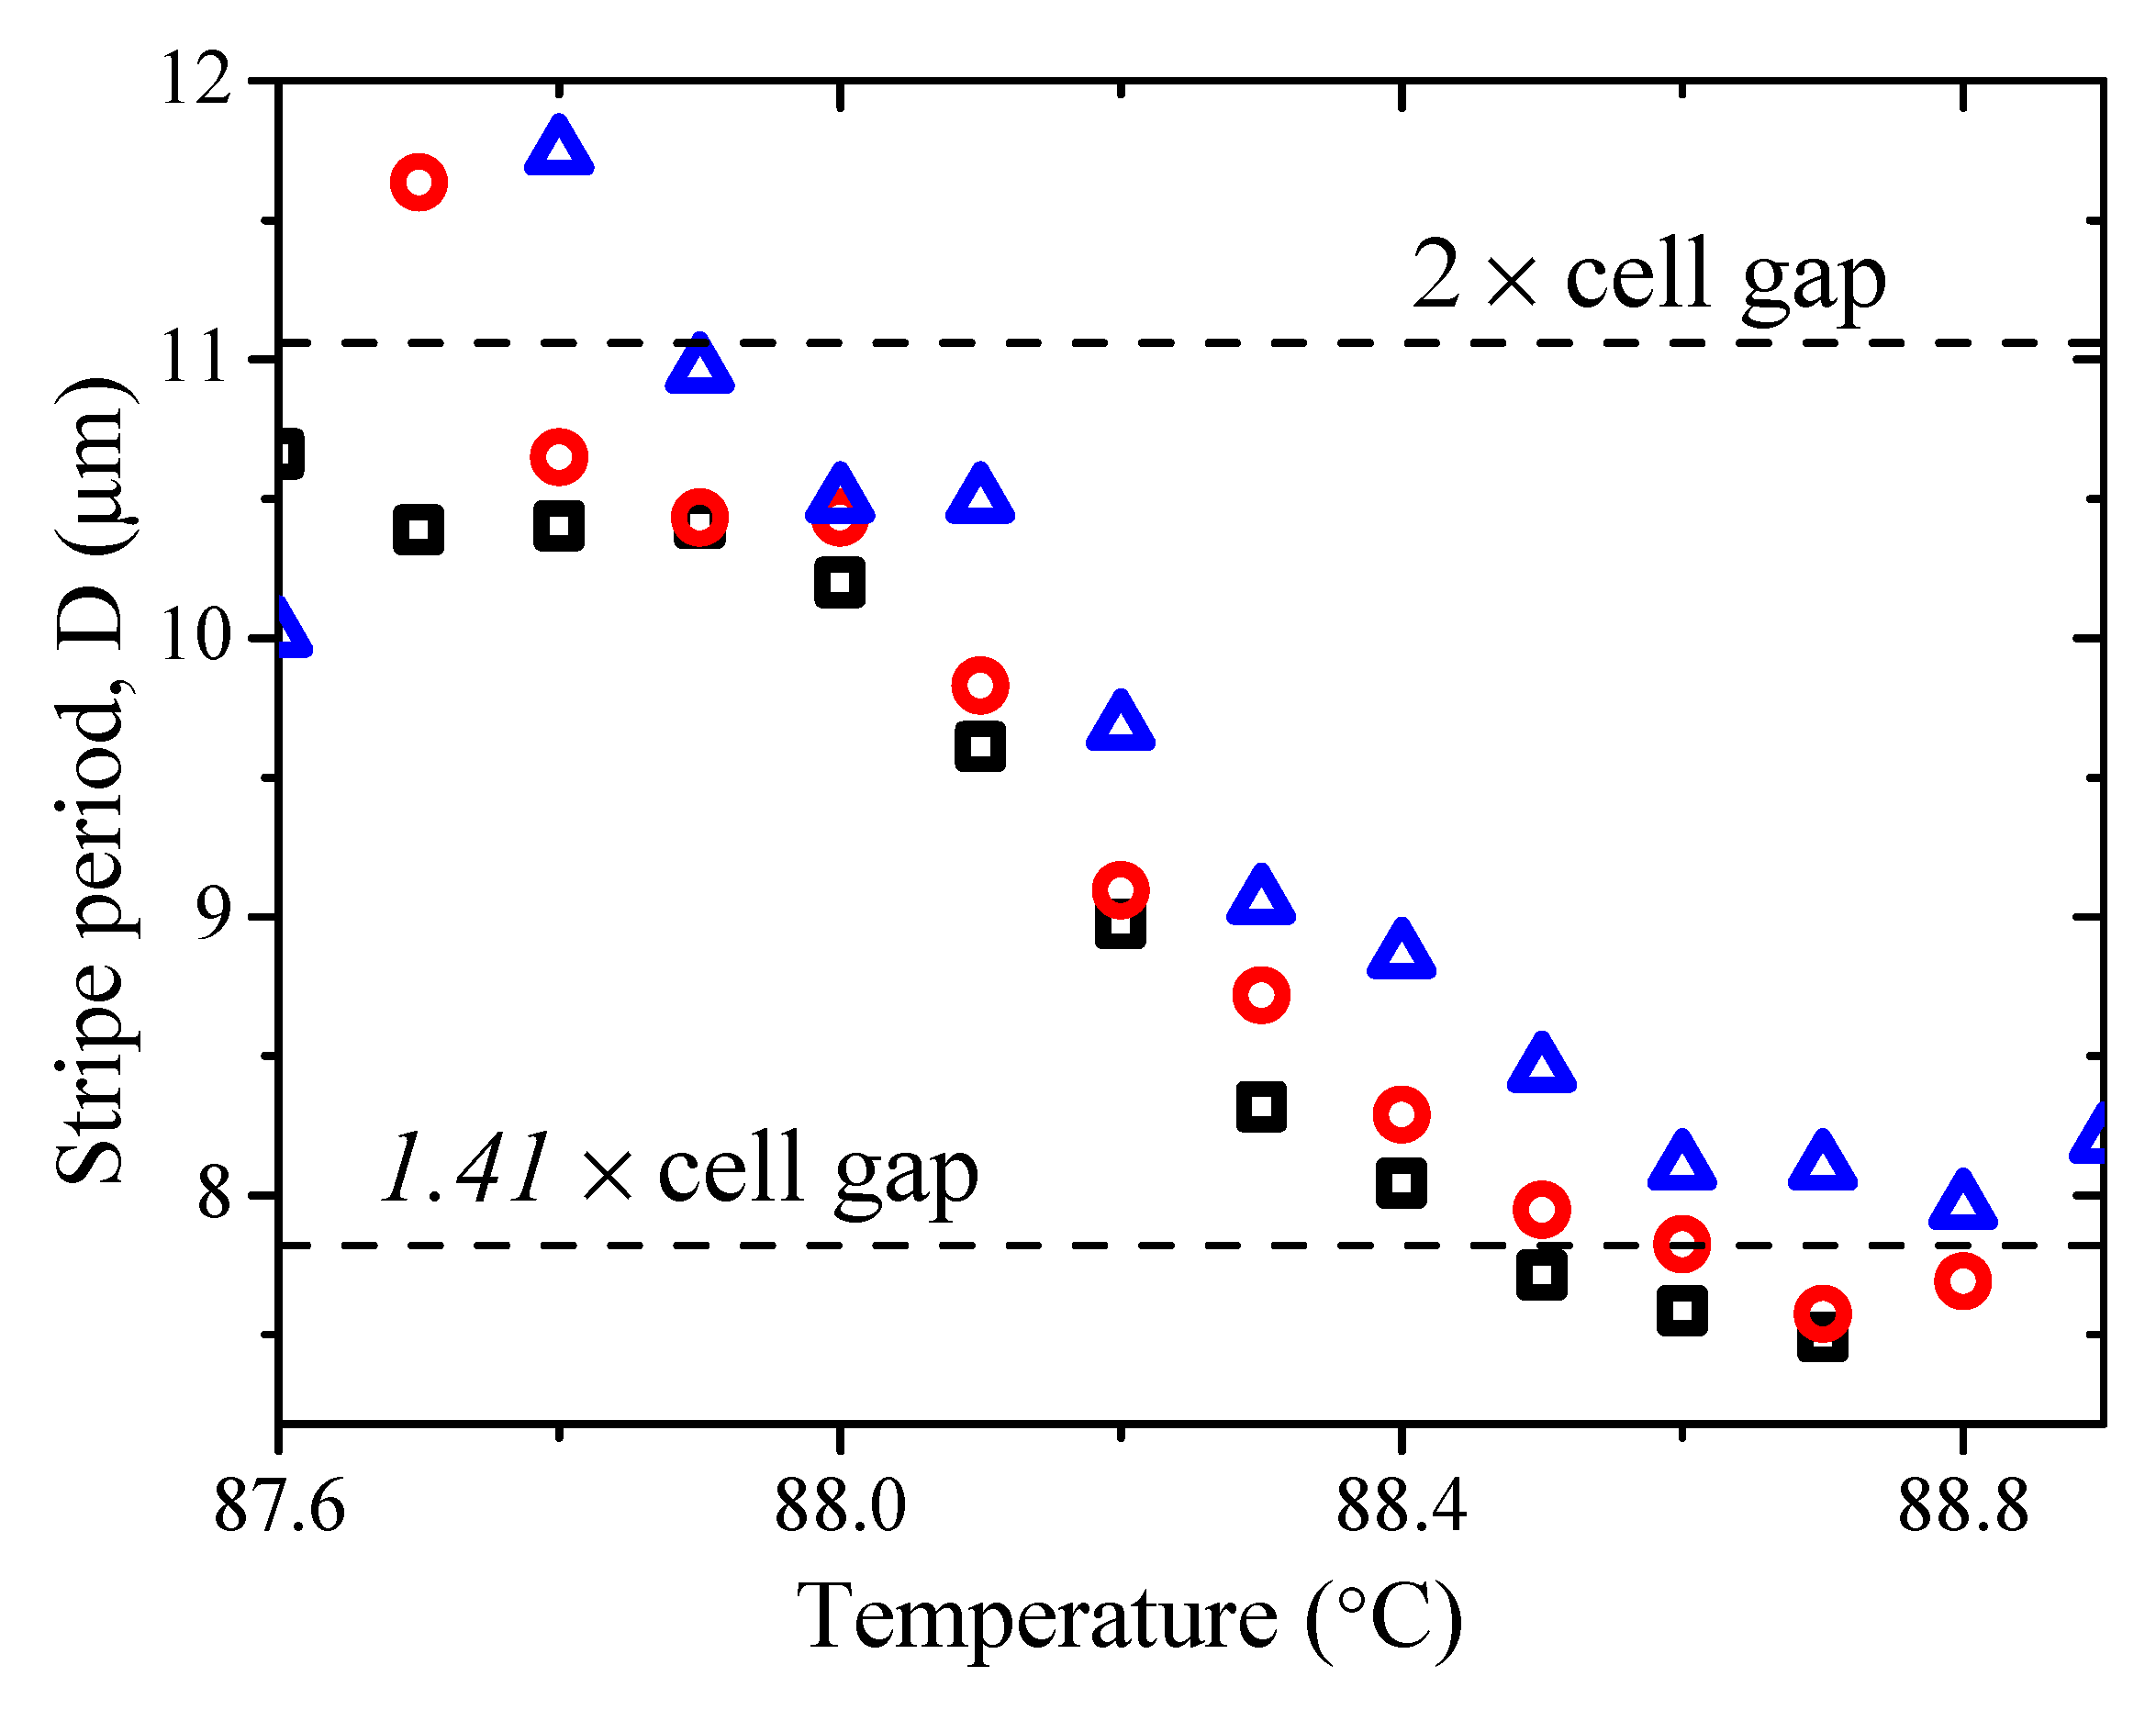
The stripe periodicity as a function of temperature in a twisted cell is shown in Figure 12. In a twisted cell, we note that the stripe periodicity D is temperature dependent, and it decreases with a reduction in temperature in the NTB. It would seem that twist distortions in the deformations of molecules ‘enable’ the formation of stripes with a periodicity different from the double cell gap. Here, the stripe periodicity varies between 1.4 and 2 times the cell gap, d. This behaviour is different from cells with parallel rubbing, where the liquid crystalline structure at micrometer hierarchy level demonstrates “binary” behaviour, either staying uniformly aligned, or forming double-cell-gap periodic pattern.
When we apply a square wave of frequency 10 Hz and amplitude 2 V at a temperature of 87.5 °C (just 0.5 °C) below the N–NTB transition temperature, some of the stripes start disappearing. The applied electric field seemingly suppresses the undulations of the pseudo-layers, see Figure 13. The undulations are suggested to be the cause of the emergence of stripes. The pseudo-layers lead to kinds of Chevron structures, where the molecules are bent in some cases.

3.7. Templating the Polymerised Structure of a Liquid Crystalline Phase

The NTB phase persists over a wide range of concentrations of the bimesogen mixed with non-NTB materials [
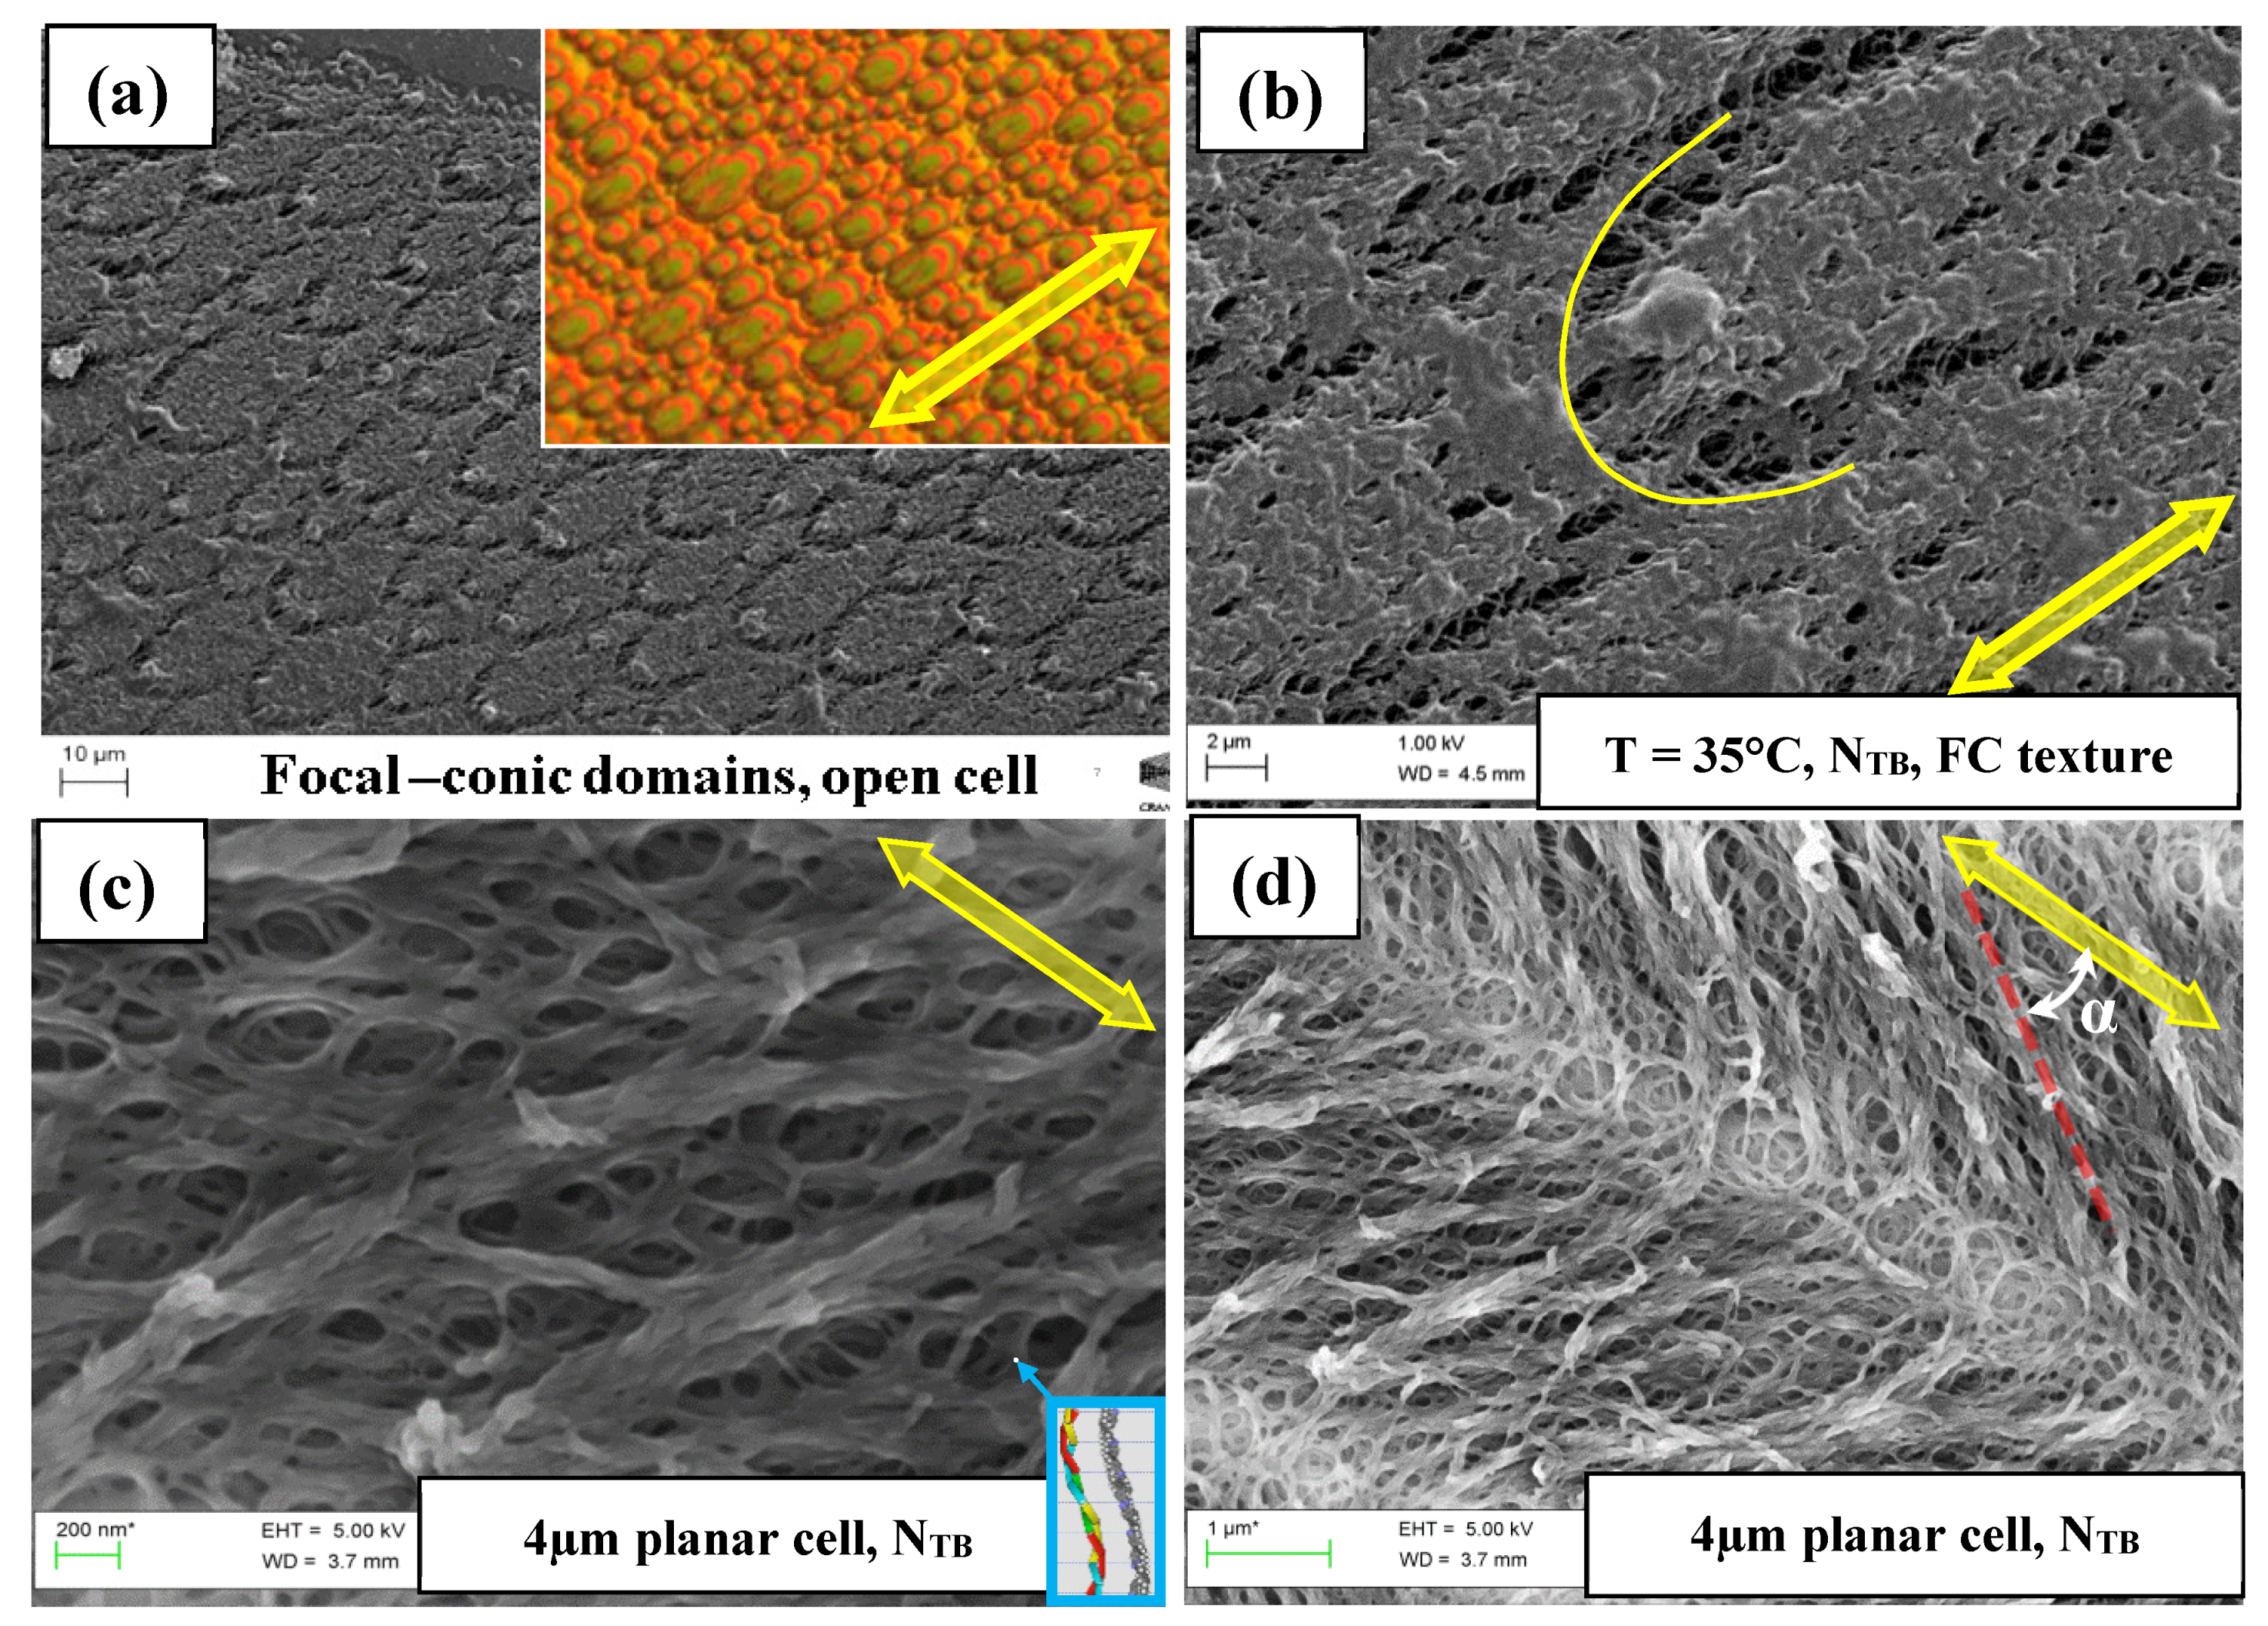
28]. The latter includes the monomer and a reactive mesogen RM257 photo-initiator. The planar-aligned cell filled with the mixture shows a variety of textures depending on the temperature and the phase. The reactive mesogen is also a liquid crystalline material. The molecules of the reactive mesogen fill up the voids and thus these follow the structure of the phase. In the phase of interest, the LC mixture is polymerised by shining UV light onto the sample through an optical microscope. A sponge-like polymer template of the structure of the ‘phase of interest’ is thus formed in the cell. Unpolymerised liquid crystalline material is washed away with acetone. The polymerised sponge has the structure of the phase prior to having the polymerisation initiated. The polymer so formed is imaged using SEM.
For SEM imaging, direct access to the surface of the sample is needed. Two sample preparation methods are used:
  • Open cell: An appropriate mixture prepared as above is dissolved in acetone. The liquid so formed is put onto a glass substrate which had previously been sputtered by indium tin oxide (ITO), and is spin-coated by the alignment layer. As the solvent evaporates, a film of several µm in thickness is formed on the substrate. It is then brought to a temperature of the NTB phase by heating. The film in the phase of interest is polymerised and afterwards scanned by SEM. The focal conic domains as observed are shown in Figure 14a. For examining the structural details, the image is scanned with a higher magnification of SEM, as shown in Figure 14b. Focal conic domains observed by POM in cells of thickness greater than 10 µm in colour are given in the inset. This method suffers from drawbacks such as the lack of control of the sample’s thickness, the effect of surface tension of the liquid on the shape of the film and the need to negate the effects of oxygen on polymerisation. One needs to perform experiments in an O2-free atmosphere or, alternatively, significantly increase the concentration of the photo-initiator.
  • Sandwiched cell: In this case, a standard commercial sandwich cell is used. The cell is filled with the mixture and is polymerised in the phase/texture of interest. Though we avoid some of the drawbacks of the first method, nevertheless, this technique may damage the structure of the phase in the sponge itself while the two substrates are pulled mechanically apart. However, we do expect that the polymer template retains the structure of the phase of interest in the middle of the cell. The structure corresponding to the NTB so formed is imaged by SEM, and images are shown in Figure 14c,d, the former scanned with a higher magnification of SEM than the latter.
A highly conductive sample is required for the SEM imaging. In most cases, a thin metal film needs to be deposited onto a polymer. However, the electron microscope (Zeiss ULTRAplus®/Geminy®) can satisfactorily image the samples without having to coat it with a metal, provided (i) the ITO coating is present on the glass substrate and (ii) the thickness of the polymer sponge is below 2 µm.
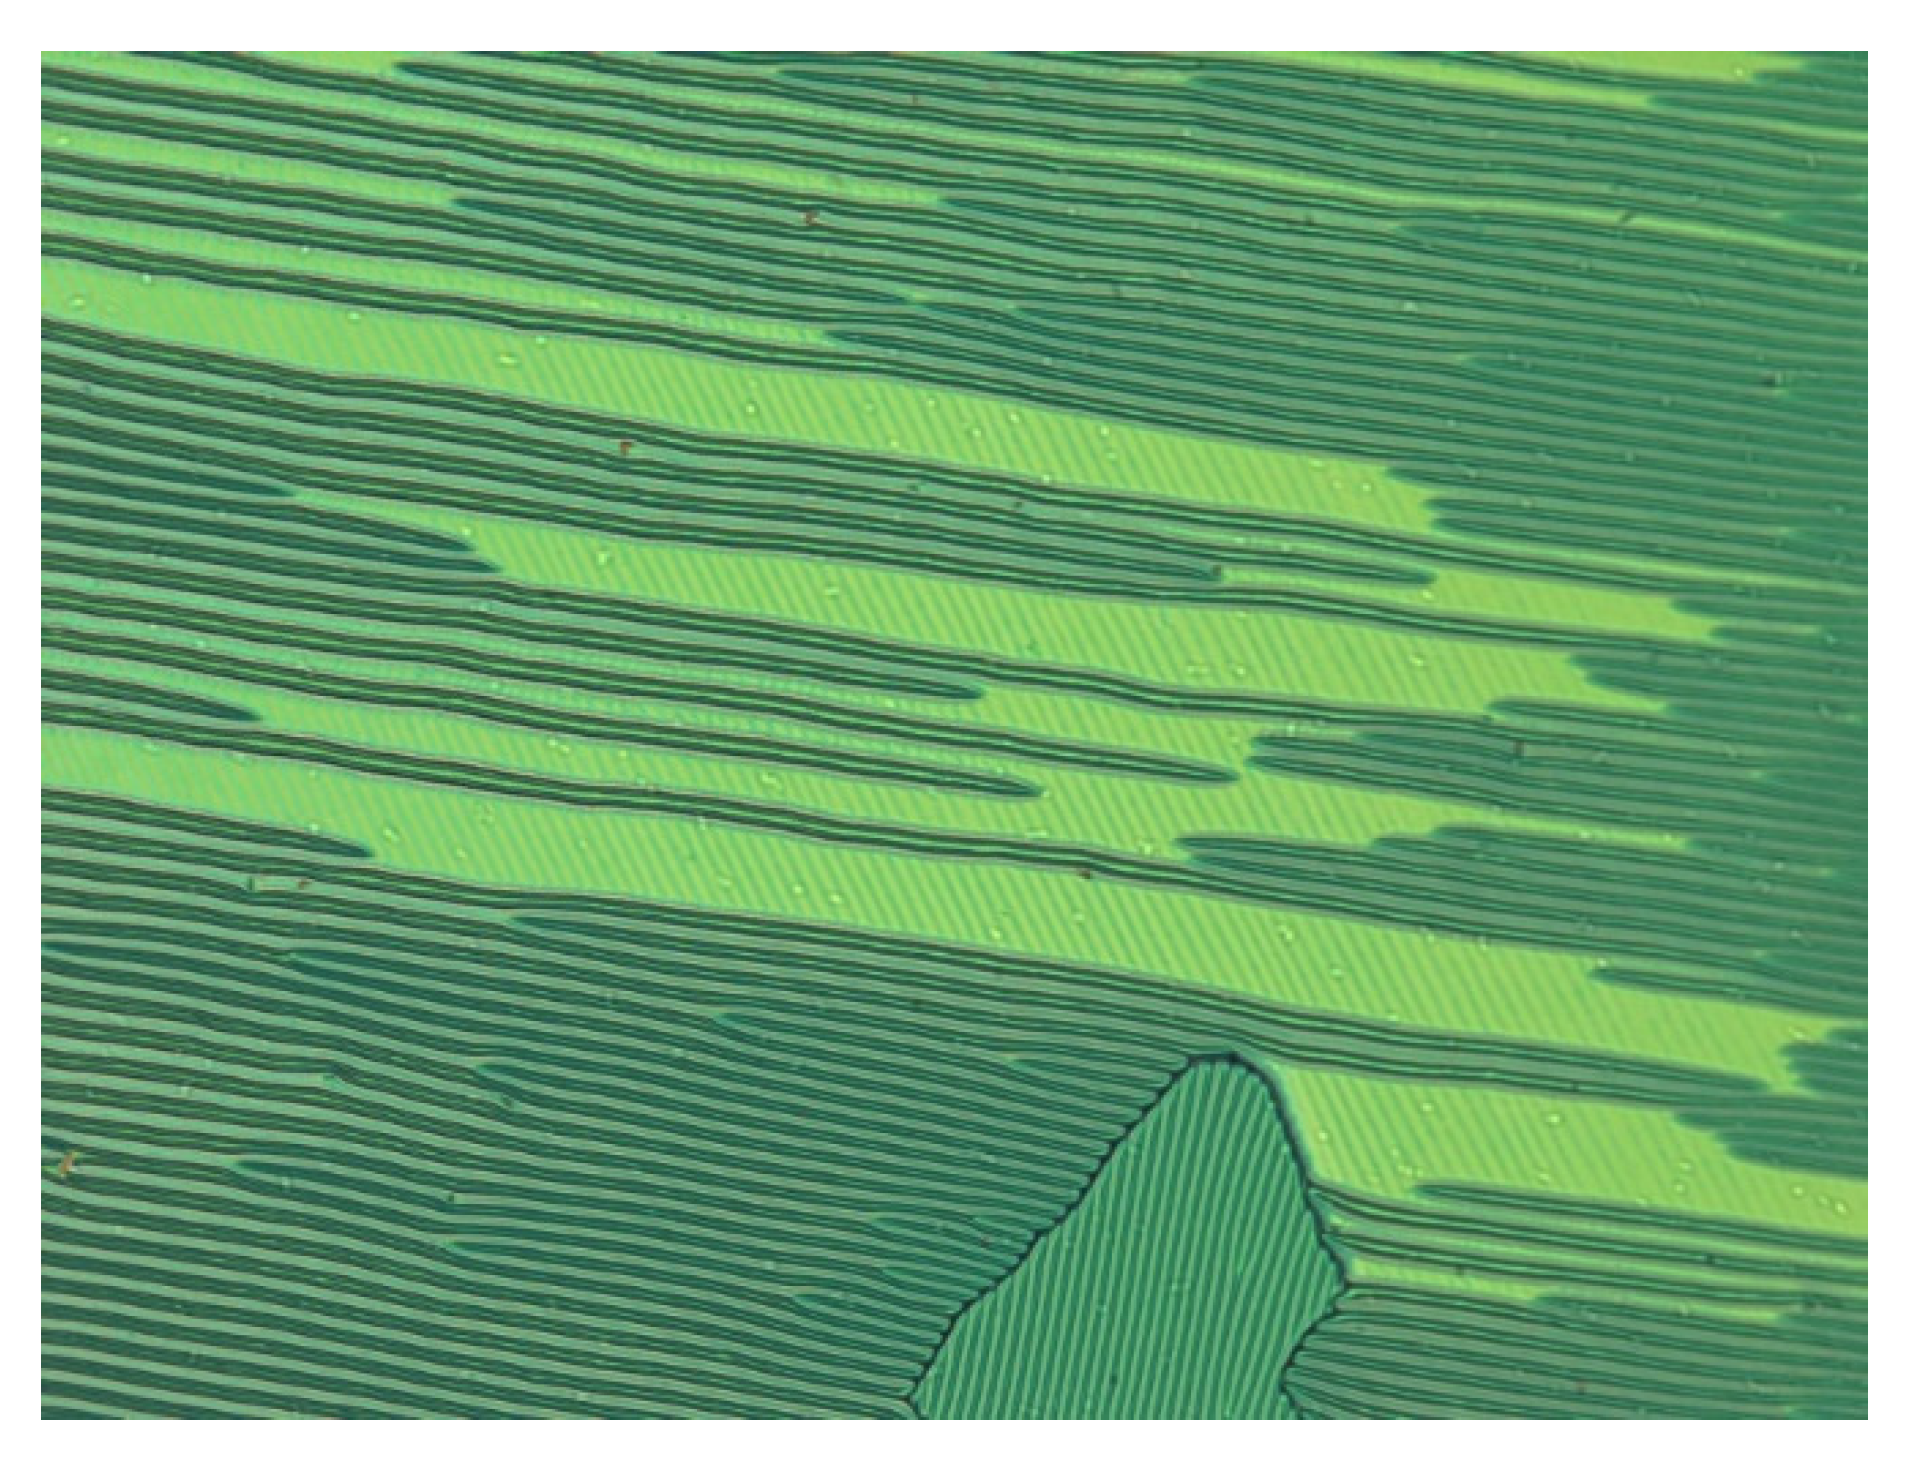
The results of the imaging of the structures are extremely interesting. The fish-bone structure shown in Figure 14d can explain the ‘saw-tooth’ pattern given in Figure 8b. The average director of the structure deviates from the rubbing direction in the cell by the applied electric field by a certain angle. Hence, the two sides of fish-bone texture exhibit dramatically different intensity levels between the crossed polarisers since on one side the ‘fish-bone’ angle α is subtracted from this angle, while on the other side it is added to it. Therefore, on one side of the fish-bone structure, the optical axis is parallel to the polariser/analyser and it appears dark, while on the other, it deviates by a significantly large angle and thus it appears bright.
Moreover, an analysis of the SEM images shown in Figure 14c,d and reported in [28] has led us to conclude that the ‘self-deformation stripes’ exhibit ‘fish-bone’-like structures at the micrometre level. Meanwhile, at the nanoscale level of the hierarchy, the phase is helical. Hence, it is an interesting challenge to determine the relationship between the helical axis and the direction of the ‘fish-bone’ structure. Since the fish-bone angle α approaches 45° at a lower temperature in the NTB phase, and it has a lower value closer to the N–NTB transition temperature, one can expect it to cross-over 22.5° at some temperature. In this case, the sign of the fast electro-optic response of fundamental frequency discussed in Section 3.2 and in [16] should change its sign, as is explained (supplementary material of Ref. [28]). Such a change in sign in the electro-optic response is observed in the terphenyl bimesogens M2 and M3 [28]. Therefore, we conclude that the helical axis of the nanoscale pitch is likely to lie along the ‘fish-bone’ observed on the micrometre scale.

4. Conclusions

The most intriguing electro-optic response observed from a class of biomesogens in parallel/antiparallel-rubbed planar-aligned cells inspired the use of highly sophisticated techniques in discovering the structure of a new nematic phase of helicity on a nanometre length scale As a result of several investigations, the phase is identified as the twist-bend nematic.
The Fréedericksz transition in the NTB phase is found as the first order in contrast to the second order observed in a conventional nematic phase. Switching, hysteresis and imaging data for Fréedericksz transition are presented for planar and homeotropic sandwich cells as well as for a planar cell with in-plane electrodes. In contrast to the previously reported data on the parallel-rubbed planar-aligned cell, the molecular self-deformation in twisted cells leads to temperature-dependent stripe periodicity.
We also present a number of fascinating patterns observed in twisted planar cells. In contrast to previously reported data on planar parallel cells, the self-deformation striped pattern are found to be temperature dependent. However, multitude of patterns and their strong dependence on surface conditions/sample history makes twisted cells a challenge for further studies.
The structure of the phase using the technique of LC–polymer template is imaged by SEM and analysed. An observed sign-reversal in the first-harmonic electro-optic response is explained by the SEM images of the structure. Though the structure of the twist-bend and its nanoscale helicity are well established, nevertheless, challenges still remain in explaining a variety of the observed phenomena of hierarchical self-assembly and explaining the parameters that stabilise the NTB phase and its transition under electric fields to the other types of nematics.

Author Contributions

V.P.P. designed experiments and carried out measurements on electro-optics and birefringence as a function of temperature and field. J.K.V. and G.H.M. designed and proposed the project, where G.H.M. designed and synthesized novel materials and J.K.V. proposed the use of a range of methods to explore the phase. J.-K.S. did earlier work on the design of electro-optic experiments in Dublin, measured elastic constants close to the N–NTB transition temperature and secured recent funding from Korean Science Foundation. All the authors contributed equally to the write-up of the manuscript and all have agreed to the published version of the manuscript. All authors have read and agreed to the published version of the manuscript.

Funding

J.-K.S. was supported by the National Research Foundation of Korea (NRF) funded by the Ministry of Science and ICT (NRF-2018R1D1A1B07048166) and by the ICT Creative Consilience program (IITP-2020-0-01821). V.P.P. was supported through the Brain Pool Program (NRF−2019H1D3A2A02060963) and Creative Challenge project (NRF-2020R1I1A1A01072707).

Institutional Review Board Statement

Not applicable.

Informed Consent Statement

Not applicable.

Data Availability Statement

The data if required are available on request from the authors.

Acknowledgments

We are privileged to be invited to write this paper for a Special Issue of the Journal ‘Crystals’ that celebrates the 80th birthday of Professor Noel A. Clark for his scientific leadership of the field of liquid crystals. One of the authors (J.K.V.) was privileged to work in his laboratory in the University of Colorado, Boulder in 1991 as a Fulbright Fellow and recalls the ongoing useful discussions at the group meetings led by Noel Clark. The SEM imaging was carried out at the Advanced Microscopy Laboratory (AML), Trinity College Dublin, Ireland. The AML (www.tcd.ie/crann/aml, accessed on 20 May 2021) is an SFI supported imaging and analysis centre, part of the CRANN Institute and is affiliated with the AMBER centre.

Conflicts of Interest

The authors declare no conflict of interest.

References

  1. Chen, H.; Gou, F.; Wu, S.-T. Submillisecond-response nematic liquid crystals for augmented reality displays. Opt. Mater. Express 2016, 7, 195–201. [Google Scholar] [CrossRef] [Green Version]
  2. Chen, D.; Porada, J.H.; Hooper, J.B.; Klittnick, A.; Shen, Y.; Tuchband, M.R.; Korblova, E.; Bedrov, D.; Walba, D.M.; Glaser, M.A.; et al. Chiral heliconical ground state of nanoscale pitch in a nematic liquid crystal of achiral molecular dimers. Proc. Natl. Acad. Sci. USA 2013, 110, 15931–15936. [Google Scholar] [CrossRef] [PubMed] [Green Version]
  3. Borshch, V.; Kim, Y.; Xiang, J.; Gao, M.; Jakli, A.; Panov, V.P.; Vij, J.K.; Imrie, C.; Tamba, M.; Mehl, G.H.; et al. Nematic twist-bend phase with nanoscale modulation of molecular orientation. Nat. Commun. 2013, 4, 2635. [Google Scholar] [CrossRef] [PubMed] [Green Version]
  4. Meyer, C.; Luckhurst, G.R.; Dozov, I. Flexoelectrically Driven Electroclinic Effect in the Twist-Bend Nematic Phase of Achiral Molecules with Bent Shapes. Phys. Rev. Lett. 2013, 111, 067801. [Google Scholar] [CrossRef] [PubMed]
  5. Reinitzer, F. Beiträge zur Kenntniss des Cholesterins. Mon. für Chem. Chem. Mon. 1888, 9, 421–441. [Google Scholar] [CrossRef]
  6. Gattermann, L.; Ritschke, A. Ueber Azoxyphenoläther. Eur. J. Inorg. Chem. 1890, 23, 1738–1750. [Google Scholar] [CrossRef] [Green Version]
  7. Yu, L.J.; Saupe, A. Observation of a biaxial nematic phase in potassium laurate-1-decanol-water mixtures. Phys. Rev. Lett. 1980, 45, 1000–1003. [Google Scholar] [CrossRef] [Green Version]
  8. Acharya, B.R.; Primak, A.; Kumar, S. Biaxial Nematic Phase in Bent-Core Thermotropic Mesogens. Phys. Rev. Lett. 2004, 92, 145506. [Google Scholar] [CrossRef] [Green Version]
  9. Merkel, K.; Kocot, A.; Vij, J.K.; Korlacki, R.; Mehl, G.H.; Meyer, T. Thermotropic Biaxial Nematic Phase in Liquid Crystalline Organo-Siloxane Tetrapodes. Phys. Rev. Lett. 2004, 93, 237801. [Google Scholar] [CrossRef] [Green Version]
  10. Chen, X.; Korblova, E.; Dong, D.; Wei, X.; Shao, R.; Radzihovsky, L.; Glaser, M.A.; Maclennan, J.E.; Bedrov, D.; Walba, D.M.; et al. First-principles experimental demonstration of ferroelectricity in a thermotropic nematic liquid crystal: Polar domains and striking electro-optics. Proc. Natl. Acad. Sci. USA 2020, 117, 14021–14031. [Google Scholar] [CrossRef]
  11. Mertelj, A.; Cmok, L.; Sebastián, N.; Mandle, R.J.; Parker, R.R.; Whitwood, A.C.; Goodby, J.W.; Čopič, M. Splay Nematic Phase. Phys. Rev. X 2018, 8, 041025. [Google Scholar] [CrossRef] [Green Version]
  12. Fernández-Rico, C.; Chiappini, M.; Yanagishima, T.; De Sousa, H.; Aarts, D.G.A.L.; Dijkstra, M.; Dullens, R.P.A. Shaping colloidal bananas to reveal biaxial, splay-bend nematic, and smectic phases. Science 2020, 369, 950–955. [Google Scholar] [CrossRef] [PubMed]
  13. Zhao, X.; Zhou, J.; Nishikawa, H.; Li, J.; Kougo, J.; Wan, Z.; Huang, M.; Aya, S. Observation of spontaneous helielectric nematic fluids: Electric Analogy to helimagnets. arXiv 2021, arXiv:2104.05362. [Google Scholar]
  14. Jang, Y.; Panov, V.P.; Kocot, A.; Vij, J.K.; Lehmann, A.; Tschierske, C. Optical confirmation of biaxial nematic (Nb) phase in a bent-core mesogen. Appl. Phys. Lett. 2009, 95, 183304. [Google Scholar] [CrossRef]
  15. Panov, V.P.; Nagaraj, M.; Vij, J.K.; Panarin, Y.P.; Kohlmeier, A.; Tamba, M.G.; Lewis, R.A.; Mehl, G.H. Spontaneous Periodic Deformations in Nonchiral Planar-Aligned Bimesogens with a Nematic-Nematic Transition and a Negative Elastic Constant. Phys. Rev. Lett. 2010, 105, 167801. [Google Scholar] [CrossRef] [PubMed] [Green Version]
  16. Panov, V.P.; Balachandran, R.; Nagaraj, M.; Vij, J.K.; Tamba, M.G.; Kohlmeier, A.; Mehl, G.H. Microsecond linear optical response in the unusual nematic phase of achiral bimesogens. Appl. Phys. Lett. 2011, 99, 261903. [Google Scholar] [CrossRef] [Green Version]
  17. Panov, V.P.; Balachandran, R.; Vij, J.K.; Tamba, M.G.; Kohlmeier, A.; Mehl, G.H. Field-induced periodic chiral pattern in the Nx phase of achiral bimesogens. Appl. Phys. Lett. 2012, 101, 234106. [Google Scholar] [CrossRef] [Green Version]
  18. Panov, V.P.; Vij, J.K.; Balachandran, R.; Borshch, V.; Lavrentovich, O.D.; Tamba, M.G.; Mehl, G.H. Properties of the self-deforming Ntb phase in mesogenic dimers. In Liquid Crystals XVII, Proceedings of the SPIE Organic Photonics + Electronics, San Diego, CA, USA, 25–29 August 2013; SPIE: Bellingham, WA, USA, 2013; Volume 8828. [Google Scholar] [CrossRef]
  19. Panov, V.P.; Vij, J.K.; Mehl, G.H. Twist-bend nematic phase in cyanobiphenyls and difluoroterphenyls bimesogens. Liq. Cryst. 2017, 44, 147–159. [Google Scholar] [CrossRef]
  20. Cestari, M.; Diez-Berart, S.; Dunmur, D.A.; Ferrarini, A.; De La Fuente, M.R.; Jackson, D.J.B.; Lopez, D.O.; Luckhurst, G.R.; Perez-Jubindo, M.A.; Richardson, R.M.; et al. Phase behavior and properties of the liquid-crystal dimer 1′′,7′′-bis(4-cyanobiphenyl-4′-yl) heptane: A twist-bend nematic liquid crystal. Phys. Rev. E 2011, 84, 031704. [Google Scholar] [CrossRef] [Green Version]
  21. Emsley, J.W.; Lesot, P.; Luckhurst, G.R.; Meddour, A.; Merlet, D. Chiral solutes can seed the formation of enantiomorphic domains in a twist-bend nematic liquid crystal. Phys. Rev. E 2013, 87, 040501. [Google Scholar] [CrossRef]
  22. Dozov, I. On the spontaneous symmetry breaking in the mesophases of achiral banana shaped liquid molecules. Europhys. Lett. 2001, 56, 247–253. [Google Scholar] [CrossRef]
  23. Goodby, J.W. Free volume, molecular grains, self-organisation, and anisotropic entropy: Machining materials. Liq. Cryst. 2017, 44, 1755–1763. [Google Scholar] [CrossRef] [Green Version]
  24. Yun, C.-J.; Vengatesan, M.R.; Vij, J.K.; Song, J.-K. Hierarchical elasticity of bimesogenic liquid crystals with twist-bend nematic phase. Appl. Phys. Lett. 2015, 106, 173102. [Google Scholar] [CrossRef] [Green Version]
  25. Zhu, C.; Tuchband, M.R.; Young, A.; Shuai, M.; Scarbrough, A.; Walba, D.M.; MacLennan, J.E.; Wang, C.; Hexemer, A.; Clark, N.A. Resonant CarbonK-Edge Soft X-ray Scattering from Lattice-Free Heliconical Molecular Ordering: Soft Dilative Elasticity of the Twist-Bend Liquid Crystal Phase. Phys. Rev. Lett. 2016, 116, 147803. [Google Scholar] [CrossRef] [PubMed] [Green Version]
  26. Stevenson, W.D.; Ahmed, Z.; Zeng, X.B.; Welch, C.; Ungar, G.; Mehl, G.H. Molecular organization in the twist–bend nematic phase by resonant X-ray scattering at the Se K-edge and by SAXS, WAXS and GIXRD. Phys. Chem. Chem. Phys. 2017, 19, 13449–13454. [Google Scholar] [CrossRef] [Green Version]
  27. Saha, R.; Feng, C.; Welch, C.; Mehl, G.H.; Feng, J.; Zhu, C.; Gleeson, J.; Sprunt, S.; Jákli, A. The interplay between spatial and heliconical orientational order in twist-bend nematic materials. Phys. Chem. Chem. Phys. 2021, 23, 4055–4063. [Google Scholar] [CrossRef] [PubMed]
  28. Panov, V.P.; Sreenilayam, S.P.; Panarin, Y.P.; Vij, J.K.; Welch, C.J.; Mehl, G.H. Characterization of the Submicrometer Hierarchy Levels in the Twist-Bend Nematic Phase with Nanometric Helices via Photopolymerization. Explanation for the Sign Reversal in the Polar Response. Nano Lett. 2017, 17, 7515–7519. [Google Scholar] [CrossRef] [Green Version]
  29. Panov, V.P.; Varney, M.C.M.; Smalyukh, I.I.; Vij, J.K.; Tamba, M.G.; Mehl, G.H. Hierarchy of Periodic Patterns in the Twist-bend Nematic Phase of Mesogenic Dimers. Mol. Cryst. Liq. Cryst. 2015, 611, 180–185. [Google Scholar] [CrossRef] [Green Version]
  30. Merkel, K.; Kocot, A.; Vij, J.K.; Shanker, G. Distortions in structures of the twist bend nematic phase of a bent-core liquid crystal by the electric field. Phys. Rev. E 2018, 98, 022704. [Google Scholar] [CrossRef] [PubMed] [Green Version]
  31. Pająk, G.; Longa, L.; Chrzanowska, A. Nematic twist–bend phase in an external field. Proc. Natl. Acad. Sci. USA 2018, 115, E10303–E10312. [Google Scholar] [CrossRef] [Green Version]
  32. Tomczyk, W.; Longa, L. Role of molecular bend angle and biaxiality in the stabilization of the twist-bend nematic phase. Soft Matter 2020, 16, 4350–4357. [Google Scholar] [CrossRef]
  33. Meyer, C.; Blanc, C.; Luckhurst, G.R.; Davidson, P.; Dozov, I. Biaxiality-driven twist-bend to splay-bend nematic phase transition induced by an electric field. Sci. Adv. 2020, 6, eabb8212. [Google Scholar] [CrossRef] [PubMed]
  34. Merkel, K.; Loska, B.; Welch, C.; Mehl, G.H.; Kocot, A. Molecular biaxiality determines the helical structure—Infrared measurements of the molecular order in the nematic twist-bend phase of difluoro terphenyl dimer. Phys. Chem. Chem. Phys. 2021, 23, 4151–4160. [Google Scholar] [CrossRef]
  35. Coles, H.J.; Musgrave, B.; Coles, M.J.; Willmott, J. The effect of the molecular structure on flexoelectric coupling in the chiral nematic phase. J. Mater. Chem. 2001, 11, 2709–2716. [Google Scholar] [CrossRef]
  36. Balachandran, R.; Panov, V.P.; Panarin, Y.P.; Vij, J.K.; Tamba, M.G.; Mehl, G.H.; Song, J.K. Flexoelectric behavior of bimesogenic liquid crystals in the nematic phase—Observation of a new self-assembly pattern at the twist-bend nematic and the nematic interface. J. Mater. Chem. C 2014, 2, 8179–8184. [Google Scholar] [CrossRef]
  37. Haller, I. Thermodynamic and static properties of liquid crystals. Prog. Solid State Chem. 1975, 10, 103–118. [Google Scholar] [CrossRef]
  38. Emsley, J.W.; Lelli, M.; Joy, H.; Tamba, M.-G.; Mehl, G.H. Similarities and differences between molecular order in the nematic and twist-bend nematic phases of a symmetric liquid crystal dimer. Phys. Chem. Chem. Phys. 2016, 18, 9419–9430. [Google Scholar] [CrossRef]
  39. Shi, J. Criteria for the first order Freedericksz transitions. Liq. Cryst. 2002, 29, 121–125. [Google Scholar] [CrossRef]
  40. Li, Z.; Lavrentovich, O.D. Surface anchoring and growth pattern of the field-driven first-order transition in a smectic-A liquid crystal. Phys. Rev. Lett. 1994, 73, 280–283. [Google Scholar] [CrossRef] [PubMed] [Green Version]
  41. Tuchband, M.R.; Shuai, M.; Graber, K.A.; Chen, D.; Zhu, C.; Radzihovsky, L.; Klittnick, A.; Foley, L.M.; Scarbrough, A.; Porada, J.H.; et al. Double-Helical Tiled Chain Structure of the Twist-Bend Liquid Crystal phase in CB7CB. 2017. Available online: https://arxiv.org/abs/1703.10787 (accessed on 20 May 2021).
Figure 1. The polarising microscope set-up for electro-optical experiments. An LC cell is mounted in the hot-stage. The Polariser (P) and the Analyser (A) of the microscope are crossed with each other. The photodiode is mounted in the camera port. The output is connected to the National Instrument Data Acquisition Board (DAQ) and to the different input channels of the oscilloscope. The signal across the cell is also drawn from DAQ and is amplified by the power amplifier as needed.
Crystals 11 00621 g001
Figure 2. Liquid crystalline materials used.
Crystals 11 00621 g002
Figure 3. Oscillograms of the electro-optical response in the N and NX phases of M2. Channels: Magenta—applied voltage, Yellow—AC-coupled photodiode signal, Blue—DC-coupled photodiode signal. (a) The response from a planarly aligned cell in nematic phase, the amplitude of signal applied: 10 Vpeak to peak. The maximum output is ~ 1mV, arising presumably from the defects in an LC cell. (b) Square waveform of amplitude 101 Vpeak to peak applied to the cell in the NX phase, the output peak to peak: 200 mV, rise time (response signal rising from 10% to 90% of the final value) is 4.52 μs. The fall time (response signal falling from 90% to 10%) is 4.40 μs. The DC output mean voltage: 4.5 V, (c) the response of LC cell to a triangular waveform in the Nx phase: peak to peak input signal 38.4 V, output is a linear response of amplitude 166 mV peak to peak, DC component 4.37 V. (d) Response from a linear voltage sweep of 38 V applied, the output: linear, and peak to peak is 177 mV, fall time: 3.95 μs.
Crystals 11 00621 g003
Figure 4. A 2 μm commercial (ECH®, Japan) planar-aligned cell in the NX phase [16]. Stripes observed are parallel to the rubbing direction. Discontinuities in the stripe pattern indicate the domain boundaries of opposite chirality. Identification of the chirality became possible via application of an electric field. The area marked by red dots corresponds to the domain of a single chirality, for example.
Crystals 11 00621 g004
Figure 5. Optical retardation for the fluorinated dimer M2 (DTC3C11) plotted as a function of temperature in both N and NTB phases. Δn is ~3.6% lower than its maximum value in the N phase, and it is ~ 11% lower than the value obtained via power-law extrapolation. Black circles: the experimental data on optical retardation, blue-dash dotted line is the power-law extrapolation, the magenta arrow: the lower boundary of the data used for fitting, red squares represent the calculated θc. The vertical lines are drawn for temperatures under discussion.
Crystals 11 00621 g005
Figure 6. Plot of the ‘Optical Retardation’ (OPR) vs. applied voltage applied across a planar-aligned cell for temperatures in both N and NTB phases. Material used is M1 with Δε > 0. Black arrows correspond to the field increasing and decreasing in the NTB phase. Red squares correspond to the data in the N phase.
Crystals 11 00621 g006
Figure 7. The threshold voltage (Vth) plotted as a function of temperature for the Fréedericksz transition. First cycle: Vth for the square wave amplitude increasing is plotted as black squares, Vth for the amplitude decreasing is plotted as red circles. Second cycle: Vth for both increasing and decreasing amplitudes of the square waveform are shown by green ‘up’ and blue ‘down’ triangles, respectively.
Crystals 11 00621 g007
Figure 8. P and A refer to Polariser and Analyser, respectively. The material used is M1 having Δε > 0.8 (a) Fréedericksz transition in a temperature gradient cell. Bottom right—switched state, Top left—non-switched state. Note the sharp changes in the tone of colour between switched and non-switched states. These textures confirm the nature of the N–NTB transition: first order. A commercial planar cell of thickness 5µm is used, (EHC®) square wave of amplitude 4.5 V, frequency 1 kHz is applied. White bar length is 100 µm. Temperature 0.3 °C below the N–NTB transition temperature. (bf) Cell with in-plane electrodes. The cell gap is 7 µm, antiparallel rubbing is normal to the electric field, distance between the electrodes is 180 µm. (b) 0.3 °C below the N–NTB transition. Sharp changes between the switched and non-switched states are visible like those in a planar-aligned cell shown in (a). (c) N–NTB transition under electric field with a small temperature gradient in the cell is demonstrated here. Note that a sharp increase in the threshold voltage observed in the NTB phase and disclination lines in the middle of the cell are different in the two phases. (d) The cell is cooled to temperatures of the striped NTB while voltage is applied across the cell. The stripes are formed at an angle to the rubbing direction. (e) Higher voltage leads to stronger deviation of the striped pattern from the rubbing direction. (f) The cell is completely switched by the extremely large electric field applied—consequently, the stripes are parallel to the field direction; however, the competition between the surface alignment and the electric field distorts the pattern, making it rather similar to that exhibited by a twisted cell discussed later.
Crystals 11 00621 g008
Figure 9. Polarising microscope image of the bend Fréedericksz transition in the NTB phase just below N–NTB transition in homeotropically aligned cell. Each image frame is 0.5 mm. The material MGTP7 with Δε < 0 is used. T = 86.7 °C, 5.7 µm homeotropic cell. Recording of textures was automatically initiated with a voltage step of 0.5 V0-Pk. A delay time of 30 min was inserted in the program for recording the results between the two successive data points. Voltage range in the experiment varies from: 0 to 9.5 V0-Pk square wave. Only textures for selected voltages are displayed to avoid having too many images, the in-between omitted textures are not significantly different from those displayed. In the left column of the figure, the applied voltage is increasing and in the right column the voltage is decreasing. We observe (i) sharp boundaries between the switched (bright) and the un-switched (dark) states (areas here) as well as the (ii) differences in between the threshold voltages between the two columns.
Crystals 11 00621 g009
Figure 10. Pattern periodicity plotted as a function of the cell gap varying from 2 to 10 µm. A cell for each thickness is planarly aligned and similarly prepared. Materials used are M1, M2 and M3. The inset in the figure shows beautiful stripes [15].
Crystals 11 00621 g010
Figure 11. Material used is MGTP7. The NTB textures are recorded in the planar-twist-aligned cells. µm. (a) Texture in the vicinity of the N–NTB transition. The cell gap is 5.53 µm. The stripes emerge spontaneously at a temperature just below the N–NTB transition temperature, the stripes direction bisects the angle between the two rubbing directions of the cell. Stripe periodicity in this cell is a function of temperature in the NTB. In case of a small temperature gradient in the cell, the stripe periodicity is adjusted via fork defects (highlighted by the white circles). (b) Temperature is 4 °C below the phase transition temperature, a complex 2-dimensional pattern is seen replacing the stripes. (c) Temperature is 1 °C below the N–NTB transition temperature. No field is applied. The polarisers are vertical and horizontal to the figure here. The rubbing direction on each electrode is ~45° to the polariser direction. Two stripe-domains are seen at ± 45° to the polariser direction. (d) An alternative pattern of ‘crosses’ is observed after an application of the electric field applied to a positive Δε, material M1 in a twisted cell of 8 μm thickness. Temperature is 5 °C below the N–NTB phase transition.
Crystals 11 00621 g011
Figure 12. The observed stripe periodicity in a twisted cell as a function of temperature on cooling. Material used is MGTP7. The cell gap d = 5.53 µm, of a commercial EHC® 90° twist-aligned cell. Different symbols indicate the data collected from three different locations in the sample.
Crystals 11 00621 g012
Figure 13. Material used: MGTP7. The twisted cell at a temperature 0.5 °C below the N–NTB transition temperature with a square waveform of amplitude 2 V applied. Some of the stripes start disappearing following application of electric field across a planar-aligned twisted cell. Striped patterns of three different directions can be observed in the same cell.
Crystals 11 00621 g013
Figure 14. The hierarchy of structures seen by the SEM images. Yellow arrows indicate the rubbing direction. (a,b) Focal conic domains in the open cell. (a) The scale bar is 10 µm. Colour inset—similar pattern in 13 µm-thick planar cell under POM. (b) The scale bar is 2µm. Yellow line highlights the boundary of a single focal conic domain. (c,d) 4µm-thick planar cell. The scale bar is 200 nm in (c). Detailed images show submicron structures. A small white dot at the tip of the pale blue arrow corresponds approximately to the size of 8 nm helical pitch discussed in [41]. (d) The scale bar is 1µm. Wider field of view image of the same sample shows a fragment of self-deformation (double cell gap) stripe and fish-bone texture that forms it. We define α as a ‘fish-bone angle’ [28].
Crystals 11 00621 g014
Publisher’s Note: MDPI stays neutral with regard to jurisdictional claims in published maps and institutional affiliations.

