Article

Microstructural Characteristics of Frazil Particles and the Physical Properties of Frazil Ice in the Yellow River, China

1
State Key Laboratory of Coastal and Offshore Engineering, Dalian University of Technology, Dalian 116024, China
2
Yellow River Institute of Hydraulic Research, Zhengzhou 450003, China
*
Authors to whom correspondence should be addressed.
Crystals 2021, 11(6), 617; https://doi.org/10.3390/cryst11060617
Submission received: 30 March 2021 / Revised: 10 May 2021 / Accepted: 17 May 2021 / Published: 31 May 2021
(This article belongs to the Special Issue Frazil Ice—Physical and Engineering Aspects)

Abstract

:
Frazil particles, ice crystals or slushy granules that form in turbulent water, change the freezing properties of ice to create “frazil ice”. To understand the microstructural characteristics of these particles and the physical properties of frazil ice in greater depth, an in situ sampler was designed to collect frazil particles in the Yellow River. The ice crystal microstructural characteristics of the frazil particles (morphology, size, air bubble, and sediment) were observed under a microscope, and their nucleation mechanism was analyzed according to its microstructure. The physical properties of frazil ice (ice crystal microstructure, air bubble, ice density, and sediment content) were also observed. The results showed that these microstructures of frazil particles can be divided into four types: granular, dendritic, needle-like, and serrated. The size of the measured frazil particles ranged from 0.1 to 25 mm. Compared with columnar ice, the crystal microstructure of frazil ice is irregular, with a mean crystal diameter less than 5 mm extending in all directions. The crystal grain size and ice density of frazil ice are smaller than columnar ice, but the bubble and sediment content are larger.

Graphical Abstract

1. Introduction

The existence of frazil particles contributes greatly to the formation and evolution of river ice sheets [1]. Not only do they influence the ice physical properties, but they may also cause disasters such as ice jams, formed after the frazil ice accumulation, and ice discs, which can reduce the cross-sectional area of a river and further intensify riverbed scouring [2]. They can also raise upstream water levels, which may cause significant flooding [3,4] and the destruction of dykes [5]. In addition, frazil ice poses a threat to bottom fauna [6] and hydraulic structures [7].
Most research on frazil particles has been carried out in laboratories and is mainly related to the supercooling process, frazil nucleation [8,9], frazil ice formation and evolution [10,11,12,13], the size distribution of disk-shaped frazil particles under different flow conditions [14,15], and the concentration of suspended particles [16]. Many experiments also studied the factors affecting the formation, evolution, size, and concentration of frazil particles, mainly included temperature, supercooling process [17,18,19], turbulence intensity [17,18,19,20], and particle rise velocities [21,22].
Due to uncertainties associated with field experiments, it is extremely difficult to observe frazil particles directly, meaning that the quantitative results of field work are much less than those from laboratory research. Osterkamp [23] has reported on the nucleation of frazil particles, and, Schaefer [24], Osterkamp and Gosink [25] has took underwater images of frazil particles in a river channel. They observed particles of various sizes and gave brief descriptions of their crystalline shape; however, the specific observation method was not described and images of the cold, nucleated particles were not given. Field observations of frazil ice size were also conducted by Dubé et al. [26] and Kempema and Ettema [27]. A new type of diving imaging system, the FrazilCam provided the first quantitative measurements of the size distribution of frazil particles in a river [28], and, in recent years, upward-facing sonar devices have been used to estimate the size of frazil particles in rivers [29,30,31].
In addition, Omstedt and Svensson [32,33,34] used mathematical models to simulate the formation of frazil ice and grease ice on water surfaces. Later, a simulation model for the formation and evolution of ice in open channels was developed by Hammar and Shen [35]. More recently, frazil and anchor ice formation was theoretically simulated by Makkonen and Tikanmaki [36]. It is worth noting that the mechanisms proposed in this study partly differ from the conventional views in the literature.
In summary, due to the different longitudes and latitudes of rivers and the different meteorological and hydrological conditions in flow areas, the size and distribution of frazil particles very [37,38]. Although some researchers have produced images of frazil particles, there have been no detailed reports on their morphology, which, to some extent, affects the accuracy of numerical models of their formation and evolution. As such, it is necessary to measure the microstructural characteristics of frazil particles in different rivers to determine the properties of frazil ice (ice crystal microstructures, air bubbles, ice density, and sediment content) [39], which can affect the physical, mechanical, thermodynamic, and optical properties of ice [40,41,42,43].
Here, a field observation of the Yellow River ice was carried out and its findings are presented in this paper. The river is located in a mid-latitude region in China and is known as the river with the world’s largest sediment content. In previous studies, the ice microstructure of the river ice was observed [44,45], but our study present the results of observing the microstructural and physical properties of frazil particles and frazil ice in the Inner Mongolia section of the Yellow River for 46 days during the winter of 2020–2021.

2. Materials and Methods

2.1. Technology of Unidirectional Freezing

When an ice block is artificially frozen, such as when a bucket filled with water is directly placed in a low-temperature environment, heat will be transmitted to the inside of the bucket from all directions. Ice crystals will also start to grow from the surface, bottom, and side walls of the bucket toward the inside. To achieve unidirectional ice freezing, a unidirectional freezing experiment was carried out in an indoor low-temperature laboratory by Li et al. [46]. According to the thermostatic technology proposed by Li, a freezing device to prevent ice growing from the plexglass bucket’s side and bottom was designed (Figure 1a). In order to ensure the plexiglass was in full contact with the water, we punched some holes through the bracket, besides, the plexglass had no bottom, i.e., a plexiglass tube was used. The water in the bucket and the plexiglass were the same medium. The working principle is that the water served as an insulation layer, and the plexiglass bucket was surrounded by water that was not directly in contact with the cold air. As the freezing point of water is 0 °C, as long as the water in contact with the side walls and bottom of the plexiglass bucket did not freeze, ice crystals in the plexiglass bucket will not grow from the side walls and bottom. It should be noted that, during the freezing process, the resistance wire was heated every 1 h to melt the ice in tube to release the pressure caused by freezing. Finally, a unidirectional frozen ice crystal may be obtained, as shown in Figure 1b,c.
During the winter of 2020–2021, this device was used in the Yellow River field experiments, and observations of the ice crystal microstructure at a depth of 40–54 cm showed that the ice in the sampler was formed with unidirectional freezing (Figure 11).

2.2. Preparation of Frazil Ice Materials

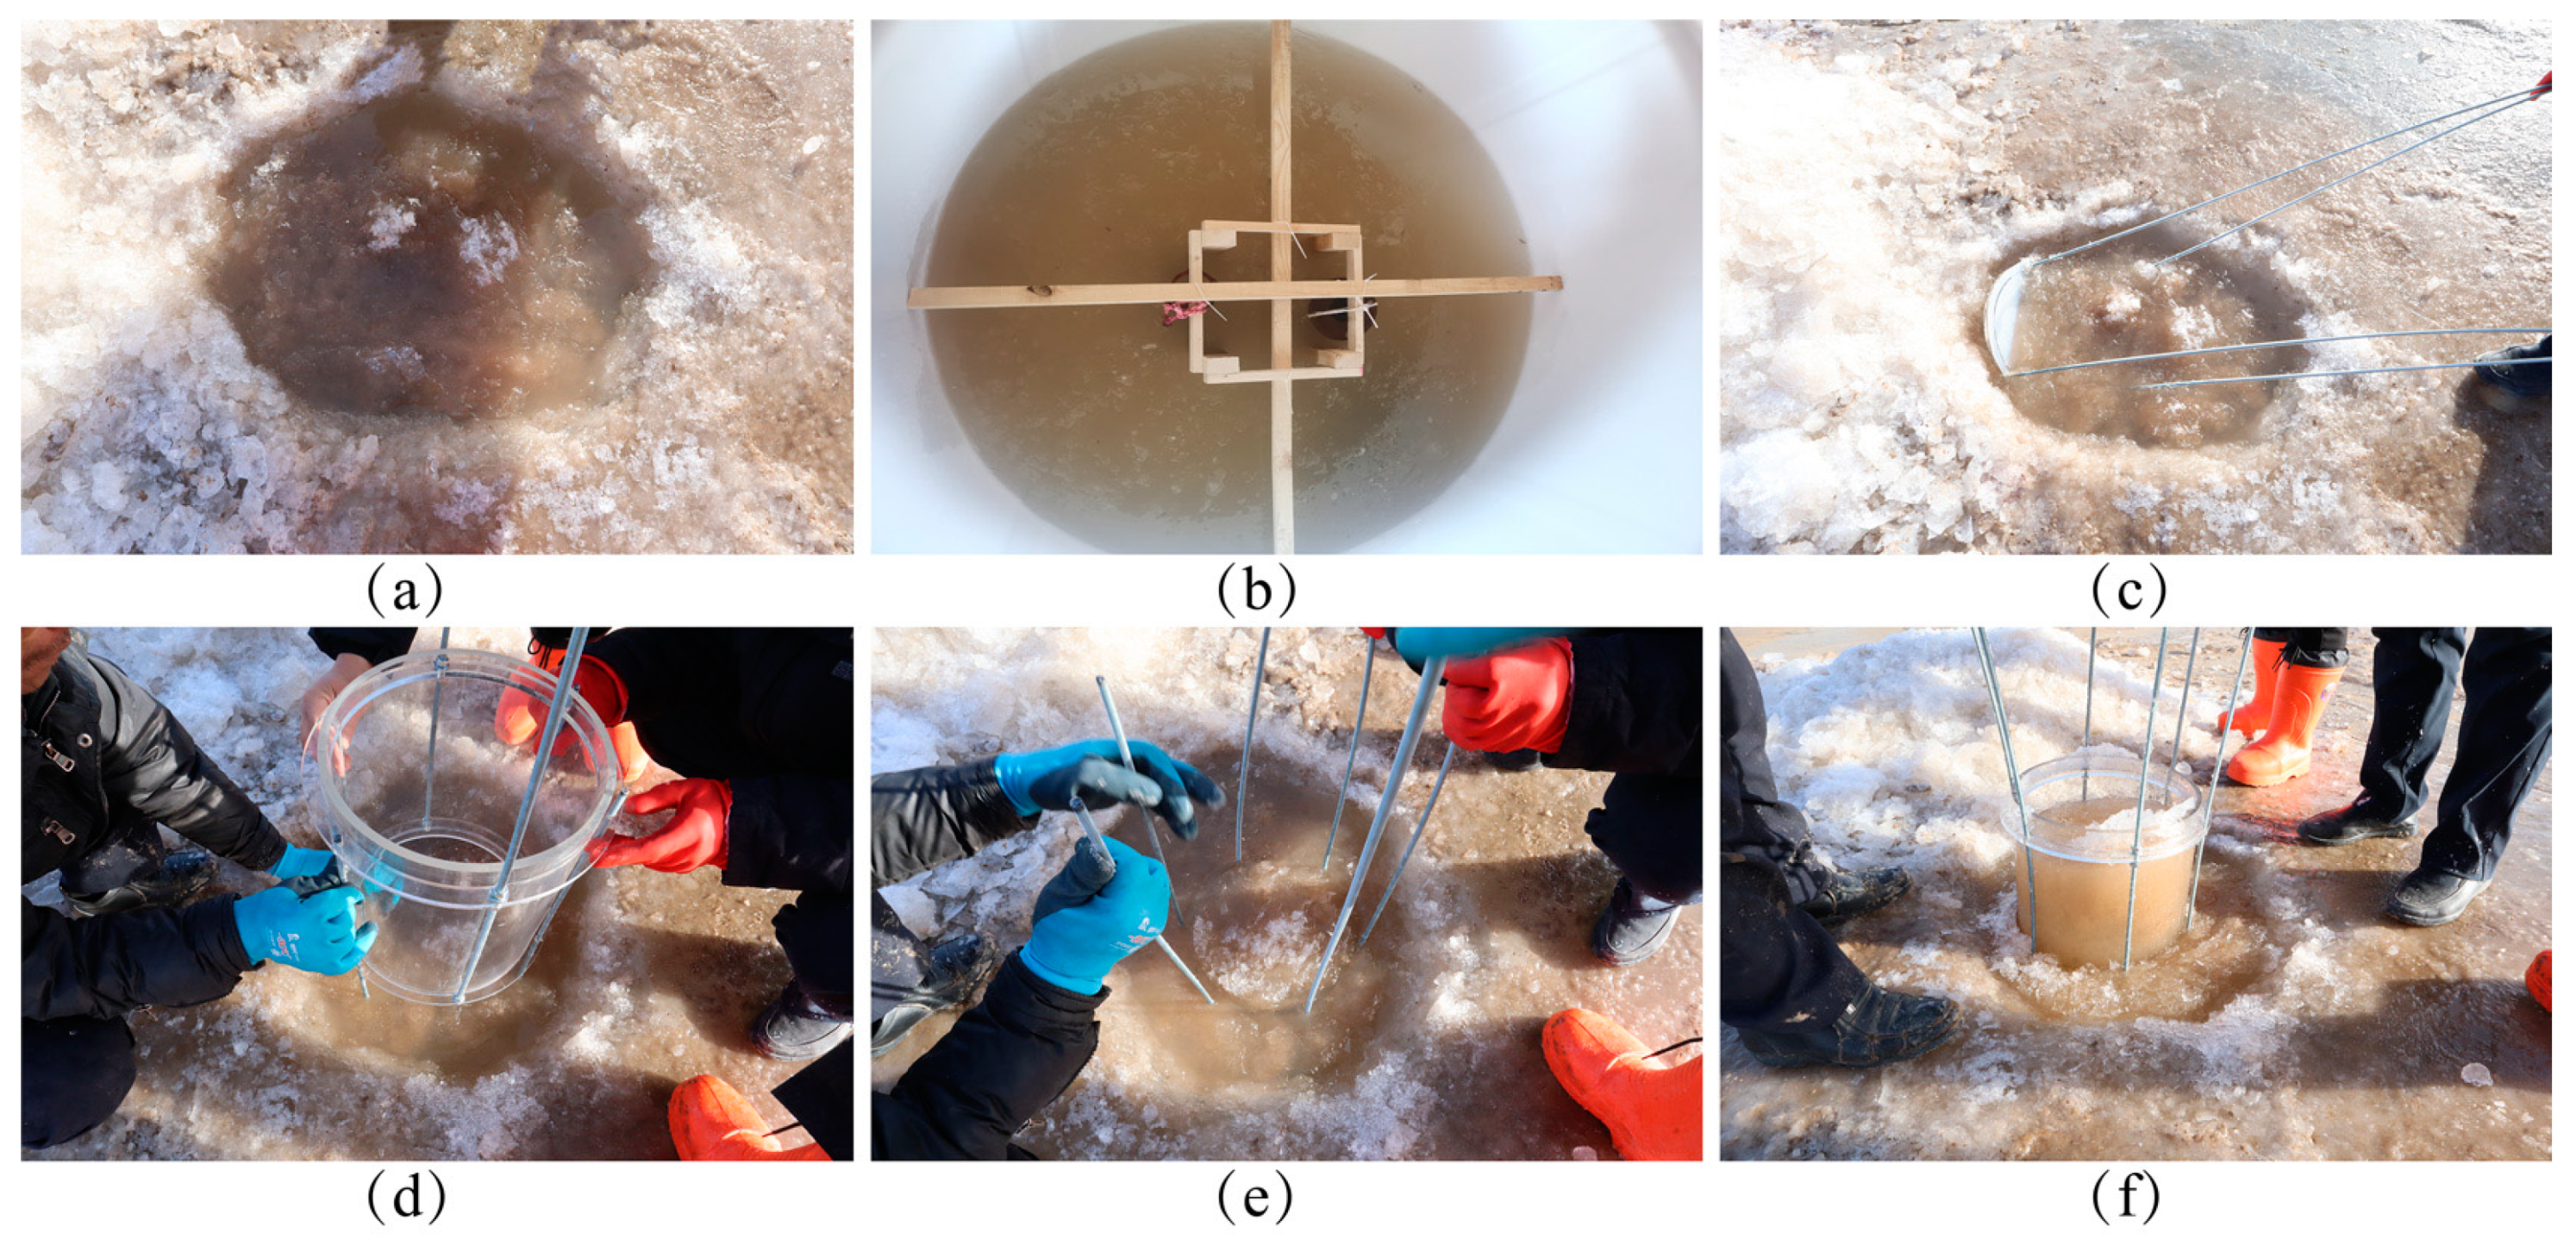
The field testing of frazil particles and frazil ice was carried out at Toudaoguai section in the Inner Mongolia of the Yellow River. Based on the field water extractor structure [47], a frazil particle sampler was designed and the process of frazil particles collection is shown in Figure 2. First of all, the frazil particle extraction position was selected and the position was marked by a GPS. Second, two holes were manually drilled: the ice hole upstream was used to collect the particles, while the downstream hole was used to pump water into a plastic bucket. Third, wooden brackets were fixed in the plastic bucket, and the plastic bucket was filled with water from the Yellow River. Then, the bottom of the frazil particle sampler was gently placed along the edge of the upstream hole into the bottom of the frazil particles. Next, a plexiglass tube was placed in the hole alongside a lead screw. In the following step, the plexiglass cylinder was slowly moved up and down to ensure that it was well sealed with the bottom of the sampler. Finally, the frazil particles were lifted out of the water and placed on the wooden brackets in the plastic bucket for subsequent observation or unidirectional freezing of frazil ice in a natural environment.

2.3. Observation Method of Frazil Particles Morphology

A digital image processing system, developed by Morris in 2003 [48] and improved and modified by Clark [14] and McFarlane et al. [28,49], was used to analyze the images taken in the series of experiments. A similar method of image processing can be found in [50]. Before obtaining the images, the frazil particles in the sampler needed to be separated. Through many experiments, we proved that the most appropriate temperature for separating frazil particles is between −4 and −8 °C. When the temperature is lower than −8 °C, the particles freeze together quickly when taken out and can not be separated easily. When the temperature is higher than −4 °C, the separated particles melt and easily evaporate. When the temperature was between −4 and −8 °C, we took some particles from the sampler and put them on a black acrylic plate with a ruler, where they were gently separated by tweezers. It is worth noting that while separating the frazil particles, it was necessary to throw away those that had been artificially damaged. Next, the separated frazil particles were placed on a microscope platform. Magnification was set at about 200× until they could be clearly observed. At the same time, the frazil particle images were recorded by a computer and the images were enhanced by Adobe Photoshop CS. Finally, the microstructures of the frazil particle images were statistically analyzed by a MATLAB algorithm. Figure 3 shows the process for the frazil particle observation.

2.4. Ice Crystal Microstructure and Air Bubble Observation Method

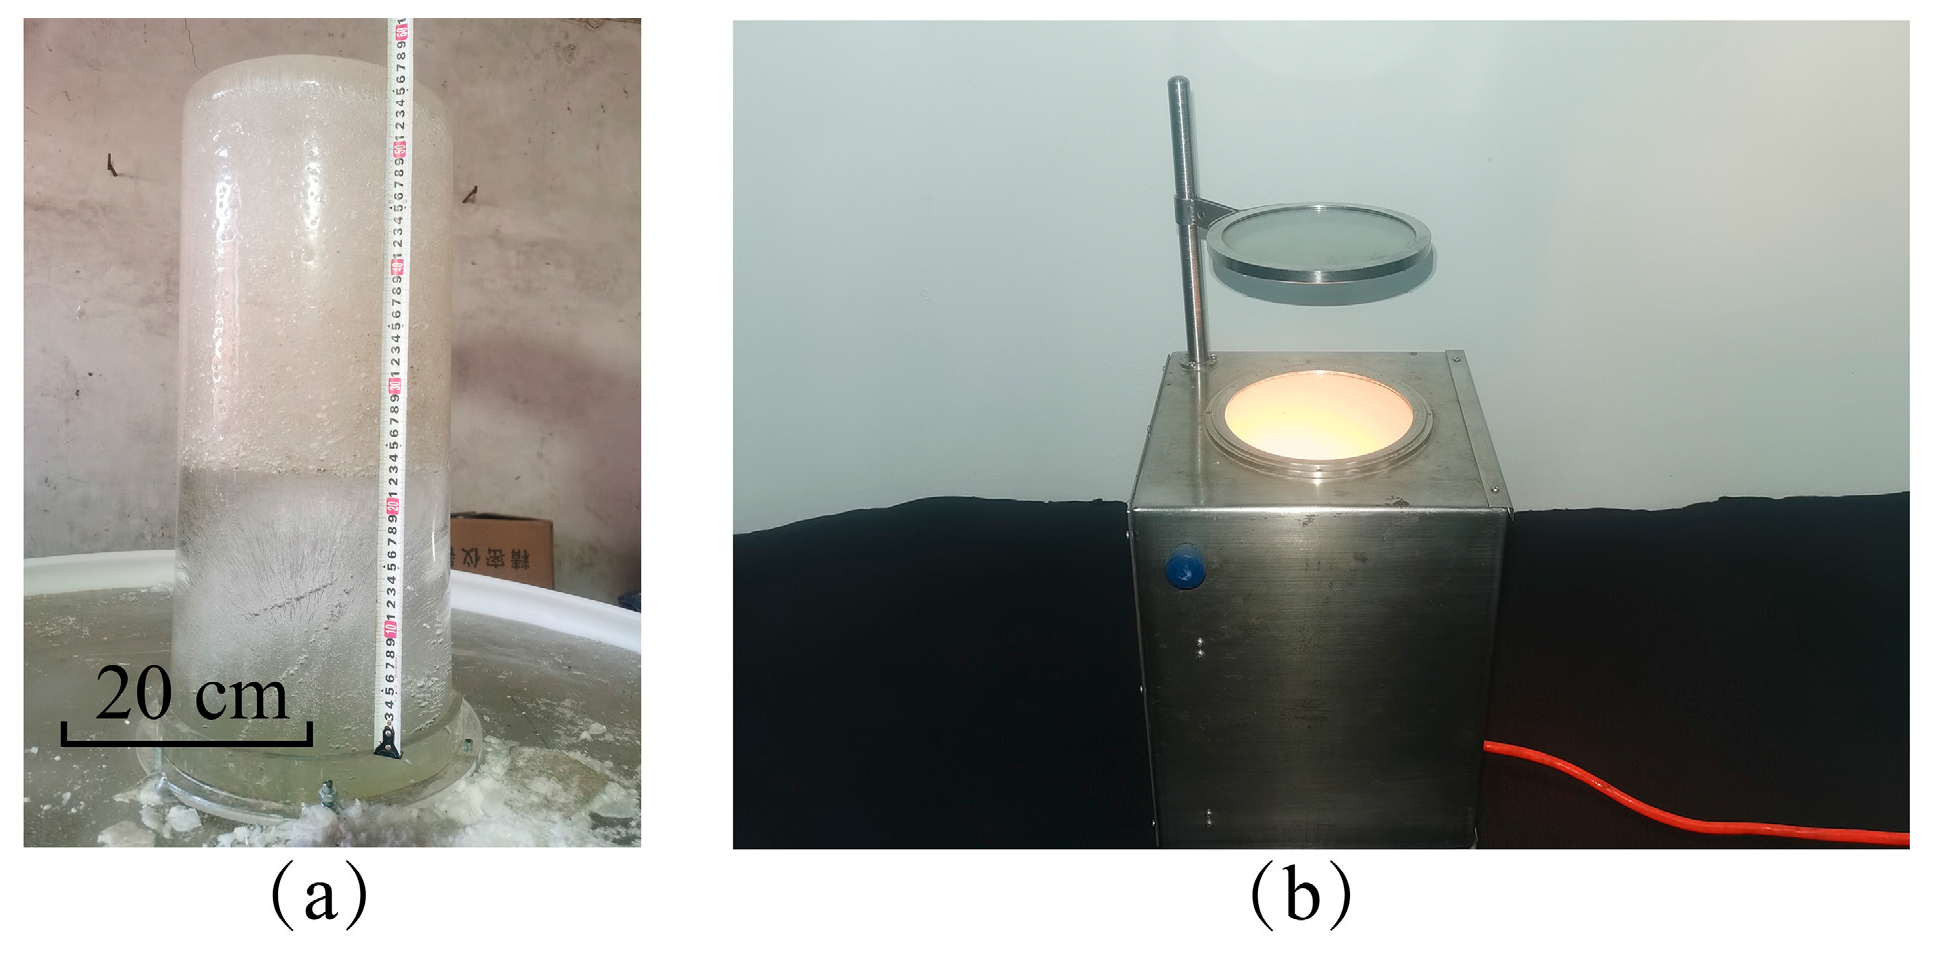
As shown in Figure 4a, the ice block in the sampler was obtained. In the field laboratory, where the temperature was below −6 °C, ice slices were made by referring to the observation technique for ice crystal microstructure shown in [44]. The standard method for observing ice microstructures is the universal stage proposed by Langway [51], which was used to observe the ice crystal microstructure and air bubbles. In a dark environment, the ice slices were placed on a universal stage as shown in Figure 4b. The ice crystal microstructure was observed under polarized light and air bubbles were observed under natural light; meanwhile, the ice crystal microstructure and air bubble images were saved.

2.5. Ice Density and Mud Content Observation Methods

The measurement of ice density mainly includes mass/volume, submersion, specific gravity, freeboard, and ice thickness method [52]. Considering that the sediment content in ice also needs to be measured, a mass/volume method was used to obtain the ice density. Along the growth direction of the ice thickness, the ice sample was segmented by a bone saw into small test blocks with a height of 5–10 cm from the surface to the bottom. The test block was processed into a cuboid with a size of 10 × 10 cm × height. Then, the length and height of the test block were measured with a vernier caliper; its mass was measured with an electronic scale; and its density was calculated using the ρ = m/v formula. After the test block was melted in a plastic box, the dry sediment weight was measured after filtering and drying, and the sediment content per unit volume of ice was obtained.

3. Results

3.1. Frazil Ice Nucleation

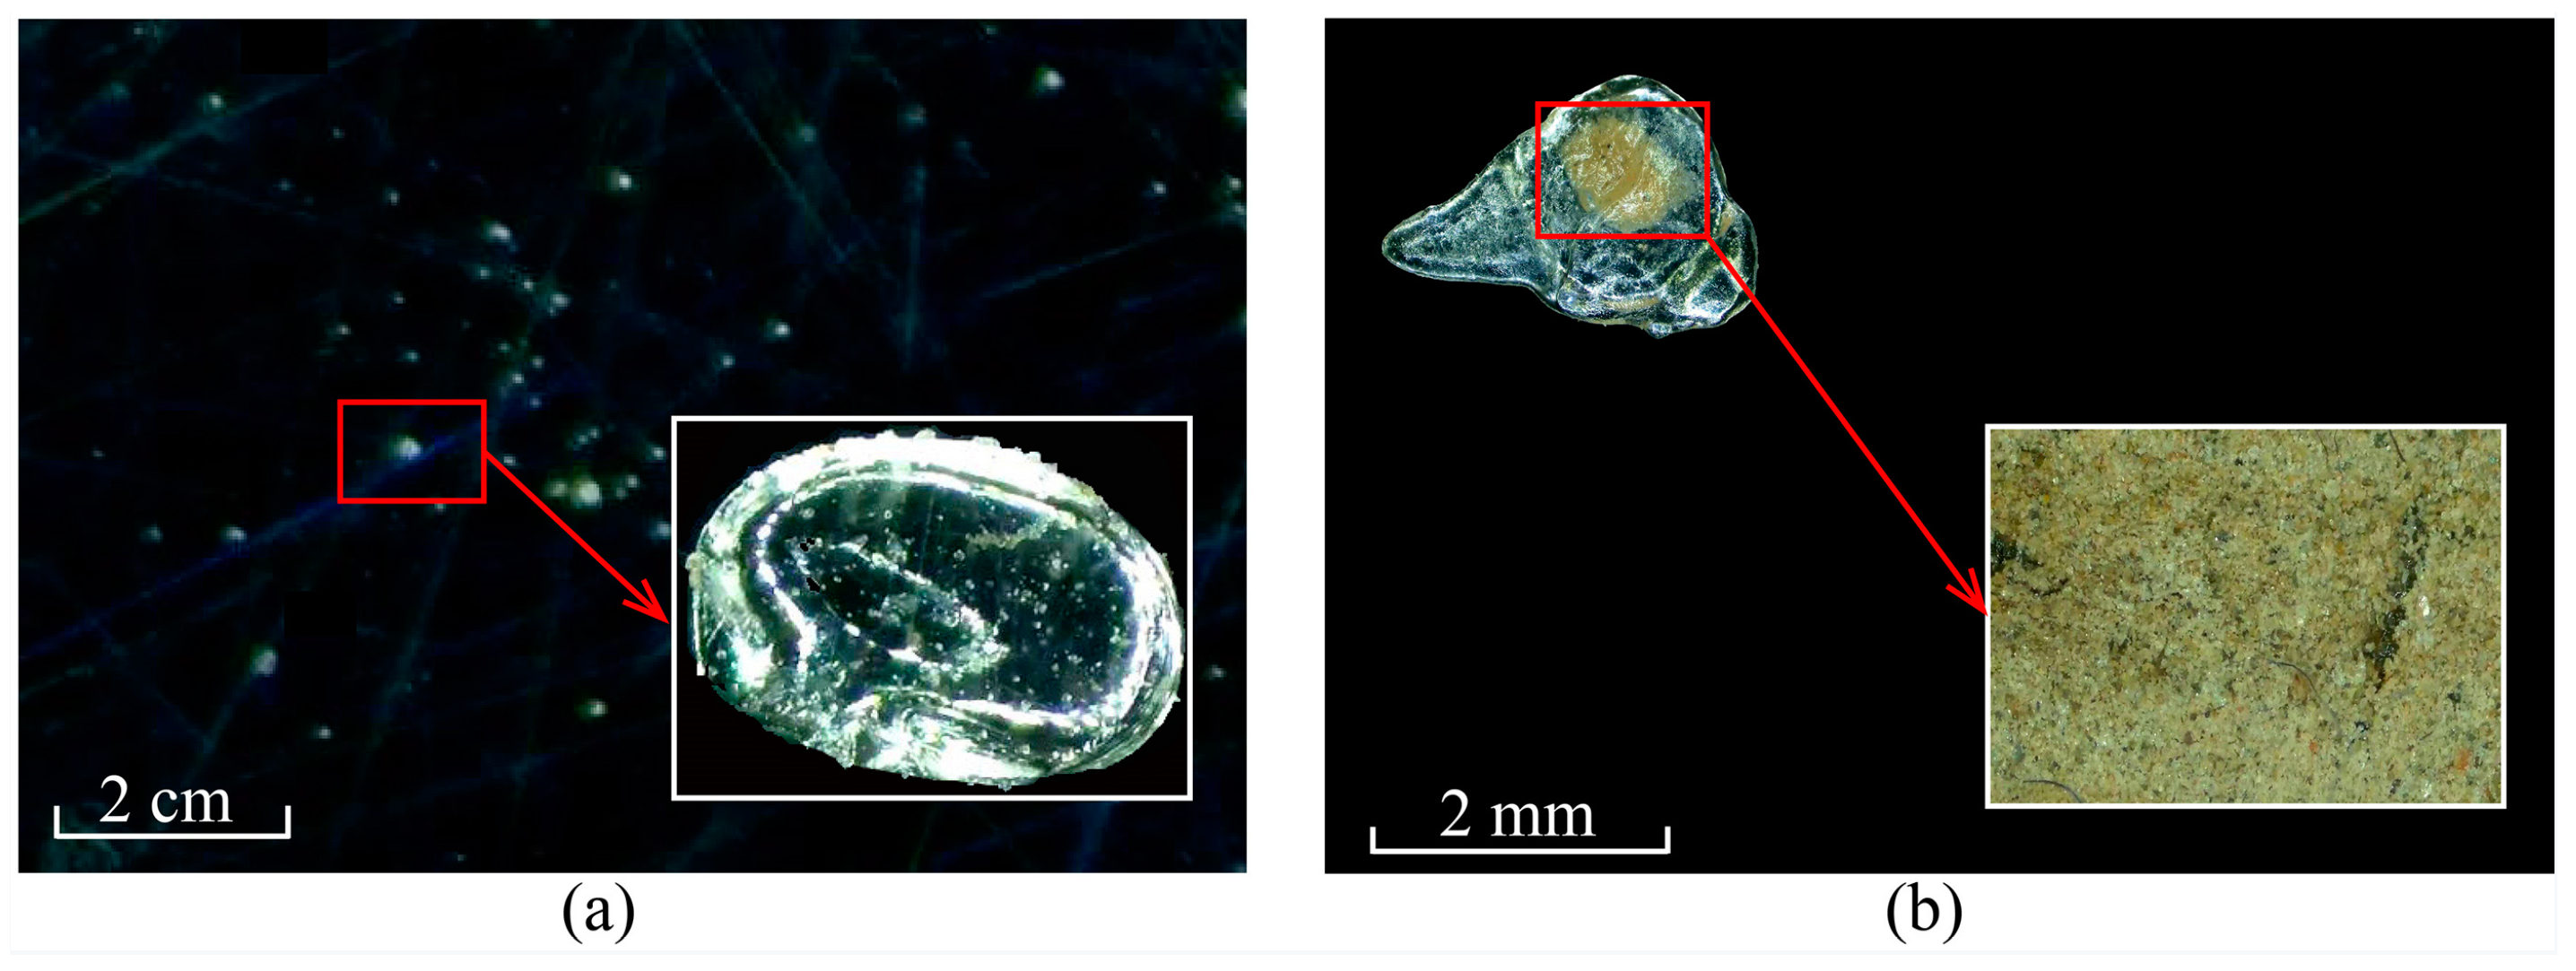
In the observation experiment of the frazil particles, the ice particles shown in Figure 5a and the materials wrapped in frazil particles, shown in Figure 5b, were locally enlarged under a microscope.
It can be seen in Figure 5a that the equivalent diameter of the enlarged ice particles is 1.2 mm. There were many microbubbles in the ice particles after local enlargement because of the highly turbulent natural water [53,54]. Makkonen and Tikanmaki [36], and Chow et al. [55] suggested that the nucleation of ice may be produced by turbulence in slightly supercooled cases, and Chow et al. [55] suggested that the bubbles that initiated nucleation did not disappear. As such, these bubbles were probably wrapped in the crystal during the nucleation of the frazil particles. The locally enlarged image in Figure 5b shows numerous sediment particles and other impurities. Due to the limited magnification of the microscope, it was impossible to measure the size of these particles accurately, but it could be determined that the equivalent diameters of these particles were less than 0.1 mm. McFarlane et al. [28] and Kempema et al. [56] found that the sediment concentration in the water decreases when frazil particles are formed. This may be caused by part of the sediment is wrapped in the frazil crystals, or by frazil particles being formed with sediment as a nucleus. In addition, Reimnitz et al. [22] observed that frazil flocs can collect more sediment.
Hence, we also suggested that frazil ice nuclei can be ice particles or other cold particles such as microbubbles, organic material, or sediment. In addition, Hanley [8], Daly [9], Osterkamp and Gosink [25], and McFarlane et al. [28] also suggested that ice crystals and snow that have fallen from the air into rivers could act as seed crystals.

3.2. Microstructural Characteristics of Single Frazil Particles

The area, perimeter, major axis, and minor axis data for each frazil particle were extracted by MATLAB, and the equivalent diameter, slenderness ratio, and roundness of each frazil particle were calculated using the following formulae.
D = 2 S / π
S r = M 1 / M 2
R = 4 π S / l 2
where D is the equivalent diameter; Sr is the slenderness ratio; R is the roundness; S is the area; M1 is the length of the minor axis; M2 is the length of major axis; and l is the perimeter.
Based on the analysis and the threshold segmentation of the shape, diameter, slenderness radio, and roundness of the frazil particles in the Yellow River, the frazil particles can be divided into four types as shown in Figure 6 and Table 1, i.e., granular, dendritic, needle-like, and serrated.
Granular frazil particles are shown in Figure 6a–d, and are similar to an ellipse. Compared with other types of frazil particles, their equivalent diameters were the smallest, but the slenderness ratio and the roundness were the largest. The equivalent diameters of the serrated frazil particles shown in Figure 6g,h were larger, and the equivalent diameter of the largest serrated frazil particle can be up to 25 mm. A needle-like frazil particle is shown in Figure 6f. Its slender shape results in the lowest slenderness ratio and roundness, which were both less than 0.2. The dendritic frazil particle shown in Figure 6e features a larger grain perimeter, which leads to smaller roundness, and a larger area results in a larger equivalent diameter than the granular and needle-like frazil particles.
In the research of frazil particles mentioned in the introduction of this paper, the field measurements of the major particle size ranged from 0.1 to 6 mm, and the laboratory measurements of that ranged from 0.022 to 5.5 mm. Here, the mean equivalent diameter of the granular frazil particles was 3.2 mm, and the standard deviation was 2.1 mm, which was similar to previous observations, especially the mean diameter of 3.15 mm and the standard deviation of 2.5 mm observed by Morse and Richard in the field [37].
The percentages of different particles were also calculated, among which the percentage of granular frazil particles was the largest (77.8%), indicating that the majority of frazil particles observed in the field were granular. In previous studies, the majority of particles were described by researchers as disk-shaped. In this study, we found that there were still a large number of particles where the boundaries were not smoothly disk-shaped, thus were described as granular. As such, the percentage of major frazil particles in the Yellow River were consistent with the laboratory measurements of McFarlane et al. (2015) [20], who found that the percentage of the major frazil particles was 75%, and the field measurements of McFarlane et al. (2017) [28] who found the percentage of the major frazil particles to be between 61 and 87%. The serrated and needle-like frazil particles had similar percentages of around 10%. The percentage of dendritic frazil particles was the lowest with less than 2%. As shown in Figure 6e, the structure of the dendritic frazil particles was obviously unstable. Under the action of turbulence, dendrites are easily broken.
In addition, our findings were similar to those of Schaefer [24]. Until the diameters of the frazil particles reached 2 mm, it was rare to find secondary protruding structures developing around the edges. As the frazil particles grew, though, such secondary structures appeared, and may formed the dendritic and serrated particles, as shown in Figure 6e–g.
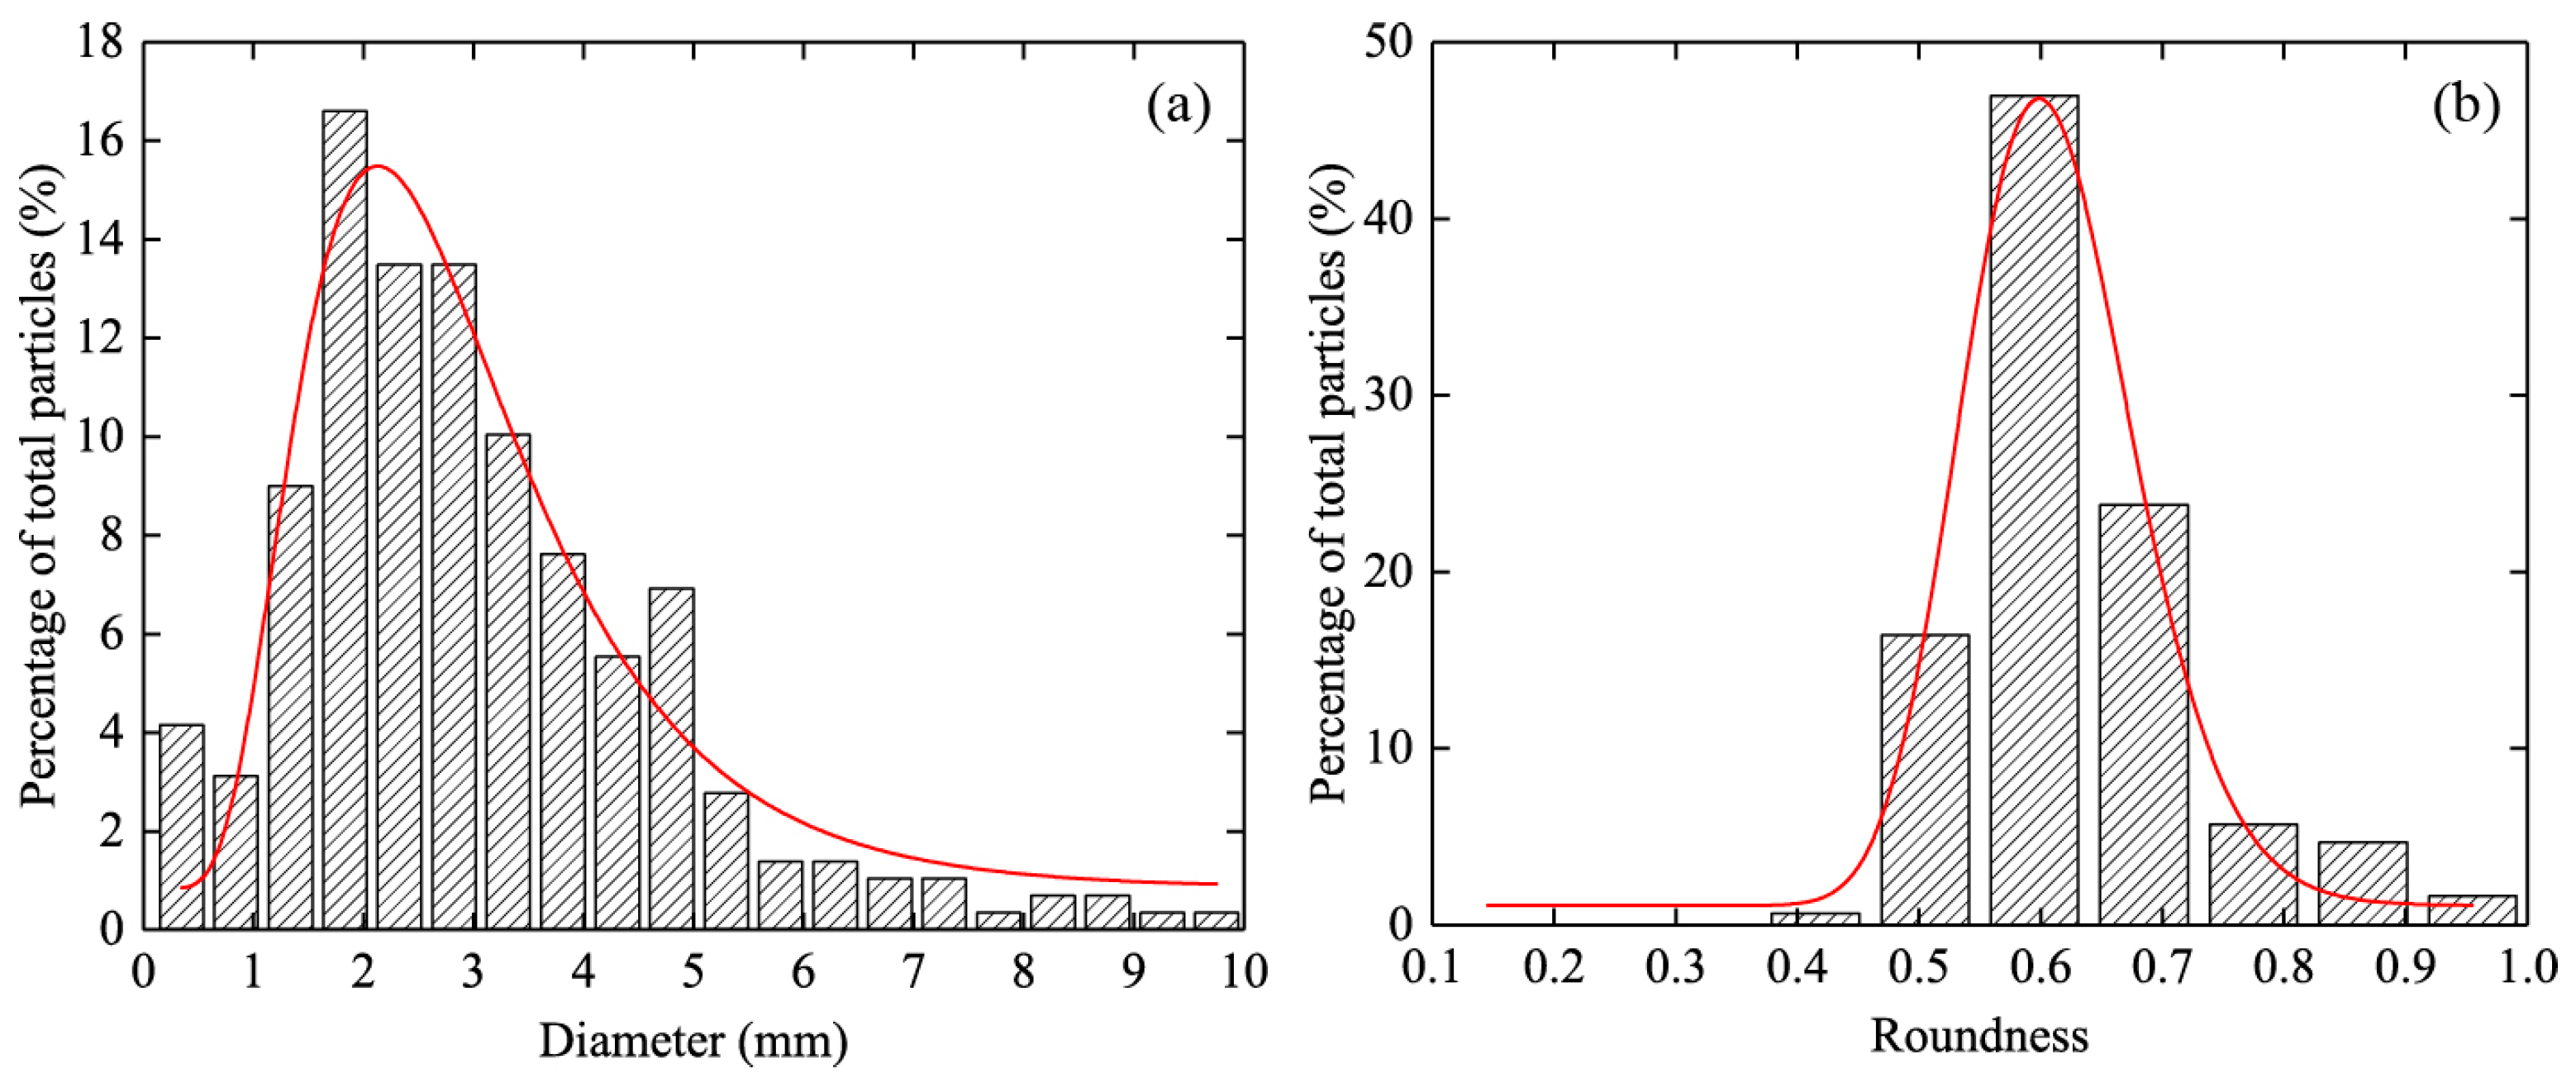
The diameter, slenderness ratio, and roundness values for the granular, serrated and dendritic frazil particles were fitted by a log-normal distribution; however, the content of dendritic frazil particles was too low, and the observation of dendritic frazil particles was insufficient, which did not allow a reasonable fit for the data; thus, the fitting of data for dendritic frazil particles was not performed. All of the characteristic parameter distributions were well described by a log-normal distribution, which was consistent with the measurements of many previous studies [14,20,28,49]. As can be seen from Table 1, the distribution range of slenderness ratio and roundness were similar, and their log-normal distribution results also showed a high degree of similarity. The log-normal distribution fitting results for the diameter and roundness of granular frazil particles are shown in Figure 7.

3.3. Microstructural Characteristics of Accumulated Frazil Particles

Frazil particles are free-floating particles in early development. As their number increases, they agglomerated together with weakly bonding in turbulent streams. Some representative frazil particles that agglomerated together are shown in Figure 8, Figure 9 and Figure 10. Under the effect of turbulence, varying agglomeration angles were formed and with an increase in the number of agglomerations, the maximum angle between two adjacent frazil particles gradually decreases and should not exceed 150°; for three frazil particles, the angle should not exceed 120°. When multiple frazil particles aggregated, the maximum angle between two adjacent frazil particles should not exceed 90°. The shape and size of agglomerated frazil particles will change. An increase in agglomerated frazil particles will also produce an increase in the size, roundness, and slenderness ratio. Finally, due to the influence of temperature and submersion in water, the particles will gradually freeze together to form frazil ice.

3.4. Ice Crystal Microstructure and Air Bubble in Frazil Ice

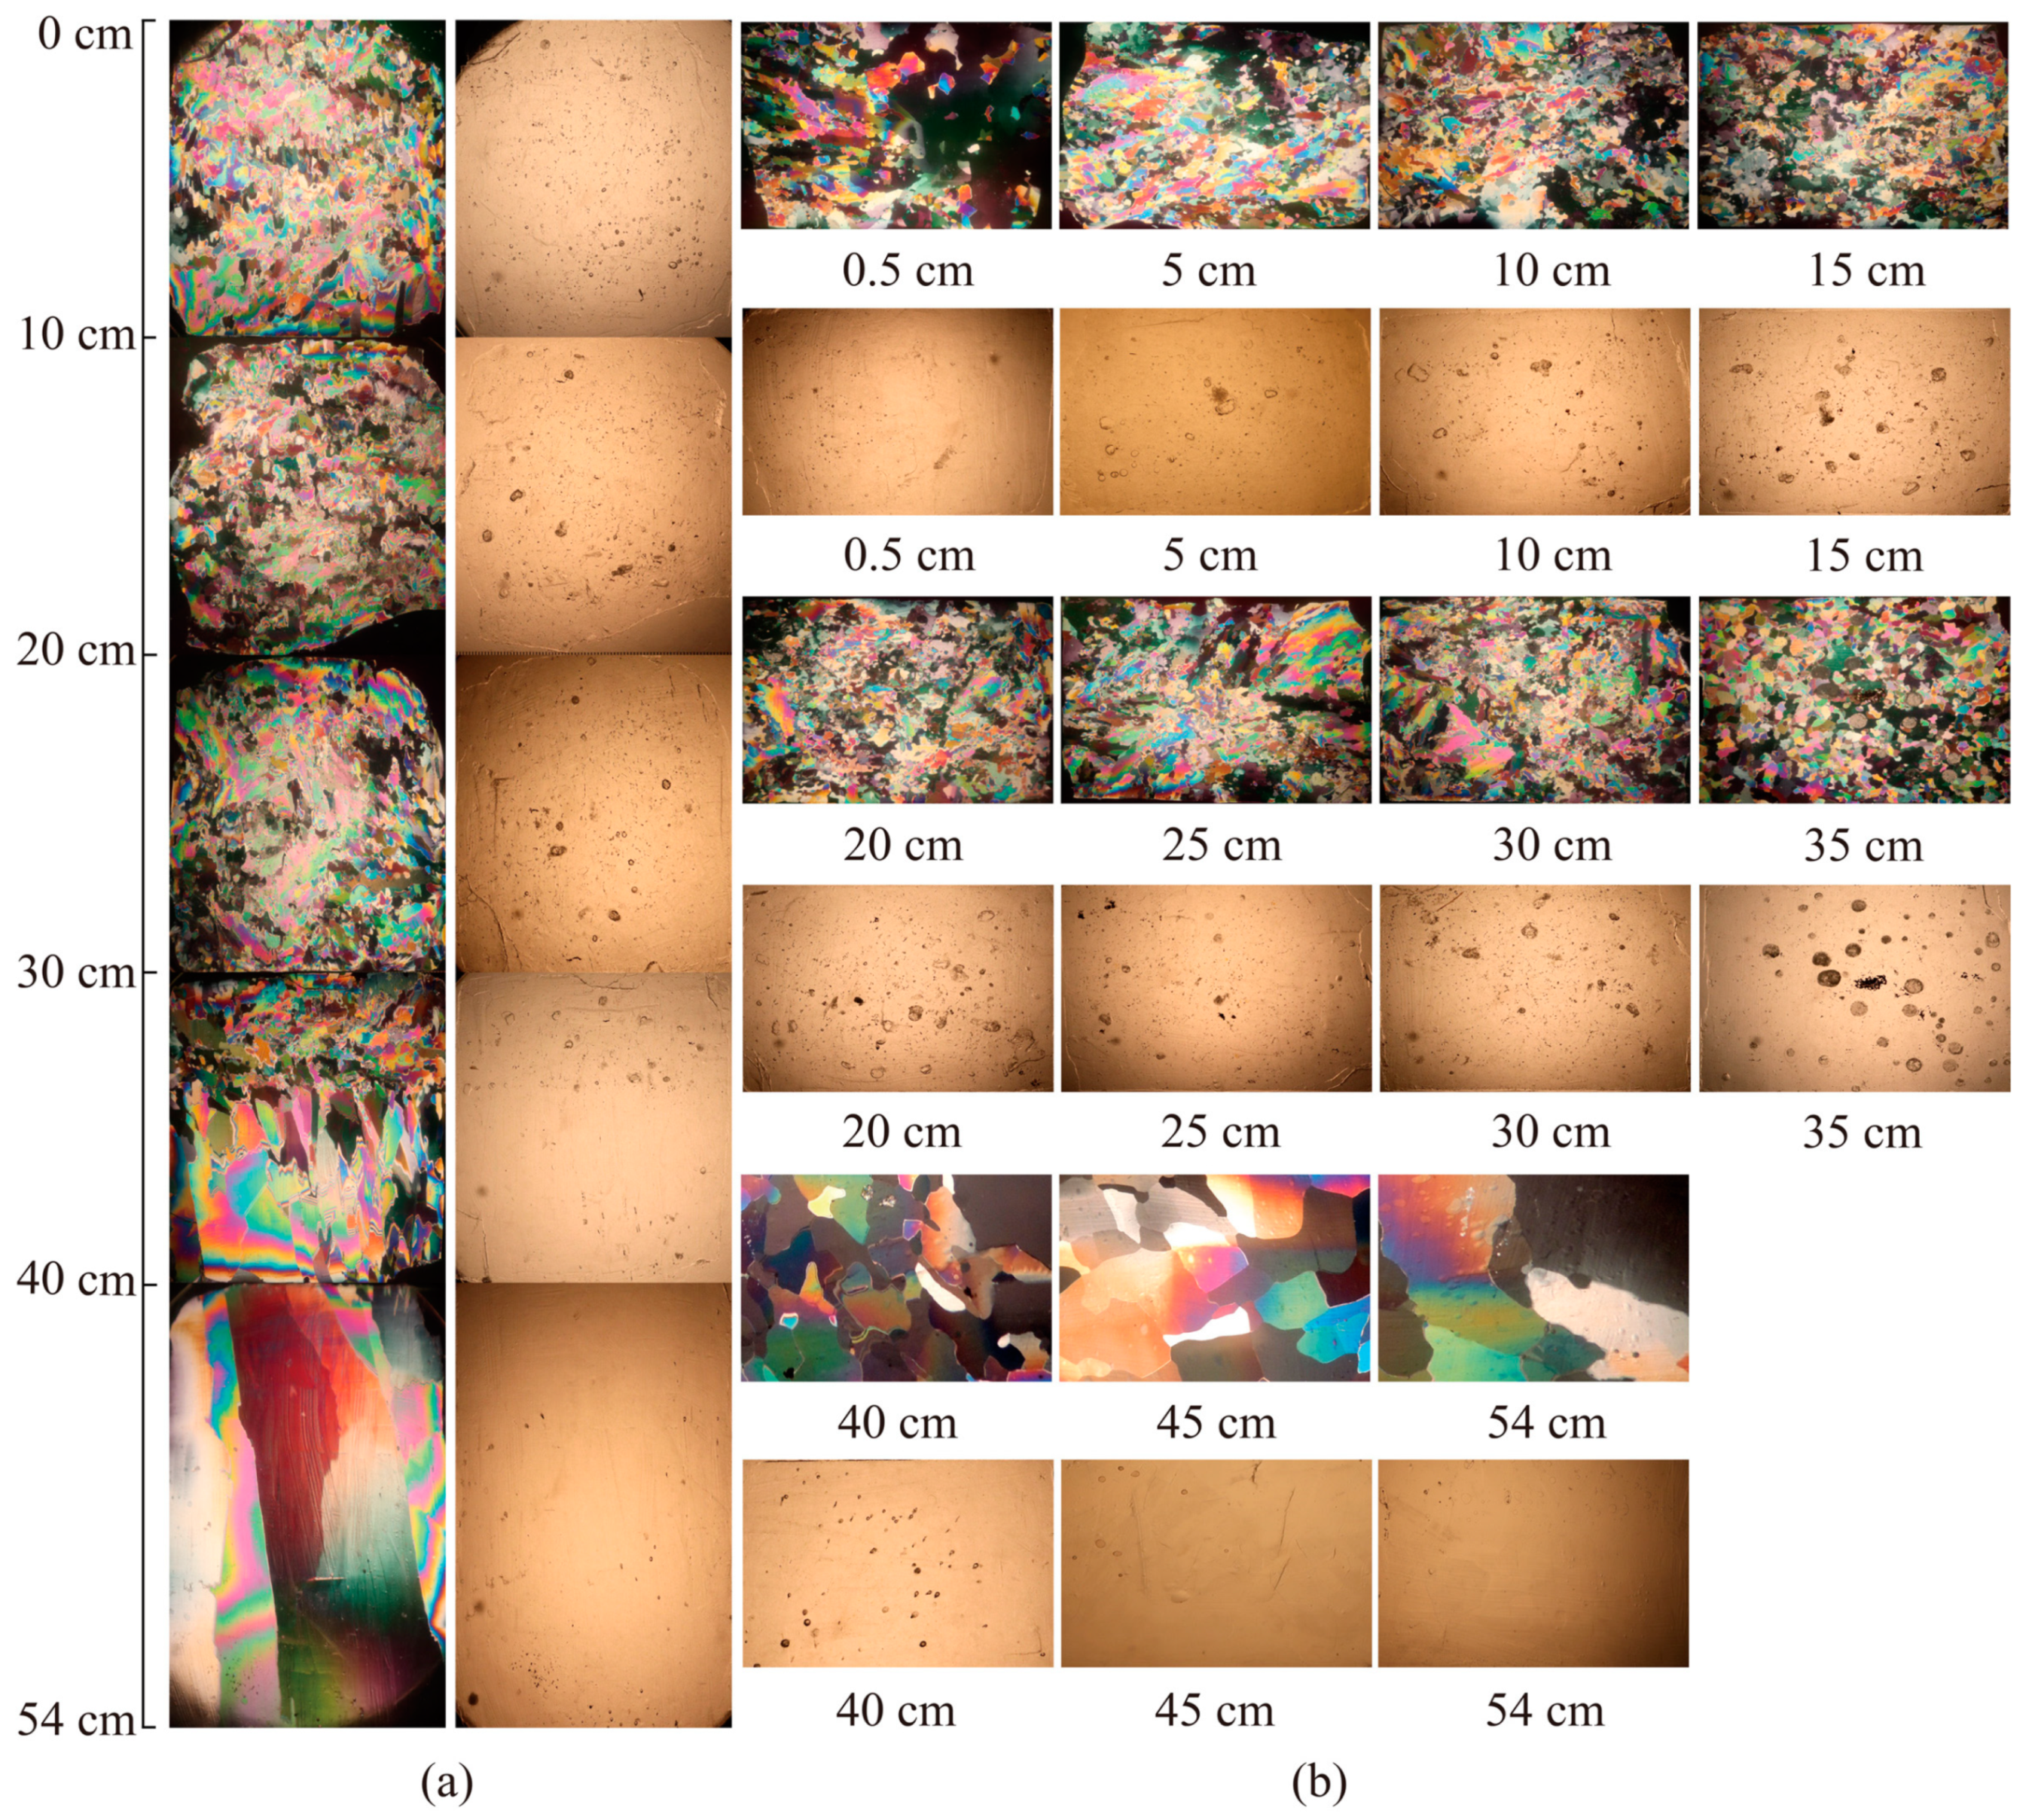
The ice crystal microstructure and air bubbles are shown in Figure 11. The microstructure of the ice corresponds to the original block of ice shown in Figure 5a, which shows that an ice thickness of 34 cm is an obvious boundary; the color of the original ice block at 0–34 cm is turbid; and the color of the original ice block at 34–54 cm is transparent. From the microstructure of the ice, it is obvious that the ice crystal microstructure at 0–34 cm is completely different from that at 34–54 cm.
Frazil ice was found in the 0–34 cm range. No mater whether the ice crystal microstructure was perpendicular or parallel to the ice surface, the shapes of ice crystals were extremely irregular. The grain sizes of most of the ice crystals were small, accompanied by a small number with a large grain size, and there were overlapping crystals at the grain edge. This was related to the formation of frazil ice formed by freezing frazil particles through the connection with Yellow River water. Due to the different shape of frazil particles, the ice crystals may not form one individual frazil particle, but may instead contain overlapping parts of other frazil particles. As such, the crystal microstructure of frazil ice is messy. In addition, some crystals in the frazil ice were inclined at certain angles, but the direction of the tilt was irregular, which may be related to the effect of turbulence under the ice cover of the Yellow River during the freezing period. According to the classification of river ice and lake ice by Michel and Ramseier [57], this ice structure belongs to the P3 category.
The ice crystals in the range of 34–37 cm were regular. It could be seen that the ice crystals perpendicular to the ice surface were close to rectangles, while the ice crystals parallel to the ice surface were granular with clear boundaries. Although their sizes were small, they were uniform and there were no large ice crystals. This represents the transition stage from granular ice to columnar ice, and the ice crystals gradually extended along the direction of heat conduction. With the increase of ice thickness, a preferred growth orientation of some crystals appeared due to geometric selection. The growth in this preferred direction extended past the growth in other directions, causing the formation of columnar crystals [58], which can be seen in Figure 11 when the ice thickness is 37–54 cm. The ice crystals perpendicular to the ice surface continuously extended along the direction of heat conduction, while the ice crystals parallel to the ice surface were nearly elliptical and featured clear boundaries. According to the classification of river ice and lake ice by Michel and Ramseier [57], this ice structure belongs to the S1 category.
To further analyze the characteristics of the ice crystal grain size and bubble content, the ice crystal microstructure and air bubble images in Figure 11 were processed by Adobe Photoshop CS and MATLAB, and, their ice crystal grain size and bubble content were measured. The variation in the mean equivalent diameter of the ice crystals and bubble content in ice along the depth was obtained as shown in Figure 12.
It can be seen that the mean equivalent diameters of frazil ice crystals ranged from 2.2 to 2.6 mm and fluctuated slightly according to depth. The equivalent diameters of columnar ice ranged from 3.6 to 24.8 mm, which was slightly larger than that previously reported in other regions [44], and obviously increased with depth. With the growth of columnar ice, ice thickness gradually increased, and thus heat conduction became weaker. The growth rate of ice crystals became slower, such that the ice crystals had sufficient time to develop. These ice crystals restricted one another and competed for growth. The number of ice crystals constantly decreased as their equivalent diameter of the ice crystals grew larger; however, the frazil ice here was formed by a combination of ice particles and Yellow River water, where the equivalent diameters of frazil ice were mainly related to the size of the frazil particles; and thus, the equivalent diameters of frazil ice are small.
Regarding the bubble content in ice, the bubble content in frazil ice varied from 3.72 to 5.68% and fluctuated at depth larger than that of columnar ice; however, the bubble content in columnar ice varied from 1.63 to 2.07% and decreased gradually with depth. This was consistent with the statistical results of Zhang et al. [59] for Yellow River ice from 2015 to 2020, which suggested that the bubble content of frazil ice is 5.29 ± 2.57% and that of columnar ice is 2.57 ± 1.09%. The formation of bubbles in ice is related to the formation of ice sheets, and is primarily produced in two ways [60,61]. In the initial stage of freezing, powerful wind and water turbulence bring a large amount of air into the water, forming a air–water mixing layer where rapid and sudden freezing captures most of the air. After the ice sheet is formed, bubbles dissolved in water are released and rise to the downward–moving freezing front (the ice–water interface) to be incorporated into the ice. As shown in Figure 5a, a large number of bubbles were wrapped in ice particles during supercooling, which is when the bonding force between ice crystals is lower, and, this caused frazil ice pores increase. This is the main reason that there are more bubbles in frazil ice than in columnar ice.

3.5. Ice Density and Sediment Content in Ice

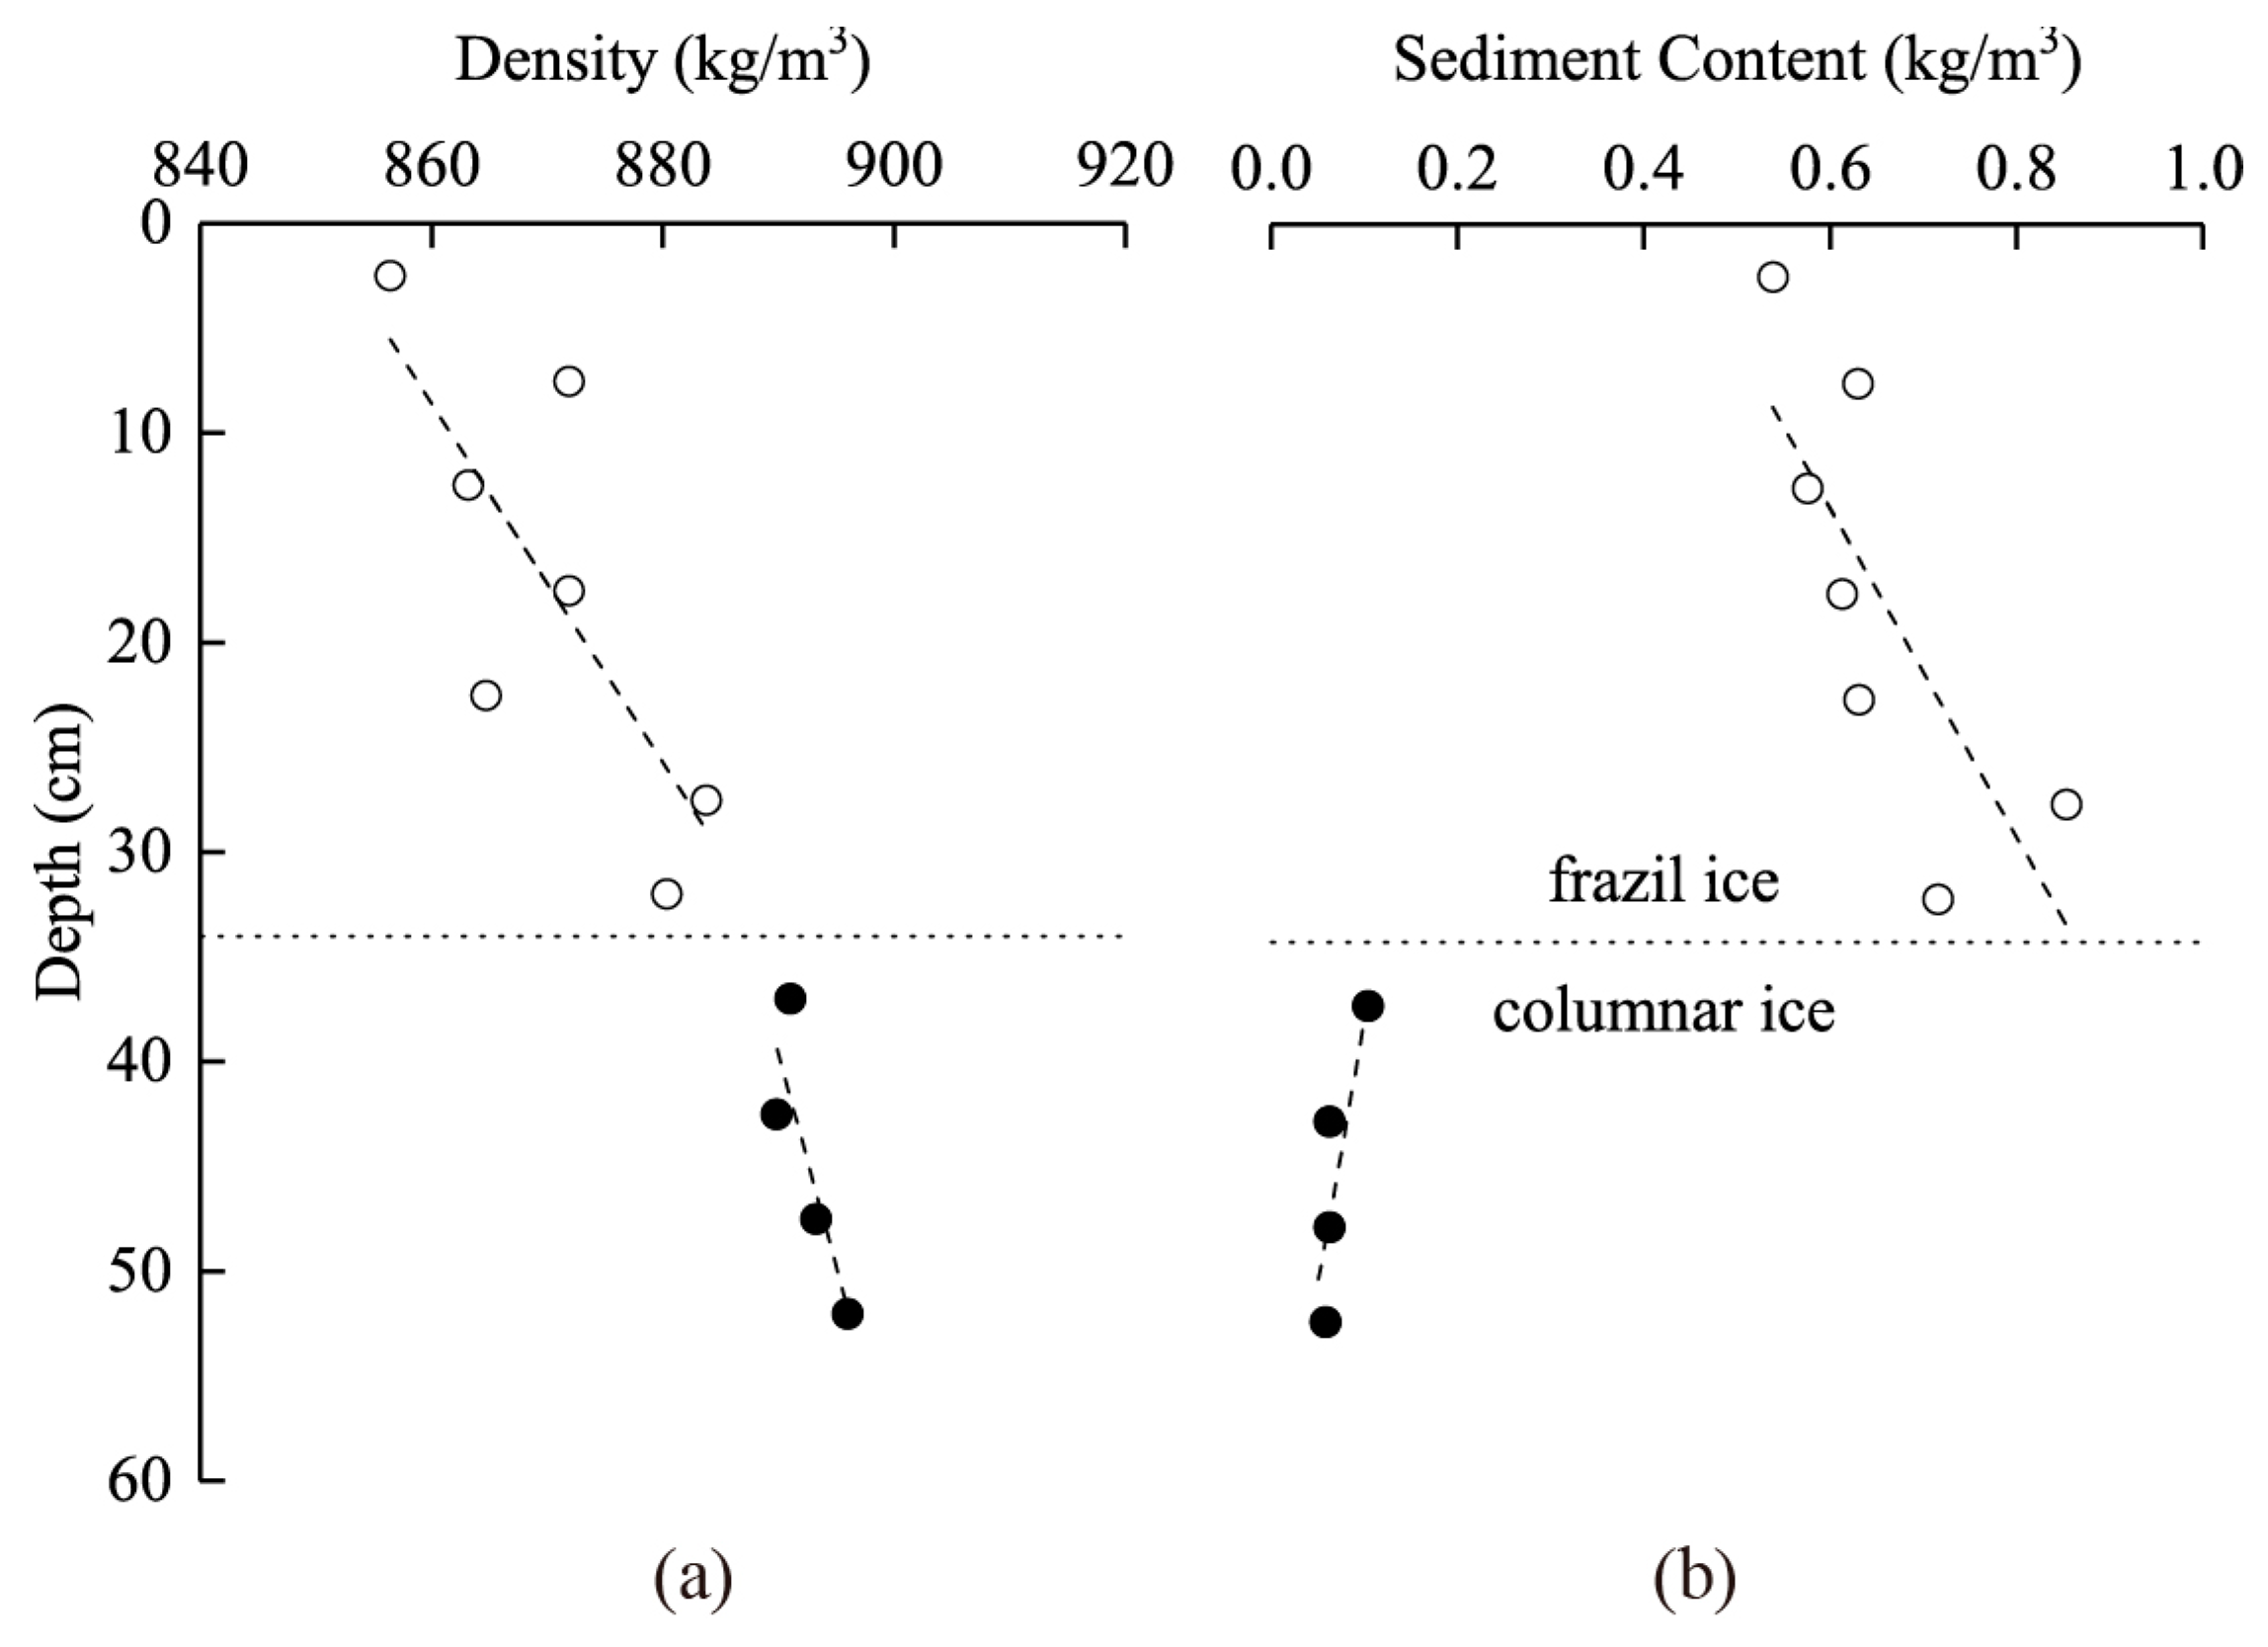
The variation in ice density and sediment content with depth is shown in Figure 13. Note that the density values of the frazil and columnar ice were both lower than that of pure ice (917 kg/m3) [40]. The density of frazil ice ranged from 856.4 to 880.3 kg/m3, which was less than that of columnar ice, which ranged from 891.1 to 896.0 kg/m3; however, the sediment content of frazil ice ranged from 0.538 to 0.854 kg/m3, which was larger than that of columnar ice, which ranged from 0.063 to 0.104 kg/m3. These results were also consistent with the statistical results of Zhang et al. [59]. The density and sediment content of frazil ice fluctuated strongly, but the general trend was a gradual increase with depth. It was also found that the trend for frazil ice density was similar to the trend for sediment content in frazil ice. When the sediment content in ice was large, the ice density was also relatively large. In contrast, the sediment content in the columnar ice was very low, but the density of the columnar ice gradually increased with depth. This is because ice density is not only affected by sediment content, but also by bubble content. The bubble content of frazil ice was larger and its density was lower. The influence of sediment content on columnar ice density was not significant; and the bubble content of columnar ice was very low; thus, the ice density of columnar ice was greater than that of frazil ice.

4. Conclusions

The ice conditions of the Yellow River are complex, and it is necessary to understand the physical properties of Yellow River ice, which is of great significance for further study. The microstructural characteristics of frazil particles and the physical properties of frazil ice in the Yellow River were observed in this work, and the main conclusions are summarized below.
(1)
Frazil ice nuclei can be ice particles or other cold particles, such as microbubbles, organic material, or sediment particles;
(2)
Based on their shape, diameter, slenderness ratio, and roundness, the frazil particles may be divided into four types as seen in Table 1, where each has its own characteristic parameters;
(3)
A large number of frazil particles may agglomerate in turbulent streams. As the number of agglomerated particles increases, the maximum angle between two adjacent frazil particles will gradually decrease;
(4)
Following the unidirectional freezing technology summarized in the laboratory, unidirectionally_frozen frazil and columnar ice were obtained. Compared with the columnar ice, the ice crystal structure of frazil ice is disorderly; the crystal size is small; and the diameter is 2.2–2.6 mm;
(5)
Ice density is affected by both the bubble and sediment contents. The nucleation mechanism of frazil particles, coupled with the large amount of sediment in the Yellow River, resulted in significantly larger bubbles and sediment content in frazil ice than in columnar ice.

Author Contributions

Data curation, Y.Z.; formal analysis, Y.Z. and Z.L.; investigation, Y.Z., Z.L., Y.D., Y.X., C.L. and B.Z.; methodology, Y.Z. and Z.L.; software, Y.Z.; supervision, Z.L.; writing—original draft, Y.Z. All authors have read and agreed to the published version of the manuscript.

Funding

This work was supported by National Science Foundation of China (51979024, 51879116) and the National Key Research and Development Program of China (2019YFE0197600).

Data Availability Statement

All the data are contained within this article.

Acknowledgments

We would like to express our sincere appreciation to the anonymous referee for his or her valuable suggestions and corrections.

Conflicts of Interest

The authors declare no conflict of interest.

References

  1. Li, L.; Huo, T.; Shen, G.; Zhang, B.; Li, Z.; Zhang, Y. Analysis of the influencing factors of ice thickness growth in Toudaoguai section of the Yellow River in 2019 and 2020. Yellow River 2021, 43, 58–62. [Google Scholar]
  2. Wang, T.; Liu, Z.; Guo, X.; Fu, H.; Liu, W. Prediction of breakup ice jam with Artificial Neural Networks. J. Hydraul. Eng. 2017, 48, 1355–1362. [Google Scholar]
  3. Arden, R.S.; Wigle, T.E. Dynamics of ice formation in the upper Niagara River. In The Role of Snow and Ice in Hydrology, Proceedings of the IAHS-UNESCO-WMO Conference, Banff, Proc; Unesco-WMO-IAHS: Geneva, Switzerland, 1972; pp. 1296–1313. [Google Scholar]
  4. Daly, S.F. Frazil ice. In Proceedings of the CGU-HS Conference, Edmonton, AB, Canada, 21–24 July 2013; pp. 107–134. [Google Scholar]
  5. Yang, K. Advances of ice hydraulics, ice regime observation and forecasting in rivers. J. Hydraul. Eng. 2018, 49, 81–91. [Google Scholar]
  6. Gaufin, A.R. Production of bottom fauna in the Provo River, Utah. Iowa St. coll. J. Sci. 1959, 33, 395–419. [Google Scholar] [CrossRef]
  7. Jenkins, A.; Bombosch, A. Modeling the effects of frazil ice crystals on the dynamics and thermodynamics of Ice Shelf Water plumes. J. Geophys. Res. Space Phys. 1995, 100, 6967–6981. [Google Scholar] [CrossRef]
  8. Hanley, T.O.D. Frazil nucleation mechanisms. J. Glaciol. 1978, 21, 581–587. [Google Scholar] [CrossRef] [Green Version]
  9. Daly, S.F. Evolution of frazil ice. In Proceedings of the 19th IAHR International Symposium on Ice, Vancouver, BC, Canada, 6–11 July 2008; pp. 29–47. [Google Scholar]
  10. Michel, B. Theory of formation and deposit of frazil ice. In Proceedings of the Annual Eastern Snow Conference, Quebec City, QC, Canada, 14–15 February 1963; pp. 3–18. [Google Scholar]
  11. Hanley, T.O.D.; Tsang, G. Formation and properties of frazil in saline water. Cold Reg. Sci. Technol. 1984, 8, 209–221. [Google Scholar] [CrossRef]
  12. Ye, S.Q.; Doering, J.; Shen, H.T. A laboratory study of frazil evolution in a counter-rotating flume. Can. J. Civ. Eng. 2004, 31, 899–914. [Google Scholar] [CrossRef]
  13. Clark, S.; Doering, J.C. A laboratory study of frazil ice size distributions. In Proceedings of the 17th International Symposium on Ice, Saint Petersburg, Russia, 21–25 June 2004; pp. 291–297. [Google Scholar]
  14. Clark, S.; Doering, J.C. Laboratory experiments on frazil-size characteristics in a counter rotating flume. J. Hydraul. Eng. 2006, 132, 94–101. [Google Scholar] [CrossRef]
  15. Ghobrial, T.R.; Loewen, M.R.; Hicks, F. Laboratory calibration of upward looking sonars for measuring suspended frazil ice concentration. Cold Reg. Sci. Technol. 2012, 70, 19–31. [Google Scholar] [CrossRef]
  16. Tsang, G.; Cui, W. Laboratory study of frazil distribution in a flow. Can. J. Civ. Eng. 1994, 21, 696–709. [Google Scholar] [CrossRef]
  17. Ettema, R.; Karim, M.F.; Kennedy, J.F. Frazil Ice Formation; U.S. Army Cold Regions Research and Engineering Laboratory: Hanover, NH, USA, 1984. [Google Scholar]
  18. Ettema, R.; Karim, M.; Kennedy, J. Laboratory experiments on frazil ice growth in supercooled water. Cold Reg. Sci. Technol. 1984, 10, 43–58. [Google Scholar] [CrossRef]
  19. Clark, S.; Doering, J. Experimental investigation of the effects of turbulence intensity on frazil ice characteristics. Can. J. Civ. Eng. 2008, 35, 67–79. [Google Scholar] [CrossRef]
  20. McFarlane, V.; Loewen, M.; Hicks, F. Measurements of the evolution of frazil ice particle size distributions. Cold Reg. Sci. Technol. 2015, 120, 45–55. [Google Scholar] [CrossRef]
  21. Wueben, J.L. The rise pattern and velocity of frazil ice. In Proceedings of the 3rd Workshop on the Hydraulics of Ice Covered Rivers, Fredericton, NB, Canada, 20–21 June 1984; pp. 297–316. [Google Scholar]
  22. Reimnitz, E.; Clayton, J.R.; Kempema, E.W.; Payne, J.R.; Weber, W.S. Interaction of rising frazil with suspended particles: Tank experiments with applications to nature. Cold Reg. Sci. Technol. 1993, 21, 117–135. [Google Scholar] [CrossRef]
  23. Osterkamp, T.E. Frazil-Ice nucleation by mass-exchange processes at the air-water interface. J. Glaciol. 1977, 19, 619–627. [Google Scholar] [CrossRef]
  24. Schaefer, V.J. The formation of frazil and anchor ice in cold water. Trans. Am. Geophys. Union 1950, 31, 885–893. [Google Scholar] [CrossRef]
  25. Osterkamp, T.; Gosink, J. Frazil ice formation and ice cover development in interior Alaska streams. Cold Reg. Sci. Technol. 1983, 8, 43–56. [Google Scholar] [CrossRef]
  26. Dubé, M.; Turcotte, B.; Morse, B. Inner structure of anchor ice and ice dams in steep channels. Cold Reg. Sci. Technol. 2014, 106–107, 194–206. [Google Scholar] [CrossRef]
  27. Kempema, E.W.; Ettema, R. Fish, ice, and wedge-wire screen water intakes. J. Cold Reg. Eng. 2016, 30, 04015004. [Google Scholar] [CrossRef]
  28. McFarlane, V.; Loewen, M.; Hicks, F. Measurements of the size distribution of frazil ice particles in three Alberta rivers. Cold Reg. Sci. Technol. 2017, 142, 100–117. [Google Scholar] [CrossRef]
  29. Richard, M.; Morse, B.; Daly, S.F.; Emond, J. Quantifying suspended frazil ice using multi-frequency underwater acoustic devices. River Res. Appl. 2010, 27, 1106–1117. [Google Scholar] [CrossRef]
  30. Ghobrial, T.R.; Loewen, M.R.; Hicks, F.E. Characterizing suspended frazil ice in rivers using upward looking sonars. Cold Reg. Sci. Technol. 2013, 86, 113–126. [Google Scholar] [CrossRef]
  31. Marko, J.; Jasek, M.; Topham, D.R. Multifrequency analyses of 2011–2012 Peace River SWIPS frazil backscattering data. Cold Reg. Sci. Technol. 2015, 110, 102–119. [Google Scholar] [CrossRef]
  32. Omstedt, A.; Svensson, U. Modeling supercooling and ice formation in a turbulent Ekman layer. J. Geophys. Res. Space Phys. 1984, 89, 735–744. [Google Scholar] [CrossRef]
  33. Omstedt, A. On supercooling and ice formation in turbulent sea water. J. Glaciol. 1985, 31, 263–271. [Google Scholar] [CrossRef] [Green Version]
  34. Omstedt, A. Modelling frazil ice and grease ice formation in the upper layers of the ocean. Cold Reg. Sci. Technol. 1985, 11, 87–98. [Google Scholar] [CrossRef]
  35. Hammar, L.; Shen, H.T. Frazil evolution in channels. J. Hydraul. Res. 1995, 33, 291–306. [Google Scholar] [CrossRef]
  36. Makkonen, L.; Tikanmäki, M. Modelling frazil and anchor ice on submerged objects. Cold Reg. Sci. Technol. 2018, 151, 64–74. [Google Scholar] [CrossRef]
  37. Morse, B.; Richard, M. A field study of suspended frazil ice particles. Cold Reg. Sci. Technol. 2009, 55, 86–102. [Google Scholar] [CrossRef]
  38. Daly, S.F.; Colbeck, S.C. Frazil ice measurements in CRREL’s flume facility. In Proceedings of the IAHR Ice Symposium 1986, International Association for Hydraulic Research, Iowa City, IA, USA, 18–22 August 1986; pp. 427–438. [Google Scholar]
  39. Huang, W. Study on Lake Ice Microstructure and Its Effects on Thermal and Mechanical Parameters. Ph.D. Thesis, University of Dalian Technology, Dalian, China, 2013. [Google Scholar]
  40. Huang, W.; Li, Z.; Liu, X.; Zhao, H.; Guo, S.; Jia, Q. Effective thermal conductivity of reservoir freshwater ice with attention to high temperature. Ann. Glaciol. 2013, 54, 189–195. [Google Scholar] [CrossRef] [Green Version]
  41. Timco, G.; Weeks, W. A review of the engineering properties of sea ice. Cold Reg. Sci. Technol. 2010, 60, 107–129. [Google Scholar] [CrossRef]
  42. Li, Z.; Zhang, L.; Lu, P.; Leppäranta, M.; Li, G. Experimental study on the effect of porosity on the uniaxial compressive strength of sea ice in Bohai Sea. Sci. China Ser. E Technol. Sci. 2011, 54, 2429–2436. [Google Scholar] [CrossRef]
  43. Shi, L.; Li, Z.; Niu, F.; Huang, W.; Lu, P.; Feng, E.; Han, H. Thermal diffusivity of thermokarst lake ice in the Beiluhe basin of the Qinghai–Tibetan Plateau. Ann. Glaciol. 2014, 55, 153–158. [Google Scholar] [CrossRef] [Green Version]
  44. Deng, Y.; Li, Z.; Wang, J.; Xu, L. The microstructure of yellow river ice in the freezing period. Crystals 2019, 9, 484. [Google Scholar] [CrossRef] [Green Version]
  45. Zhang, Y.; Gao, G.; Deng, Y.; Li, Z.; Guo, W. Investigation on ice crystal, density and sediment content in ice at different positions in Bayannaoer Section of the Yellow River. Yellow River 2018, 40, 44–48. [Google Scholar]
  46. Li, Z.; Wang, Z.; Wang, Q.; Xie, F.; Lu, P. Laboratory study on parameterization of ice floe melt rate at ice-air and ice-water interfaces. Acta Oceanol. Sin 2021. accepted. [Google Scholar]
  47. Song, S. Optics and Thermal Characteristics of Wuliangsuhai During the Frozen Period and the Primary Productivity in the Water Under Ice. Ph.D. Thesis, Inner Mongolia Agricultural University, Hohhot, China, 2019. [Google Scholar]
  48. Morris, M.P. A Digital Image Processing System for The Characterization of Frazil Ice. Ph.D. Thesis, University of Manitoba, Winnipeg, MB, Canada, 2003. [Google Scholar]
  49. McFarlane, V.; Loewen, M.; Hicks, F. Laboratory measurements of the rise velocity of frazil ice particles. Cold Reg. Sci. Technol. 2014, 106–107, 120–130. [Google Scholar] [CrossRef]
  50. Zhang, Y. Study on the Internal Structure and Surface Fracture Characteristics of River Ice. Master’s Thesis, University of Shenyang Agricultural, Shenyang, China, 2019. [Google Scholar]
  51. Langway, C.C. Ice fabrics and the universal stage. In Technical Report 62; Department of Defense, Department of the Army, Corps of Engineers, Snow Ice and Permafrost Research Establishment: Wilmette, IL, USA, 1959. [Google Scholar]
  52. Timco, G.W.; Frederking, R.M.W. A review of sea ice density. Cold Reg. Sci. Technol. 1996, 24, 1–6. [Google Scholar] [CrossRef]
  53. Turner, W.R. Microbubble persistence in fresh water. J. Acoust. Soc. Am. 1961, 33, 1223–1233. [Google Scholar] [CrossRef]
  54. Caupin, F.; Herbet, E. Cavitation in water: A review. C. R. Phys. 2006, 7, 1000–1017. [Google Scholar] [CrossRef]
  55. Chow, R.; Mettin, R.; Lindinger, B.; Kurz, T.; Lauterborn, W. The importance of acoustic cavitation in the sonocrystallisation of ice-high speed observations of a single acoustic bubble. IEEE Symp. Ultrason. 2004. [Google Scholar] [CrossRef]
  56. Kempema, E.; Reimnitz, E.; Hunter, R. Flume Studies and Field Observations of the Interaction of Frazil Ice and Anchor Ice with Sediments; U.S. Geological Survey: Reston, VA, USA, 1986. [CrossRef]
  57. Michel, B.; Ramseier, R.O. Classification of river and lake ice. Can. Geotech. J. 1971, 8, 36–45. [Google Scholar] [CrossRef]
  58. Müller-Stoffels, M.; Langhorne, P.J.; Petrich, C.; Kempema, E.W. Preferred crystal orientation in fresh water ice. Cold Reg. Sci. Technol. 2009, 56, 1–9. [Google Scholar] [CrossRef]
  59. Zhang, Y.; Li, Z.; Li, C.; Zhang, B.; Deng, Y. Microstructure characteristics of river ice in Inner Mongolia section of The Yellow River. J. Hydraul. Eng. 2021. accepted. [Google Scholar]
  60. Carte, E.A. Air bubbles in ice. Proc. Phys. Soc. 1961, 77, 757–768. [Google Scholar] [CrossRef]
  61. Light, B.; Maykut, G.A.; Grenfell, T.C. Effects of temperature on the microstructure of first-year Arctic sea ice. J. Geophys. Res. Space Phys. 2003, 108, 3051–3066. [Google Scholar] [CrossRef] [Green Version]
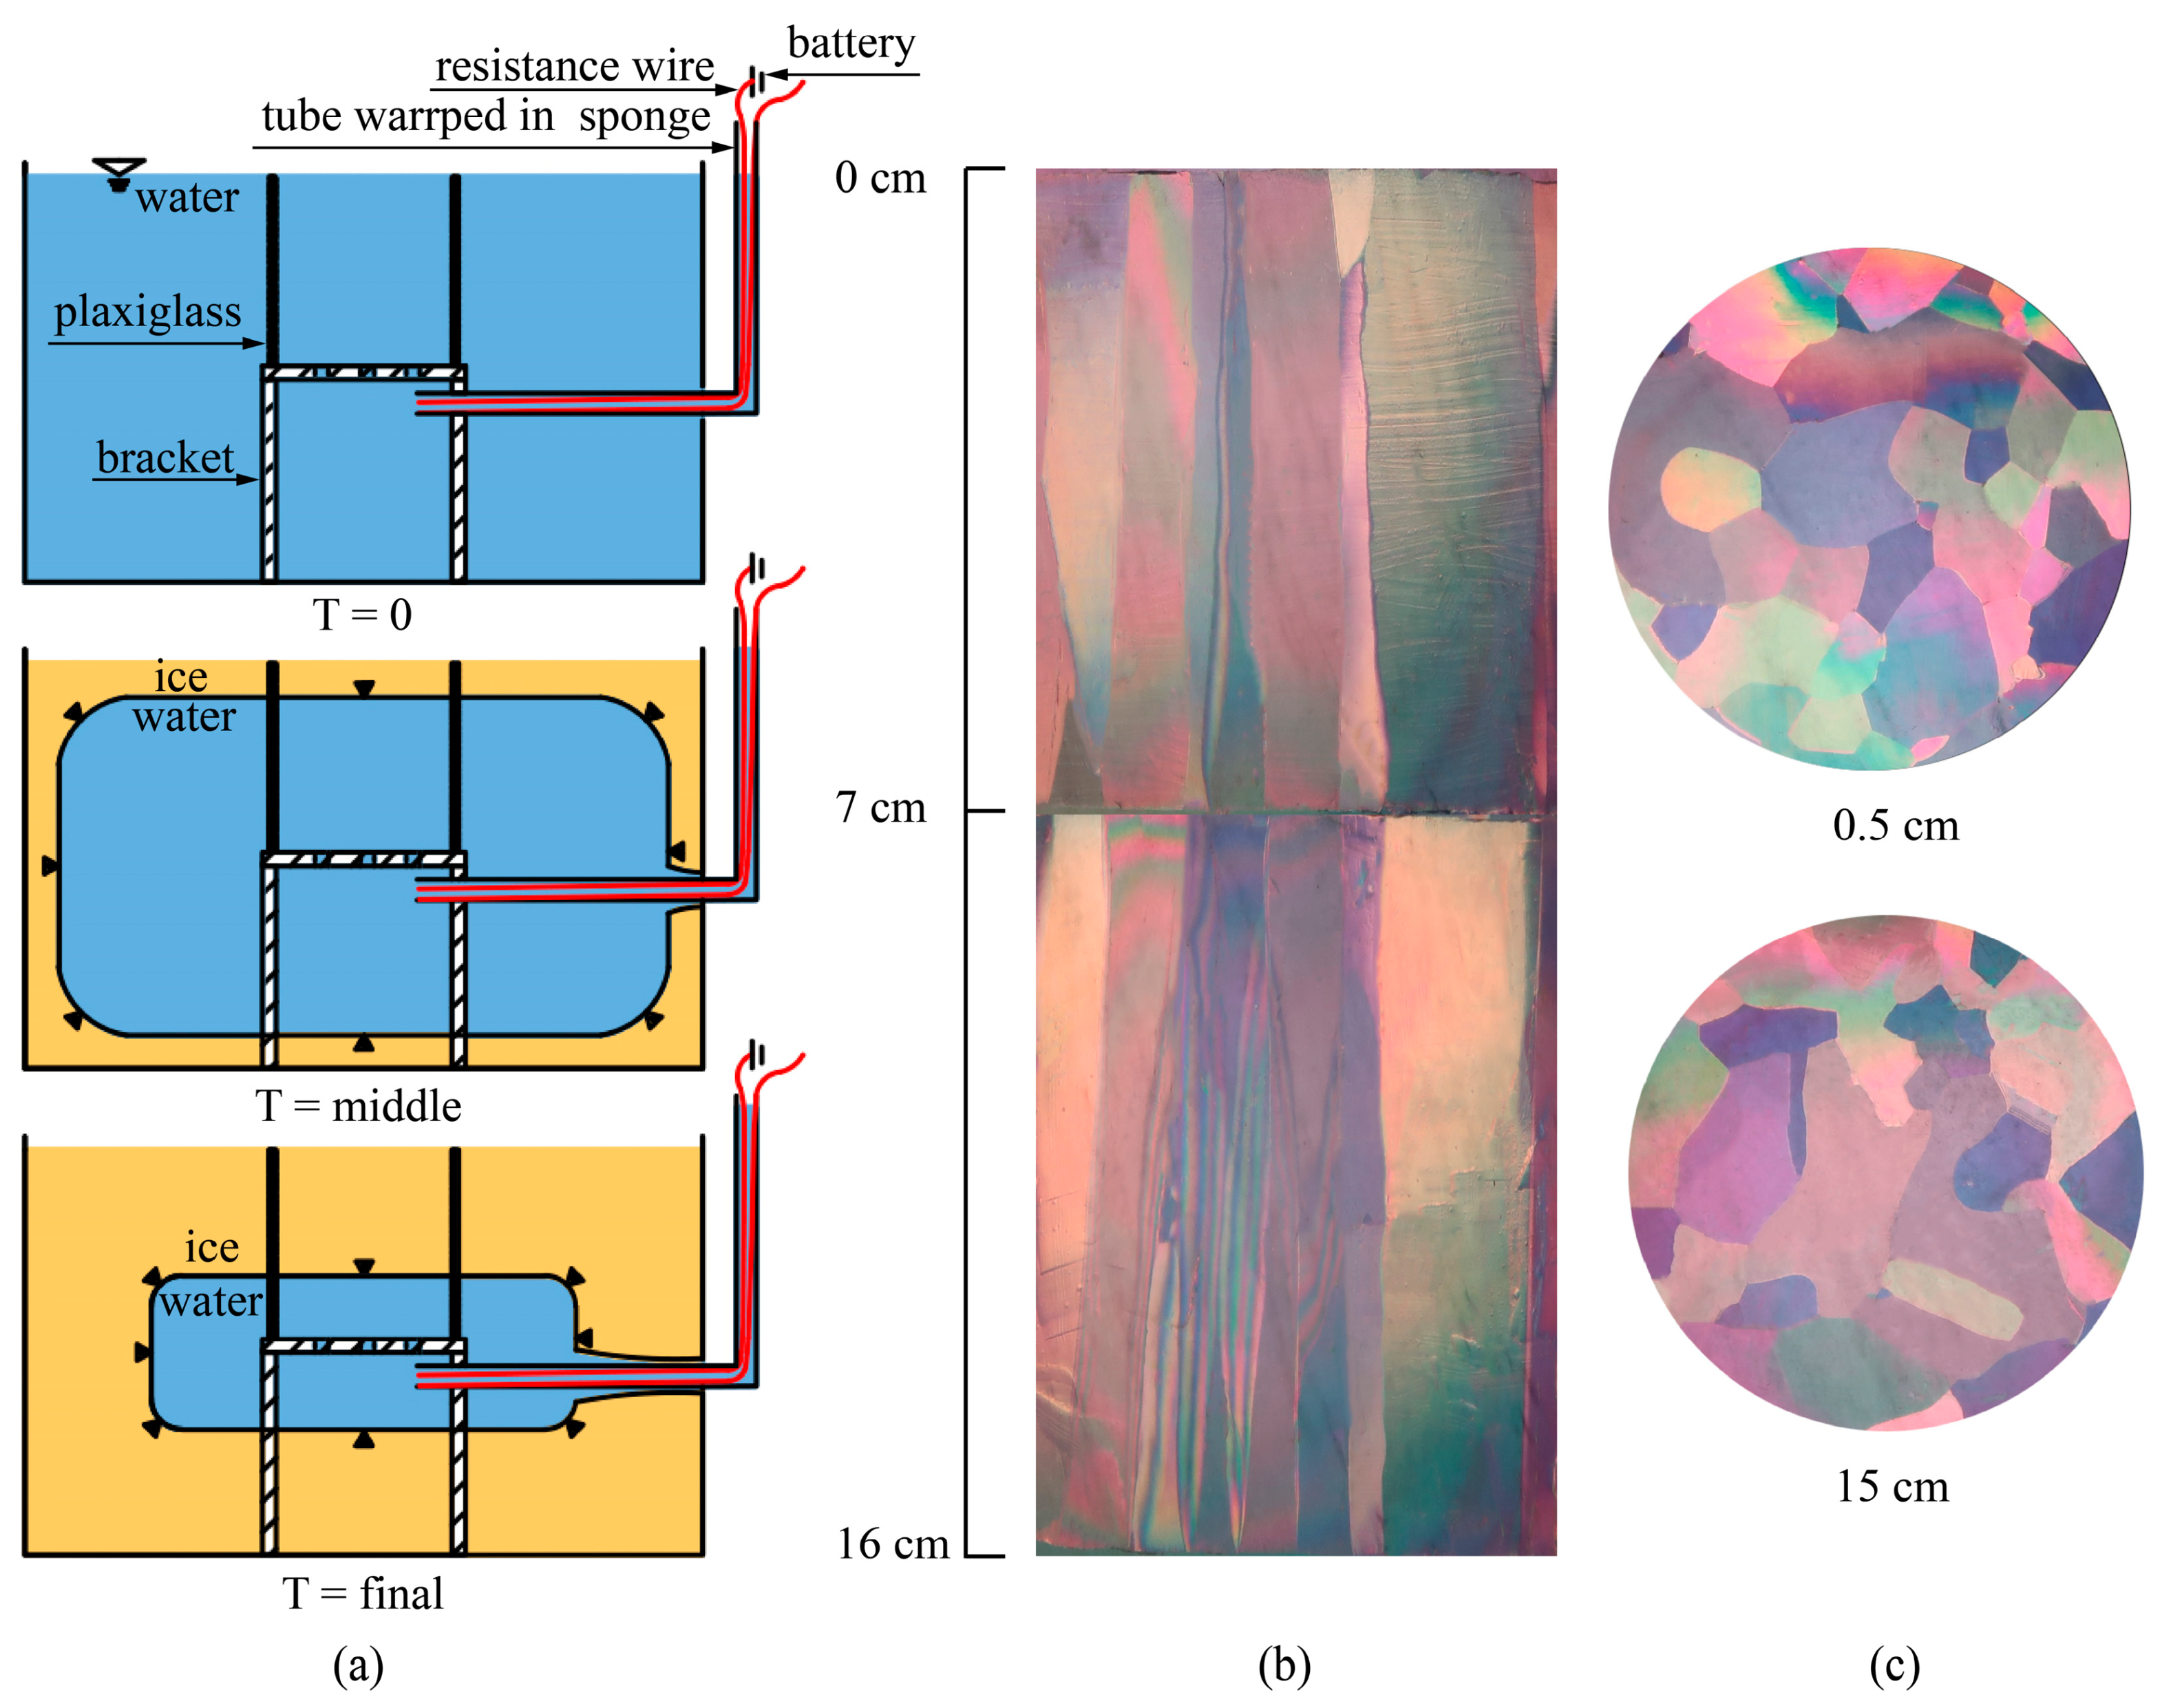
Figure 1. Experiment of unidirectional freezing in a low-temperature indoor laboratory: (a) the unidirectional freezing device; (b) ice crystal microstructure parallel to the direction of ice growth; (c) ice crystal microstructure perpendicular to the direction of ice growth at 0.5 and 15cm.
Crystals 11 00617 g001
Figure 2. Process of frazil particle collection in the field: (a) drilling the hole in the ice; (b) fixing the wooden brackets and collecting the Yellow River water; (c) placement of the frazil particle sampler; (d) plexiglass tube insertion; (e) adjusting the ice sampler; (f) retrieval of the frazil particles.
Crystals 11 00617 g002
Figure 3. Process of frazil particles observation: (a) frazil particles on the black acrylic plate; (b) separated frazil particles; (c) the setup to observe the frazil particles under the microscope.
Crystals 11 00617 g003
Figure 4. Observation of frazil ice crystal microstructure: (a) the original ice block; (b) universal stage for ice slice observation.
Crystals 11 00617 g004
Figure 5. Nucleation of frazil particles: (a) ice particles; (b) other cold particles.
Crystals 11 00617 g005
Figure 6. Individual frazil particles: (ad) granular frazil particles; (e) dendritic frazil particles; (f) needle-like frazil particles; (g,h) serrated frazil particles.
Crystals 11 00617 g006
Figure 7. Distribution of the characteristic parameters of granular frazil particles: (a) diameter distribution; (b) roundness distribution.
Crystals 11 00617 g007
Figure 8. Two frazil particles agglomerated together.
Crystals 11 00617 g008
Figure 9. Three frazil particles agglomerated together.
Crystals 11 00617 g009
Figure 10. Multiple frazil particles agglomerated together.
Crystals 11 00617 g010
Figure 11. Ice crystal microstructure and the air bubbles in ice at depth of 0–54 cm: (a) ice crystal microstructure (left) and air bubbles (right) in the ice perpendicular to the ice surface; (b) ice crystal microstructure (top) and air bubbles (bottom) in the ice parallel to the ice surface.
Crystals 11 00617 g011
Figure 12. Variation in crystal grain size and bubble content with depth: (a) ice crystal grain size; (b) bubble content.
Crystals 11 00617 g012
Figure 13. Variation in ice density and sediment content with depth: (a) ice density; (b) sediment content.
Crystals 11 00617 g013
Table 1. Microstructural classification of the frazil particles.
Shape# of ImagesPercentage (%)Diameter (mm)Slenderness RatioRoundness
Granular29877.83.2 ± 2.10.6 ± 0.10.6 ± 0.1
Serrated4311.215.6 ± 4.30.3 ± 0.10.3 ± 0.1
Needle-like359.28.3 ± 2.60.2 ± 0.10.2 ± 0.1
Dendritic71.814.1 ± 3.20.3 ± 0.10.2 ± 0.1
Publisher’s Note: MDPI stays neutral with regard to jurisdictional claims in published maps and institutional affiliations.